Celtic vs Vietnamese Ambulatory Disability
COMPARE
Celtic
Vietnamese
Ambulatory Disability
Ambulatory Disability Comparison
Celtics
Vietnamese
6.7%
AMBULATORY DISABILITY
0.1/ 100
METRIC RATING
276th/ 347
METRIC RANK
6.1%
AMBULATORY DISABILITY
47.2/ 100
METRIC RATING
175th/ 347
METRIC RANK
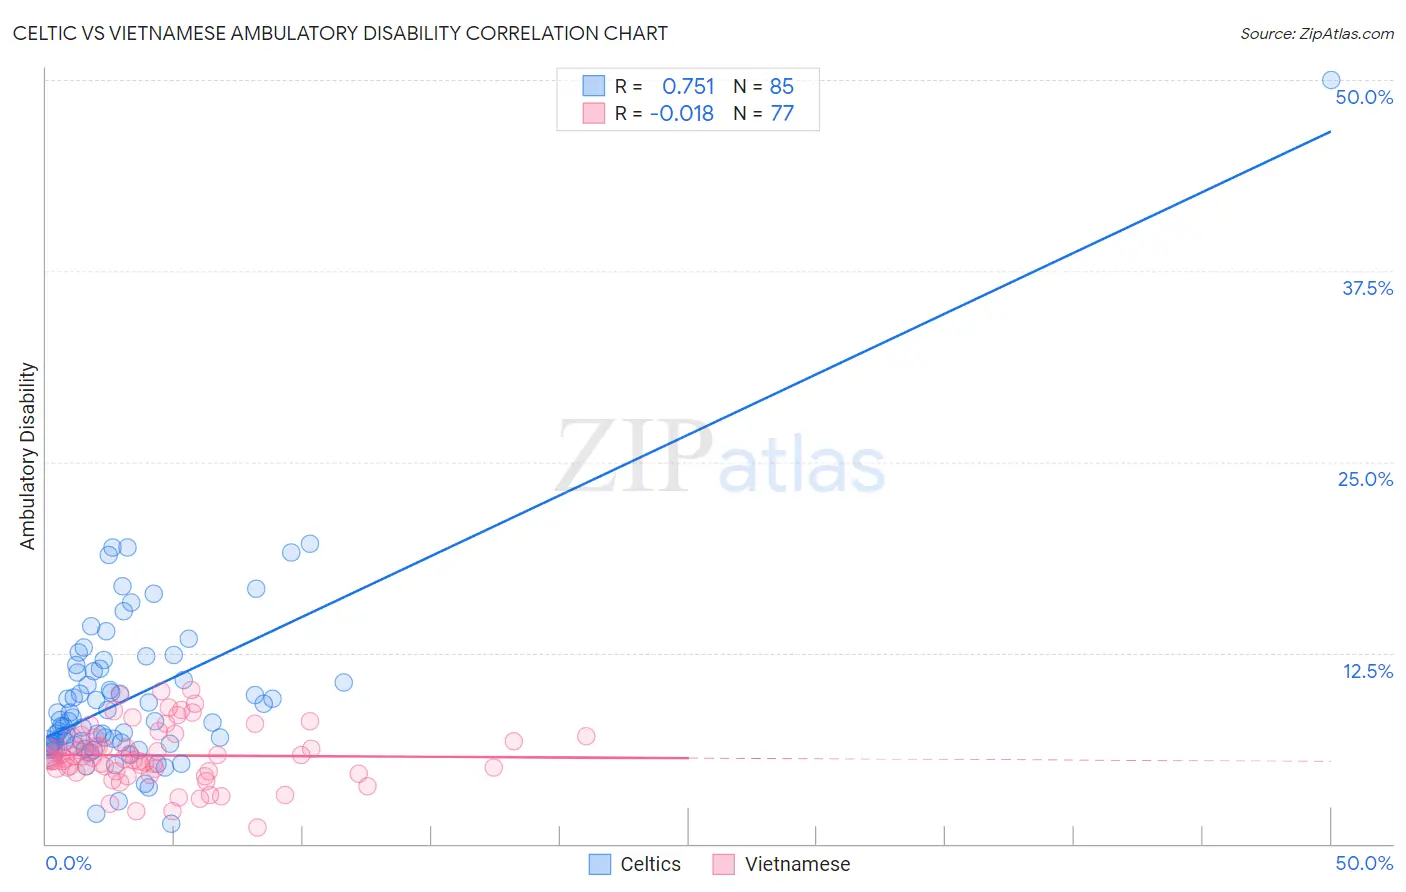
Celtic vs Vietnamese Ambulatory Disability Correlation Chart
The statistical analysis conducted on geographies consisting of 168,862,473 people shows a strong positive correlation between the proportion of Celtics and percentage of population with ambulatory disability in the United States with a correlation coefficient (R) of 0.751 and weighted average of 6.7%. Similarly, the statistical analysis conducted on geographies consisting of 170,721,676 people shows no correlation between the proportion of Vietnamese and percentage of population with ambulatory disability in the United States with a correlation coefficient (R) of -0.018 and weighted average of 6.1%, a difference of 9.6%.
Ambulatory Disability Correlation Summary
| Measurement | Celtic | Vietnamese |
| Minimum | 1.3% | 1.1% |
| Maximum | 50.0% | 10.1% |
| Range | 48.7% | 9.0% |
| Mean | 9.7% | 5.8% |
| Median | 8.0% | 5.6% |
| Interquartile 25% (IQ1) | 6.5% | 4.7% |
| Interquartile 75% (IQ3) | 11.4% | 6.9% |
| Interquartile Range (IQR) | 4.8% | 2.2% |
| Standard Deviation (Sample) | 6.0% | 1.9% |
| Standard Deviation (Population) | 6.0% | 1.9% |
Similar Demographics by Ambulatory Disability
Demographics Similar to Celtics by Ambulatory Disability
In terms of ambulatory disability, the demographic groups most similar to Celtics are Immigrants from Guyana (6.7%, a difference of 0.030%), Jamaican (6.7%, a difference of 0.080%), Sioux (6.7%, a difference of 0.090%), Immigrants from West Indies (6.7%, a difference of 0.15%), and White/Caucasian (6.7%, a difference of 0.34%).
| Demographics | Rating | Rank | Ambulatory Disability |
| French | 0.1 /100 | #269 | Tragic 6.6% |
| Slovaks | 0.1 /100 | #270 | Tragic 6.7% |
| Immigrants | Trinidad and Tobago | 0.1 /100 | #271 | Tragic 6.7% |
| French Canadians | 0.1 /100 | #272 | Tragic 6.7% |
| Whites/Caucasians | 0.1 /100 | #273 | Tragic 6.7% |
| Sioux | 0.1 /100 | #274 | Tragic 6.7% |
| Immigrants | Guyana | 0.1 /100 | #275 | Tragic 6.7% |
| Celtics | 0.1 /100 | #276 | Tragic 6.7% |
| Jamaicans | 0.1 /100 | #277 | Tragic 6.7% |
| Immigrants | West Indies | 0.1 /100 | #278 | Tragic 6.7% |
| Immigrants | Caribbean | 0.0 /100 | #279 | Tragic 6.7% |
| Pennsylvania Germans | 0.0 /100 | #280 | Tragic 6.8% |
| Yaqui | 0.0 /100 | #281 | Tragic 6.8% |
| Barbadians | 0.0 /100 | #282 | Tragic 6.8% |
| Immigrants | Barbados | 0.0 /100 | #283 | Tragic 6.8% |
Demographics Similar to Vietnamese by Ambulatory Disability
In terms of ambulatory disability, the demographic groups most similar to Vietnamese are Immigrants from North America (6.1%, a difference of 0.090%), Immigrants from England (6.1%, a difference of 0.10%), Scandinavian (6.1%, a difference of 0.14%), Immigrants from Canada (6.1%, a difference of 0.15%), and Austrian (6.1%, a difference of 0.17%).
| Demographics | Rating | Rank | Ambulatory Disability |
| Ecuadorians | 60.5 /100 | #168 | Good 6.1% |
| Immigrants | Southern Europe | 58.1 /100 | #169 | Average 6.1% |
| Immigrants | Ecuador | 53.8 /100 | #170 | Average 6.1% |
| Moroccans | 52.6 /100 | #171 | Average 6.1% |
| Immigrants | Burma/Myanmar | 52.2 /100 | #172 | Average 6.1% |
| Croatians | 51.2 /100 | #173 | Average 6.1% |
| Immigrants | Canada | 50.0 /100 | #174 | Average 6.1% |
| Vietnamese | 47.2 /100 | #175 | Average 6.1% |
| Immigrants | North America | 45.6 /100 | #176 | Average 6.1% |
| Immigrants | England | 45.4 /100 | #177 | Average 6.1% |
| Scandinavians | 44.5 /100 | #178 | Average 6.1% |
| Austrians | 44.1 /100 | #179 | Average 6.1% |
| Immigrants | Nicaragua | 43.9 /100 | #180 | Average 6.1% |
| Swiss | 43.1 /100 | #181 | Average 6.1% |
| Serbians | 42.8 /100 | #182 | Average 6.1% |