Celtic vs Paraguayan Ambulatory Disability
COMPARE
Celtic
Paraguayan
Ambulatory Disability
Ambulatory Disability Comparison
Celtics
Paraguayans
6.7%
AMBULATORY DISABILITY
0.1/ 100
METRIC RATING
276th/ 347
METRIC RANK
5.5%
AMBULATORY DISABILITY
99.9/ 100
METRIC RATING
43rd/ 347
METRIC RANK
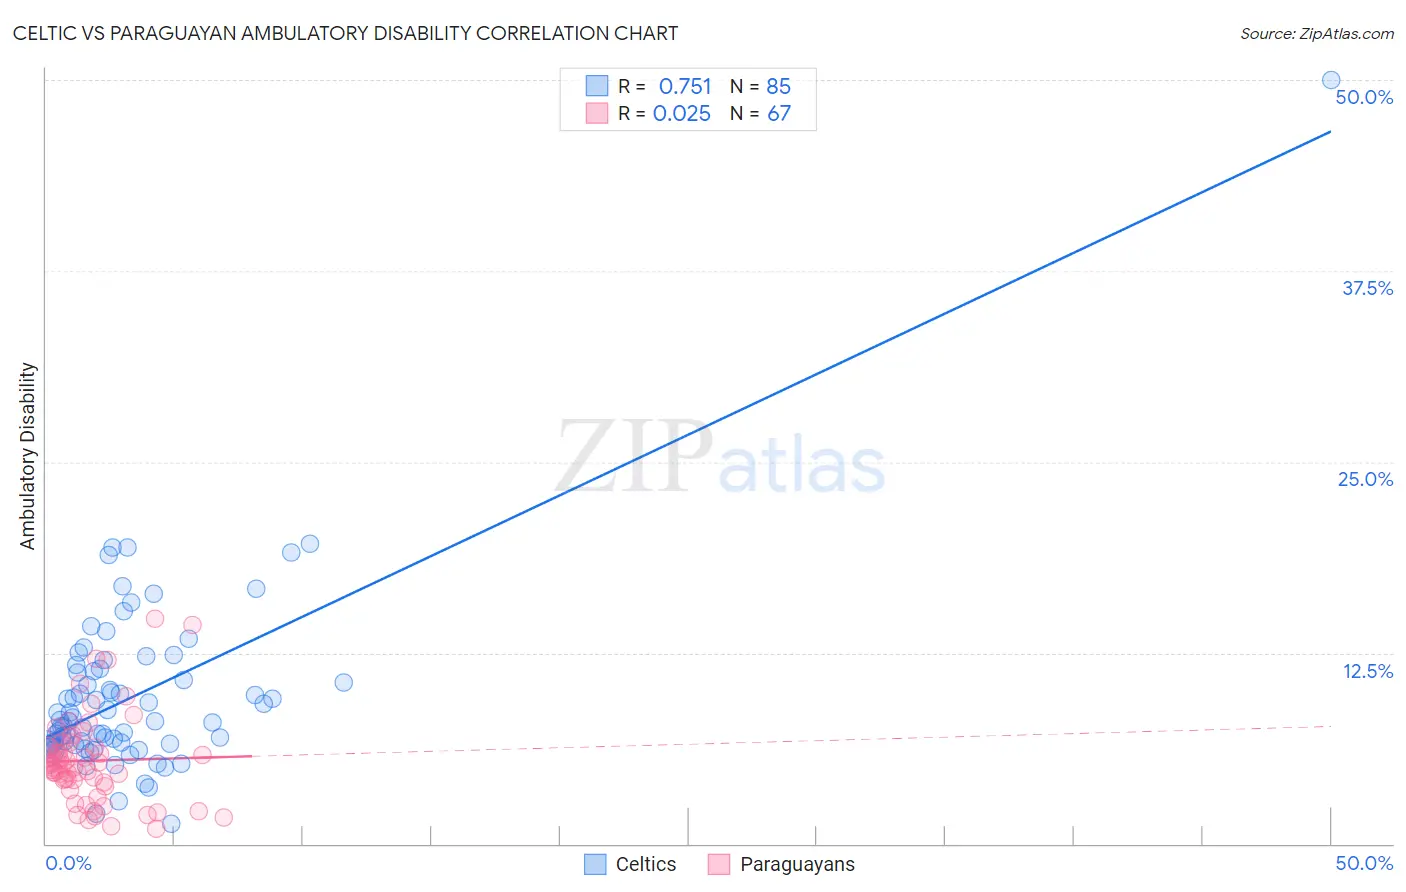
Celtic vs Paraguayan Ambulatory Disability Correlation Chart
The statistical analysis conducted on geographies consisting of 168,862,473 people shows a strong positive correlation between the proportion of Celtics and percentage of population with ambulatory disability in the United States with a correlation coefficient (R) of 0.751 and weighted average of 6.7%. Similarly, the statistical analysis conducted on geographies consisting of 95,109,897 people shows no correlation between the proportion of Paraguayans and percentage of population with ambulatory disability in the United States with a correlation coefficient (R) of 0.025 and weighted average of 5.5%, a difference of 21.2%.
Ambulatory Disability Correlation Summary
| Measurement | Celtic | Paraguayan |
| Minimum | 1.3% | 0.94% |
| Maximum | 50.0% | 14.7% |
| Range | 48.7% | 13.8% |
| Mean | 9.7% | 5.4% |
| Median | 8.0% | 5.2% |
| Interquartile 25% (IQ1) | 6.5% | 4.0% |
| Interquartile 75% (IQ3) | 11.4% | 6.3% |
| Interquartile Range (IQR) | 4.8% | 2.4% |
| Standard Deviation (Sample) | 6.0% | 2.9% |
| Standard Deviation (Population) | 6.0% | 2.8% |
Similar Demographics by Ambulatory Disability
Demographics Similar to Celtics by Ambulatory Disability
In terms of ambulatory disability, the demographic groups most similar to Celtics are Immigrants from Guyana (6.7%, a difference of 0.030%), Jamaican (6.7%, a difference of 0.080%), Sioux (6.7%, a difference of 0.090%), Immigrants from West Indies (6.7%, a difference of 0.15%), and White/Caucasian (6.7%, a difference of 0.34%).
| Demographics | Rating | Rank | Ambulatory Disability |
| French | 0.1 /100 | #269 | Tragic 6.6% |
| Slovaks | 0.1 /100 | #270 | Tragic 6.7% |
| Immigrants | Trinidad and Tobago | 0.1 /100 | #271 | Tragic 6.7% |
| French Canadians | 0.1 /100 | #272 | Tragic 6.7% |
| Whites/Caucasians | 0.1 /100 | #273 | Tragic 6.7% |
| Sioux | 0.1 /100 | #274 | Tragic 6.7% |
| Immigrants | Guyana | 0.1 /100 | #275 | Tragic 6.7% |
| Celtics | 0.1 /100 | #276 | Tragic 6.7% |
| Jamaicans | 0.1 /100 | #277 | Tragic 6.7% |
| Immigrants | West Indies | 0.1 /100 | #278 | Tragic 6.7% |
| Immigrants | Caribbean | 0.0 /100 | #279 | Tragic 6.7% |
| Pennsylvania Germans | 0.0 /100 | #280 | Tragic 6.8% |
| Yaqui | 0.0 /100 | #281 | Tragic 6.8% |
| Barbadians | 0.0 /100 | #282 | Tragic 6.8% |
| Immigrants | Barbados | 0.0 /100 | #283 | Tragic 6.8% |
Demographics Similar to Paraguayans by Ambulatory Disability
In terms of ambulatory disability, the demographic groups most similar to Paraguayans are Immigrants from Indonesia (5.5%, a difference of 0.12%), Immigrants from Sweden (5.6%, a difference of 0.28%), Egyptian (5.6%, a difference of 0.29%), Immigrants from Japan (5.6%, a difference of 0.30%), and Immigrants from Argentina (5.6%, a difference of 0.31%).
| Demographics | Rating | Rank | Ambulatory Disability |
| Immigrants | Malaysia | 100.0 /100 | #36 | Exceptional 5.5% |
| Turks | 100.0 /100 | #37 | Exceptional 5.5% |
| Cypriots | 100.0 /100 | #38 | Exceptional 5.5% |
| Immigrants | Eritrea | 100.0 /100 | #39 | Exceptional 5.5% |
| Venezuelans | 99.9 /100 | #40 | Exceptional 5.5% |
| Mongolians | 99.9 /100 | #41 | Exceptional 5.5% |
| Argentineans | 99.9 /100 | #42 | Exceptional 5.5% |
| Paraguayans | 99.9 /100 | #43 | Exceptional 5.5% |
| Immigrants | Indonesia | 99.9 /100 | #44 | Exceptional 5.5% |
| Immigrants | Sweden | 99.9 /100 | #45 | Exceptional 5.6% |
| Egyptians | 99.9 /100 | #46 | Exceptional 5.6% |
| Immigrants | Japan | 99.9 /100 | #47 | Exceptional 5.6% |
| Immigrants | Argentina | 99.9 /100 | #48 | Exceptional 5.6% |
| Bulgarians | 99.9 /100 | #49 | Exceptional 5.6% |
| Luxembourgers | 99.9 /100 | #50 | Exceptional 5.6% |