Celtic vs Immigrants from Hungary Ambulatory Disability
COMPARE
Celtic
Immigrants from Hungary
Ambulatory Disability
Ambulatory Disability Comparison
Celtics
Immigrants from Hungary
6.7%
AMBULATORY DISABILITY
0.1/ 100
METRIC RATING
276th/ 347
METRIC RANK
6.0%
AMBULATORY DISABILITY
83.9/ 100
METRIC RATING
138th/ 347
METRIC RANK
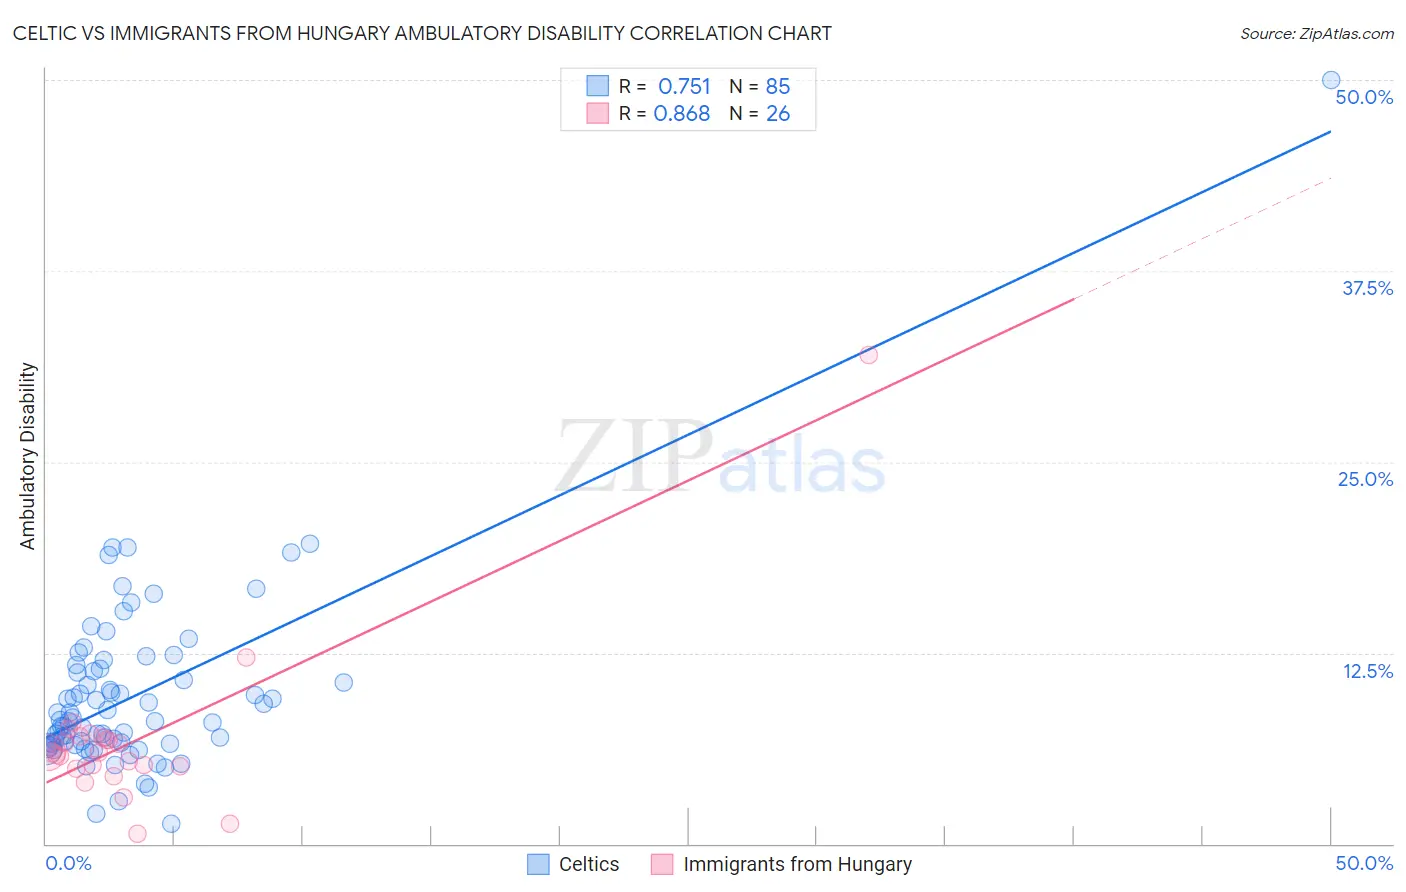
Celtic vs Immigrants from Hungary Ambulatory Disability Correlation Chart
The statistical analysis conducted on geographies consisting of 168,862,473 people shows a strong positive correlation between the proportion of Celtics and percentage of population with ambulatory disability in the United States with a correlation coefficient (R) of 0.751 and weighted average of 6.7%. Similarly, the statistical analysis conducted on geographies consisting of 195,671,605 people shows a very strong positive correlation between the proportion of Immigrants from Hungary and percentage of population with ambulatory disability in the United States with a correlation coefficient (R) of 0.868 and weighted average of 6.0%, a difference of 12.2%.
Ambulatory Disability Correlation Summary
| Measurement | Celtic | Immigrants from Hungary |
| Minimum | 1.3% | 0.66% |
| Maximum | 50.0% | 32.0% |
| Range | 48.7% | 31.3% |
| Mean | 9.7% | 6.8% |
| Median | 8.0% | 6.0% |
| Interquartile 25% (IQ1) | 6.5% | 5.1% |
| Interquartile 75% (IQ3) | 11.4% | 7.0% |
| Interquartile Range (IQR) | 4.8% | 1.9% |
| Standard Deviation (Sample) | 6.0% | 5.6% |
| Standard Deviation (Population) | 6.0% | 5.5% |
Similar Demographics by Ambulatory Disability
Demographics Similar to Celtics by Ambulatory Disability
In terms of ambulatory disability, the demographic groups most similar to Celtics are Immigrants from Guyana (6.7%, a difference of 0.030%), Jamaican (6.7%, a difference of 0.080%), Sioux (6.7%, a difference of 0.090%), Immigrants from West Indies (6.7%, a difference of 0.15%), and White/Caucasian (6.7%, a difference of 0.34%).
| Demographics | Rating | Rank | Ambulatory Disability |
| French | 0.1 /100 | #269 | Tragic 6.6% |
| Slovaks | 0.1 /100 | #270 | Tragic 6.7% |
| Immigrants | Trinidad and Tobago | 0.1 /100 | #271 | Tragic 6.7% |
| French Canadians | 0.1 /100 | #272 | Tragic 6.7% |
| Whites/Caucasians | 0.1 /100 | #273 | Tragic 6.7% |
| Sioux | 0.1 /100 | #274 | Tragic 6.7% |
| Immigrants | Guyana | 0.1 /100 | #275 | Tragic 6.7% |
| Celtics | 0.1 /100 | #276 | Tragic 6.7% |
| Jamaicans | 0.1 /100 | #277 | Tragic 6.7% |
| Immigrants | West Indies | 0.1 /100 | #278 | Tragic 6.7% |
| Immigrants | Caribbean | 0.0 /100 | #279 | Tragic 6.7% |
| Pennsylvania Germans | 0.0 /100 | #280 | Tragic 6.8% |
| Yaqui | 0.0 /100 | #281 | Tragic 6.8% |
| Barbadians | 0.0 /100 | #282 | Tragic 6.8% |
| Immigrants | Barbados | 0.0 /100 | #283 | Tragic 6.8% |
Demographics Similar to Immigrants from Hungary by Ambulatory Disability
In terms of ambulatory disability, the demographic groups most similar to Immigrants from Hungary are Immigrants from North Macedonia (6.0%, a difference of 0.020%), Immigrants from Syria (6.0%, a difference of 0.020%), Immigrants from Zaire (6.0%, a difference of 0.030%), Czech (6.0%, a difference of 0.060%), and Swedish (6.0%, a difference of 0.080%).
| Demographics | Rating | Rank | Ambulatory Disability |
| Immigrants | Costa Rica | 89.5 /100 | #131 | Excellent 5.9% |
| Immigrants | Europe | 87.8 /100 | #132 | Excellent 6.0% |
| Immigrants | Immigrants | 86.9 /100 | #133 | Excellent 6.0% |
| Ute | 86.6 /100 | #134 | Excellent 6.0% |
| Immigrants | Italy | 85.0 /100 | #135 | Excellent 6.0% |
| Immigrants | North Macedonia | 84.1 /100 | #136 | Excellent 6.0% |
| Immigrants | Syria | 84.1 /100 | #137 | Excellent 6.0% |
| Immigrants | Hungary | 83.9 /100 | #138 | Excellent 6.0% |
| Immigrants | Zaire | 83.6 /100 | #139 | Excellent 6.0% |
| Czechs | 83.3 /100 | #140 | Excellent 6.0% |
| Swedes | 83.1 /100 | #141 | Excellent 6.0% |
| Immigrants | Philippines | 83.0 /100 | #142 | Excellent 6.0% |
| Romanians | 82.9 /100 | #143 | Excellent 6.0% |
| Macedonians | 82.8 /100 | #144 | Excellent 6.0% |
| Pakistanis | 82.5 /100 | #145 | Excellent 6.0% |