Celtic vs Dominican Ambulatory Disability
COMPARE
Celtic
Dominican
Ambulatory Disability
Ambulatory Disability Comparison
Celtics
Dominicans
6.7%
AMBULATORY DISABILITY
0.1/ 100
METRIC RATING
276th/ 347
METRIC RANK
7.2%
AMBULATORY DISABILITY
0.0/ 100
METRIC RATING
319th/ 347
METRIC RANK
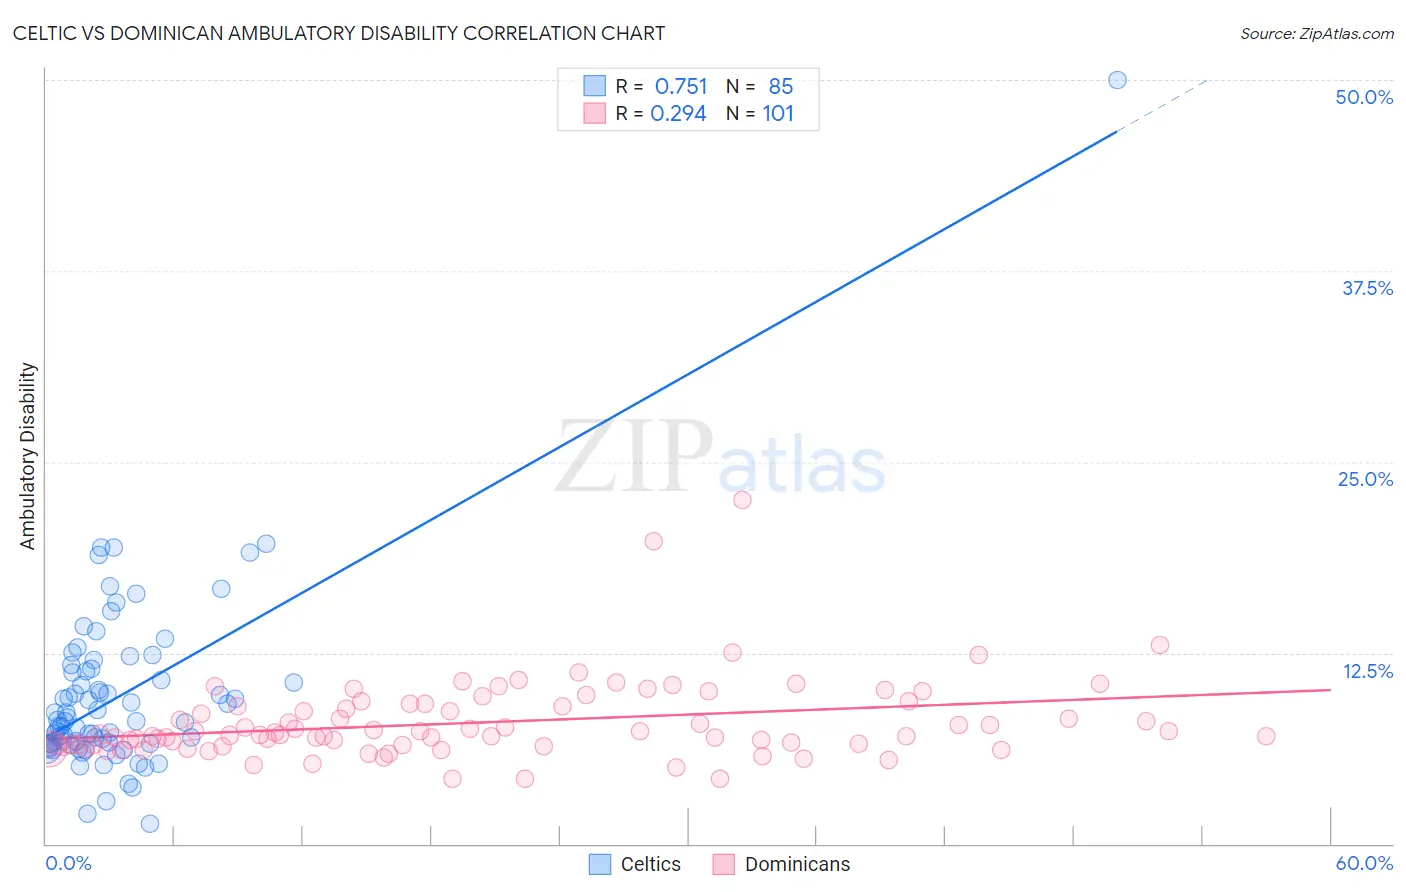
Celtic vs Dominican Ambulatory Disability Correlation Chart
The statistical analysis conducted on geographies consisting of 168,862,473 people shows a strong positive correlation between the proportion of Celtics and percentage of population with ambulatory disability in the United States with a correlation coefficient (R) of 0.751 and weighted average of 6.7%. Similarly, the statistical analysis conducted on geographies consisting of 354,945,896 people shows a weak positive correlation between the proportion of Dominicans and percentage of population with ambulatory disability in the United States with a correlation coefficient (R) of 0.294 and weighted average of 7.2%, a difference of 7.0%.
Ambulatory Disability Correlation Summary
| Measurement | Celtic | Dominican |
| Minimum | 1.3% | 4.2% |
| Maximum | 50.0% | 22.5% |
| Range | 48.7% | 18.3% |
| Mean | 9.7% | 7.9% |
| Median | 8.0% | 7.1% |
| Interquartile 25% (IQ1) | 6.5% | 6.5% |
| Interquartile 75% (IQ3) | 11.4% | 9.1% |
| Interquartile Range (IQR) | 4.8% | 2.6% |
| Standard Deviation (Sample) | 6.0% | 2.6% |
| Standard Deviation (Population) | 6.0% | 2.6% |
Similar Demographics by Ambulatory Disability
Demographics Similar to Celtics by Ambulatory Disability
In terms of ambulatory disability, the demographic groups most similar to Celtics are Immigrants from Guyana (6.7%, a difference of 0.030%), Jamaican (6.7%, a difference of 0.080%), Sioux (6.7%, a difference of 0.090%), Immigrants from West Indies (6.7%, a difference of 0.15%), and White/Caucasian (6.7%, a difference of 0.34%).
| Demographics | Rating | Rank | Ambulatory Disability |
| French | 0.1 /100 | #269 | Tragic 6.6% |
| Slovaks | 0.1 /100 | #270 | Tragic 6.7% |
| Immigrants | Trinidad and Tobago | 0.1 /100 | #271 | Tragic 6.7% |
| French Canadians | 0.1 /100 | #272 | Tragic 6.7% |
| Whites/Caucasians | 0.1 /100 | #273 | Tragic 6.7% |
| Sioux | 0.1 /100 | #274 | Tragic 6.7% |
| Immigrants | Guyana | 0.1 /100 | #275 | Tragic 6.7% |
| Celtics | 0.1 /100 | #276 | Tragic 6.7% |
| Jamaicans | 0.1 /100 | #277 | Tragic 6.7% |
| Immigrants | West Indies | 0.1 /100 | #278 | Tragic 6.7% |
| Immigrants | Caribbean | 0.0 /100 | #279 | Tragic 6.7% |
| Pennsylvania Germans | 0.0 /100 | #280 | Tragic 6.8% |
| Yaqui | 0.0 /100 | #281 | Tragic 6.8% |
| Barbadians | 0.0 /100 | #282 | Tragic 6.8% |
| Immigrants | Barbados | 0.0 /100 | #283 | Tragic 6.8% |
Demographics Similar to Dominicans by Ambulatory Disability
In terms of ambulatory disability, the demographic groups most similar to Dominicans are Ottawa (7.2%, a difference of 0.33%), Central American Indian (7.2%, a difference of 0.42%), Immigrants from Dominican Republic (7.1%, a difference of 0.50%), Shoshone (7.1%, a difference of 0.74%), and Blackfeet (7.1%, a difference of 0.76%).
| Demographics | Rating | Rank | Ambulatory Disability |
| Delaware | 0.0 /100 | #312 | Tragic 7.1% |
| Immigrants | Yemen | 0.0 /100 | #313 | Tragic 7.1% |
| Blackfeet | 0.0 /100 | #314 | Tragic 7.1% |
| Shoshone | 0.0 /100 | #315 | Tragic 7.1% |
| Immigrants | Dominican Republic | 0.0 /100 | #316 | Tragic 7.1% |
| Central American Indians | 0.0 /100 | #317 | Tragic 7.2% |
| Ottawa | 0.0 /100 | #318 | Tragic 7.2% |
| Dominicans | 0.0 /100 | #319 | Tragic 7.2% |
| Potawatomi | 0.0 /100 | #320 | Tragic 7.3% |
| Apache | 0.0 /100 | #321 | Tragic 7.4% |
| Osage | 0.0 /100 | #322 | Tragic 7.4% |
| Americans | 0.0 /100 | #323 | Tragic 7.4% |
| Navajo | 0.0 /100 | #324 | Tragic 7.5% |
| Comanche | 0.0 /100 | #325 | Tragic 7.5% |
| Blacks/African Americans | 0.0 /100 | #326 | Tragic 7.5% |