Celtic vs Nicaraguan Ambulatory Disability
COMPARE
Celtic
Nicaraguan
Ambulatory Disability
Ambulatory Disability Comparison
Celtics
Nicaraguans
6.7%
AMBULATORY DISABILITY
0.1/ 100
METRIC RATING
276th/ 347
METRIC RANK
6.1%
AMBULATORY DISABILITY
63.2/ 100
METRIC RATING
165th/ 347
METRIC RANK
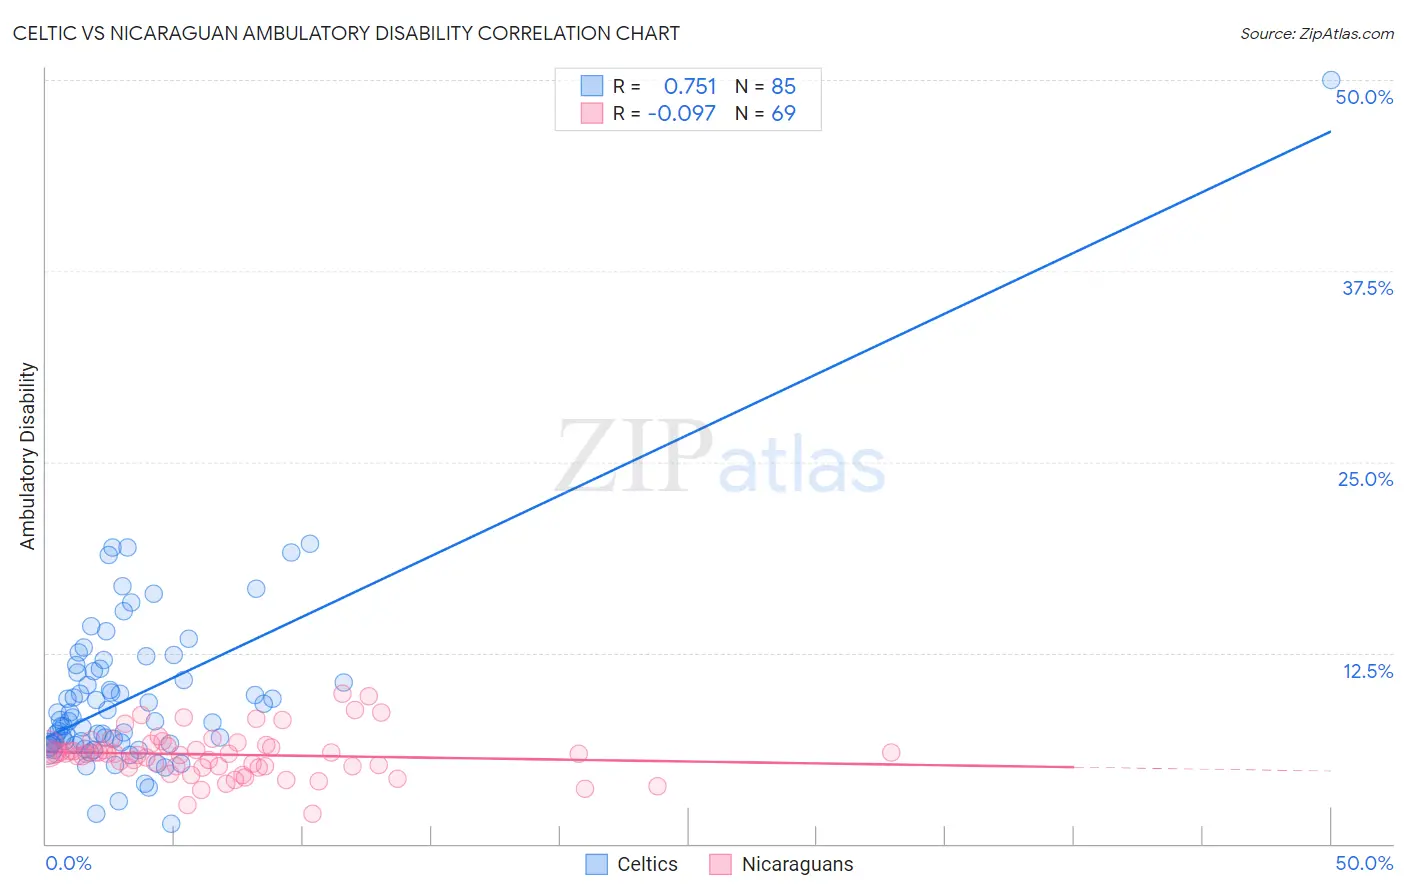
Celtic vs Nicaraguan Ambulatory Disability Correlation Chart
The statistical analysis conducted on geographies consisting of 168,862,473 people shows a strong positive correlation between the proportion of Celtics and percentage of population with ambulatory disability in the United States with a correlation coefficient (R) of 0.751 and weighted average of 6.7%. Similarly, the statistical analysis conducted on geographies consisting of 285,681,314 people shows a slight negative correlation between the proportion of Nicaraguans and percentage of population with ambulatory disability in the United States with a correlation coefficient (R) of -0.097 and weighted average of 6.1%, a difference of 10.5%.
Ambulatory Disability Correlation Summary
| Measurement | Celtic | Nicaraguan |
| Minimum | 1.3% | 2.0% |
| Maximum | 50.0% | 9.8% |
| Range | 48.7% | 7.8% |
| Mean | 9.7% | 5.8% |
| Median | 8.0% | 5.9% |
| Interquartile 25% (IQ1) | 6.5% | 5.0% |
| Interquartile 75% (IQ3) | 11.4% | 6.4% |
| Interquartile Range (IQR) | 4.8% | 1.4% |
| Standard Deviation (Sample) | 6.0% | 1.5% |
| Standard Deviation (Population) | 6.0% | 1.5% |
Similar Demographics by Ambulatory Disability
Demographics Similar to Celtics by Ambulatory Disability
In terms of ambulatory disability, the demographic groups most similar to Celtics are Immigrants from Guyana (6.7%, a difference of 0.030%), Jamaican (6.7%, a difference of 0.080%), Sioux (6.7%, a difference of 0.090%), Immigrants from West Indies (6.7%, a difference of 0.15%), and White/Caucasian (6.7%, a difference of 0.34%).
| Demographics | Rating | Rank | Ambulatory Disability |
| French | 0.1 /100 | #269 | Tragic 6.6% |
| Slovaks | 0.1 /100 | #270 | Tragic 6.7% |
| Immigrants | Trinidad and Tobago | 0.1 /100 | #271 | Tragic 6.7% |
| French Canadians | 0.1 /100 | #272 | Tragic 6.7% |
| Whites/Caucasians | 0.1 /100 | #273 | Tragic 6.7% |
| Sioux | 0.1 /100 | #274 | Tragic 6.7% |
| Immigrants | Guyana | 0.1 /100 | #275 | Tragic 6.7% |
| Celtics | 0.1 /100 | #276 | Tragic 6.7% |
| Jamaicans | 0.1 /100 | #277 | Tragic 6.7% |
| Immigrants | West Indies | 0.1 /100 | #278 | Tragic 6.7% |
| Immigrants | Caribbean | 0.0 /100 | #279 | Tragic 6.7% |
| Pennsylvania Germans | 0.0 /100 | #280 | Tragic 6.8% |
| Yaqui | 0.0 /100 | #281 | Tragic 6.8% |
| Barbadians | 0.0 /100 | #282 | Tragic 6.8% |
| Immigrants | Barbados | 0.0 /100 | #283 | Tragic 6.8% |
Demographics Similar to Nicaraguans by Ambulatory Disability
In terms of ambulatory disability, the demographic groups most similar to Nicaraguans are Iraqi (6.1%, a difference of 0.020%), Basque (6.1%, a difference of 0.030%), Immigrants from Oceania (6.1%, a difference of 0.14%), Ecuadorian (6.1%, a difference of 0.15%), and Lebanese (6.1%, a difference of 0.18%).
| Demographics | Rating | Rank | Ambulatory Disability |
| Immigrants | Fiji | 71.2 /100 | #158 | Good 6.0% |
| Immigrants | Latvia | 71.1 /100 | #159 | Good 6.0% |
| Central Americans | 69.8 /100 | #160 | Good 6.0% |
| Immigrants | Belarus | 69.2 /100 | #161 | Good 6.1% |
| Nigerians | 67.1 /100 | #162 | Good 6.1% |
| Lebanese | 66.2 /100 | #163 | Good 6.1% |
| Basques | 63.7 /100 | #164 | Good 6.1% |
| Nicaraguans | 63.2 /100 | #165 | Good 6.1% |
| Iraqis | 62.8 /100 | #166 | Good 6.1% |
| Immigrants | Oceania | 60.7 /100 | #167 | Good 6.1% |
| Ecuadorians | 60.5 /100 | #168 | Good 6.1% |
| Immigrants | Southern Europe | 58.1 /100 | #169 | Average 6.1% |
| Immigrants | Ecuador | 53.8 /100 | #170 | Average 6.1% |
| Moroccans | 52.6 /100 | #171 | Average 6.1% |
| Immigrants | Burma/Myanmar | 52.2 /100 | #172 | Average 6.1% |