Celtic vs Immigrants from Israel Ambulatory Disability
COMPARE
Celtic
Immigrants from Israel
Ambulatory Disability
Ambulatory Disability Comparison
Celtics
Immigrants from Israel
6.7%
AMBULATORY DISABILITY
0.1/ 100
METRIC RATING
276th/ 347
METRIC RANK
5.4%
AMBULATORY DISABILITY
100.0/ 100
METRIC RATING
22nd/ 347
METRIC RANK
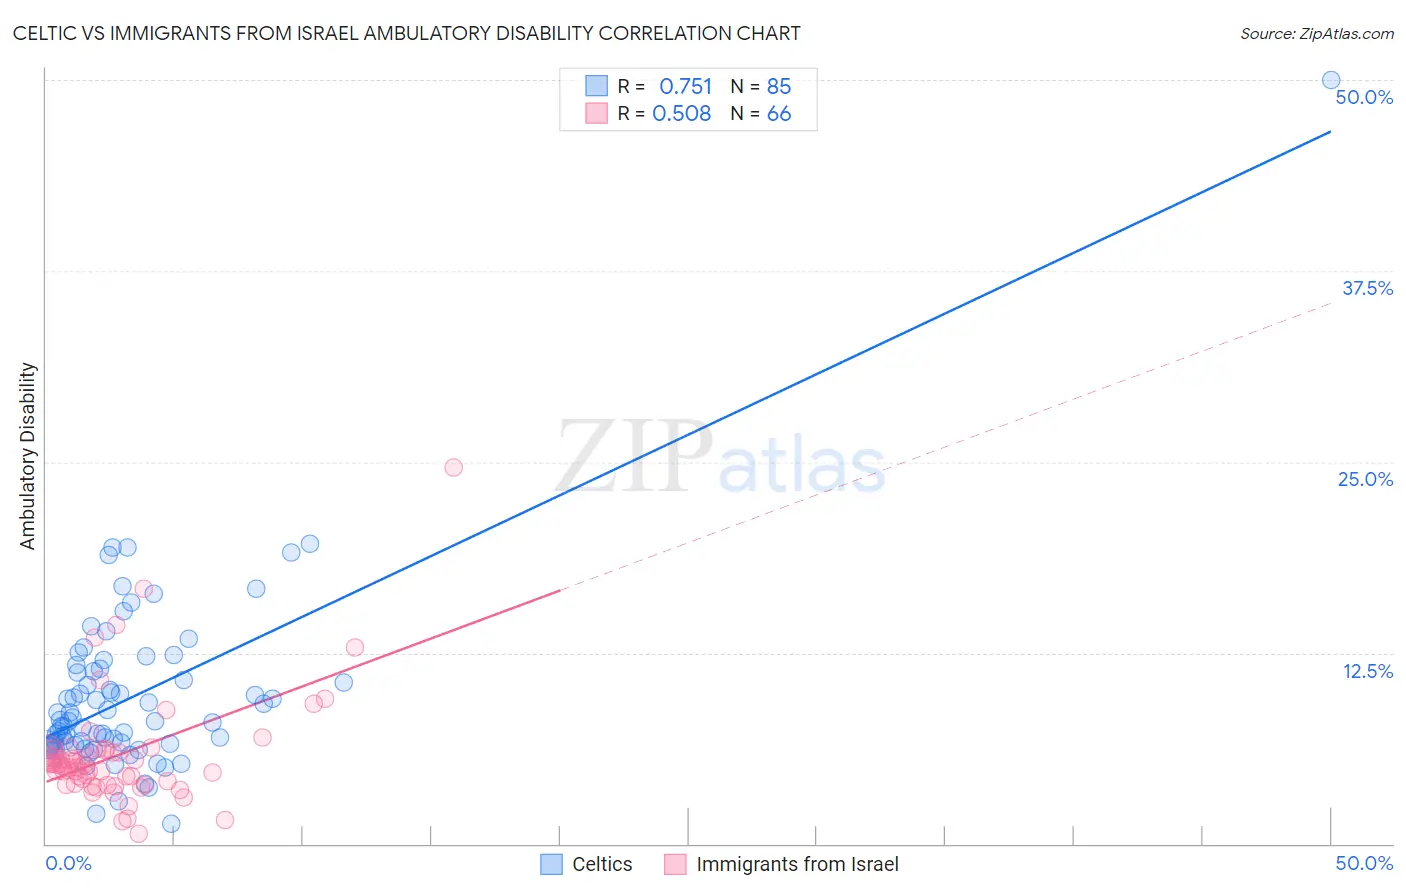
Celtic vs Immigrants from Israel Ambulatory Disability Correlation Chart
The statistical analysis conducted on geographies consisting of 168,862,473 people shows a strong positive correlation between the proportion of Celtics and percentage of population with ambulatory disability in the United States with a correlation coefficient (R) of 0.751 and weighted average of 6.7%. Similarly, the statistical analysis conducted on geographies consisting of 210,002,102 people shows a substantial positive correlation between the proportion of Immigrants from Israel and percentage of population with ambulatory disability in the United States with a correlation coefficient (R) of 0.508 and weighted average of 5.4%, a difference of 24.7%.
Ambulatory Disability Correlation Summary
| Measurement | Celtic | Immigrants from Israel |
| Minimum | 1.3% | 0.69% |
| Maximum | 50.0% | 24.6% |
| Range | 48.7% | 24.0% |
| Mean | 9.7% | 5.8% |
| Median | 8.0% | 5.1% |
| Interquartile 25% (IQ1) | 6.5% | 3.9% |
| Interquartile 75% (IQ3) | 11.4% | 6.1% |
| Interquartile Range (IQR) | 4.8% | 2.2% |
| Standard Deviation (Sample) | 6.0% | 3.7% |
| Standard Deviation (Population) | 6.0% | 3.7% |
Similar Demographics by Ambulatory Disability
Demographics Similar to Celtics by Ambulatory Disability
In terms of ambulatory disability, the demographic groups most similar to Celtics are Immigrants from Guyana (6.7%, a difference of 0.030%), Jamaican (6.7%, a difference of 0.080%), Sioux (6.7%, a difference of 0.090%), Immigrants from West Indies (6.7%, a difference of 0.15%), and White/Caucasian (6.7%, a difference of 0.34%).
| Demographics | Rating | Rank | Ambulatory Disability |
| French | 0.1 /100 | #269 | Tragic 6.6% |
| Slovaks | 0.1 /100 | #270 | Tragic 6.7% |
| Immigrants | Trinidad and Tobago | 0.1 /100 | #271 | Tragic 6.7% |
| French Canadians | 0.1 /100 | #272 | Tragic 6.7% |
| Whites/Caucasians | 0.1 /100 | #273 | Tragic 6.7% |
| Sioux | 0.1 /100 | #274 | Tragic 6.7% |
| Immigrants | Guyana | 0.1 /100 | #275 | Tragic 6.7% |
| Celtics | 0.1 /100 | #276 | Tragic 6.7% |
| Jamaicans | 0.1 /100 | #277 | Tragic 6.7% |
| Immigrants | West Indies | 0.1 /100 | #278 | Tragic 6.7% |
| Immigrants | Caribbean | 0.0 /100 | #279 | Tragic 6.7% |
| Pennsylvania Germans | 0.0 /100 | #280 | Tragic 6.8% |
| Yaqui | 0.0 /100 | #281 | Tragic 6.8% |
| Barbadians | 0.0 /100 | #282 | Tragic 6.8% |
| Immigrants | Barbados | 0.0 /100 | #283 | Tragic 6.8% |
Demographics Similar to Immigrants from Israel by Ambulatory Disability
In terms of ambulatory disability, the demographic groups most similar to Immigrants from Israel are Tongan (5.4%, a difference of 0.040%), Immigrants from Saudi Arabia (5.4%, a difference of 0.13%), Zimbabwean (5.4%, a difference of 0.21%), Immigrants from Nepal (5.4%, a difference of 0.25%), and Ethiopian (5.4%, a difference of 0.37%).
| Demographics | Rating | Rank | Ambulatory Disability |
| Immigrants | China | 100.0 /100 | #15 | Exceptional 5.3% |
| Immigrants | Hong Kong | 100.0 /100 | #16 | Exceptional 5.3% |
| Immigrants | Ethiopia | 100.0 /100 | #17 | Exceptional 5.4% |
| Immigrants | Sri Lanka | 100.0 /100 | #18 | Exceptional 5.4% |
| Indians (Asian) | 100.0 /100 | #19 | Exceptional 5.4% |
| Ethiopians | 100.0 /100 | #20 | Exceptional 5.4% |
| Immigrants | Kuwait | 100.0 /100 | #21 | Exceptional 5.4% |
| Immigrants | Israel | 100.0 /100 | #22 | Exceptional 5.4% |
| Tongans | 100.0 /100 | #23 | Exceptional 5.4% |
| Immigrants | Saudi Arabia | 100.0 /100 | #24 | Exceptional 5.4% |
| Zimbabweans | 100.0 /100 | #25 | Exceptional 5.4% |
| Immigrants | Nepal | 100.0 /100 | #26 | Exceptional 5.4% |
| Asians | 100.0 /100 | #27 | Exceptional 5.4% |
| Cambodians | 100.0 /100 | #28 | Exceptional 5.4% |
| Immigrants | Iran | 100.0 /100 | #29 | Exceptional 5.4% |