Celtic vs Immigrants from Northern Europe Disability
COMPARE
Celtic
Immigrants from Northern Europe
Disability
Disability Comparison
Celtics
Immigrants from Northern Europe
13.1%
DISABILITY
0.0/ 100
METRIC RATING
294th/ 347
METRIC RANK
11.3%
DISABILITY
94.1/ 100
METRIC RATING
116th/ 347
METRIC RANK
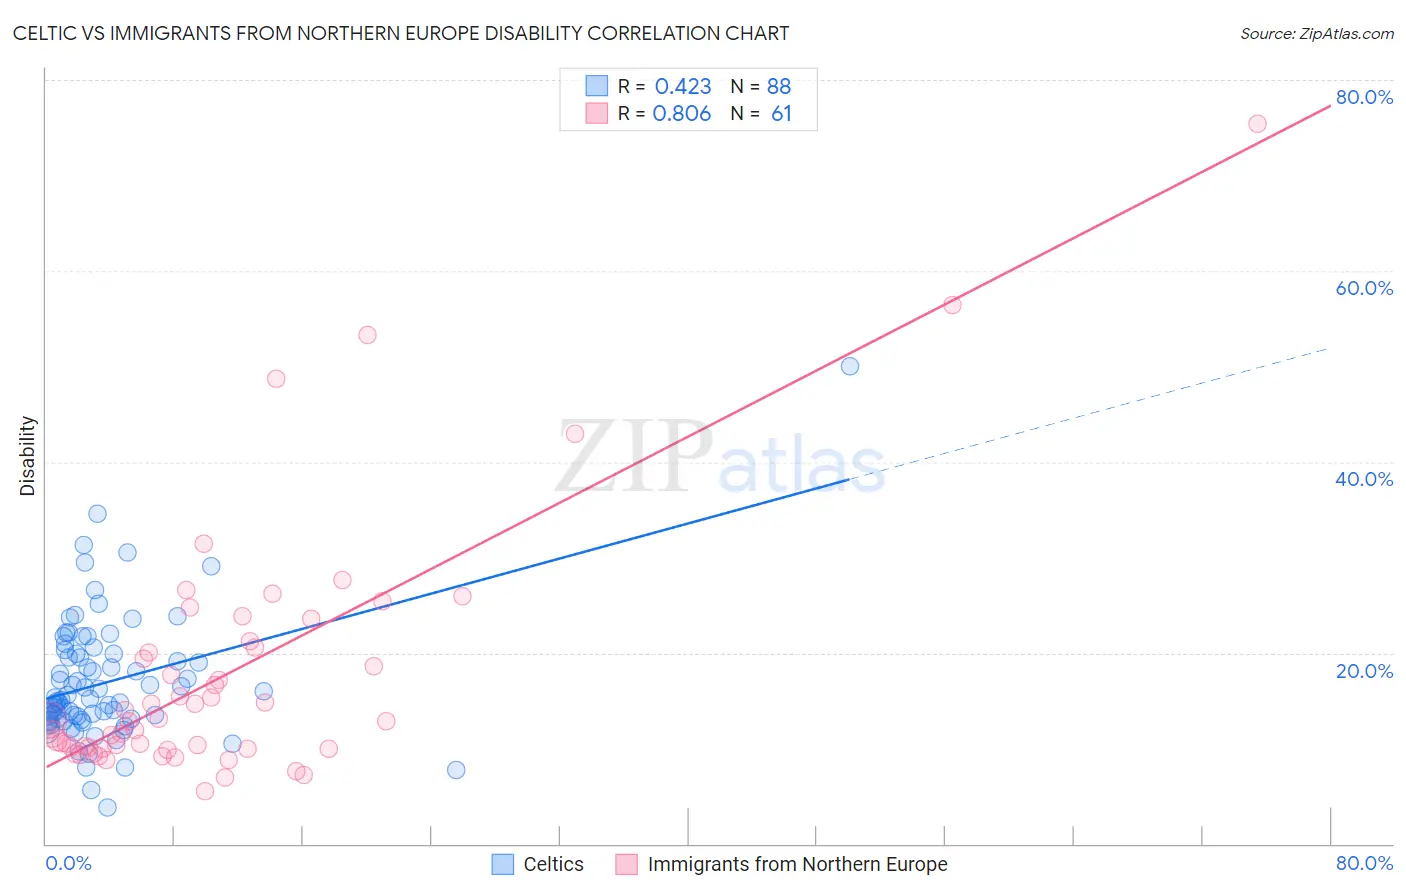
Celtic vs Immigrants from Northern Europe Disability Correlation Chart
The statistical analysis conducted on geographies consisting of 168,868,984 people shows a moderate positive correlation between the proportion of Celtics and percentage of population with a disability in the United States with a correlation coefficient (R) of 0.423 and weighted average of 13.1%. Similarly, the statistical analysis conducted on geographies consisting of 477,212,072 people shows a very strong positive correlation between the proportion of Immigrants from Northern Europe and percentage of population with a disability in the United States with a correlation coefficient (R) of 0.806 and weighted average of 11.3%, a difference of 15.8%.
Disability Correlation Summary
| Measurement | Celtic | Immigrants from Northern Europe |
| Minimum | 3.8% | 5.5% |
| Maximum | 50.0% | 75.4% |
| Range | 46.2% | 69.9% |
| Mean | 16.9% | 17.8% |
| Median | 15.1% | 12.9% |
| Interquartile 25% (IQ1) | 13.0% | 10.0% |
| Interquartile 75% (IQ3) | 19.9% | 20.9% |
| Interquartile Range (IQR) | 6.9% | 10.9% |
| Standard Deviation (Sample) | 6.7% | 13.2% |
| Standard Deviation (Population) | 6.7% | 13.1% |
Similar Demographics by Disability
Demographics Similar to Celtics by Disability
In terms of disability, the demographic groups most similar to Celtics are Nonimmigrants (13.2%, a difference of 0.12%), Central American Indian (13.2%, a difference of 0.16%), Hopi (13.2%, a difference of 0.22%), Alaska Native (13.2%, a difference of 0.23%), and French (13.2%, a difference of 0.25%).
| Demographics | Rating | Rank | Disability |
| Africans | 0.0 /100 | #287 | Tragic 13.0% |
| Whites/Caucasians | 0.0 /100 | #288 | Tragic 13.0% |
| Slovaks | 0.0 /100 | #289 | Tragic 13.0% |
| Cheyenne | 0.0 /100 | #290 | Tragic 13.0% |
| Yaqui | 0.0 /100 | #291 | Tragic 13.1% |
| Aleuts | 0.0 /100 | #292 | Tragic 13.1% |
| Marshallese | 0.0 /100 | #293 | Tragic 13.1% |
| Celtics | 0.0 /100 | #294 | Tragic 13.1% |
| Immigrants | Nonimmigrants | 0.0 /100 | #295 | Tragic 13.2% |
| Central American Indians | 0.0 /100 | #296 | Tragic 13.2% |
| Hopi | 0.0 /100 | #297 | Tragic 13.2% |
| Alaska Natives | 0.0 /100 | #298 | Tragic 13.2% |
| French | 0.0 /100 | #299 | Tragic 13.2% |
| Pennsylvania Germans | 0.0 /100 | #300 | Tragic 13.2% |
| Immigrants | Micronesia | 0.0 /100 | #301 | Tragic 13.2% |
Demographics Similar to Immigrants from Northern Europe by Disability
In terms of disability, the demographic groups most similar to Immigrants from Northern Europe are Luxembourger (11.3%, a difference of 0.060%), Korean (11.3%, a difference of 0.070%), Immigrants from Philippines (11.3%, a difference of 0.11%), Central American (11.4%, a difference of 0.12%), and Immigrants from North Macedonia (11.4%, a difference of 0.12%).
| Demographics | Rating | Rank | Disability |
| Immigrants | Uganda | 95.7 /100 | #109 | Exceptional 11.3% |
| Immigrants | Denmark | 95.6 /100 | #110 | Exceptional 11.3% |
| Immigrants | South Eastern Asia | 95.4 /100 | #111 | Exceptional 11.3% |
| Immigrants | Uzbekistan | 94.9 /100 | #112 | Exceptional 11.3% |
| Guyanese | 94.7 /100 | #113 | Exceptional 11.3% |
| Immigrants | Syria | 94.7 /100 | #114 | Exceptional 11.3% |
| Immigrants | Philippines | 94.6 /100 | #115 | Exceptional 11.3% |
| Immigrants | Northern Europe | 94.1 /100 | #116 | Exceptional 11.3% |
| Luxembourgers | 93.9 /100 | #117 | Exceptional 11.3% |
| Koreans | 93.8 /100 | #118 | Exceptional 11.3% |
| Central Americans | 93.5 /100 | #119 | Exceptional 11.4% |
| Immigrants | North Macedonia | 93.5 /100 | #120 | Exceptional 11.4% |
| Immigrants | Costa Rica | 93.4 /100 | #121 | Exceptional 11.4% |
| Brazilians | 93.3 /100 | #122 | Exceptional 11.4% |
| South Africans | 92.3 /100 | #123 | Exceptional 11.4% |