Celtic vs Hopi Disability
COMPARE
Celtic
Hopi
Disability
Disability Comparison
Celtics
Hopi
13.1%
DISABILITY
0.0/ 100
METRIC RATING
294th/ 347
METRIC RANK
13.2%
DISABILITY
0.0/ 100
METRIC RATING
297th/ 347
METRIC RANK
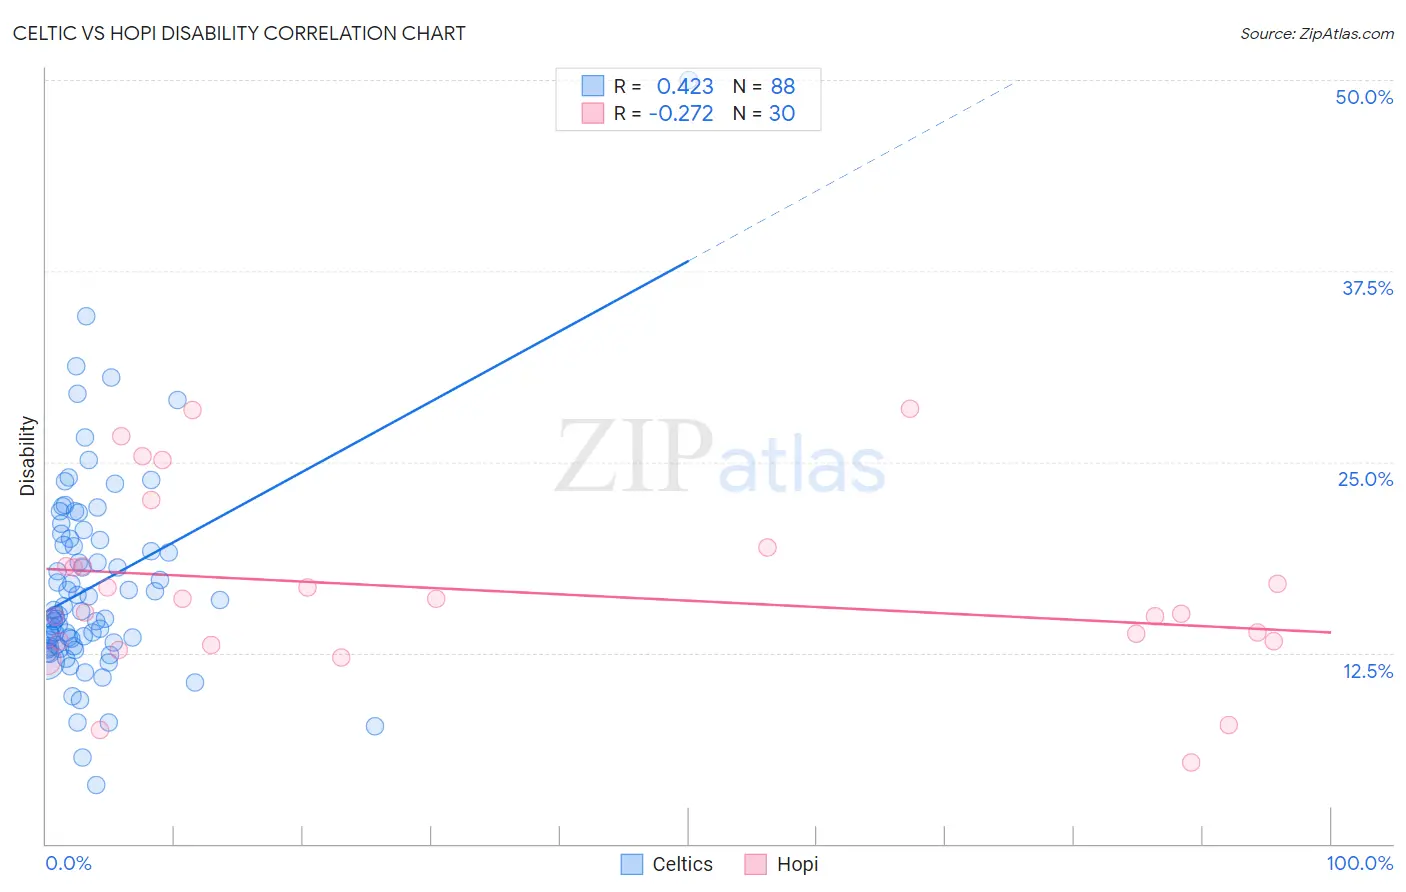
Celtic vs Hopi Disability Correlation Chart
The statistical analysis conducted on geographies consisting of 168,868,984 people shows a moderate positive correlation between the proportion of Celtics and percentage of population with a disability in the United States with a correlation coefficient (R) of 0.423 and weighted average of 13.1%. Similarly, the statistical analysis conducted on geographies consisting of 74,733,532 people shows a weak negative correlation between the proportion of Hopi and percentage of population with a disability in the United States with a correlation coefficient (R) of -0.272 and weighted average of 13.2%, a difference of 0.22%.
Disability Correlation Summary
| Measurement | Celtic | Hopi |
| Minimum | 3.8% | 5.3% |
| Maximum | 50.0% | 28.4% |
| Range | 46.2% | 23.1% |
| Mean | 16.9% | 16.6% |
| Median | 15.1% | 15.6% |
| Interquartile 25% (IQ1) | 13.0% | 13.3% |
| Interquartile 75% (IQ3) | 19.9% | 18.2% |
| Interquartile Range (IQR) | 6.9% | 4.9% |
| Standard Deviation (Sample) | 6.7% | 5.8% |
| Standard Deviation (Population) | 6.7% | 5.7% |
Demographics Similar to Celtics and Hopi by Disability
In terms of disability, the demographic groups most similar to Celtics are Nonimmigrants (13.2%, a difference of 0.12%), Central American Indian (13.2%, a difference of 0.16%), Alaska Native (13.2%, a difference of 0.23%), French (13.2%, a difference of 0.25%), and Marshallese (13.1%, a difference of 0.29%). Similarly, the demographic groups most similar to Hopi are Alaska Native (13.2%, a difference of 0.010%), French (13.2%, a difference of 0.030%), Central American Indian (13.2%, a difference of 0.060%), Pennsylvania German (13.2%, a difference of 0.070%), and Nonimmigrants (13.2%, a difference of 0.10%).
| Demographics | Rating | Rank | Disability |
| Crow | 0.0 /100 | #285 | Tragic 12.9% |
| English | 0.0 /100 | #286 | Tragic 13.0% |
| Africans | 0.0 /100 | #287 | Tragic 13.0% |
| Whites/Caucasians | 0.0 /100 | #288 | Tragic 13.0% |
| Slovaks | 0.0 /100 | #289 | Tragic 13.0% |
| Cheyenne | 0.0 /100 | #290 | Tragic 13.0% |
| Yaqui | 0.0 /100 | #291 | Tragic 13.1% |
| Aleuts | 0.0 /100 | #292 | Tragic 13.1% |
| Marshallese | 0.0 /100 | #293 | Tragic 13.1% |
| Celtics | 0.0 /100 | #294 | Tragic 13.1% |
| Immigrants | Nonimmigrants | 0.0 /100 | #295 | Tragic 13.2% |
| Central American Indians | 0.0 /100 | #296 | Tragic 13.2% |
| Hopi | 0.0 /100 | #297 | Tragic 13.2% |
| Alaska Natives | 0.0 /100 | #298 | Tragic 13.2% |
| French | 0.0 /100 | #299 | Tragic 13.2% |
| Pennsylvania Germans | 0.0 /100 | #300 | Tragic 13.2% |
| Immigrants | Micronesia | 0.0 /100 | #301 | Tragic 13.2% |
| Arapaho | 0.0 /100 | #302 | Tragic 13.2% |
| Scotch-Irish | 0.0 /100 | #303 | Tragic 13.3% |
| Yakama | 0.0 /100 | #304 | Tragic 13.4% |
| French Canadians | 0.0 /100 | #305 | Tragic 13.4% |