Celtic vs Immigrants from Trinidad and Tobago Disability
COMPARE
Celtic
Immigrants from Trinidad and Tobago
Disability
Disability Comparison
Celtics
Immigrants from Trinidad and Tobago
13.1%
DISABILITY
0.0/ 100
METRIC RATING
294th/ 347
METRIC RANK
11.7%
DISABILITY
58.9/ 100
METRIC RATING
163rd/ 347
METRIC RANK
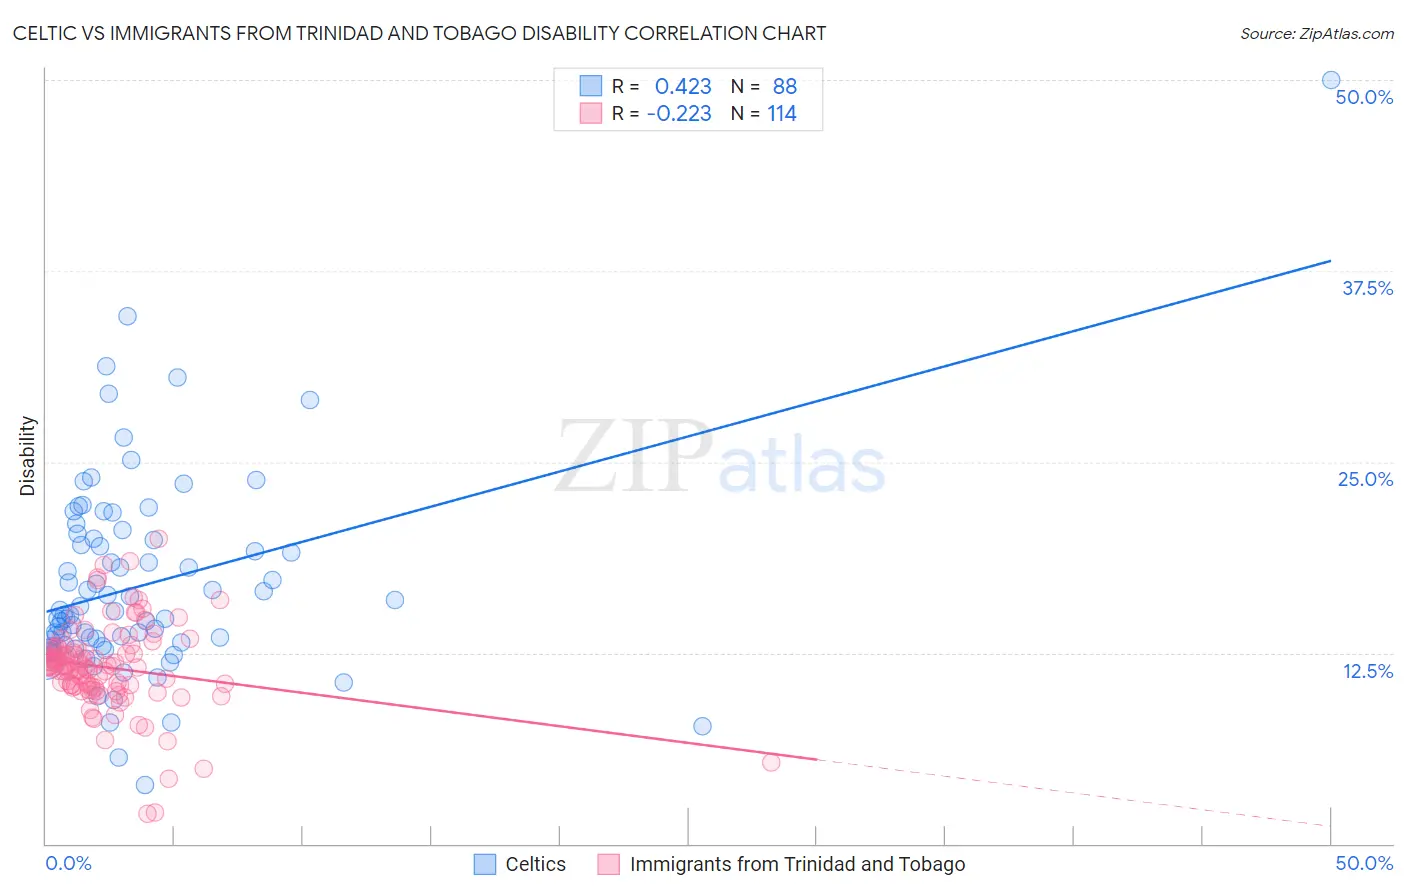
Celtic vs Immigrants from Trinidad and Tobago Disability Correlation Chart
The statistical analysis conducted on geographies consisting of 168,868,984 people shows a moderate positive correlation between the proportion of Celtics and percentage of population with a disability in the United States with a correlation coefficient (R) of 0.423 and weighted average of 13.1%. Similarly, the statistical analysis conducted on geographies consisting of 223,506,024 people shows a weak negative correlation between the proportion of Immigrants from Trinidad and Tobago and percentage of population with a disability in the United States with a correlation coefficient (R) of -0.223 and weighted average of 11.7%, a difference of 12.7%.
Disability Correlation Summary
| Measurement | Celtic | Immigrants from Trinidad and Tobago |
| Minimum | 3.8% | 2.0% |
| Maximum | 50.0% | 20.0% |
| Range | 46.2% | 18.0% |
| Mean | 16.9% | 11.5% |
| Median | 15.1% | 11.6% |
| Interquartile 25% (IQ1) | 13.0% | 10.3% |
| Interquartile 75% (IQ3) | 19.9% | 12.7% |
| Interquartile Range (IQR) | 6.9% | 2.5% |
| Standard Deviation (Sample) | 6.7% | 2.9% |
| Standard Deviation (Population) | 6.7% | 2.9% |
Similar Demographics by Disability
Demographics Similar to Celtics by Disability
In terms of disability, the demographic groups most similar to Celtics are Nonimmigrants (13.2%, a difference of 0.12%), Central American Indian (13.2%, a difference of 0.16%), Hopi (13.2%, a difference of 0.22%), Alaska Native (13.2%, a difference of 0.23%), and French (13.2%, a difference of 0.25%).
| Demographics | Rating | Rank | Disability |
| Africans | 0.0 /100 | #287 | Tragic 13.0% |
| Whites/Caucasians | 0.0 /100 | #288 | Tragic 13.0% |
| Slovaks | 0.0 /100 | #289 | Tragic 13.0% |
| Cheyenne | 0.0 /100 | #290 | Tragic 13.0% |
| Yaqui | 0.0 /100 | #291 | Tragic 13.1% |
| Aleuts | 0.0 /100 | #292 | Tragic 13.1% |
| Marshallese | 0.0 /100 | #293 | Tragic 13.1% |
| Celtics | 0.0 /100 | #294 | Tragic 13.1% |
| Immigrants | Nonimmigrants | 0.0 /100 | #295 | Tragic 13.2% |
| Central American Indians | 0.0 /100 | #296 | Tragic 13.2% |
| Hopi | 0.0 /100 | #297 | Tragic 13.2% |
| Alaska Natives | 0.0 /100 | #298 | Tragic 13.2% |
| French | 0.0 /100 | #299 | Tragic 13.2% |
| Pennsylvania Germans | 0.0 /100 | #300 | Tragic 13.2% |
| Immigrants | Micronesia | 0.0 /100 | #301 | Tragic 13.2% |
Demographics Similar to Immigrants from Trinidad and Tobago by Disability
In terms of disability, the demographic groups most similar to Immigrants from Trinidad and Tobago are Immigrants from Haiti (11.7%, a difference of 0.020%), Syrian (11.7%, a difference of 0.020%), Cuban (11.7%, a difference of 0.10%), Immigrants from Cuba (11.6%, a difference of 0.19%), and Pakistani (11.7%, a difference of 0.19%).
| Demographics | Rating | Rank | Disability |
| Immigrants | Fiji | 69.5 /100 | #156 | Good 11.6% |
| Immigrants | Middle Africa | 69.5 /100 | #157 | Good 11.6% |
| Armenians | 65.9 /100 | #158 | Good 11.6% |
| Guatemalans | 65.1 /100 | #159 | Good 11.6% |
| Immigrants | Barbados | 64.2 /100 | #160 | Good 11.6% |
| Immigrants | Cuba | 62.8 /100 | #161 | Good 11.6% |
| Immigrants | Haiti | 59.2 /100 | #162 | Average 11.7% |
| Immigrants | Trinidad and Tobago | 58.9 /100 | #163 | Average 11.7% |
| Syrians | 58.5 /100 | #164 | Average 11.7% |
| Cubans | 56.7 /100 | #165 | Average 11.7% |
| Pakistanis | 54.7 /100 | #166 | Average 11.7% |
| Estonians | 54.4 /100 | #167 | Average 11.7% |
| Immigrants | Latin America | 54.1 /100 | #168 | Average 11.7% |
| Immigrants | Austria | 53.4 /100 | #169 | Average 11.7% |
| Immigrants | Albania | 52.8 /100 | #170 | Average 11.7% |