Celtic vs Immigrants from Western Asia Disability
COMPARE
Celtic
Immigrants from Western Asia
Disability
Disability Comparison
Celtics
Immigrants from Western Asia
13.1%
DISABILITY
0.0/ 100
METRIC RATING
294th/ 347
METRIC RANK
11.2%
DISABILITY
98.1/ 100
METRIC RATING
91st/ 347
METRIC RANK
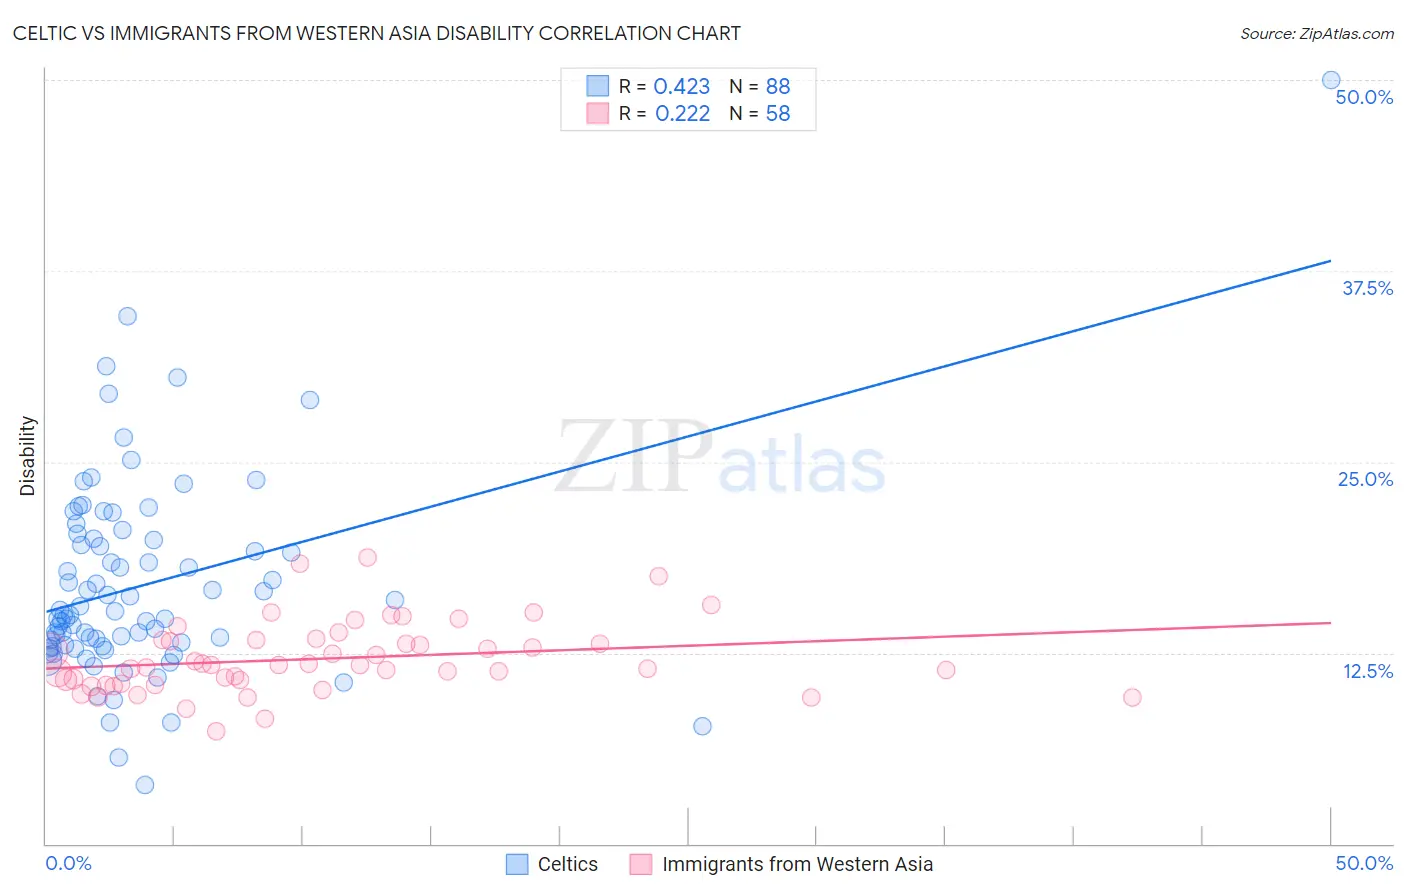
Celtic vs Immigrants from Western Asia Disability Correlation Chart
The statistical analysis conducted on geographies consisting of 168,868,984 people shows a moderate positive correlation between the proportion of Celtics and percentage of population with a disability in the United States with a correlation coefficient (R) of 0.423 and weighted average of 13.1%. Similarly, the statistical analysis conducted on geographies consisting of 404,425,808 people shows a weak positive correlation between the proportion of Immigrants from Western Asia and percentage of population with a disability in the United States with a correlation coefficient (R) of 0.222 and weighted average of 11.2%, a difference of 17.4%.
Disability Correlation Summary
| Measurement | Celtic | Immigrants from Western Asia |
| Minimum | 3.8% | 7.4% |
| Maximum | 50.0% | 18.8% |
| Range | 46.2% | 11.4% |
| Mean | 16.9% | 12.1% |
| Median | 15.1% | 11.7% |
| Interquartile 25% (IQ1) | 13.0% | 10.5% |
| Interquartile 75% (IQ3) | 19.9% | 13.4% |
| Interquartile Range (IQR) | 6.9% | 2.8% |
| Standard Deviation (Sample) | 6.7% | 2.3% |
| Standard Deviation (Population) | 6.7% | 2.3% |
Similar Demographics by Disability
Demographics Similar to Celtics by Disability
In terms of disability, the demographic groups most similar to Celtics are Nonimmigrants (13.2%, a difference of 0.12%), Central American Indian (13.2%, a difference of 0.16%), Hopi (13.2%, a difference of 0.22%), Alaska Native (13.2%, a difference of 0.23%), and French (13.2%, a difference of 0.25%).
| Demographics | Rating | Rank | Disability |
| Africans | 0.0 /100 | #287 | Tragic 13.0% |
| Whites/Caucasians | 0.0 /100 | #288 | Tragic 13.0% |
| Slovaks | 0.0 /100 | #289 | Tragic 13.0% |
| Cheyenne | 0.0 /100 | #290 | Tragic 13.0% |
| Yaqui | 0.0 /100 | #291 | Tragic 13.1% |
| Aleuts | 0.0 /100 | #292 | Tragic 13.1% |
| Marshallese | 0.0 /100 | #293 | Tragic 13.1% |
| Celtics | 0.0 /100 | #294 | Tragic 13.1% |
| Immigrants | Nonimmigrants | 0.0 /100 | #295 | Tragic 13.2% |
| Central American Indians | 0.0 /100 | #296 | Tragic 13.2% |
| Hopi | 0.0 /100 | #297 | Tragic 13.2% |
| Alaska Natives | 0.0 /100 | #298 | Tragic 13.2% |
| French | 0.0 /100 | #299 | Tragic 13.2% |
| Pennsylvania Germans | 0.0 /100 | #300 | Tragic 13.2% |
| Immigrants | Micronesia | 0.0 /100 | #301 | Tragic 13.2% |
Demographics Similar to Immigrants from Western Asia by Disability
In terms of disability, the demographic groups most similar to Immigrants from Western Asia are Immigrants from Brazil (11.2%, a difference of 0.020%), Ecuadorian (11.2%, a difference of 0.040%), Immigrants from Ecuador (11.2%, a difference of 0.040%), Immigrants from South Africa (11.2%, a difference of 0.070%), and Immigrants from Morocco (11.2%, a difference of 0.16%).
| Demographics | Rating | Rank | Disability |
| Immigrants | Sierra Leone | 99.0 /100 | #84 | Exceptional 11.1% |
| Immigrants | Belarus | 98.9 /100 | #85 | Exceptional 11.1% |
| Immigrants | Russia | 98.9 /100 | #86 | Exceptional 11.1% |
| Palestinians | 98.9 /100 | #87 | Exceptional 11.1% |
| Immigrants | Romania | 98.5 /100 | #88 | Exceptional 11.2% |
| Immigrants | South Africa | 98.2 /100 | #89 | Exceptional 11.2% |
| Immigrants | Brazil | 98.1 /100 | #90 | Exceptional 11.2% |
| Immigrants | Western Asia | 98.1 /100 | #91 | Exceptional 11.2% |
| Ecuadorians | 98.0 /100 | #92 | Exceptional 11.2% |
| Immigrants | Ecuador | 98.0 /100 | #93 | Exceptional 11.2% |
| Immigrants | Morocco | 97.8 /100 | #94 | Exceptional 11.2% |
| Eastern Europeans | 97.8 /100 | #95 | Exceptional 11.2% |
| Immigrants | Zimbabwe | 97.7 /100 | #96 | Exceptional 11.2% |
| Bhutanese | 97.4 /100 | #97 | Exceptional 11.2% |
| Uruguayans | 97.4 /100 | #98 | Exceptional 11.2% |