Celtic vs Czech Disability
COMPARE
Celtic
Czech
Disability
Disability Comparison
Celtics
Czechs
13.1%
DISABILITY
0.0/ 100
METRIC RATING
294th/ 347
METRIC RANK
12.0%
DISABILITY
7.9/ 100
METRIC RATING
210th/ 347
METRIC RANK
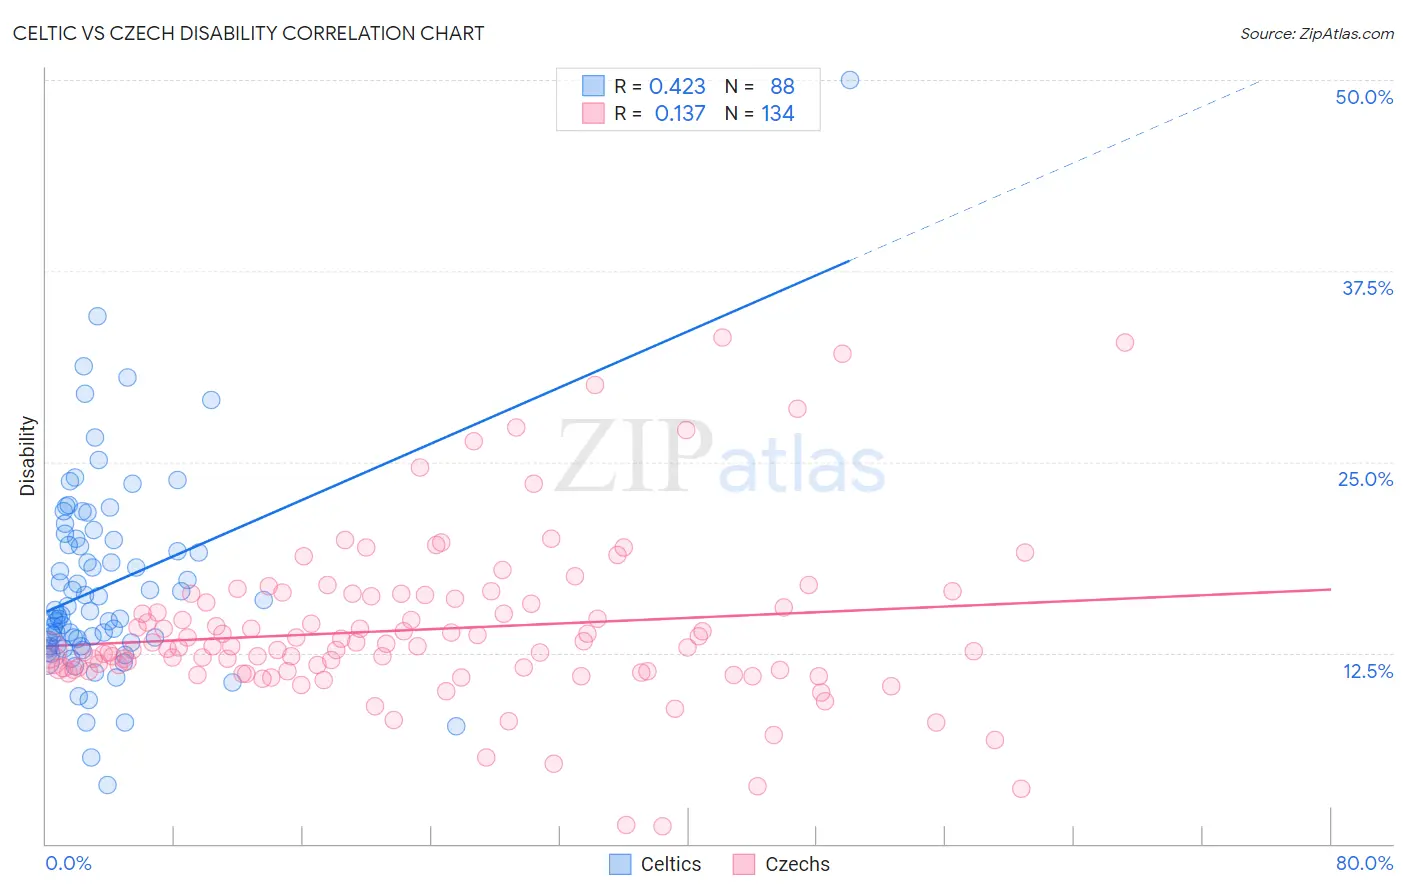
Celtic vs Czech Disability Correlation Chart
The statistical analysis conducted on geographies consisting of 168,868,984 people shows a moderate positive correlation between the proportion of Celtics and percentage of population with a disability in the United States with a correlation coefficient (R) of 0.423 and weighted average of 13.1%. Similarly, the statistical analysis conducted on geographies consisting of 484,761,061 people shows a poor positive correlation between the proportion of Czechs and percentage of population with a disability in the United States with a correlation coefficient (R) of 0.137 and weighted average of 12.0%, a difference of 9.3%.
Disability Correlation Summary
| Measurement | Celtic | Czech |
| Minimum | 3.8% | 1.2% |
| Maximum | 50.0% | 33.1% |
| Range | 46.2% | 31.9% |
| Mean | 16.9% | 14.0% |
| Median | 15.1% | 12.9% |
| Interquartile 25% (IQ1) | 13.0% | 11.3% |
| Interquartile 75% (IQ3) | 19.9% | 16.0% |
| Interquartile Range (IQR) | 6.9% | 4.7% |
| Standard Deviation (Sample) | 6.7% | 5.4% |
| Standard Deviation (Population) | 6.7% | 5.4% |
Similar Demographics by Disability
Demographics Similar to Celtics by Disability
In terms of disability, the demographic groups most similar to Celtics are Nonimmigrants (13.2%, a difference of 0.12%), Central American Indian (13.2%, a difference of 0.16%), Hopi (13.2%, a difference of 0.22%), Alaska Native (13.2%, a difference of 0.23%), and French (13.2%, a difference of 0.25%).
| Demographics | Rating | Rank | Disability |
| Africans | 0.0 /100 | #287 | Tragic 13.0% |
| Whites/Caucasians | 0.0 /100 | #288 | Tragic 13.0% |
| Slovaks | 0.0 /100 | #289 | Tragic 13.0% |
| Cheyenne | 0.0 /100 | #290 | Tragic 13.0% |
| Yaqui | 0.0 /100 | #291 | Tragic 13.1% |
| Aleuts | 0.0 /100 | #292 | Tragic 13.1% |
| Marshallese | 0.0 /100 | #293 | Tragic 13.1% |
| Celtics | 0.0 /100 | #294 | Tragic 13.1% |
| Immigrants | Nonimmigrants | 0.0 /100 | #295 | Tragic 13.2% |
| Central American Indians | 0.0 /100 | #296 | Tragic 13.2% |
| Hopi | 0.0 /100 | #297 | Tragic 13.2% |
| Alaska Natives | 0.0 /100 | #298 | Tragic 13.2% |
| French | 0.0 /100 | #299 | Tragic 13.2% |
| Pennsylvania Germans | 0.0 /100 | #300 | Tragic 13.2% |
| Immigrants | Micronesia | 0.0 /100 | #301 | Tragic 13.2% |
Demographics Similar to Czechs by Disability
In terms of disability, the demographic groups most similar to Czechs are Immigrants from Cambodia (12.0%, a difference of 0.080%), Austrian (12.0%, a difference of 0.11%), Immigrants from Iraq (12.0%, a difference of 0.11%), Danish (12.0%, a difference of 0.13%), and Immigrants from Somalia (12.0%, a difference of 0.16%).
| Demographics | Rating | Rank | Disability |
| British West Indians | 11.5 /100 | #203 | Poor 12.0% |
| Mexican American Indians | 11.4 /100 | #204 | Poor 12.0% |
| Immigrants | Western Europe | 10.1 /100 | #205 | Poor 12.0% |
| Immigrants | Senegal | 9.4 /100 | #206 | Tragic 12.0% |
| Immigrants | Thailand | 9.3 /100 | #207 | Tragic 12.0% |
| Immigrants | Caribbean | 9.1 /100 | #208 | Tragic 12.0% |
| Danes | 8.7 /100 | #209 | Tragic 12.0% |
| Czechs | 7.9 /100 | #210 | Tragic 12.0% |
| Immigrants | Cambodia | 7.3 /100 | #211 | Tragic 12.0% |
| Austrians | 7.2 /100 | #212 | Tragic 12.0% |
| Immigrants | Iraq | 7.1 /100 | #213 | Tragic 12.0% |
| Immigrants | Somalia | 6.8 /100 | #214 | Tragic 12.0% |
| Immigrants | Canada | 6.1 /100 | #215 | Tragic 12.1% |
| Panamanians | 5.4 /100 | #216 | Tragic 12.1% |
| Immigrants | North America | 5.3 /100 | #217 | Tragic 12.1% |