Celtic vs Immigrants from Taiwan Unemployment Among Ages 20 to 24 years
COMPARE
Celtic
Immigrants from Taiwan
Unemployment Among Ages 20 to 24 years
Unemployment Among Ages 20 to 24 years Comparison
Celtics
Immigrants from Taiwan
9.9%
UNEMPLOYMENT AMONG AGES 20 TO 24 YEARS
98.9/ 100
METRIC RATING
71st/ 347
METRIC RANK
10.2%
UNEMPLOYMENT AMONG AGES 20 TO 24 YEARS
71.4/ 100
METRIC RATING
153rd/ 347
METRIC RANK
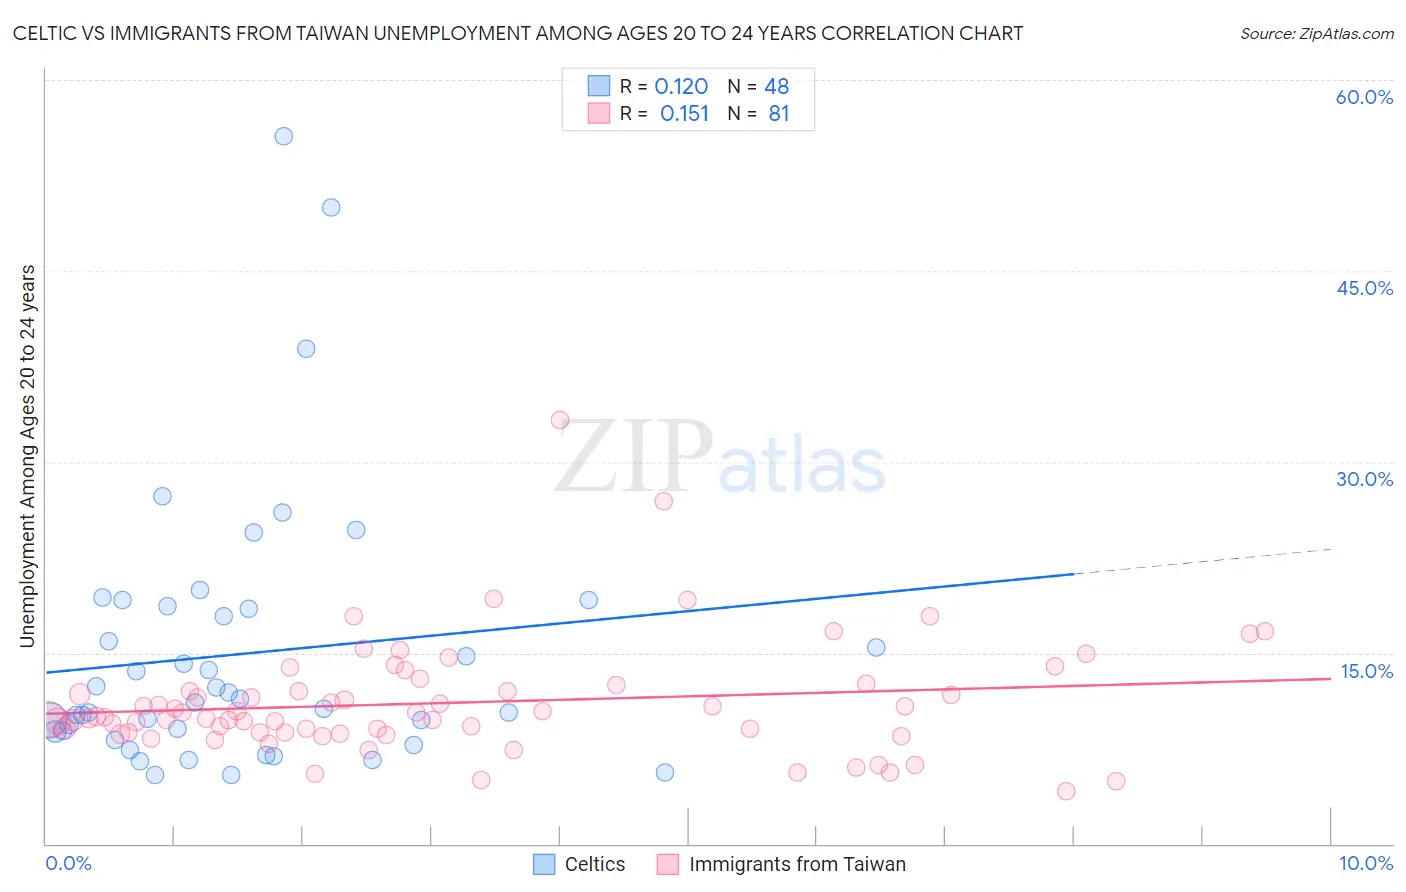
Celtic vs Immigrants from Taiwan Unemployment Among Ages 20 to 24 years Correlation Chart
The statistical analysis conducted on geographies consisting of 165,509,552 people shows a poor positive correlation between the proportion of Celtics and unemployment rate among population between the ages 20 and 24 in the United States with a correlation coefficient (R) of 0.120 and weighted average of 9.9%. Similarly, the statistical analysis conducted on geographies consisting of 292,759,634 people shows a poor positive correlation between the proportion of Immigrants from Taiwan and unemployment rate among population between the ages 20 and 24 in the United States with a correlation coefficient (R) of 0.151 and weighted average of 10.2%, a difference of 3.4%.
Unemployment Among Ages 20 to 24 years Correlation Summary
| Measurement | Celtic | Immigrants from Taiwan |
| Minimum | 5.4% | 4.1% |
| Maximum | 55.6% | 33.3% |
| Range | 50.2% | 29.2% |
| Mean | 14.9% | 11.1% |
| Median | 11.3% | 9.9% |
| Interquartile 25% (IQ1) | 8.8% | 8.8% |
| Interquartile 75% (IQ3) | 18.6% | 12.3% |
| Interquartile Range (IQR) | 9.7% | 3.5% |
| Standard Deviation (Sample) | 10.5% | 4.5% |
| Standard Deviation (Population) | 10.4% | 4.5% |
Similar Demographics by Unemployment Among Ages 20 to 24 years
Demographics Similar to Celtics by Unemployment Among Ages 20 to 24 years
In terms of unemployment among ages 20 to 24 years, the demographic groups most similar to Celtics are Immigrants from Croatia (9.9%, a difference of 0.030%), Bolivian (9.9%, a difference of 0.040%), Bulgarian (9.9%, a difference of 0.15%), Kenyan (9.9%, a difference of 0.18%), and Immigrants from Laos (9.9%, a difference of 0.21%).
| Demographics | Rating | Rank | Unemployment Among Ages 20 to 24 years |
| Serbians | 99.4 /100 | #64 | Exceptional 9.8% |
| Welsh | 99.3 /100 | #65 | Exceptional 9.8% |
| Scottish | 99.3 /100 | #66 | Exceptional 9.8% |
| Immigrants | Bolivia | 99.2 /100 | #67 | Exceptional 9.9% |
| Mongolians | 99.1 /100 | #68 | Exceptional 9.9% |
| Bulgarians | 99.1 /100 | #69 | Exceptional 9.9% |
| Immigrants | Croatia | 99.0 /100 | #70 | Exceptional 9.9% |
| Celtics | 98.9 /100 | #71 | Exceptional 9.9% |
| Bolivians | 98.9 /100 | #72 | Exceptional 9.9% |
| Kenyans | 98.7 /100 | #73 | Exceptional 9.9% |
| Immigrants | Laos | 98.7 /100 | #74 | Exceptional 9.9% |
| Immigrants | Australia | 98.6 /100 | #75 | Exceptional 9.9% |
| Czechoslovakians | 98.4 /100 | #76 | Exceptional 9.9% |
| Chickasaw | 98.4 /100 | #77 | Exceptional 9.9% |
| Assyrians/Chaldeans/Syriacs | 98.3 /100 | #78 | Exceptional 9.9% |
Demographics Similar to Immigrants from Taiwan by Unemployment Among Ages 20 to 24 years
In terms of unemployment among ages 20 to 24 years, the demographic groups most similar to Immigrants from Taiwan are Immigrants from Switzerland (10.2%, a difference of 0.010%), Iranian (10.2%, a difference of 0.040%), Lithuanian (10.2%, a difference of 0.060%), Immigrants from South Africa (10.2%, a difference of 0.10%), and Hungarian (10.2%, a difference of 0.14%).
| Demographics | Rating | Rank | Unemployment Among Ages 20 to 24 years |
| Asians | 77.7 /100 | #146 | Good 10.2% |
| French Canadians | 77.5 /100 | #147 | Good 10.2% |
| Immigrants | Romania | 75.7 /100 | #148 | Good 10.2% |
| Immigrants | Scotland | 74.6 /100 | #149 | Good 10.2% |
| Hungarians | 74.4 /100 | #150 | Good 10.2% |
| Immigrants | South Africa | 73.6 /100 | #151 | Good 10.2% |
| Iranians | 72.4 /100 | #152 | Good 10.2% |
| Immigrants | Taiwan | 71.4 /100 | #153 | Good 10.2% |
| Immigrants | Switzerland | 71.3 /100 | #154 | Good 10.2% |
| Lithuanians | 70.0 /100 | #155 | Good 10.2% |
| Canadians | 66.7 /100 | #156 | Good 10.2% |
| Immigrants | Uganda | 65.6 /100 | #157 | Good 10.2% |
| Immigrants | Kazakhstan | 65.5 /100 | #158 | Good 10.2% |
| Immigrants | England | 63.7 /100 | #159 | Good 10.3% |
| Spaniards | 63.4 /100 | #160 | Good 10.3% |