Celtic vs Immigrants from Sweden Disability
COMPARE
Celtic
Immigrants from Sweden
Disability
Disability Comparison
Celtics
Immigrants from Sweden
13.1%
DISABILITY
0.0/ 100
METRIC RATING
294th/ 347
METRIC RANK
11.0%
DISABILITY
99.6/ 100
METRIC RATING
64th/ 347
METRIC RANK
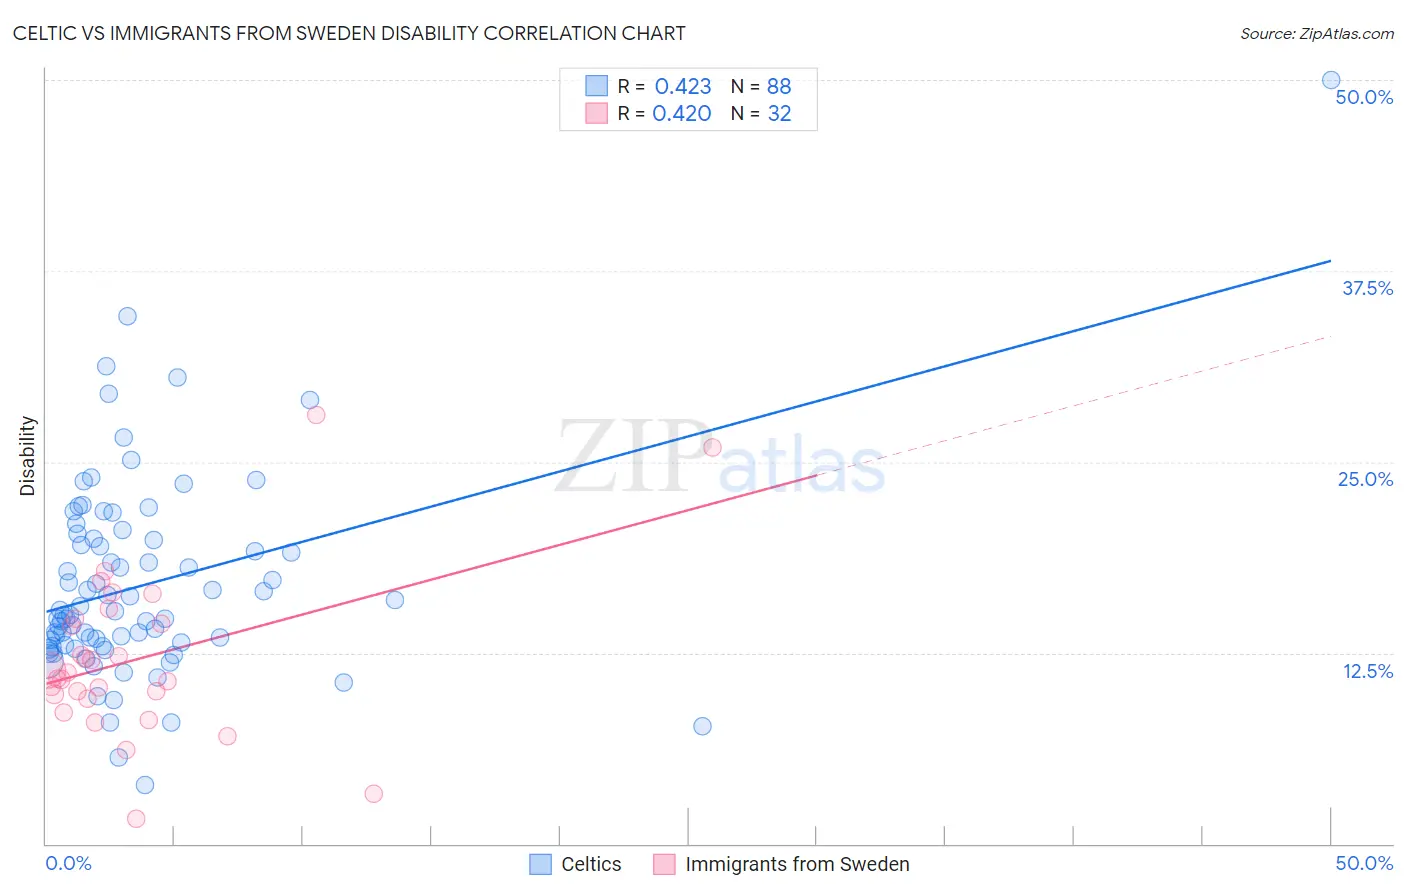
Celtic vs Immigrants from Sweden Disability Correlation Chart
The statistical analysis conducted on geographies consisting of 168,868,984 people shows a moderate positive correlation between the proportion of Celtics and percentage of population with a disability in the United States with a correlation coefficient (R) of 0.423 and weighted average of 13.1%. Similarly, the statistical analysis conducted on geographies consisting of 164,749,028 people shows a moderate positive correlation between the proportion of Immigrants from Sweden and percentage of population with a disability in the United States with a correlation coefficient (R) of 0.420 and weighted average of 11.0%, a difference of 19.7%.
Disability Correlation Summary
| Measurement | Celtic | Immigrants from Sweden |
| Minimum | 3.8% | 1.7% |
| Maximum | 50.0% | 28.1% |
| Range | 46.2% | 26.4% |
| Mean | 16.9% | 12.1% |
| Median | 15.1% | 11.0% |
| Interquartile 25% (IQ1) | 13.0% | 9.6% |
| Interquartile 75% (IQ3) | 19.9% | 14.6% |
| Interquartile Range (IQR) | 6.9% | 4.9% |
| Standard Deviation (Sample) | 6.7% | 5.4% |
| Standard Deviation (Population) | 6.7% | 5.3% |
Similar Demographics by Disability
Demographics Similar to Celtics by Disability
In terms of disability, the demographic groups most similar to Celtics are Nonimmigrants (13.2%, a difference of 0.12%), Central American Indian (13.2%, a difference of 0.16%), Hopi (13.2%, a difference of 0.22%), Alaska Native (13.2%, a difference of 0.23%), and French (13.2%, a difference of 0.25%).
| Demographics | Rating | Rank | Disability |
| Africans | 0.0 /100 | #287 | Tragic 13.0% |
| Whites/Caucasians | 0.0 /100 | #288 | Tragic 13.0% |
| Slovaks | 0.0 /100 | #289 | Tragic 13.0% |
| Cheyenne | 0.0 /100 | #290 | Tragic 13.0% |
| Yaqui | 0.0 /100 | #291 | Tragic 13.1% |
| Aleuts | 0.0 /100 | #292 | Tragic 13.1% |
| Marshallese | 0.0 /100 | #293 | Tragic 13.1% |
| Celtics | 0.0 /100 | #294 | Tragic 13.1% |
| Immigrants | Nonimmigrants | 0.0 /100 | #295 | Tragic 13.2% |
| Central American Indians | 0.0 /100 | #296 | Tragic 13.2% |
| Hopi | 0.0 /100 | #297 | Tragic 13.2% |
| Alaska Natives | 0.0 /100 | #298 | Tragic 13.2% |
| French | 0.0 /100 | #299 | Tragic 13.2% |
| Pennsylvania Germans | 0.0 /100 | #300 | Tragic 13.2% |
| Immigrants | Micronesia | 0.0 /100 | #301 | Tragic 13.2% |
Demographics Similar to Immigrants from Sweden by Disability
In terms of disability, the demographic groups most similar to Immigrants from Sweden are Bulgarian (11.0%, a difference of 0.020%), Laotian (11.0%, a difference of 0.030%), Colombian (11.0%, a difference of 0.11%), Immigrants from Eritrea (11.0%, a difference of 0.18%), and Immigrants from Northern Africa (10.9%, a difference of 0.20%).
| Demographics | Rating | Rank | Disability |
| Salvadorans | 99.8 /100 | #57 | Exceptional 10.9% |
| Immigrants | South America | 99.8 /100 | #58 | Exceptional 10.9% |
| Immigrants | Colombia | 99.7 /100 | #59 | Exceptional 10.9% |
| Zimbabweans | 99.7 /100 | #60 | Exceptional 10.9% |
| Immigrants | Bulgaria | 99.7 /100 | #61 | Exceptional 10.9% |
| Immigrants | Northern Africa | 99.7 /100 | #62 | Exceptional 10.9% |
| Immigrants | Eritrea | 99.7 /100 | #63 | Exceptional 11.0% |
| Immigrants | Sweden | 99.6 /100 | #64 | Exceptional 11.0% |
| Bulgarians | 99.6 /100 | #65 | Exceptional 11.0% |
| Laotians | 99.6 /100 | #66 | Exceptional 11.0% |
| Colombians | 99.6 /100 | #67 | Exceptional 11.0% |
| Immigrants | Afghanistan | 99.6 /100 | #68 | Exceptional 11.0% |
| Sri Lankans | 99.5 /100 | #69 | Exceptional 11.0% |
| Immigrants | France | 99.4 /100 | #70 | Exceptional 11.0% |
| Immigrants | Lebanon | 99.4 /100 | #71 | Exceptional 11.0% |