Carpatho Rusyn vs Chickasaw Ambulatory Disability
COMPARE
Carpatho Rusyn
Chickasaw
Ambulatory Disability
Ambulatory Disability Comparison
Carpatho Rusyns
Chickasaw
6.2%
AMBULATORY DISABILITY
35.3/ 100
METRIC RATING
187th/ 347
METRIC RANK
8.0%
AMBULATORY DISABILITY
0.0/ 100
METRIC RATING
335th/ 347
METRIC RANK
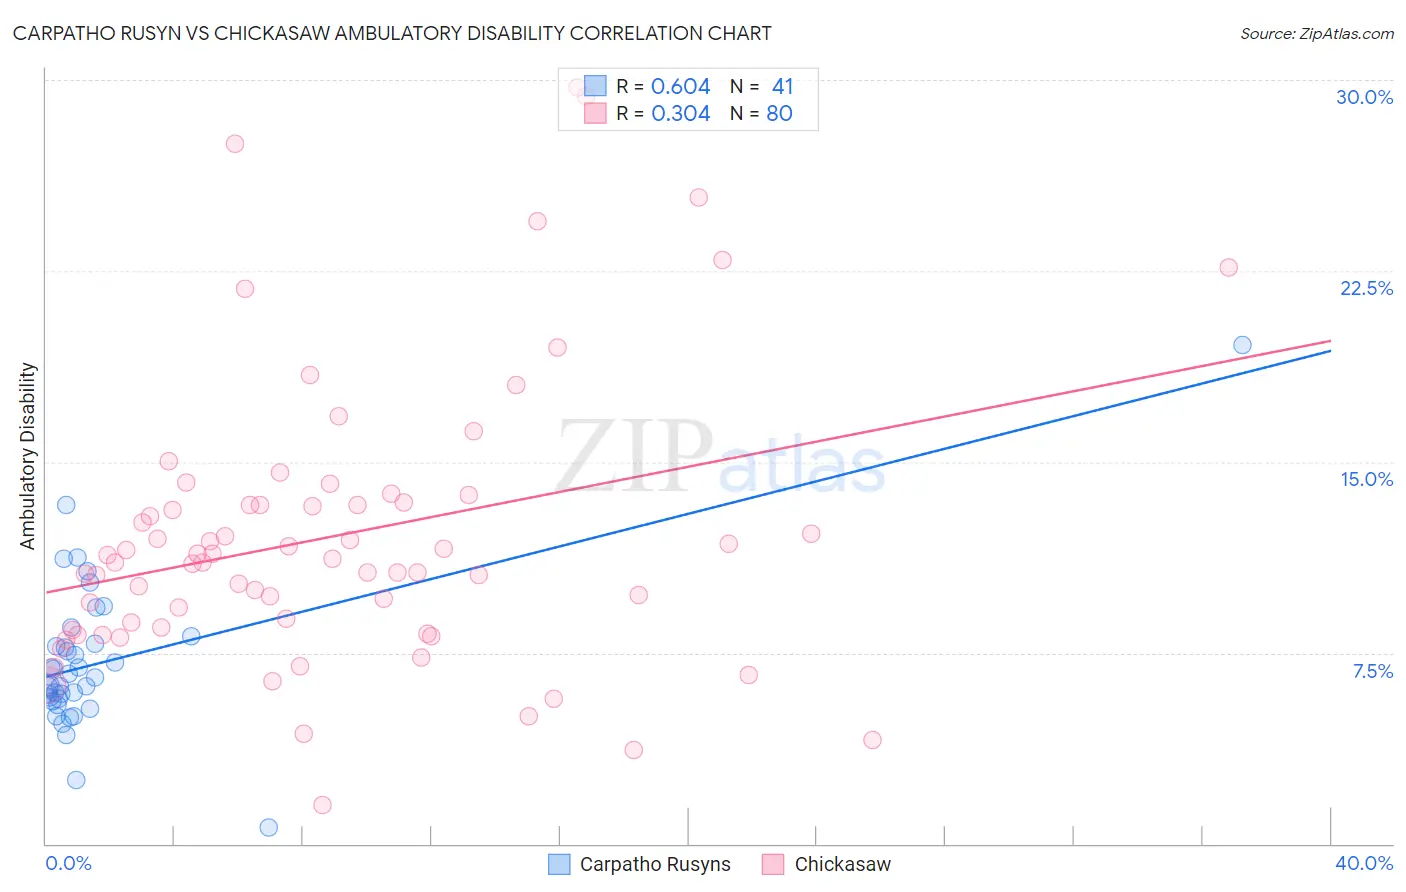
Carpatho Rusyn vs Chickasaw Ambulatory Disability Correlation Chart
The statistical analysis conducted on geographies consisting of 58,871,605 people shows a significant positive correlation between the proportion of Carpatho Rusyns and percentage of population with ambulatory disability in the United States with a correlation coefficient (R) of 0.604 and weighted average of 6.2%. Similarly, the statistical analysis conducted on geographies consisting of 147,679,473 people shows a mild positive correlation between the proportion of Chickasaw and percentage of population with ambulatory disability in the United States with a correlation coefficient (R) of 0.304 and weighted average of 8.0%, a difference of 30.3%.
Ambulatory Disability Correlation Summary
| Measurement | Carpatho Rusyn | Chickasaw |
| Minimum | 0.63% | 1.5% |
| Maximum | 19.6% | 29.7% |
| Range | 19.0% | 28.2% |
| Mean | 7.2% | 12.1% |
| Median | 6.5% | 11.1% |
| Interquartile 25% (IQ1) | 5.7% | 8.4% |
| Interquartile 75% (IQ3) | 8.0% | 13.4% |
| Interquartile Range (IQR) | 2.3% | 4.9% |
| Standard Deviation (Sample) | 3.1% | 5.6% |
| Standard Deviation (Population) | 3.0% | 5.6% |
Similar Demographics by Ambulatory Disability
Demographics Similar to Carpatho Rusyns by Ambulatory Disability
In terms of ambulatory disability, the demographic groups most similar to Carpatho Rusyns are European (6.2%, a difference of 0.050%), British (6.2%, a difference of 0.060%), Ukrainian (6.2%, a difference of 0.080%), Immigrants from Bosnia and Herzegovina (6.2%, a difference of 0.11%), and Immigrants from Western Africa (6.2%, a difference of 0.12%).
| Demographics | Rating | Rank | Ambulatory Disability |
| Immigrants | Nicaragua | 43.9 /100 | #180 | Average 6.1% |
| Swiss | 43.1 /100 | #181 | Average 6.1% |
| Serbians | 42.8 /100 | #182 | Average 6.1% |
| Immigrants | Thailand | 42.2 /100 | #183 | Average 6.1% |
| Immigrants | Ghana | 41.2 /100 | #184 | Average 6.1% |
| Immigrants | Bosnia and Herzegovina | 37.2 /100 | #185 | Fair 6.2% |
| Europeans | 36.2 /100 | #186 | Fair 6.2% |
| Carpatho Rusyns | 35.3 /100 | #187 | Fair 6.2% |
| British | 34.3 /100 | #188 | Fair 6.2% |
| Ukrainians | 34.0 /100 | #189 | Fair 6.2% |
| Immigrants | Western Africa | 33.4 /100 | #190 | Fair 6.2% |
| Immigrants | Guatemala | 31.9 /100 | #191 | Fair 6.2% |
| Immigrants | Western Europe | 31.6 /100 | #192 | Fair 6.2% |
| Guatemalans | 30.0 /100 | #193 | Fair 6.2% |
| Alaska Natives | 29.8 /100 | #194 | Fair 6.2% |
Demographics Similar to Chickasaw by Ambulatory Disability
In terms of ambulatory disability, the demographic groups most similar to Chickasaw are Seminole (8.0%, a difference of 0.070%), Yuman (7.9%, a difference of 1.1%), Dutch West Indian (8.2%, a difference of 1.7%), Cherokee (7.9%, a difference of 2.1%), and Colville (8.2%, a difference of 2.3%).
| Demographics | Rating | Rank | Ambulatory Disability |
| Hopi | 0.0 /100 | #328 | Tragic 7.6% |
| Pueblo | 0.0 /100 | #329 | Tragic 7.6% |
| Paiute | 0.0 /100 | #330 | Tragic 7.7% |
| Cajuns | 0.0 /100 | #331 | Tragic 7.8% |
| Menominee | 0.0 /100 | #332 | Tragic 7.8% |
| Cherokee | 0.0 /100 | #333 | Tragic 7.9% |
| Yuman | 0.0 /100 | #334 | Tragic 7.9% |
| Chickasaw | 0.0 /100 | #335 | Tragic 8.0% |
| Seminole | 0.0 /100 | #336 | Tragic 8.0% |
| Dutch West Indians | 0.0 /100 | #337 | Tragic 8.2% |
| Colville | 0.0 /100 | #338 | Tragic 8.2% |
| Pima | 0.0 /100 | #339 | Tragic 8.2% |
| Choctaw | 0.0 /100 | #340 | Tragic 8.3% |
| Creek | 0.0 /100 | #341 | Tragic 8.5% |
| Kiowa | 0.0 /100 | #342 | Tragic 8.6% |