Carpatho Rusyn vs Chickasaw 5th Grade
COMPARE
Carpatho Rusyn
Chickasaw
5th Grade
5th Grade Comparison
Carpatho Rusyns
Chickasaw
98.3%
5TH GRADE
100.0/ 100
METRIC RATING
12th/ 347
METRIC RANK
97.9%
5TH GRADE
99.5/ 100
METRIC RATING
71st/ 347
METRIC RANK
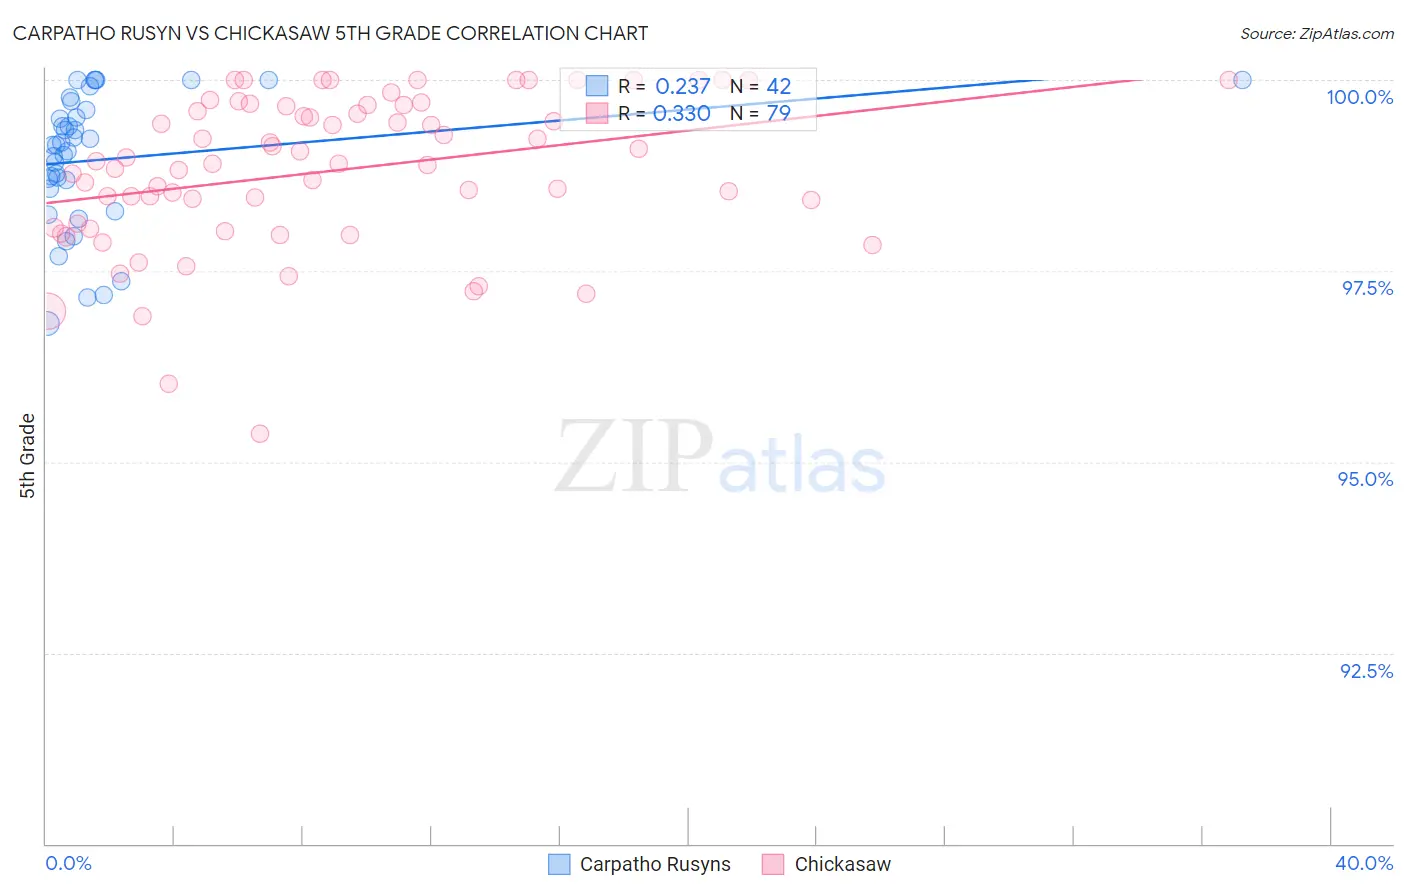
Carpatho Rusyn vs Chickasaw 5th Grade Correlation Chart
The statistical analysis conducted on geographies consisting of 58,871,690 people shows a weak positive correlation between the proportion of Carpatho Rusyns and percentage of population with at least 5th grade education in the United States with a correlation coefficient (R) of 0.237 and weighted average of 98.3%. Similarly, the statistical analysis conducted on geographies consisting of 147,726,545 people shows a mild positive correlation between the proportion of Chickasaw and percentage of population with at least 5th grade education in the United States with a correlation coefficient (R) of 0.330 and weighted average of 97.9%, a difference of 0.45%.
5th Grade Correlation Summary
| Measurement | Carpatho Rusyn | Chickasaw |
| Minimum | 96.8% | 95.4% |
| Maximum | 100.0% | 100.0% |
| Range | 3.2% | 4.6% |
| Mean | 99.0% | 98.8% |
| Median | 99.1% | 98.9% |
| Interquartile 25% (IQ1) | 98.6% | 98.1% |
| Interquartile 75% (IQ3) | 99.6% | 99.7% |
| Interquartile Range (IQR) | 1.0% | 1.6% |
| Standard Deviation (Sample) | 0.87% | 1.0% |
| Standard Deviation (Population) | 0.86% | 1.00% |
Similar Demographics by 5th Grade
Demographics Similar to Carpatho Rusyns by 5th Grade
In terms of 5th grade, the demographic groups most similar to Carpatho Rusyns are Swedish (98.3%, a difference of 0.010%), English (98.3%, a difference of 0.010%), Alaskan Athabascan (98.3%, a difference of 0.010%), Tlingit-Haida (98.3%, a difference of 0.010%), and Dutch (98.3%, a difference of 0.020%).
| Demographics | Rating | Rank | 5th Grade |
| Slovaks | 100.0 /100 | #5 | Exceptional 98.4% |
| Germans | 100.0 /100 | #6 | Exceptional 98.4% |
| Inupiat | 100.0 /100 | #7 | Exceptional 98.4% |
| Slovenes | 100.0 /100 | #8 | Exceptional 98.3% |
| Swedes | 100.0 /100 | #9 | Exceptional 98.3% |
| English | 100.0 /100 | #10 | Exceptional 98.3% |
| Alaskan Athabascans | 100.0 /100 | #11 | Exceptional 98.3% |
| Carpatho Rusyns | 100.0 /100 | #12 | Exceptional 98.3% |
| Tlingit-Haida | 100.0 /100 | #13 | Exceptional 98.3% |
| Dutch | 100.0 /100 | #14 | Exceptional 98.3% |
| Scottish | 100.0 /100 | #15 | Exceptional 98.3% |
| Poles | 100.0 /100 | #16 | Exceptional 98.3% |
| Irish | 100.0 /100 | #17 | Exceptional 98.3% |
| Pennsylvania Germans | 100.0 /100 | #18 | Exceptional 98.3% |
| Finns | 100.0 /100 | #19 | Exceptional 98.2% |
Demographics Similar to Chickasaw by 5th Grade
In terms of 5th grade, the demographic groups most similar to Chickasaw are Iranian (97.9%, a difference of 0.0%), Kiowa (97.9%, a difference of 0.010%), Macedonian (97.9%, a difference of 0.010%), Cajun (97.9%, a difference of 0.020%), and Cherokee (97.8%, a difference of 0.020%).
| Demographics | Rating | Rank | 5th Grade |
| Immigrants | Northern Europe | 99.6 /100 | #64 | Exceptional 97.9% |
| Canadians | 99.6 /100 | #65 | Exceptional 97.9% |
| Immigrants | Austria | 99.6 /100 | #66 | Exceptional 97.9% |
| New Zealanders | 99.6 /100 | #67 | Exceptional 97.9% |
| Cajuns | 99.6 /100 | #68 | Exceptional 97.9% |
| Kiowa | 99.5 /100 | #69 | Exceptional 97.9% |
| Iranians | 99.5 /100 | #70 | Exceptional 97.9% |
| Chickasaw | 99.5 /100 | #71 | Exceptional 97.9% |
| Macedonians | 99.4 /100 | #72 | Exceptional 97.9% |
| Cherokee | 99.4 /100 | #73 | Exceptional 97.8% |
| Lumbee | 99.3 /100 | #74 | Exceptional 97.8% |
| Ukrainians | 99.3 /100 | #75 | Exceptional 97.8% |
| Immigrants | Netherlands | 99.3 /100 | #76 | Exceptional 97.8% |
| Immigrants | England | 99.3 /100 | #77 | Exceptional 97.8% |
| Osage | 99.3 /100 | #78 | Exceptional 97.8% |