Mongolian vs Chickasaw Ambulatory Disability
COMPARE
Mongolian
Chickasaw
Ambulatory Disability
Ambulatory Disability Comparison
Mongolians
Chickasaw
5.5%
AMBULATORY DISABILITY
99.9/ 100
METRIC RATING
41st/ 347
METRIC RANK
8.0%
AMBULATORY DISABILITY
0.0/ 100
METRIC RATING
335th/ 347
METRIC RANK
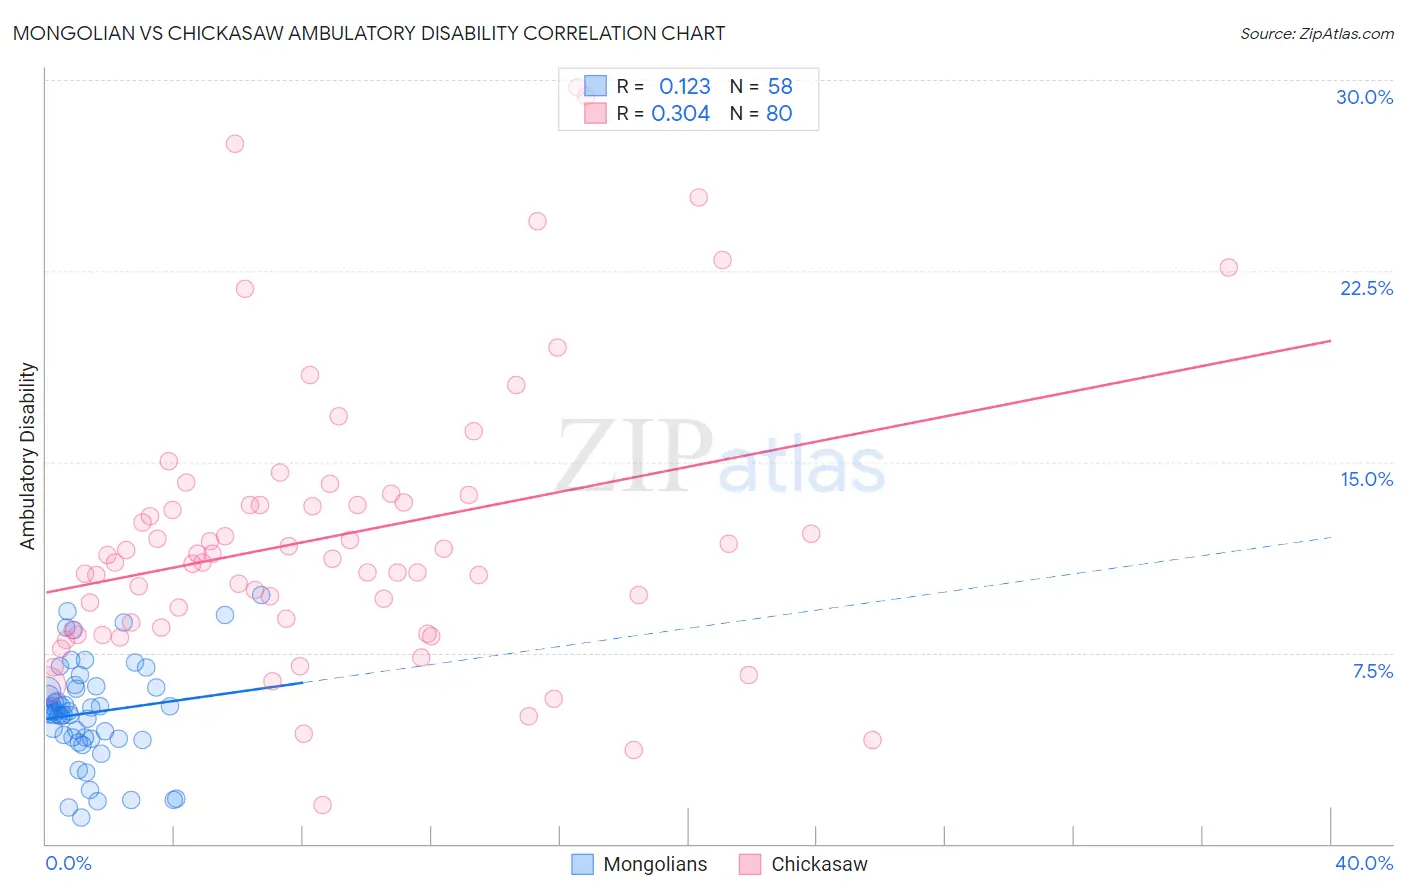
Mongolian vs Chickasaw Ambulatory Disability Correlation Chart
The statistical analysis conducted on geographies consisting of 140,347,726 people shows a poor positive correlation between the proportion of Mongolians and percentage of population with ambulatory disability in the United States with a correlation coefficient (R) of 0.123 and weighted average of 5.5%. Similarly, the statistical analysis conducted on geographies consisting of 147,679,473 people shows a mild positive correlation between the proportion of Chickasaw and percentage of population with ambulatory disability in the United States with a correlation coefficient (R) of 0.304 and weighted average of 8.0%, a difference of 45.9%.
Ambulatory Disability Correlation Summary
| Measurement | Mongolian | Chickasaw |
| Minimum | 1.0% | 1.5% |
| Maximum | 9.8% | 29.7% |
| Range | 8.7% | 28.2% |
| Mean | 5.2% | 12.1% |
| Median | 5.2% | 11.1% |
| Interquartile 25% (IQ1) | 4.1% | 8.4% |
| Interquartile 75% (IQ3) | 6.1% | 13.4% |
| Interquartile Range (IQR) | 2.0% | 4.9% |
| Standard Deviation (Sample) | 2.0% | 5.6% |
| Standard Deviation (Population) | 2.0% | 5.6% |
Similar Demographics by Ambulatory Disability
Demographics Similar to Mongolians by Ambulatory Disability
In terms of ambulatory disability, the demographic groups most similar to Mongolians are Venezuelan (5.5%, a difference of 0.080%), Argentinean (5.5%, a difference of 0.080%), Immigrants from Eritrea (5.5%, a difference of 0.42%), Turkish (5.5%, a difference of 0.51%), and Cypriot (5.5%, a difference of 0.51%).
| Demographics | Rating | Rank | Ambulatory Disability |
| Immigrants | Asia | 100.0 /100 | #34 | Exceptional 5.5% |
| Afghans | 100.0 /100 | #35 | Exceptional 5.5% |
| Immigrants | Malaysia | 100.0 /100 | #36 | Exceptional 5.5% |
| Turks | 100.0 /100 | #37 | Exceptional 5.5% |
| Cypriots | 100.0 /100 | #38 | Exceptional 5.5% |
| Immigrants | Eritrea | 100.0 /100 | #39 | Exceptional 5.5% |
| Venezuelans | 99.9 /100 | #40 | Exceptional 5.5% |
| Mongolians | 99.9 /100 | #41 | Exceptional 5.5% |
| Argentineans | 99.9 /100 | #42 | Exceptional 5.5% |
| Paraguayans | 99.9 /100 | #43 | Exceptional 5.5% |
| Immigrants | Indonesia | 99.9 /100 | #44 | Exceptional 5.5% |
| Immigrants | Sweden | 99.9 /100 | #45 | Exceptional 5.6% |
| Egyptians | 99.9 /100 | #46 | Exceptional 5.6% |
| Immigrants | Japan | 99.9 /100 | #47 | Exceptional 5.6% |
| Immigrants | Argentina | 99.9 /100 | #48 | Exceptional 5.6% |
Demographics Similar to Chickasaw by Ambulatory Disability
In terms of ambulatory disability, the demographic groups most similar to Chickasaw are Seminole (8.0%, a difference of 0.070%), Yuman (7.9%, a difference of 1.1%), Dutch West Indian (8.2%, a difference of 1.7%), Cherokee (7.9%, a difference of 2.1%), and Colville (8.2%, a difference of 2.3%).
| Demographics | Rating | Rank | Ambulatory Disability |
| Hopi | 0.0 /100 | #328 | Tragic 7.6% |
| Pueblo | 0.0 /100 | #329 | Tragic 7.6% |
| Paiute | 0.0 /100 | #330 | Tragic 7.7% |
| Cajuns | 0.0 /100 | #331 | Tragic 7.8% |
| Menominee | 0.0 /100 | #332 | Tragic 7.8% |
| Cherokee | 0.0 /100 | #333 | Tragic 7.9% |
| Yuman | 0.0 /100 | #334 | Tragic 7.9% |
| Chickasaw | 0.0 /100 | #335 | Tragic 8.0% |
| Seminole | 0.0 /100 | #336 | Tragic 8.0% |
| Dutch West Indians | 0.0 /100 | #337 | Tragic 8.2% |
| Colville | 0.0 /100 | #338 | Tragic 8.2% |
| Pima | 0.0 /100 | #339 | Tragic 8.2% |
| Choctaw | 0.0 /100 | #340 | Tragic 8.3% |
| Creek | 0.0 /100 | #341 | Tragic 8.5% |
| Kiowa | 0.0 /100 | #342 | Tragic 8.6% |