Carpatho Rusyn vs Scottish Ambulatory Disability
COMPARE
Carpatho Rusyn
Scottish
Ambulatory Disability
Ambulatory Disability Comparison
Carpatho Rusyns
Scottish
6.2%
AMBULATORY DISABILITY
35.3/ 100
METRIC RATING
187th/ 347
METRIC RANK
6.5%
AMBULATORY DISABILITY
0.7/ 100
METRIC RATING
253rd/ 347
METRIC RANK
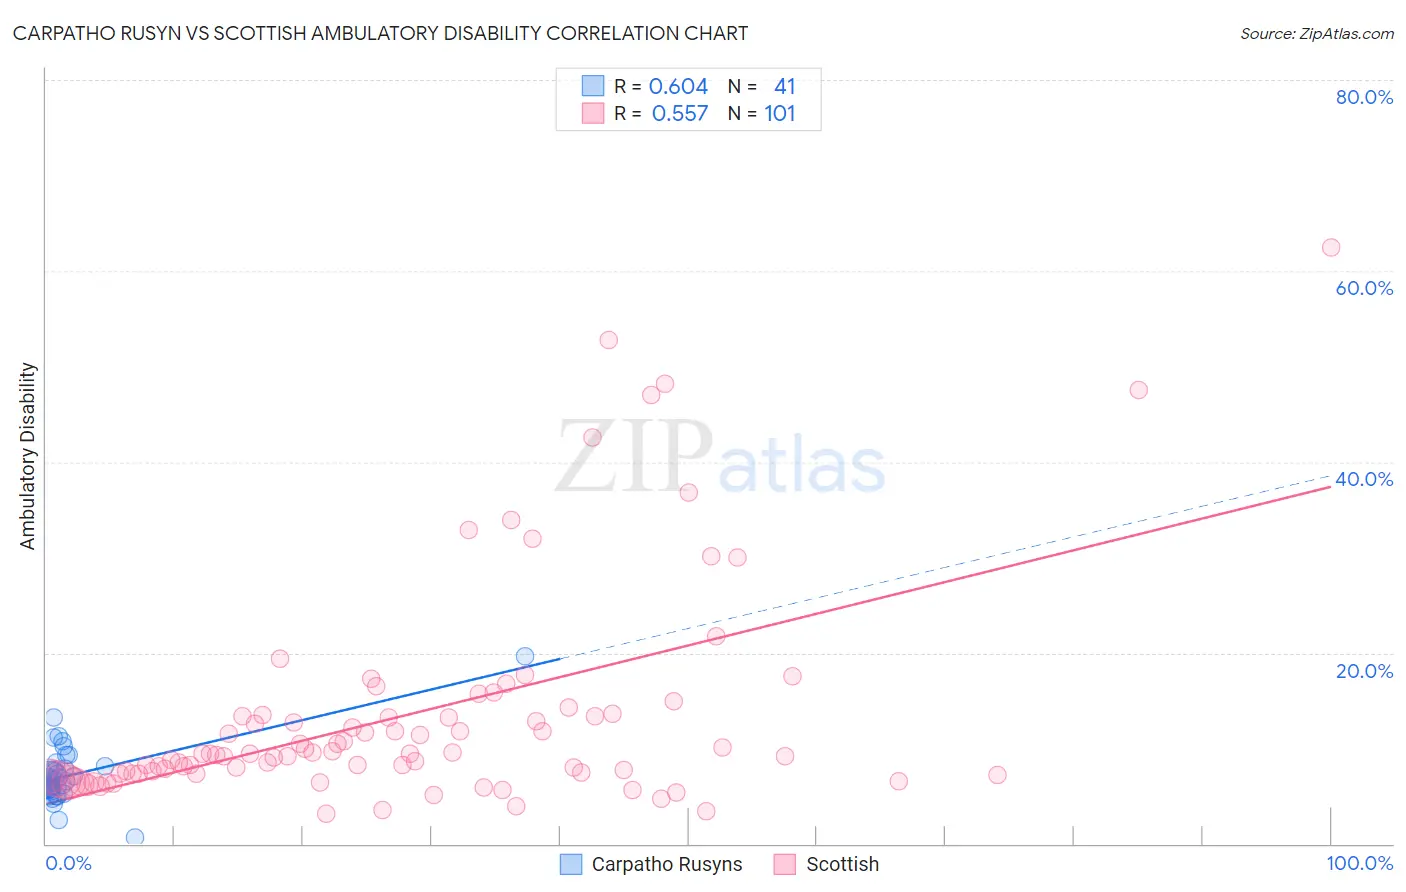
Carpatho Rusyn vs Scottish Ambulatory Disability Correlation Chart
The statistical analysis conducted on geographies consisting of 58,871,605 people shows a significant positive correlation between the proportion of Carpatho Rusyns and percentage of population with ambulatory disability in the United States with a correlation coefficient (R) of 0.604 and weighted average of 6.2%. Similarly, the statistical analysis conducted on geographies consisting of 566,616,487 people shows a substantial positive correlation between the proportion of Scottish and percentage of population with ambulatory disability in the United States with a correlation coefficient (R) of 0.557 and weighted average of 6.5%, a difference of 5.6%.
Ambulatory Disability Correlation Summary
| Measurement | Carpatho Rusyn | Scottish |
| Minimum | 0.63% | 3.1% |
| Maximum | 19.6% | 62.5% |
| Range | 19.0% | 59.4% |
| Mean | 7.2% | 13.4% |
| Median | 6.5% | 9.4% |
| Interquartile 25% (IQ1) | 5.7% | 7.3% |
| Interquartile 75% (IQ3) | 8.0% | 13.4% |
| Interquartile Range (IQR) | 2.3% | 6.1% |
| Standard Deviation (Sample) | 3.1% | 11.4% |
| Standard Deviation (Population) | 3.0% | 11.4% |
Similar Demographics by Ambulatory Disability
Demographics Similar to Carpatho Rusyns by Ambulatory Disability
In terms of ambulatory disability, the demographic groups most similar to Carpatho Rusyns are European (6.2%, a difference of 0.050%), British (6.2%, a difference of 0.060%), Ukrainian (6.2%, a difference of 0.080%), Immigrants from Bosnia and Herzegovina (6.2%, a difference of 0.11%), and Immigrants from Western Africa (6.2%, a difference of 0.12%).
| Demographics | Rating | Rank | Ambulatory Disability |
| Immigrants | Nicaragua | 43.9 /100 | #180 | Average 6.1% |
| Swiss | 43.1 /100 | #181 | Average 6.1% |
| Serbians | 42.8 /100 | #182 | Average 6.1% |
| Immigrants | Thailand | 42.2 /100 | #183 | Average 6.1% |
| Immigrants | Ghana | 41.2 /100 | #184 | Average 6.1% |
| Immigrants | Bosnia and Herzegovina | 37.2 /100 | #185 | Fair 6.2% |
| Europeans | 36.2 /100 | #186 | Fair 6.2% |
| Carpatho Rusyns | 35.3 /100 | #187 | Fair 6.2% |
| British | 34.3 /100 | #188 | Fair 6.2% |
| Ukrainians | 34.0 /100 | #189 | Fair 6.2% |
| Immigrants | Western Africa | 33.4 /100 | #190 | Fair 6.2% |
| Immigrants | Guatemala | 31.9 /100 | #191 | Fair 6.2% |
| Immigrants | Western Europe | 31.6 /100 | #192 | Fair 6.2% |
| Guatemalans | 30.0 /100 | #193 | Fair 6.2% |
| Alaska Natives | 29.8 /100 | #194 | Fair 6.2% |
Demographics Similar to Scottish by Ambulatory Disability
In terms of ambulatory disability, the demographic groups most similar to Scottish are Immigrants from Bahamas (6.5%, a difference of 0.050%), Belizean (6.5%, a difference of 0.16%), Welsh (6.5%, a difference of 0.23%), Hawaiian (6.5%, a difference of 0.25%), and Immigrants from Uzbekistan (6.5%, a difference of 0.30%).
| Demographics | Rating | Rank | Ambulatory Disability |
| Armenians | 1.5 /100 | #246 | Tragic 6.5% |
| Immigrants | Cuba | 1.4 /100 | #247 | Tragic 6.5% |
| Immigrants | Portugal | 1.4 /100 | #248 | Tragic 6.5% |
| Native Hawaiians | 1.1 /100 | #249 | Tragic 6.5% |
| Chinese | 1.0 /100 | #250 | Tragic 6.5% |
| Hawaiians | 0.9 /100 | #251 | Tragic 6.5% |
| Immigrants | Bahamas | 0.8 /100 | #252 | Tragic 6.5% |
| Scottish | 0.7 /100 | #253 | Tragic 6.5% |
| Belizeans | 0.7 /100 | #254 | Tragic 6.5% |
| Welsh | 0.6 /100 | #255 | Tragic 6.5% |
| Immigrants | Uzbekistan | 0.6 /100 | #256 | Tragic 6.5% |
| Bermudans | 0.5 /100 | #257 | Tragic 6.5% |
| Spanish American Indians | 0.5 /100 | #258 | Tragic 6.5% |
| Aleuts | 0.4 /100 | #259 | Tragic 6.6% |
| Immigrants | Belize | 0.4 /100 | #260 | Tragic 6.6% |