Carpatho Rusyn vs Lebanese Ambulatory Disability
COMPARE
Carpatho Rusyn
Lebanese
Ambulatory Disability
Ambulatory Disability Comparison
Carpatho Rusyns
Lebanese
6.2%
AMBULATORY DISABILITY
35.3/ 100
METRIC RATING
187th/ 347
METRIC RANK
6.1%
AMBULATORY DISABILITY
66.2/ 100
METRIC RATING
163rd/ 347
METRIC RANK
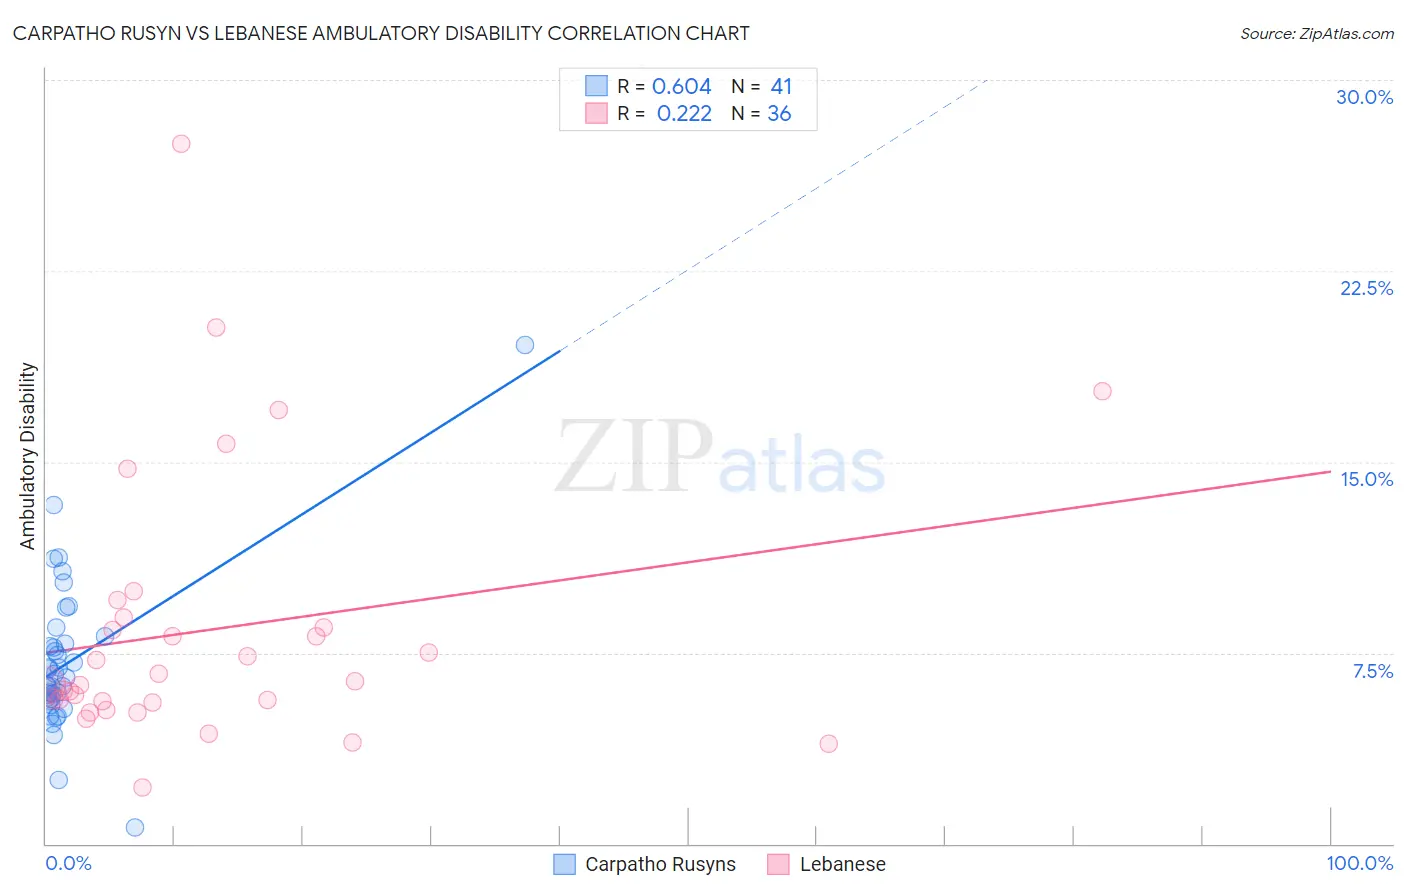
Carpatho Rusyn vs Lebanese Ambulatory Disability Correlation Chart
The statistical analysis conducted on geographies consisting of 58,871,605 people shows a significant positive correlation between the proportion of Carpatho Rusyns and percentage of population with ambulatory disability in the United States with a correlation coefficient (R) of 0.604 and weighted average of 6.2%. Similarly, the statistical analysis conducted on geographies consisting of 401,495,735 people shows a weak positive correlation between the proportion of Lebanese and percentage of population with ambulatory disability in the United States with a correlation coefficient (R) of 0.222 and weighted average of 6.1%, a difference of 1.7%.
Ambulatory Disability Correlation Summary
| Measurement | Carpatho Rusyn | Lebanese |
| Minimum | 0.63% | 2.2% |
| Maximum | 19.6% | 27.5% |
| Range | 19.0% | 25.3% |
| Mean | 7.2% | 8.4% |
| Median | 6.5% | 6.3% |
| Interquartile 25% (IQ1) | 5.7% | 5.6% |
| Interquartile 75% (IQ3) | 8.0% | 8.7% |
| Interquartile Range (IQR) | 2.3% | 3.1% |
| Standard Deviation (Sample) | 3.1% | 5.3% |
| Standard Deviation (Population) | 3.0% | 5.2% |
Similar Demographics by Ambulatory Disability
Demographics Similar to Carpatho Rusyns by Ambulatory Disability
In terms of ambulatory disability, the demographic groups most similar to Carpatho Rusyns are European (6.2%, a difference of 0.050%), British (6.2%, a difference of 0.060%), Ukrainian (6.2%, a difference of 0.080%), Immigrants from Bosnia and Herzegovina (6.2%, a difference of 0.11%), and Immigrants from Western Africa (6.2%, a difference of 0.12%).
| Demographics | Rating | Rank | Ambulatory Disability |
| Immigrants | Nicaragua | 43.9 /100 | #180 | Average 6.1% |
| Swiss | 43.1 /100 | #181 | Average 6.1% |
| Serbians | 42.8 /100 | #182 | Average 6.1% |
| Immigrants | Thailand | 42.2 /100 | #183 | Average 6.1% |
| Immigrants | Ghana | 41.2 /100 | #184 | Average 6.1% |
| Immigrants | Bosnia and Herzegovina | 37.2 /100 | #185 | Fair 6.2% |
| Europeans | 36.2 /100 | #186 | Fair 6.2% |
| Carpatho Rusyns | 35.3 /100 | #187 | Fair 6.2% |
| British | 34.3 /100 | #188 | Fair 6.2% |
| Ukrainians | 34.0 /100 | #189 | Fair 6.2% |
| Immigrants | Western Africa | 33.4 /100 | #190 | Fair 6.2% |
| Immigrants | Guatemala | 31.9 /100 | #191 | Fair 6.2% |
| Immigrants | Western Europe | 31.6 /100 | #192 | Fair 6.2% |
| Guatemalans | 30.0 /100 | #193 | Fair 6.2% |
| Alaska Natives | 29.8 /100 | #194 | Fair 6.2% |
Demographics Similar to Lebanese by Ambulatory Disability
In terms of ambulatory disability, the demographic groups most similar to Lebanese are Nigerian (6.1%, a difference of 0.050%), Basque (6.1%, a difference of 0.15%), Immigrants from Belarus (6.1%, a difference of 0.18%), Nicaraguan (6.1%, a difference of 0.18%), and Iraqi (6.1%, a difference of 0.20%).
| Demographics | Rating | Rank | Ambulatory Disability |
| Northern Europeans | 71.8 /100 | #156 | Good 6.0% |
| Ghanaians | 71.3 /100 | #157 | Good 6.0% |
| Immigrants | Fiji | 71.2 /100 | #158 | Good 6.0% |
| Immigrants | Latvia | 71.1 /100 | #159 | Good 6.0% |
| Central Americans | 69.8 /100 | #160 | Good 6.0% |
| Immigrants | Belarus | 69.2 /100 | #161 | Good 6.1% |
| Nigerians | 67.1 /100 | #162 | Good 6.1% |
| Lebanese | 66.2 /100 | #163 | Good 6.1% |
| Basques | 63.7 /100 | #164 | Good 6.1% |
| Nicaraguans | 63.2 /100 | #165 | Good 6.1% |
| Iraqis | 62.8 /100 | #166 | Good 6.1% |
| Immigrants | Oceania | 60.7 /100 | #167 | Good 6.1% |
| Ecuadorians | 60.5 /100 | #168 | Good 6.1% |
| Immigrants | Southern Europe | 58.1 /100 | #169 | Average 6.1% |
| Immigrants | Ecuador | 53.8 /100 | #170 | Average 6.1% |