Carpatho Rusyn vs Immigrants from Switzerland Ambulatory Disability
COMPARE
Carpatho Rusyn
Immigrants from Switzerland
Ambulatory Disability
Ambulatory Disability Comparison
Carpatho Rusyns
Immigrants from Switzerland
6.2%
AMBULATORY DISABILITY
35.3/ 100
METRIC RATING
187th/ 347
METRIC RANK
5.7%
AMBULATORY DISABILITY
99.7/ 100
METRIC RATING
65th/ 347
METRIC RANK
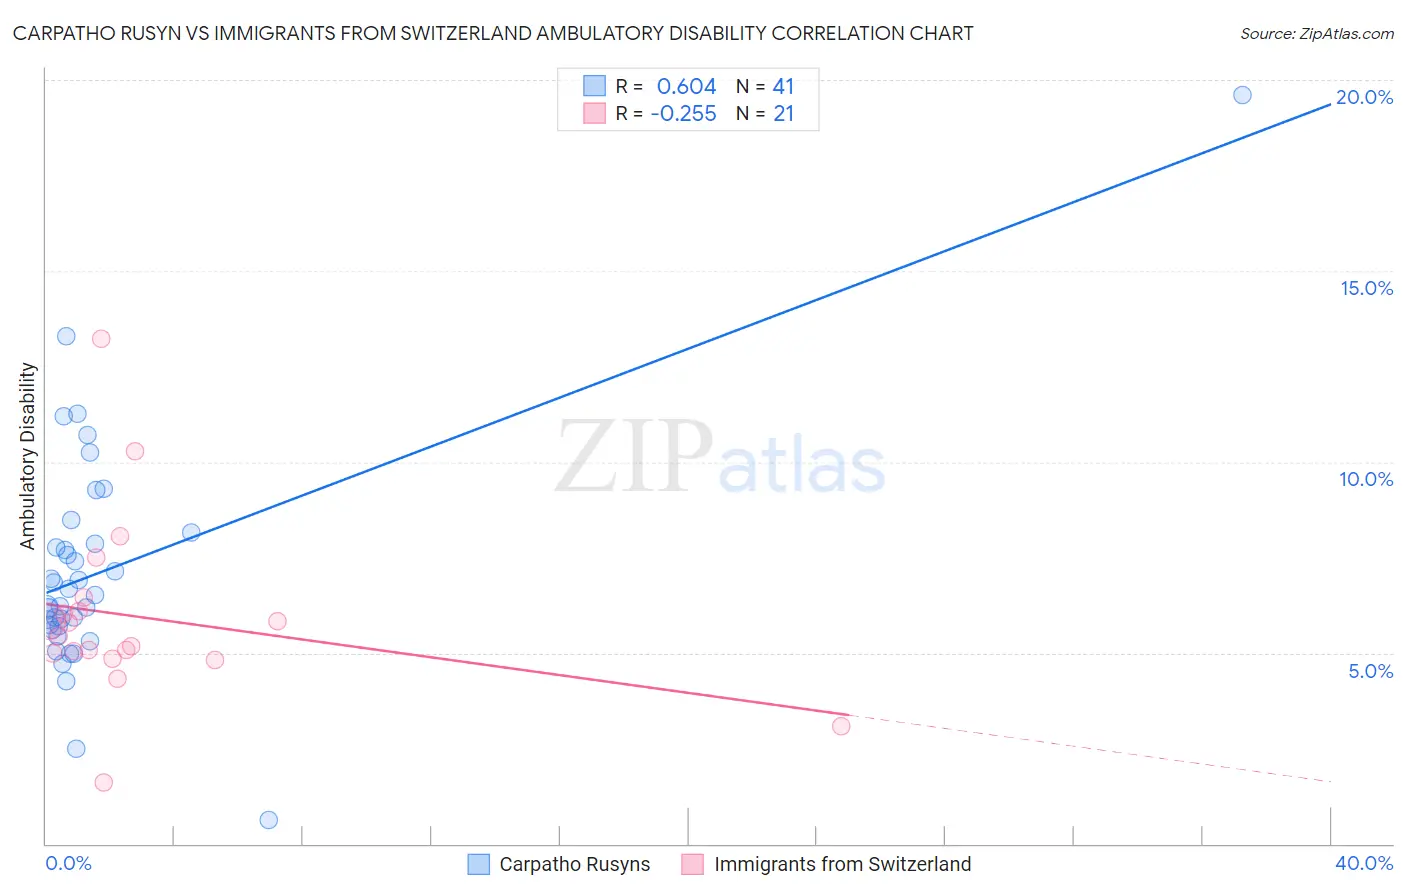
Carpatho Rusyn vs Immigrants from Switzerland Ambulatory Disability Correlation Chart
The statistical analysis conducted on geographies consisting of 58,871,605 people shows a significant positive correlation between the proportion of Carpatho Rusyns and percentage of population with ambulatory disability in the United States with a correlation coefficient (R) of 0.604 and weighted average of 6.2%. Similarly, the statistical analysis conducted on geographies consisting of 148,074,986 people shows a weak negative correlation between the proportion of Immigrants from Switzerland and percentage of population with ambulatory disability in the United States with a correlation coefficient (R) of -0.255 and weighted average of 5.7%, a difference of 9.1%.
Ambulatory Disability Correlation Summary
| Measurement | Carpatho Rusyn | Immigrants from Switzerland |
| Minimum | 0.63% | 1.6% |
| Maximum | 19.6% | 13.2% |
| Range | 19.0% | 11.6% |
| Mean | 7.2% | 5.9% |
| Median | 6.5% | 5.4% |
| Interquartile 25% (IQ1) | 5.7% | 4.9% |
| Interquartile 75% (IQ3) | 8.0% | 6.3% |
| Interquartile Range (IQR) | 2.3% | 1.4% |
| Standard Deviation (Sample) | 3.1% | 2.4% |
| Standard Deviation (Population) | 3.0% | 2.3% |
Similar Demographics by Ambulatory Disability
Demographics Similar to Carpatho Rusyns by Ambulatory Disability
In terms of ambulatory disability, the demographic groups most similar to Carpatho Rusyns are European (6.2%, a difference of 0.050%), British (6.2%, a difference of 0.060%), Ukrainian (6.2%, a difference of 0.080%), Immigrants from Bosnia and Herzegovina (6.2%, a difference of 0.11%), and Immigrants from Western Africa (6.2%, a difference of 0.12%).
| Demographics | Rating | Rank | Ambulatory Disability |
| Immigrants | Nicaragua | 43.9 /100 | #180 | Average 6.1% |
| Swiss | 43.1 /100 | #181 | Average 6.1% |
| Serbians | 42.8 /100 | #182 | Average 6.1% |
| Immigrants | Thailand | 42.2 /100 | #183 | Average 6.1% |
| Immigrants | Ghana | 41.2 /100 | #184 | Average 6.1% |
| Immigrants | Bosnia and Herzegovina | 37.2 /100 | #185 | Fair 6.2% |
| Europeans | 36.2 /100 | #186 | Fair 6.2% |
| Carpatho Rusyns | 35.3 /100 | #187 | Fair 6.2% |
| British | 34.3 /100 | #188 | Fair 6.2% |
| Ukrainians | 34.0 /100 | #189 | Fair 6.2% |
| Immigrants | Western Africa | 33.4 /100 | #190 | Fair 6.2% |
| Immigrants | Guatemala | 31.9 /100 | #191 | Fair 6.2% |
| Immigrants | Western Europe | 31.6 /100 | #192 | Fair 6.2% |
| Guatemalans | 30.0 /100 | #193 | Fair 6.2% |
| Alaska Natives | 29.8 /100 | #194 | Fair 6.2% |
Demographics Similar to Immigrants from Switzerland by Ambulatory Disability
In terms of ambulatory disability, the demographic groups most similar to Immigrants from Switzerland are Laotian (5.7%, a difference of 0.030%), Israeli (5.7%, a difference of 0.090%), Immigrants from Uganda (5.7%, a difference of 0.11%), Sri Lankan (5.7%, a difference of 0.13%), and Immigrants from France (5.6%, a difference of 0.16%).
| Demographics | Rating | Rank | Ambulatory Disability |
| Immigrants | Zimbabwe | 99.8 /100 | #58 | Exceptional 5.6% |
| Immigrants | Afghanistan | 99.8 /100 | #59 | Exceptional 5.6% |
| Immigrants | Lithuania | 99.8 /100 | #60 | Exceptional 5.6% |
| Immigrants | Belgium | 99.7 /100 | #61 | Exceptional 5.6% |
| Immigrants | Spain | 99.7 /100 | #62 | Exceptional 5.6% |
| Immigrants | France | 99.7 /100 | #63 | Exceptional 5.6% |
| Laotians | 99.7 /100 | #64 | Exceptional 5.7% |
| Immigrants | Switzerland | 99.7 /100 | #65 | Exceptional 5.7% |
| Israelis | 99.6 /100 | #66 | Exceptional 5.7% |
| Immigrants | Uganda | 99.6 /100 | #67 | Exceptional 5.7% |
| Sri Lankans | 99.6 /100 | #68 | Exceptional 5.7% |
| Peruvians | 99.5 /100 | #69 | Exceptional 5.7% |
| Sierra Leoneans | 99.4 /100 | #70 | Exceptional 5.7% |
| Immigrants | Peru | 99.4 /100 | #71 | Exceptional 5.7% |
| Brazilians | 99.4 /100 | #72 | Exceptional 5.7% |