Carpatho Rusyn vs Honduran Ambulatory Disability
COMPARE
Carpatho Rusyn
Honduran
Ambulatory Disability
Ambulatory Disability Comparison
Carpatho Rusyns
Hondurans
6.2%
AMBULATORY DISABILITY
35.3/ 100
METRIC RATING
187th/ 347
METRIC RANK
6.3%
AMBULATORY DISABILITY
6.3/ 100
METRIC RATING
225th/ 347
METRIC RANK
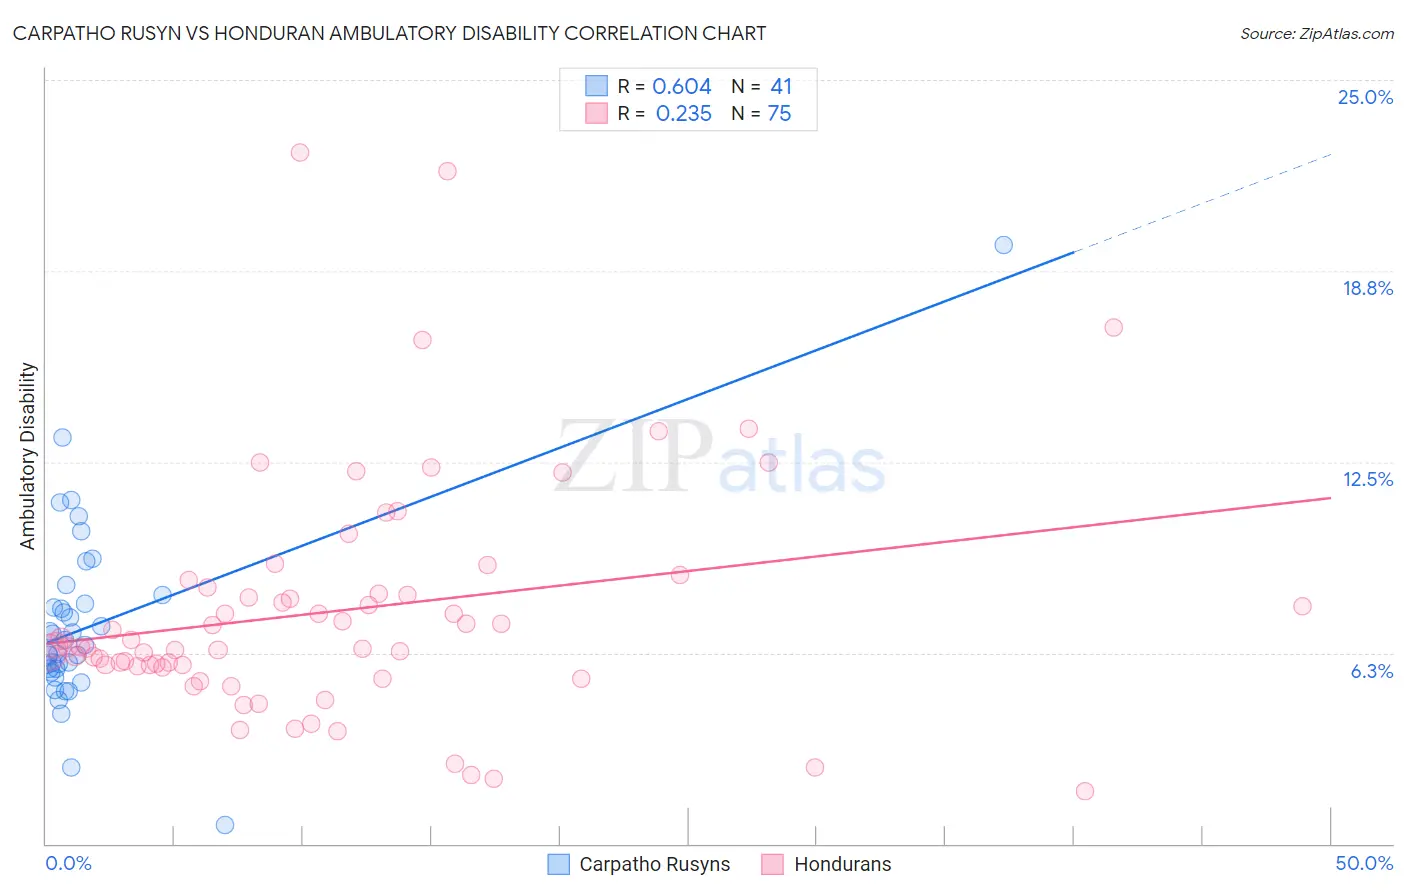
Carpatho Rusyn vs Honduran Ambulatory Disability Correlation Chart
The statistical analysis conducted on geographies consisting of 58,871,605 people shows a significant positive correlation between the proportion of Carpatho Rusyns and percentage of population with ambulatory disability in the United States with a correlation coefficient (R) of 0.604 and weighted average of 6.2%. Similarly, the statistical analysis conducted on geographies consisting of 357,719,276 people shows a weak positive correlation between the proportion of Hondurans and percentage of population with ambulatory disability in the United States with a correlation coefficient (R) of 0.235 and weighted average of 6.3%, a difference of 2.8%.
Ambulatory Disability Correlation Summary
| Measurement | Carpatho Rusyn | Honduran |
| Minimum | 0.63% | 1.7% |
| Maximum | 19.6% | 22.6% |
| Range | 19.0% | 20.9% |
| Mean | 7.2% | 7.6% |
| Median | 6.5% | 6.4% |
| Interquartile 25% (IQ1) | 5.7% | 5.8% |
| Interquartile 75% (IQ3) | 8.0% | 8.4% |
| Interquartile Range (IQR) | 2.3% | 2.6% |
| Standard Deviation (Sample) | 3.1% | 3.9% |
| Standard Deviation (Population) | 3.0% | 3.9% |
Similar Demographics by Ambulatory Disability
Demographics Similar to Carpatho Rusyns by Ambulatory Disability
In terms of ambulatory disability, the demographic groups most similar to Carpatho Rusyns are European (6.2%, a difference of 0.050%), British (6.2%, a difference of 0.060%), Ukrainian (6.2%, a difference of 0.080%), Immigrants from Bosnia and Herzegovina (6.2%, a difference of 0.11%), and Immigrants from Western Africa (6.2%, a difference of 0.12%).
| Demographics | Rating | Rank | Ambulatory Disability |
| Immigrants | Nicaragua | 43.9 /100 | #180 | Average 6.1% |
| Swiss | 43.1 /100 | #181 | Average 6.1% |
| Serbians | 42.8 /100 | #182 | Average 6.1% |
| Immigrants | Thailand | 42.2 /100 | #183 | Average 6.1% |
| Immigrants | Ghana | 41.2 /100 | #184 | Average 6.1% |
| Immigrants | Bosnia and Herzegovina | 37.2 /100 | #185 | Fair 6.2% |
| Europeans | 36.2 /100 | #186 | Fair 6.2% |
| Carpatho Rusyns | 35.3 /100 | #187 | Fair 6.2% |
| British | 34.3 /100 | #188 | Fair 6.2% |
| Ukrainians | 34.0 /100 | #189 | Fair 6.2% |
| Immigrants | Western Africa | 33.4 /100 | #190 | Fair 6.2% |
| Immigrants | Guatemala | 31.9 /100 | #191 | Fair 6.2% |
| Immigrants | Western Europe | 31.6 /100 | #192 | Fair 6.2% |
| Guatemalans | 30.0 /100 | #193 | Fair 6.2% |
| Alaska Natives | 29.8 /100 | #194 | Fair 6.2% |
Demographics Similar to Hondurans by Ambulatory Disability
In terms of ambulatory disability, the demographic groups most similar to Hondurans are Liberian (6.3%, a difference of 0.17%), Immigrants from Honduras (6.3%, a difference of 0.27%), Slavic (6.4%, a difference of 0.27%), German Russian (6.3%, a difference of 0.56%), and Hungarian (6.3%, a difference of 0.59%).
| Demographics | Rating | Rank | Ambulatory Disability |
| Guamanians/Chamorros | 10.6 /100 | #218 | Poor 6.3% |
| Indonesians | 9.9 /100 | #219 | Tragic 6.3% |
| Immigrants | Albania | 9.6 /100 | #220 | Tragic 6.3% |
| Hungarians | 9.6 /100 | #221 | Tragic 6.3% |
| German Russians | 9.4 /100 | #222 | Tragic 6.3% |
| Immigrants | Honduras | 7.6 /100 | #223 | Tragic 6.3% |
| Liberians | 7.1 /100 | #224 | Tragic 6.3% |
| Hondurans | 6.3 /100 | #225 | Tragic 6.3% |
| Slavs | 5.1 /100 | #226 | Tragic 6.4% |
| Cubans | 4.0 /100 | #227 | Tragic 6.4% |
| Portuguese | 4.0 /100 | #228 | Tragic 6.4% |
| Czechoslovakians | 3.8 /100 | #229 | Tragic 6.4% |
| Mexicans | 3.5 /100 | #230 | Tragic 6.4% |
| Panamanians | 3.1 /100 | #231 | Tragic 6.4% |
| Assyrians/Chaldeans/Syriacs | 2.4 /100 | #232 | Tragic 6.4% |