Zip Codes with the Highest Percentage of Population Employed in Accommodation & Food Services in Durango, CO
RELATED REPORTS & OPTIONS
Accommodation & Food Services
Durango
Compare Zip Codes
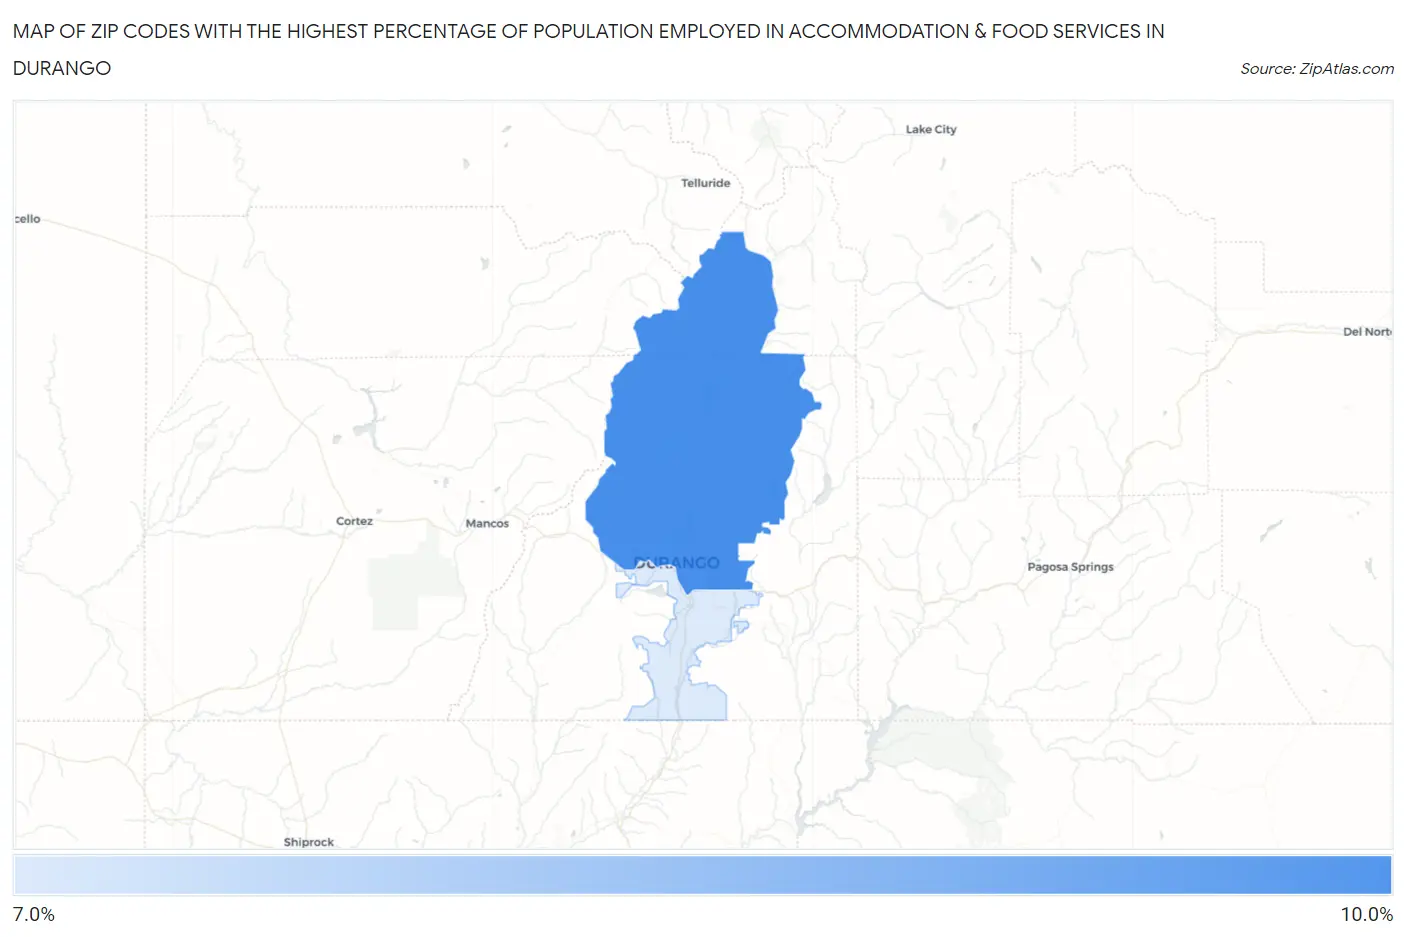
Map of Zip Codes with the Highest Percentage of Population Employed in Accommodation & Food Services in Durango
7.6%
9.4%
Zip Codes with the Highest Percentage of Population Employed in Accommodation & Food Services in Durango, CO
| Zip Code | % Employed | vs State | vs National | |
| 1. | 81301 | 9.4% | 6.9%(+2.50)#103 | 6.9%(+2.52)#5,357 |
| 2. | 81303 | 7.6% | 6.9%(+0.663)#149 | 6.9%(+0.683)#8,818 |
1
Common Questions
What are the Top Zip Codes with the Highest Percentage of Population Employed in Accommodation & Food Services in Durango, CO?
Top Zip Codes with the Highest Percentage of Population Employed in Accommodation & Food Services in Durango, CO are:
What zip code has the Highest Percentage of Population Employed in Accommodation & Food Services in Durango, CO?
81301 has the Highest Percentage of Population Employed in Accommodation & Food Services in Durango, CO with 9.4%.
What is the Percentage of Population Employed in Accommodation & Food Services in Durango, CO?
Percentage of Population Employed in Accommodation & Food Services in Durango is 11.5%.
What is the Percentage of Population Employed in Accommodation & Food Services in Colorado?
Percentage of Population Employed in Accommodation & Food Services in Colorado is 6.9%.
What is the Percentage of Population Employed in Accommodation & Food Services in the United States?
Percentage of Population Employed in Accommodation & Food Services in the United States is 6.9%.