Zip Codes with the Highest Percentage of Population Employed in Arts, Media & Entertainment in Peoria, AZ
RELATED REPORTS & OPTIONS
Arts, Media & Entertainment
Peoria
Compare Zip Codes
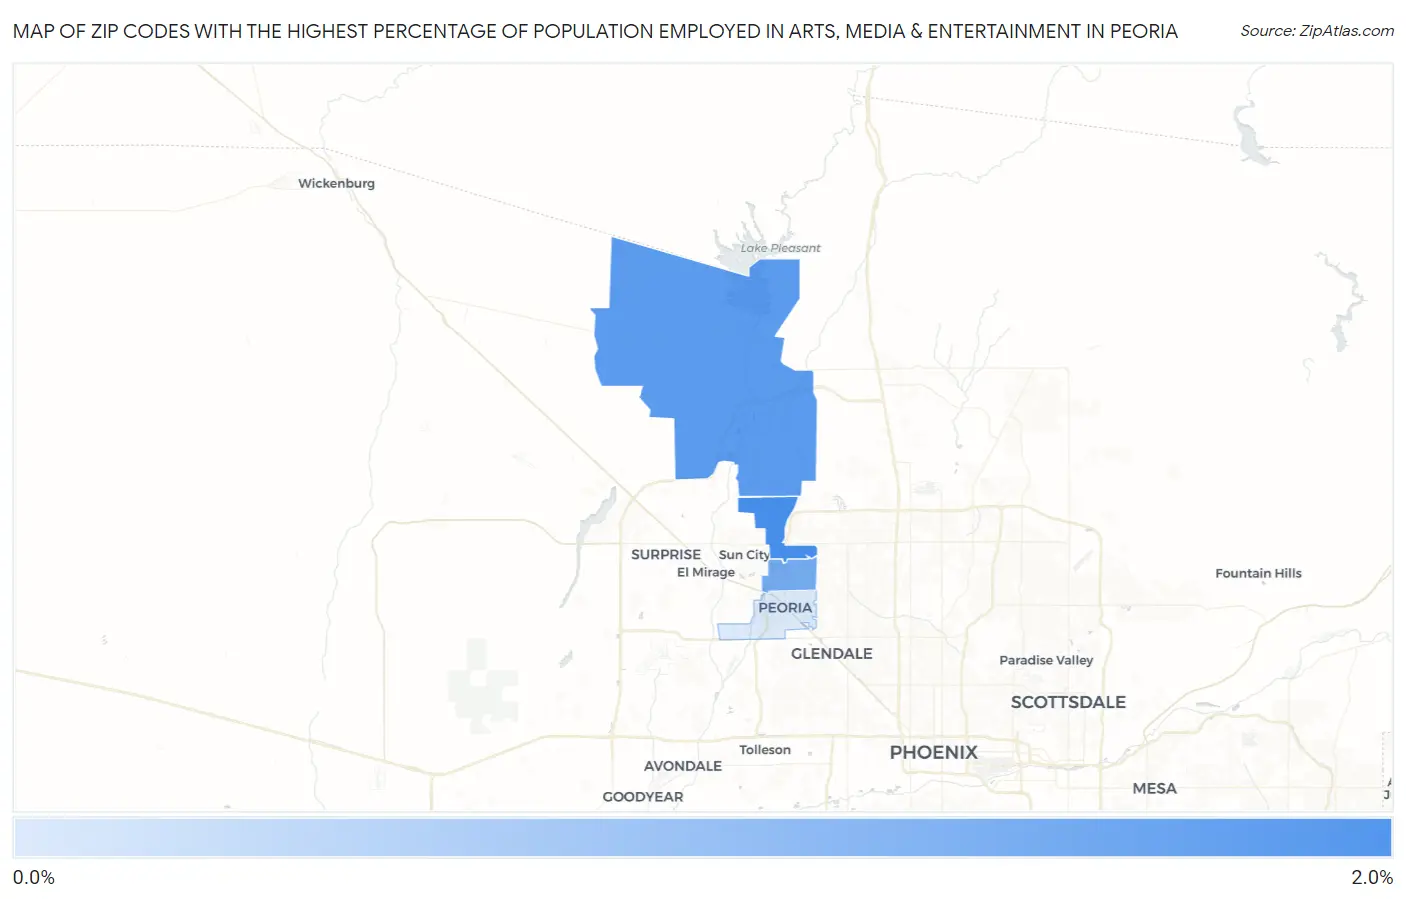
Map of Zip Codes with the Highest Percentage of Population Employed in Arts, Media & Entertainment in Peoria
0.81%
1.8%
Zip Codes with the Highest Percentage of Population Employed in Arts, Media & Entertainment in Peoria, AZ
| Zip Code | % Employed | vs State | vs National | |
| 1. | 85382 | 1.8% | 1.8%(+0.009)#139 | 2.1%(-0.223)#8,754 |
| 2. | 85383 | 1.7% | 1.8%(-0.126)#145 | 2.1%(-0.358)#9,596 |
| 3. | 85381 | 1.5% | 1.8%(-0.310)#164 | 2.1%(-0.543)#10,866 |
| 4. | 85345 | 0.81% | 1.8%(-1.02)#238 | 2.1%(-1.25)#16,320 |
1
Common Questions
What are the Top 3 Zip Codes with the Highest Percentage of Population Employed in Arts, Media & Entertainment in Peoria, AZ?
Top 3 Zip Codes with the Highest Percentage of Population Employed in Arts, Media & Entertainment in Peoria, AZ are:
What zip code has the Highest Percentage of Population Employed in Arts, Media & Entertainment in Peoria, AZ?
85382 has the Highest Percentage of Population Employed in Arts, Media & Entertainment in Peoria, AZ with 1.8%.
What is the Percentage of Population Employed in Arts, Media & Entertainment in Peoria, AZ?
Percentage of Population Employed in Arts, Media & Entertainment in Peoria is 1.5%.
What is the Percentage of Population Employed in Arts, Media & Entertainment in Arizona?
Percentage of Population Employed in Arts, Media & Entertainment in Arizona is 1.8%.
What is the Percentage of Population Employed in Arts, Media & Entertainment in the United States?
Percentage of Population Employed in Arts, Media & Entertainment in the United States is 2.1%.