Cities with the Highest Percentage of Population Walking to Work in Utah
RELATED REPORTS & OPTIONS
Walk to Work
Utah
Compare Cities
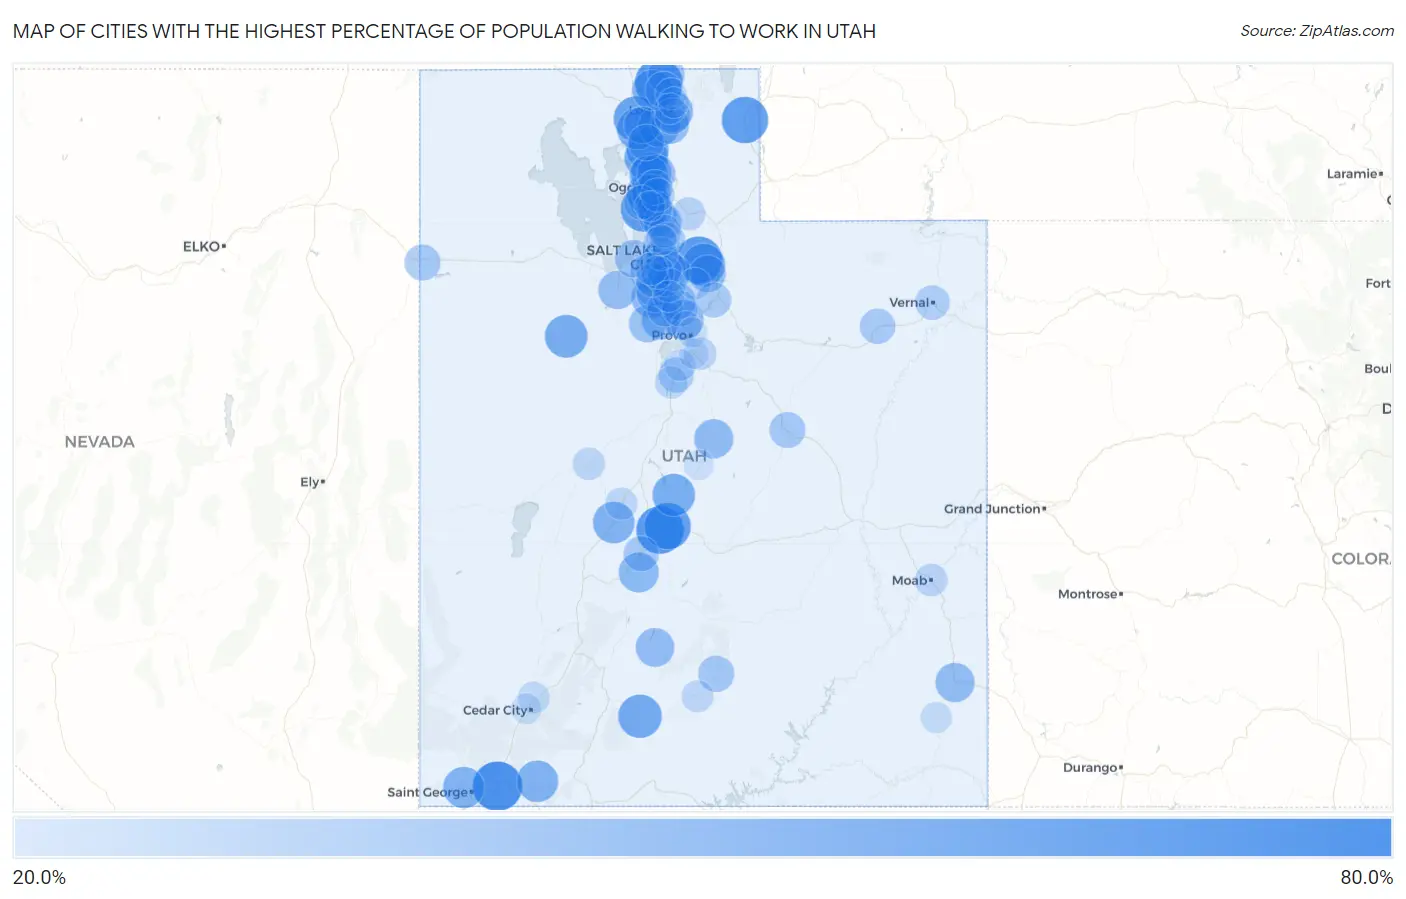
Map of Cities with the Highest Percentage of Population Walking to Work in Utah
0.0%
80.0%
Cities with the Highest Percentage of Population Walking to Work in Utah
| City | % Walk to Work | vs State | vs National | |
| 1. | Hurricane | 68.8% | 26.1%(+42.7)#1 | 33.4%(+35.4)#148 |
| 2. | Trenton | 64.0% | 26.1%(+37.9)#2 | 33.4%(+30.6)#420 |
| 3. | Aurora | 63.8% | 26.1%(+37.7)#3 | 33.4%(+30.4)#430 |
| 4. | Summit Park | 62.4% | 26.1%(+36.3)#4 | 33.4%(+29.0)#559 |
| 5. | Randolph | 61.3% | 26.1%(+35.2)#5 | 33.4%(+27.9)#690 |
| 6. | Salina | 61.1% | 26.1%(+35.0)#6 | 33.4%(+27.7)#721 |
| 7. | Syracuse | 60.0% | 26.1%(+33.9)#7 | 33.4%(+26.6)#867 |
| 8. | Elwood | 58.1% | 26.1%(+32.0)#8 | 33.4%(+24.7)#1,154 |
| 9. | Willard | 54.3% | 26.1%(+28.2)#9 | 33.4%(+20.9)#1,791 |
| 10. | Tropic | 54.2% | 26.1%(+28.1)#10 | 33.4%(+20.8)#1,824 |
| 11. | Dugway | 52.5% | 26.1%(+26.4)#11 | 33.4%(+19.1)#2,136 |
| 12. | Snyderville | 52.3% | 26.1%(+26.2)#12 | 33.4%(+18.9)#2,165 |
| 13. | Gunnison | 51.5% | 26.1%(+25.4)#13 | 33.4%(+18.1)#2,298 |
| 14. | Perry | 51.1% | 26.1%(+25.0)#14 | 33.4%(+17.7)#2,384 |
| 15. | Fillmore | 49.5% | 26.1%(+23.4)#15 | 33.4%(+16.1)#2,695 |
| 16. | Bear River City | 49.2% | 26.1%(+23.1)#16 | 33.4%(+15.8)#2,776 |
| 17. | Springdale | 49.1% | 26.1%(+23.0)#17 | 33.4%(+15.7)#2,797 |
| 18. | Santa Clara | 48.9% | 26.1%(+22.8)#18 | 33.4%(+15.5)#2,820 |
| 19. | Wellsville | 48.5% | 26.1%(+22.4)#19 | 33.4%(+15.1)#2,880 |
| 20. | River Heights | 48.0% | 26.1%(+21.9)#20 | 33.4%(+14.6)#3,003 |
| 21. | Newton | 47.2% | 26.1%(+21.1)#21 | 33.4%(+13.8)#3,163 |
| 22. | Sunset | 46.9% | 26.1%(+20.8)#22 | 33.4%(+13.5)#3,204 |
| 23. | Pleasant View | 46.4% | 26.1%(+20.3)#23 | 33.4%(+13.0)#3,283 |
| 24. | Monroe | 45.7% | 26.1%(+19.6)#24 | 33.4%(+12.3)#3,418 |
| 25. | Herriman | 45.5% | 26.1%(+19.4)#25 | 33.4%(+12.1)#3,447 |
| 26. | Roy | 45.4% | 26.1%(+19.3)#26 | 33.4%(+12.0)#3,490 |
| 27. | Lindon | 45.1% | 26.1%(+19.0)#27 | 33.4%(+11.7)#3,562 |
| 28. | Mount Pleasant | 43.6% | 26.1%(+17.5)#28 | 33.4%(+10.2)#3,852 |
| 29. | Monticello | 43.6% | 26.1%(+17.5)#29 | 33.4%(+10.2)#3,855 |
| 30. | Saratoga Springs | 43.3% | 26.1%(+17.2)#30 | 33.4%(+9.90)#3,932 |
| 31. | Kearns | 43.2% | 26.1%(+17.1)#31 | 33.4%(+9.80)#3,947 |
| 32. | Farr West | 42.9% | 26.1%(+16.8)#32 | 33.4%(+9.50)#4,009 |
| 33. | Antimony | 42.3% | 26.1%(+16.2)#33 | 33.4%(+8.90)#4,167 |
| 34. | Riverdale | 42.2% | 26.1%(+16.1)#34 | 33.4%(+8.80)#4,179 |
| 35. | Tooele | 42.1% | 26.1%(+16.0)#35 | 33.4%(+8.70)#4,184 |
| 36. | South Salt Lake | 42.0% | 26.1%(+15.9)#36 | 33.4%(+8.60)#4,207 |
| 37. | Kaysville | 41.6% | 26.1%(+15.5)#37 | 33.4%(+8.20)#4,294 |
| 38. | North Ogden | 41.2% | 26.1%(+15.1)#38 | 33.4%(+7.80)#4,422 |
| 39. | Farmington | 40.7% | 26.1%(+14.6)#39 | 33.4%(+7.30)#4,514 |
| 40. | Hyrum | 40.7% | 26.1%(+14.6)#40 | 33.4%(+7.30)#4,518 |
| 41. | Magna | 39.7% | 26.1%(+13.6)#41 | 33.4%(+6.30)#4,750 |
| 42. | Eagle Mountain | 39.4% | 26.1%(+13.3)#42 | 33.4%(+6.00)#4,818 |
| 43. | South Jordan | 38.9% | 26.1%(+12.8)#43 | 33.4%(+5.50)#4,929 |
| 44. | Riverton | 38.8% | 26.1%(+12.7)#44 | 33.4%(+5.40)#4,956 |
| 45. | Park City | 38.4% | 26.1%(+12.3)#45 | 33.4%(+5.00)#5,084 |
| 46. | Lewiston | 38.2% | 26.1%(+12.1)#46 | 33.4%(+4.80)#5,129 |
| 47. | Holladay | 38.1% | 26.1%(+12.0)#47 | 33.4%(+4.70)#5,139 |
| 48. | Honeyville | 37.9% | 26.1%(+11.8)#48 | 33.4%(+4.50)#5,182 |
| 49. | Amalga | 37.8% | 26.1%(+11.7)#49 | 33.4%(+4.40)#5,215 |
| 50. | Alpine | 37.4% | 26.1%(+11.3)#50 | 33.4%(+4.00)#5,315 |
| 51. | Boulder | 36.5% | 26.1%(+10.4)#51 | 33.4%(+3.10)#5,551 |
| 52. | North Salt Lake | 36.3% | 26.1%(+10.2)#52 | 33.4%(+2.90)#5,587 |
| 53. | Brigham City | 36.1% | 26.1%(+10.00)#53 | 33.4%(+2.70)#5,632 |
| 54. | Price | 36.1% | 26.1%(+10.00)#54 | 33.4%(+2.70)#5,638 |
| 55. | Wendover | 36.1% | 26.1%(+10.00)#55 | 33.4%(+2.70)#5,646 |
| 56. | Millville | 36.0% | 26.1%(+9.90)#56 | 33.4%(+2.60)#5,665 |
| 57. | Layton | 35.4% | 26.1%(+9.30)#57 | 33.4%(+2.00)#5,825 |
| 58. | Lehi | 35.2% | 26.1%(+9.10)#58 | 33.4%(+1.80)#5,881 |
| 59. | Cedar Hills | 35.1% | 26.1%(+9.00)#59 | 33.4%(+1.70)#5,910 |
| 60. | Roosevelt | 34.6% | 26.1%(+8.50)#60 | 33.4%(+1.20)#6,044 |
| 61. | Richfield | 34.5% | 26.1%(+8.40)#61 | 33.4%(+1.10)#6,074 |
| 62. | Ogden | 34.4% | 26.1%(+8.30)#62 | 33.4%(+1.00)#6,111 |
| 63. | Midvale | 34.4% | 26.1%(+8.30)#63 | 33.4%(+1.00)#6,113 |
| 64. | Charleston | 34.0% | 26.1%(+7.90)#64 | 33.4%(+0.600)#6,206 |
| 65. | Bountiful | 33.8% | 26.1%(+7.70)#65 | 33.4%(+0.400)#6,243 |
| 66. | Santaquin | 33.8% | 26.1%(+7.70)#66 | 33.4%(+0.400)#6,249 |
| 67. | Vernal | 32.9% | 26.1%(+6.80)#67 | 33.4%(-0.500)#6,477 |
| 68. | West Point | 32.2% | 26.1%(+6.10)#68 | 33.4%(-1.20)#6,657 |
| 69. | Millcreek | 31.8% | 26.1%(+5.70)#69 | 33.4%(-1.60)#6,723 |
| 70. | Murray | 31.8% | 26.1%(+5.70)#70 | 33.4%(-1.60)#6,724 |
| 71. | Sandy | 31.5% | 26.1%(+5.40)#71 | 33.4%(-1.90)#6,805 |
| 72. | West Jordan | 30.5% | 26.1%(+4.40)#72 | 33.4%(-2.90)#7,048 |
| 73. | South Ogden | 30.3% | 26.1%(+4.20)#73 | 33.4%(-3.10)#7,118 |
| 74. | Morgan | 29.5% | 26.1%(+3.40)#74 | 33.4%(-3.90)#7,343 |
| 75. | Salt Lake City | 29.2% | 26.1%(+3.10)#75 | 33.4%(-4.20)#7,402 |
| 76. | Taylorsville | 28.9% | 26.1%(+2.80)#76 | 33.4%(-4.50)#7,447 |
| 77. | Centerville | 28.8% | 26.1%(+2.70)#77 | 33.4%(-4.60)#7,490 |
| 78. | Mapleton | 28.8% | 26.1%(+2.70)#78 | 33.4%(-4.60)#7,494 |
| 79. | Moab | 28.5% | 26.1%(+2.40)#79 | 33.4%(-4.90)#7,594 |
| 80. | West Valley City | 27.9% | 26.1%(+1.80)#80 | 33.4%(-5.50)#7,696 |
| 81. | Delta | 27.6% | 26.1%(+1.50)#81 | 33.4%(-5.80)#7,805 |
| 82. | Rocky Ridge | 27.6% | 26.1%(+1.50)#82 | 33.4%(-5.80)#7,815 |
| 83. | Holden | 27.5% | 26.1%(+1.40)#83 | 33.4%(-5.90)#7,845 |
| 84. | Escalante | 26.8% | 26.1%(+0.700)#84 | 33.4%(-6.60)#7,970 |
| 85. | Payson | 26.2% | 26.1%(+0.100)#85 | 33.4%(-7.20)#8,084 |
| 86. | Enoch | 26.1% | 26.1%(=0.000)#86 | 33.4%(-7.30)#8,100 |
| 87. | Alta | 26.0% | 26.1%(-0.100)#87 | 33.4%(-7.40)#8,125 |
| 88. | Blanding | 25.5% | 26.1%(-0.600)#88 | 33.4%(-7.90)#8,217 |
| 89. | White | 25.2% | 26.1%(-0.900)#89 | 33.4%(-8.20)#8,279 |
| 90. | Smithfield | 24.9% | 26.1%(-1.20)#90 | 33.4%(-8.50)#8,323 |
| 91. | Draper | 24.8% | 26.1%(-1.30)#91 | 33.4%(-8.60)#8,348 |
| 92. | Woods Cross | 23.8% | 26.1%(-2.30)#92 | 33.4%(-9.60)#8,556 |
| 93. | Logan | 23.7% | 26.1%(-2.40)#93 | 33.4%(-9.70)#8,587 |
| 94. | Cedar City | 23.7% | 26.1%(-2.40)#94 | 33.4%(-9.70)#8,588 |
| 95. | North Logan | 23.4% | 26.1%(-2.70)#95 | 33.4%(-10.00)#8,668 |
| 96. | Clearfield | 22.8% | 26.1%(-3.30)#96 | 33.4%(-10.6)#8,787 |
| 97. | Orem | 22.7% | 26.1%(-3.40)#97 | 33.4%(-10.7)#8,822 |
| 98. | Spanish Fork | 22.7% | 26.1%(-3.40)#98 | 33.4%(-10.7)#8,823 |
| 99. | Ephraim | 22.6% | 26.1%(-3.50)#99 | 33.4%(-10.8)#8,863 |
| 100. | Provo | 22.5% | 26.1%(-3.60)#100 | 33.4%(-10.9)#8,872 |
Common Questions
What are the Top 10 Cities with the Highest Percentage of Population Walking to Work in Utah?
Top 10 Cities with the Highest Percentage of Population Walking to Work in Utah are:
What city has the Highest Percentage of Population Walking to Work in Utah?
Hurricane has the Highest Percentage of Population Walking to Work in Utah with 68.8%.
What is the Percentage of Population Walking to Work in the State of Utah?
Percentage of Population Walking to Work in Utah is 26.1%.
What is the Percentage of Population Walking to Work in the United States?
Percentage of Population Walking to Work in the United States is 33.4%.