Cities with the Highest Percentage of Population with a Degree in Business in Utah
RELATED REPORTS & OPTIONS
Business
Utah
Compare Cities
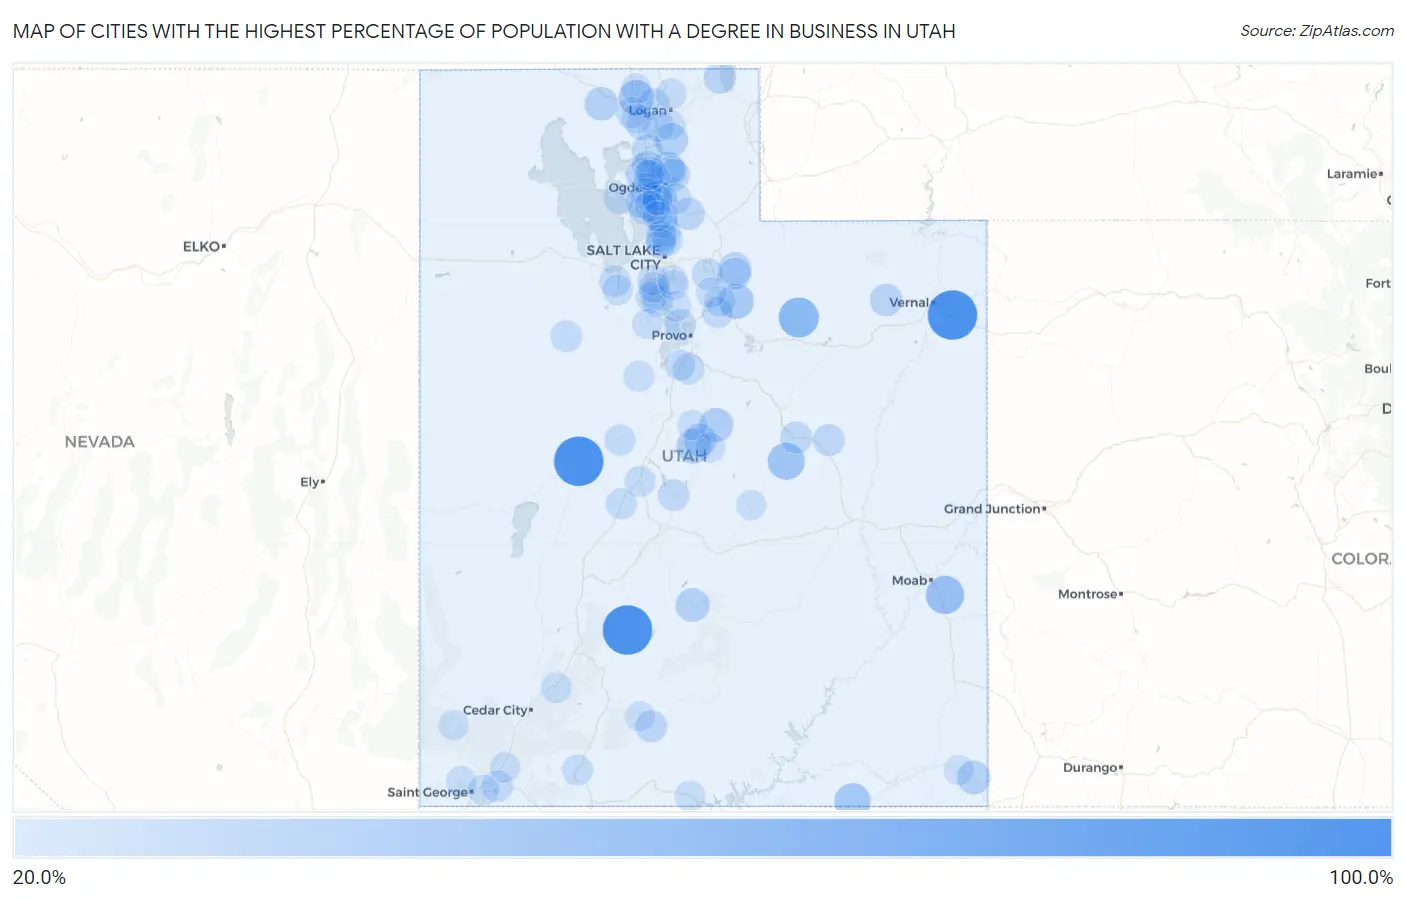
Map of Cities with the Highest Percentage of Population with a Degree in Business in Utah
0.0%
100.0%
Cities with the Highest Percentage of Population with a Degree in Business in Utah
| City | % Graduates | vs State | vs National | |
| 1. | Jensen | 100.0% | 18.6%(+81.4)#1 | 19.5%(+80.5)#53 |
| 2. | Junction | 100.0% | 18.6%(+81.4)#2 | 19.5%(+80.5)#64 |
| 3. | Sutherland | 100.0% | 18.6%(+81.4)#3 | 19.5%(+80.5)#107 |
| 4. | Tabiona | 60.0% | 18.6%(+41.4)#4 | 19.5%(+40.5)#684 |
| 5. | Spanish Valley | 52.3% | 18.6%(+33.7)#5 | 19.5%(+32.8)#940 |
| 6. | Elmo | 47.4% | 18.6%(+28.8)#6 | 19.5%(+27.9)#1,249 |
| 7. | Oljato Monument Valley | 43.3% | 18.6%(+24.8)#7 | 19.5%(+23.8)#1,505 |
| 8. | Timber Lakes | 40.7% | 18.6%(+22.2)#8 | 19.5%(+21.2)#1,731 |
| 9. | Riverside | 40.3% | 18.6%(+21.7)#9 | 19.5%(+20.8)#1,775 |
| 10. | Wales | 37.9% | 18.6%(+19.4)#10 | 19.5%(+18.4)#2,106 |
| 11. | Fairview | 36.2% | 18.6%(+17.7)#11 | 19.5%(+16.7)#2,358 |
| 12. | Uintah | 35.5% | 18.6%(+17.0)#12 | 19.5%(+16.0)#2,469 |
| 13. | Loa | 34.9% | 18.6%(+16.3)#13 | 19.5%(+15.4)#2,574 |
| 14. | Liberty | 34.8% | 18.6%(+16.2)#14 | 19.5%(+15.3)#2,586 |
| 15. | Avon | 34.4% | 18.6%(+15.8)#15 | 19.5%(+14.9)#2,685 |
| 16. | Aneth | 33.3% | 18.6%(+14.8)#16 | 19.5%(+13.8)#2,900 |
| 17. | Howell | 33.3% | 18.6%(+14.8)#17 | 19.5%(+13.8)#2,907 |
| 18. | Moroni | 32.1% | 18.6%(+13.6)#18 | 19.5%(+12.6)#3,275 |
| 19. | Plain City | 31.4% | 18.6%(+12.9)#19 | 19.5%(+11.9)#3,464 |
| 20. | Marion | 31.0% | 18.6%(+12.4)#20 | 19.5%(+11.5)#3,608 |
| 21. | Whiterocks | 30.8% | 18.6%(+12.2)#21 | 19.5%(+11.3)#3,675 |
| 22. | Garden City | 28.9% | 18.6%(+10.4)#22 | 19.5%(+9.43)#4,256 |
| 23. | Eden | 28.6% | 18.6%(+10.0)#23 | 19.5%(+9.07)#4,384 |
| 24. | Morgan | 28.2% | 18.6%(+9.66)#24 | 19.5%(+8.72)#4,589 |
| 25. | Kamas | 28.1% | 18.6%(+9.50)#25 | 19.5%(+8.56)#4,650 |
| 26. | Henrieville | 27.6% | 18.6%(+9.02)#26 | 19.5%(+8.09)#4,891 |
| 27. | Washington Terrace | 27.4% | 18.6%(+8.87)#27 | 19.5%(+7.93)#4,965 |
| 28. | Vineyard | 27.4% | 18.6%(+8.82)#28 | 19.5%(+7.88)#4,996 |
| 29. | Wellington | 27.3% | 18.6%(+8.71)#29 | 19.5%(+7.77)#5,033 |
| 30. | East Carbon | 26.9% | 18.6%(+8.36)#30 | 19.5%(+7.42)#5,239 |
| 31. | Harrisville | 26.8% | 18.6%(+8.23)#31 | 19.5%(+7.30)#5,317 |
| 32. | Fruit Heights | 26.5% | 18.6%(+7.89)#32 | 19.5%(+6.96)#5,522 |
| 33. | Gunnison | 26.4% | 18.6%(+7.81)#33 | 19.5%(+6.87)#5,574 |
| 34. | Brighton | 26.3% | 18.6%(+7.75)#34 | 19.5%(+6.82)#5,613 |
| 35. | Perry | 26.2% | 18.6%(+7.59)#35 | 19.5%(+6.66)#5,711 |
| 36. | Park City | 26.0% | 18.6%(+7.47)#36 | 19.5%(+6.53)#5,782 |
| 37. | Hurricane | 26.0% | 18.6%(+7.44)#37 | 19.5%(+6.51)#5,794 |
| 38. | Erda | 26.0% | 18.6%(+7.41)#38 | 19.5%(+6.48)#5,806 |
| 39. | Peter | 25.9% | 18.6%(+7.36)#39 | 19.5%(+6.43)#5,844 |
| 40. | West Haven | 25.7% | 18.6%(+7.15)#40 | 19.5%(+6.22)#5,960 |
| 41. | Dugway | 25.7% | 18.6%(+7.11)#41 | 19.5%(+6.18)#5,996 |
| 42. | Elk Ridge | 25.4% | 18.6%(+6.88)#42 | 19.5%(+5.95)#6,139 |
| 43. | Centerville | 25.3% | 18.6%(+6.78)#43 | 19.5%(+5.85)#6,199 |
| 44. | Wallsburg | 25.0% | 18.6%(+6.44)#44 | 19.5%(+5.50)#6,471 |
| 45. | South Willard | 24.7% | 18.6%(+6.14)#45 | 19.5%(+5.21)#6,704 |
| 46. | Wellsville | 24.6% | 18.6%(+6.08)#46 | 19.5%(+5.14)#6,755 |
| 47. | Honeyville | 24.4% | 18.6%(+5.80)#47 | 19.5%(+4.86)#6,940 |
| 48. | Riverton | 24.2% | 18.6%(+5.63)#48 | 19.5%(+4.69)#7,072 |
| 49. | Payson | 24.2% | 18.6%(+5.62)#49 | 19.5%(+4.69)#7,074 |
| 50. | Woods Cross | 24.0% | 18.6%(+5.46)#50 | 19.5%(+4.52)#7,190 |
| 51. | South Ogden | 23.8% | 18.6%(+5.23)#51 | 19.5%(+4.30)#7,370 |
| 52. | Scipio | 23.7% | 18.6%(+5.17)#52 | 19.5%(+4.23)#7,415 |
| 53. | Roy | 23.7% | 18.6%(+5.09)#53 | 19.5%(+4.16)#7,482 |
| 54. | West Bountiful | 23.6% | 18.6%(+5.08)#54 | 19.5%(+4.14)#7,496 |
| 55. | Holden | 23.6% | 18.6%(+5.07)#55 | 19.5%(+4.14)#7,508 |
| 56. | Bluffdale | 23.6% | 18.6%(+5.07)#56 | 19.5%(+4.13)#7,516 |
| 57. | Daniel | 23.6% | 18.6%(+5.02)#57 | 19.5%(+4.09)#7,548 |
| 58. | Orderville | 23.6% | 18.6%(+5.00)#58 | 19.5%(+4.07)#7,562 |
| 59. | Tremonton | 23.5% | 18.6%(+4.93)#59 | 19.5%(+3.99)#7,635 |
| 60. | Wolf Creek | 23.5% | 18.6%(+4.91)#60 | 19.5%(+3.97)#7,649 |
| 61. | Leamington | 23.4% | 18.6%(+4.87)#61 | 19.5%(+3.94)#7,673 |
| 62. | West Point | 23.4% | 18.6%(+4.85)#62 | 19.5%(+3.91)#7,689 |
| 63. | Parowan | 23.4% | 18.6%(+4.80)#63 | 19.5%(+3.86)#7,732 |
| 64. | Eureka | 23.3% | 18.6%(+4.77)#64 | 19.5%(+3.83)#7,764 |
| 65. | Big Water | 23.3% | 18.6%(+4.77)#65 | 19.5%(+3.83)#7,772 |
| 66. | Hooper | 23.3% | 18.6%(+4.75)#66 | 19.5%(+3.81)#7,801 |
| 67. | Washington | 23.2% | 18.6%(+4.68)#67 | 19.5%(+3.75)#7,855 |
| 68. | Ivins | 23.1% | 18.6%(+4.58)#68 | 19.5%(+3.65)#7,924 |
| 69. | Pleasant View | 23.0% | 18.6%(+4.42)#69 | 19.5%(+3.48)#8,087 |
| 70. | Herriman | 22.9% | 18.6%(+4.31)#70 | 19.5%(+3.37)#8,178 |
| 71. | Smithfield | 22.8% | 18.6%(+4.22)#71 | 19.5%(+3.28)#8,245 |
| 72. | West Jordan | 22.8% | 18.6%(+4.19)#72 | 19.5%(+3.25)#8,264 |
| 73. | Farmington | 22.7% | 18.6%(+4.18)#73 | 19.5%(+3.24)#8,275 |
| 74. | South Jordan | 22.7% | 18.6%(+4.13)#74 | 19.5%(+3.20)#8,322 |
| 75. | Mountain Green | 22.6% | 18.6%(+4.05)#75 | 19.5%(+3.12)#8,412 |
| 76. | Layton | 22.6% | 18.6%(+4.03)#76 | 19.5%(+3.09)#8,441 |
| 77. | Tooele | 22.6% | 18.6%(+4.00)#77 | 19.5%(+3.07)#8,468 |
| 78. | Clearfield | 22.3% | 18.6%(+3.78)#78 | 19.5%(+2.85)#8,652 |
| 79. | Eagle Mountain | 22.3% | 18.6%(+3.75)#79 | 19.5%(+2.81)#8,671 |
| 80. | Bountiful | 22.3% | 18.6%(+3.73)#80 | 19.5%(+2.80)#8,679 |
| 81. | Plymouth | 22.0% | 18.6%(+3.44)#81 | 19.5%(+2.50)#9,014 |
| 82. | Syracuse | 22.0% | 18.6%(+3.43)#82 | 19.5%(+2.49)#9,020 |
| 83. | Midway | 21.9% | 18.6%(+3.38)#83 | 19.5%(+2.44)#9,072 |
| 84. | Hyrum | 21.9% | 18.6%(+3.30)#84 | 19.5%(+2.36)#9,155 |
| 85. | South Weber | 21.6% | 18.6%(+3.00)#85 | 19.5%(+2.06)#9,420 |
| 86. | Fountain Green | 21.3% | 18.6%(+2.76)#86 | 19.5%(+1.83)#9,678 |
| 87. | Highland | 21.3% | 18.6%(+2.72)#87 | 19.5%(+1.78)#9,727 |
| 88. | North Salt Lake | 21.1% | 18.6%(+2.58)#88 | 19.5%(+1.65)#9,859 |
| 89. | Elwood | 21.1% | 18.6%(+2.53)#89 | 19.5%(+1.59)#9,899 |
| 90. | Spring City | 21.1% | 18.6%(+2.53)#90 | 19.5%(+1.59)#9,903 |
| 91. | Farr West | 21.0% | 18.6%(+2.39)#91 | 19.5%(+1.45)#10,020 |
| 92. | Enterprise | 20.9% | 18.6%(+2.30)#92 | 19.5%(+1.36)#10,100 |
| 93. | Ferron | 20.8% | 18.6%(+2.21)#93 | 19.5%(+1.27)#10,221 |
| 94. | Toquerville | 20.8% | 18.6%(+2.20)#94 | 19.5%(+1.26)#10,229 |
| 95. | Montezuma Creek | 20.7% | 18.6%(+2.13)#95 | 19.5%(+1.19)#10,303 |
| 96. | Kaysville | 20.7% | 18.6%(+2.12)#96 | 19.5%(+1.19)#10,314 |
| 97. | East Basin | 20.7% | 18.6%(+2.12)#97 | 19.5%(+1.18)#10,318 |
| 98. | Tropic | 20.3% | 18.6%(+1.75)#98 | 19.5%(+0.813)#10,702 |
| 99. | Cottonwood Heights | 20.1% | 18.6%(+1.57)#99 | 19.5%(+0.632)#10,880 |
| 100. | Granite | 20.1% | 18.6%(+1.50)#100 | 19.5%(+0.564)#10,944 |
Common Questions
What are the Top 10 Cities with the Highest Percentage of Population with a Degree in Business in Utah?
Top 10 Cities with the Highest Percentage of Population with a Degree in Business in Utah are:
#1
100.0%
#2
100.0%
#3
100.0%
#4
60.0%
#5
52.3%
#6
47.4%
#7
43.3%
#8
40.7%
#9
40.3%
#10
37.9%
What city has the Highest Percentage of Population with a Degree in Business in Utah?
Jensen has the Highest Percentage of Population with a Degree in Business in Utah with 100.0%.
What is the Percentage of Population with a Degree in Business in the State of Utah?
Percentage of Population with a Degree in Business in Utah is 18.6%.
What is the Percentage of Population with a Degree in Business in the United States?
Percentage of Population with a Degree in Business in the United States is 19.5%.