Magna, UT Map & Demographics
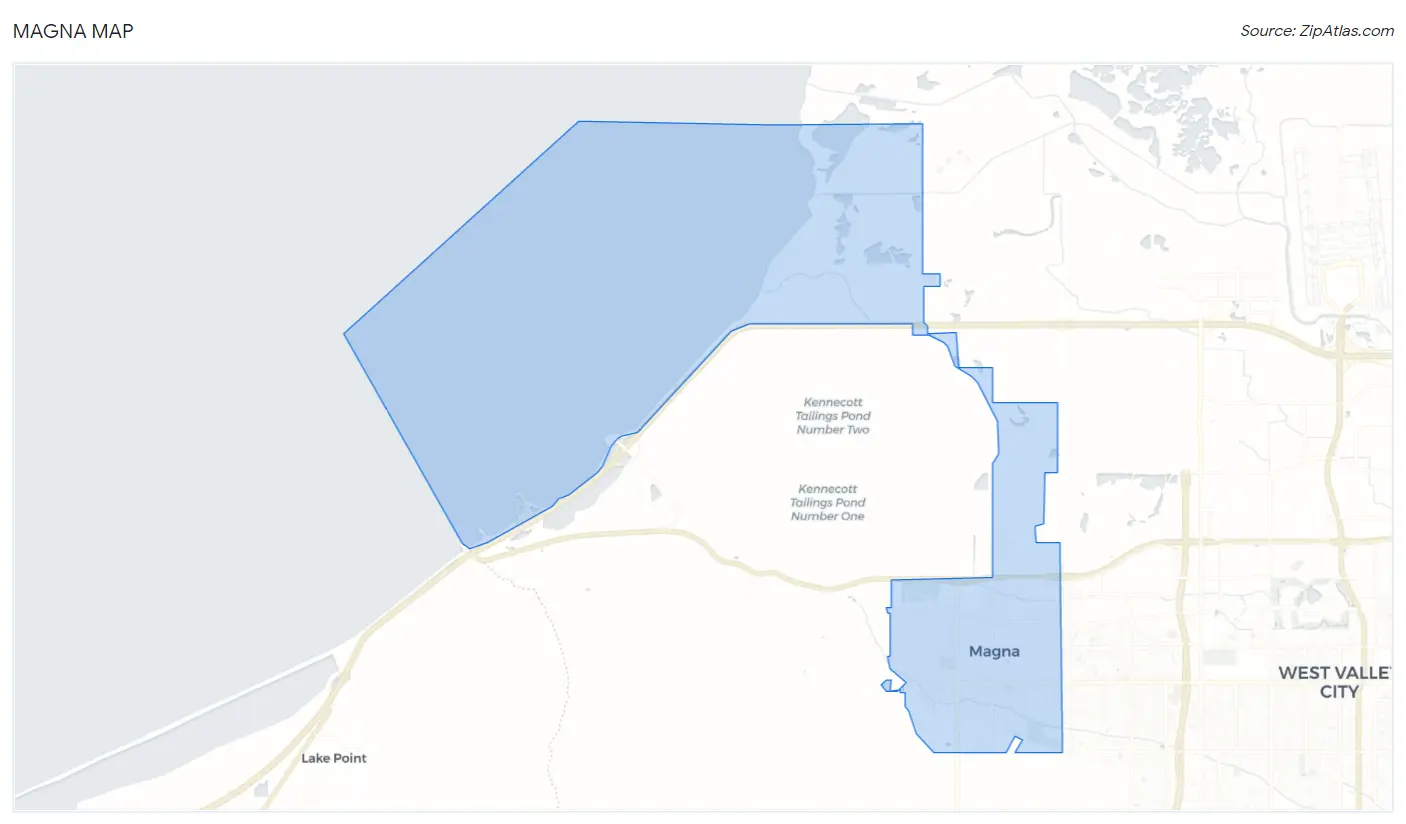
Magna Map
Magna Overview
$27,941
PER CAPITA INCOME
$84,850
AVG FAMILY INCOME
$79,934
AVG HOUSEHOLD INCOME
31.8%
WAGE / INCOME GAP [ % ]
68.2¢/ $1
WAGE / INCOME GAP [ $ ]
$13,566
FAMILY INCOME DEFICIT
0.32
INEQUALITY / GINI INDEX
29,275
TOTAL POPULATION
15,128
MALE POPULATION
14,147
FEMALE POPULATION
106.93
MALES / 100 FEMALES
93.52
FEMALES / 100 MALES
32.9
MEDIAN AGE
3.7
AVG FAMILY SIZE
3.4
AVG HOUSEHOLD SIZE
16,043
LABOR FORCE [ PEOPLE ]
73.7%
PERCENT IN LABOR FORCE
5.3%
UNEMPLOYMENT RATE
Magna Zip Codes
Magna Area Codes
Income in Magna
Income Overview in Magna
Per Capita Income in Magna is $27,941, while median incomes of families and households are $84,850 and $79,934 respectively.
| Characteristic | Number | Measure |
| Per Capita Income | 29,275 | $27,941 |
| Median Family Income | 6,862 | $84,850 |
| Mean Family Income | 6,862 | $95,304 |
| Median Household Income | 8,738 | $79,934 |
| Mean Household Income | 8,738 | $90,963 |
| Income Deficit | 6,862 | $13,566 |
| Wage / Income Gap (%) | 29,275 | 31.75% |
| Wage / Income Gap ($) | 29,275 | 68.25¢ per $1 |
| Gini / Inequality Index | 29,275 | 0.32 |
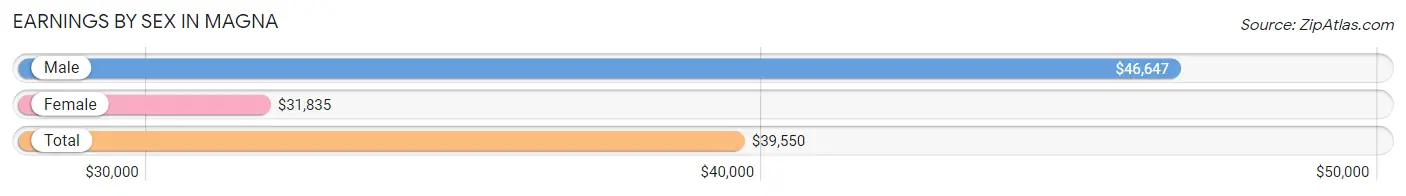
Earnings by Sex in Magna
Average Earnings in Magna are $39,550, $46,647 for men and $31,835 for women, a difference of 31.8%.
| Sex | Number | Average Earnings |
| Male | 9,010 (55.0%) | $46,647 |
| Female | 7,356 (45.0%) | $31,835 |
| Total | 16,366 (100.0%) | $39,550 |
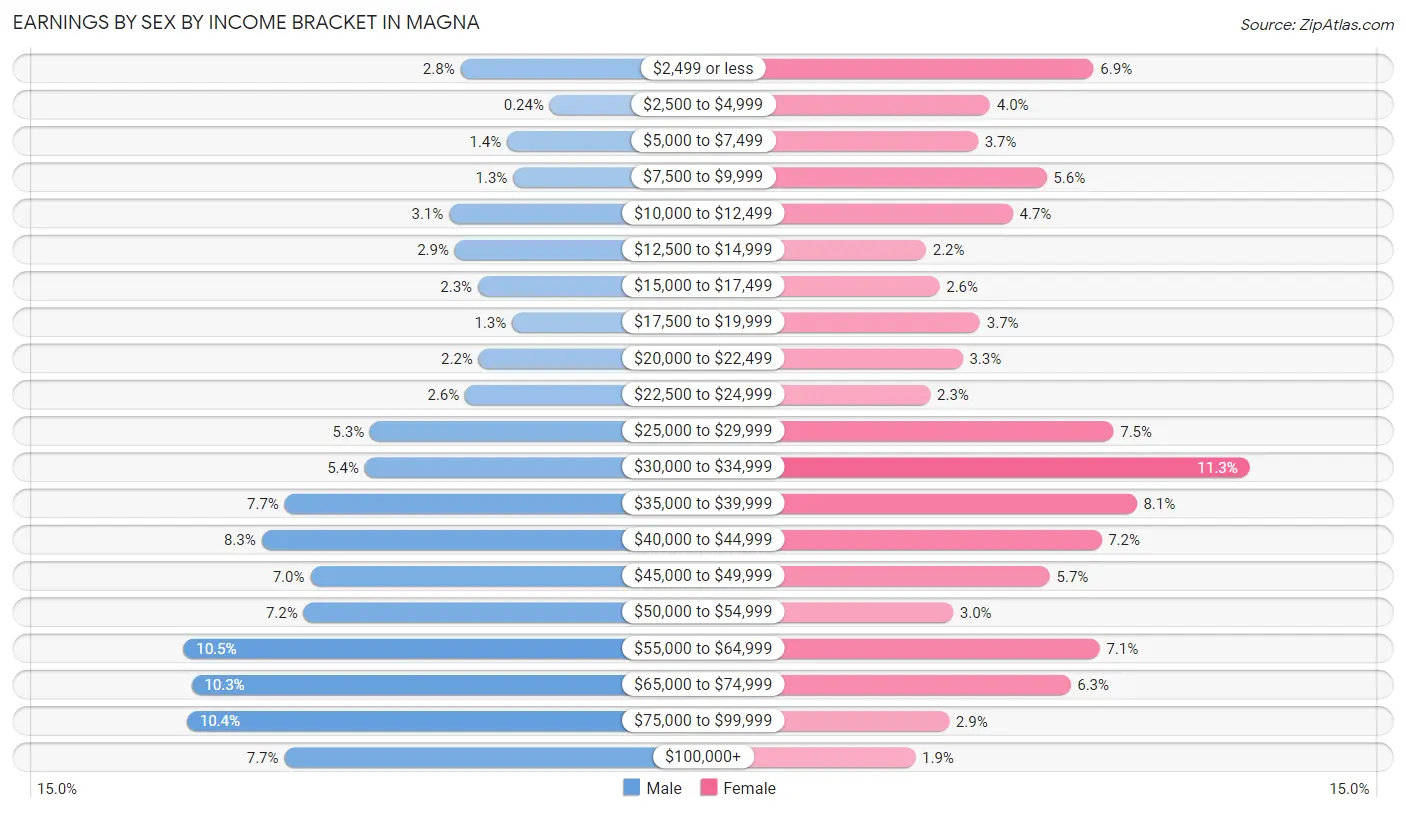
Earnings by Sex by Income Bracket in Magna
The most common earnings brackets in Magna are $55,000 to $64,999 for men (950 | 10.5%) and $30,000 to $34,999 for women (833 | 11.3%).
| Income | Male | Female |
| $2,499 or less | 248 (2.8%) | 510 (6.9%) |
| $2,500 to $4,999 | 22 (0.2%) | 296 (4.0%) |
| $5,000 to $7,499 | 130 (1.4%) | 271 (3.7%) |
| $7,500 to $9,999 | 114 (1.3%) | 413 (5.6%) |
| $10,000 to $12,499 | 277 (3.1%) | 343 (4.7%) |
| $12,500 to $14,999 | 262 (2.9%) | 163 (2.2%) |
| $15,000 to $17,499 | 204 (2.3%) | 191 (2.6%) |
| $17,500 to $19,999 | 117 (1.3%) | 275 (3.7%) |
| $20,000 to $22,499 | 202 (2.2%) | 239 (3.3%) |
| $22,500 to $24,999 | 236 (2.6%) | 172 (2.3%) |
| $25,000 to $29,999 | 477 (5.3%) | 551 (7.5%) |
| $30,000 to $34,999 | 490 (5.4%) | 833 (11.3%) |
| $35,000 to $39,999 | 693 (7.7%) | 599 (8.1%) |
| $40,000 to $44,999 | 751 (8.3%) | 526 (7.1%) |
| $45,000 to $49,999 | 628 (7.0%) | 419 (5.7%) |
| $50,000 to $54,999 | 645 (7.2%) | 219 (3.0%) |
| $55,000 to $64,999 | 950 (10.5%) | 522 (7.1%) |
| $65,000 to $74,999 | 929 (10.3%) | 462 (6.3%) |
| $75,000 to $99,999 | 941 (10.4%) | 211 (2.9%) |
| $100,000+ | 694 (7.7%) | 141 (1.9%) |
| Total | 9,010 (100.0%) | 7,356 (100.0%) |
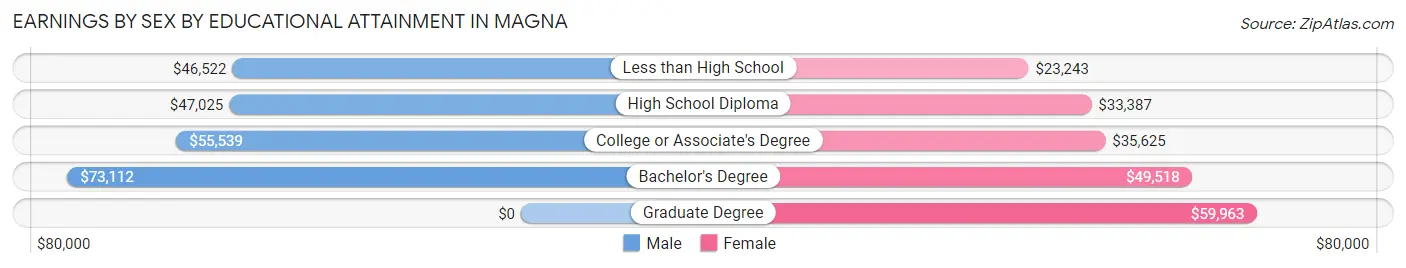
Earnings by Sex by Educational Attainment in Magna
Average earnings in Magna are $51,423 for men and $34,560 for women, a difference of 32.8%. Men with an educational attainment of bachelor's degree enjoy the highest average annual earnings of $73,112, while those with less than high school education earn the least with $46,522. Women with an educational attainment of graduate degree earn the most with the average annual earnings of $59,963, while those with less than high school education have the smallest earnings of $23,243.
| Educational Attainment | Male Income | Female Income |
| Less than High School | $46,522 | $23,243 |
| High School Diploma | $47,025 | $33,387 |
| College or Associate's Degree | $55,539 | $35,625 |
| Bachelor's Degree | $73,112 | $49,518 |
| Graduate Degree | - | - |
| Total | $51,423 | $34,560 |
Family Income in Magna
Family Income Brackets in Magna
According to the Magna family income data, there are 1,963 families falling into the $100,000 to $149,999 income range, which is the most common income bracket and makes up 28.6% of all families. Conversely, the $10,000 to $14,999 income bracket is the least frequent group with only 14 families (0.2%) belonging to this category.
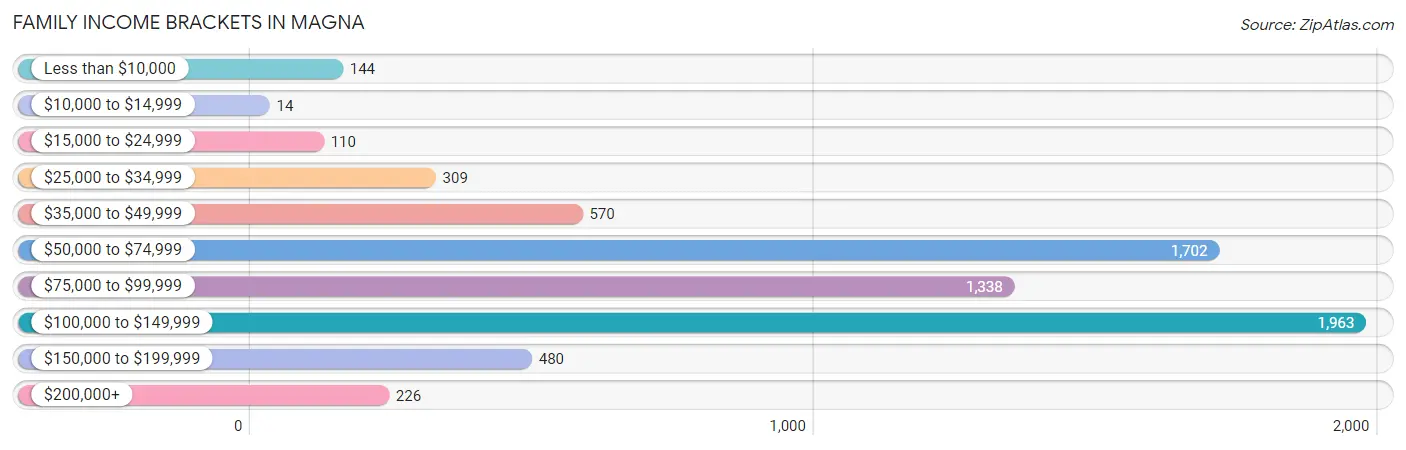
| Income Bracket | # Families | % Families |
| Less than $10,000 | 144 | 2.1% |
| $10,000 to $14,999 | 14 | 0.2% |
| $15,000 to $24,999 | 110 | 1.6% |
| $25,000 to $34,999 | 309 | 4.5% |
| $35,000 to $49,999 | 570 | 8.3% |
| $50,000 to $74,999 | 1,702 | 24.8% |
| $75,000 to $99,999 | 1,338 | 19.5% |
| $100,000 to $149,999 | 1,963 | 28.6% |
| $150,000 to $199,999 | 480 | 7.0% |
| $200,000+ | 226 | 3.3% |
Family Income by Famaliy Size in Magna
6-person families (511 | 7.4%) account for the highest median family income in Magna with $112,554 per family, while 2-person families (2,227 | 32.5%) have the highest median income of $39,252 per family member.
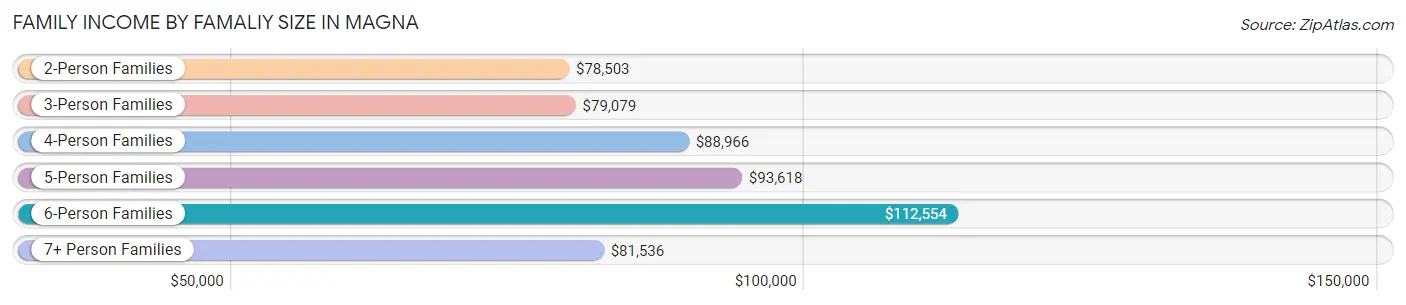
| Income Bracket | # Families | Median Income |
| 2-Person Families | 2,227 (32.5%) | $78,503 |
| 3-Person Families | 1,610 (23.5%) | $79,079 |
| 4-Person Families | 1,436 (20.9%) | $88,966 |
| 5-Person Families | 869 (12.7%) | $93,618 |
| 6-Person Families | 511 (7.4%) | $112,554 |
| 7+ Person Families | 209 (3.0%) | $81,536 |
| Total | 6,862 (100.0%) | $84,850 |
Family Income by Number of Earners in Magna
The median family income in Magna is $84,850, with families comprising 3+ earners (1,480) having the highest median family income of $125,268, while families with no earners (581) have the lowest median family income of $53,616, accounting for 21.6% and 8.5% of families, respectively.
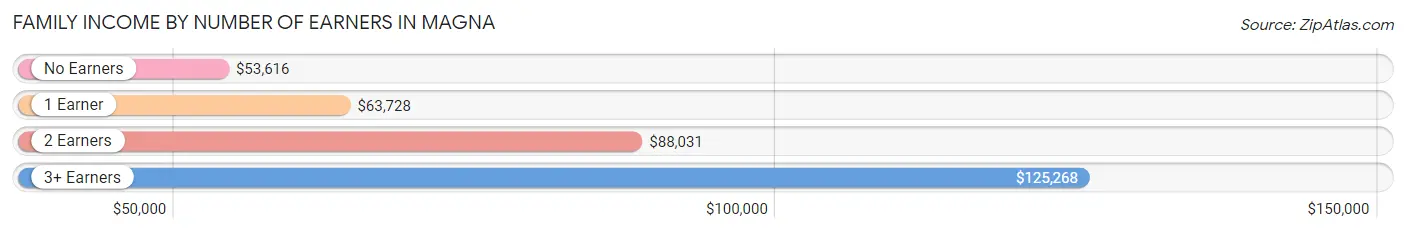
| Number of Earners | # Families | Median Income |
| No Earners | 581 (8.5%) | $53,616 |
| 1 Earner | 1,601 (23.3%) | $63,728 |
| 2 Earners | 3,200 (46.6%) | $88,031 |
| 3+ Earners | 1,480 (21.6%) | $125,268 |
| Total | 6,862 (100.0%) | $84,850 |
Household Income in Magna
Household Income Brackets in Magna
With 2,045 households falling in the category, the $100,000 to $149,999 income range is the most frequent in Magna, accounting for 23.4% of all households. In contrast, only 26 households (0.3%) fall into the $10,000 to $14,999 income bracket, making it the least populous group.
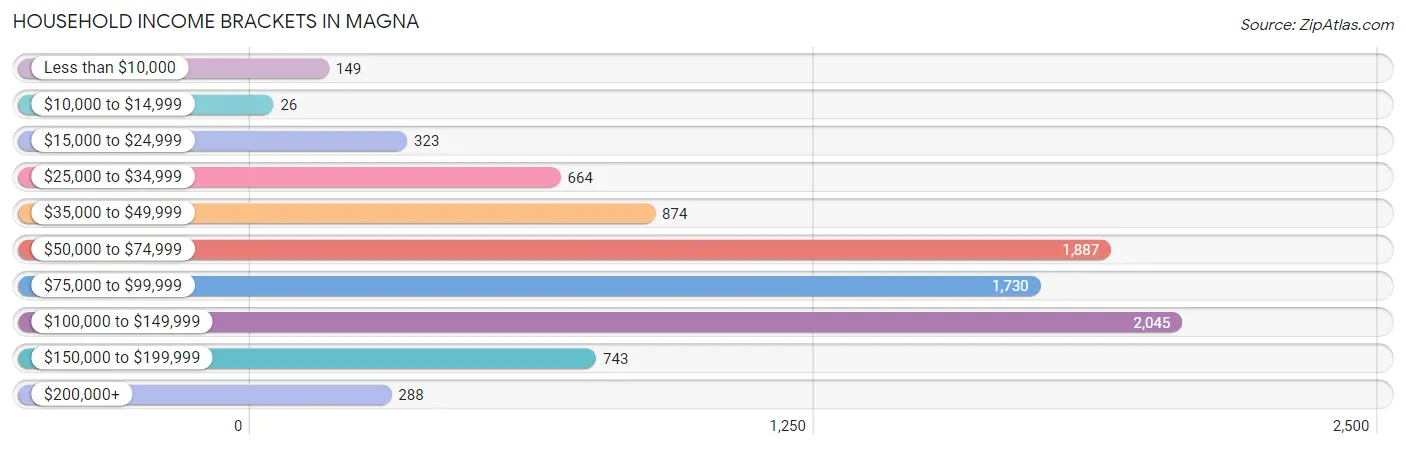
| Income Bracket | # Households | % Households |
| Less than $10,000 | 149 | 1.7% |
| $10,000 to $14,999 | 26 | 0.3% |
| $15,000 to $24,999 | 323 | 3.7% |
| $25,000 to $34,999 | 664 | 7.6% |
| $35,000 to $49,999 | 874 | 10.0% |
| $50,000 to $74,999 | 1,887 | 21.6% |
| $75,000 to $99,999 | 1,730 | 19.8% |
| $100,000 to $149,999 | 2,045 | 23.4% |
| $150,000 to $199,999 | 743 | 8.5% |
| $200,000+ | 288 | 3.3% |
Household Income by Householder Age in Magna
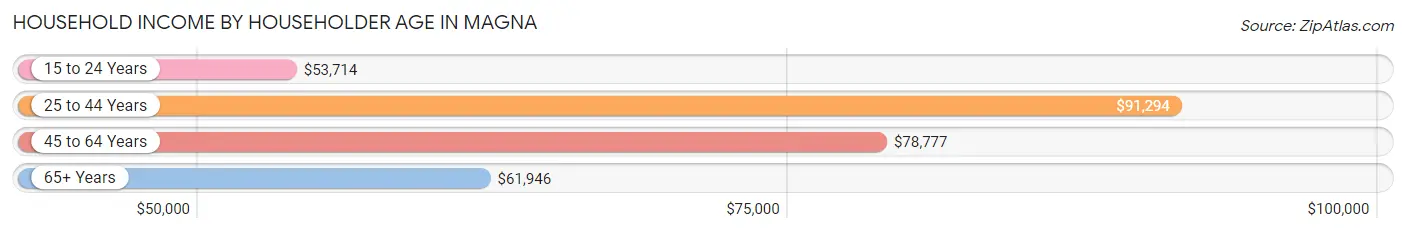
The median household income in Magna is $79,934, with the highest median household income of $91,294 found in the 25 to 44 years age bracket for the primary householder. A total of 3,626 households (41.5%) fall into this category. Meanwhile, the 15 to 24 years age bracket for the primary householder has the lowest median household income of $53,714, with 376 households (4.3%) in this group.
| Income Bracket | # Households | Median Income |
| 15 to 24 Years | 376 (4.3%) | $53,714 |
| 25 to 44 Years | 3,626 (41.5%) | $91,294 |
| 45 to 64 Years | 3,375 (38.6%) | $78,777 |
| 65+ Years | 1,361 (15.6%) | $61,946 |
| Total | 8,738 (100.0%) | $79,934 |
Poverty in Magna
Income Below Poverty by Sex and Age in Magna
With 5.4% poverty level for males and 9.0% for females among the residents of Magna, 15 year old males and under 5 year old females are the most vulnerable to poverty, with 31 males (16.1%) and 244 females (22.8%) in their respective age groups living below the poverty level.
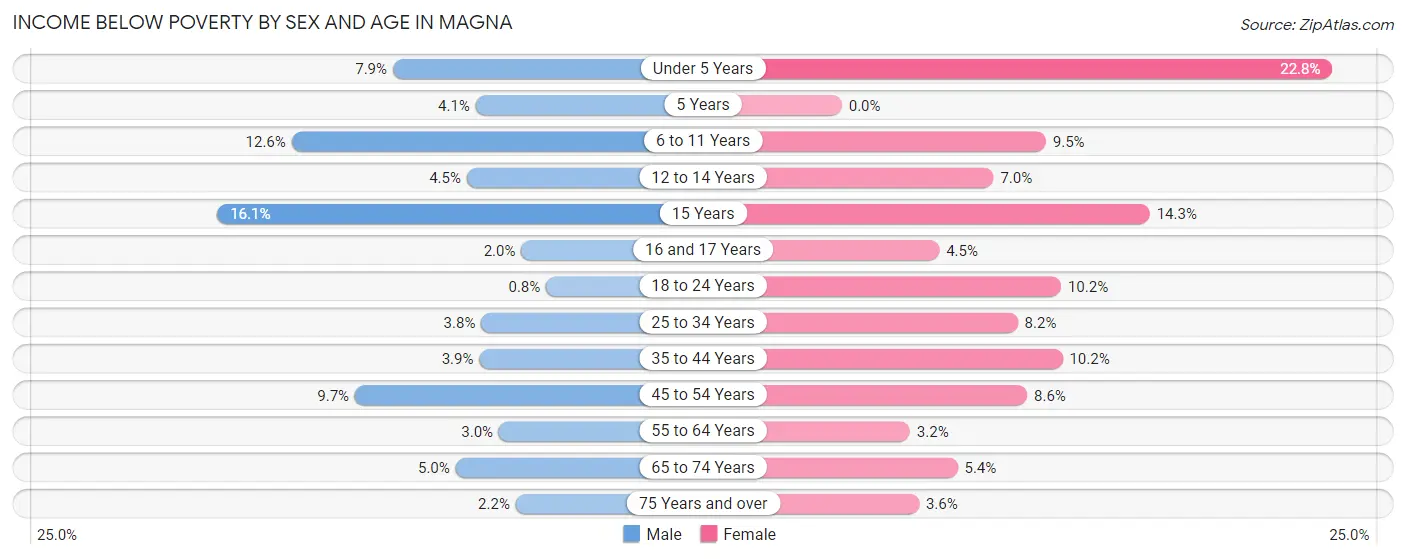
| Age Bracket | Male | Female |
| Under 5 Years | 100 (7.9%) | 244 (22.8%) |
| 5 Years | 9 (4.1%) | 0 (0.0%) |
| 6 to 11 Years | 174 (12.6%) | 135 (9.5%) |
| 12 to 14 Years | 33 (4.5%) | 39 (7.0%) |
| 15 Years | 31 (16.1%) | 33 (14.3%) |
| 16 and 17 Years | 10 (1.9%) | 23 (4.5%) |
| 18 to 24 Years | 12 (0.8%) | 117 (10.2%) |
| 25 to 34 Years | 81 (3.8%) | 169 (8.2%) |
| 35 to 44 Years | 98 (3.9%) | 235 (10.2%) |
| 45 to 54 Years | 163 (9.7%) | 162 (8.6%) |
| 55 to 64 Years | 52 (3.0%) | 47 (3.2%) |
| 65 to 74 Years | 37 (5.0%) | 44 (5.4%) |
| 75 Years and over | 8 (2.2%) | 13 (3.6%) |
| Total | 808 (5.4%) | 1,261 (9.0%) |
Income Above Poverty by Sex and Age in Magna
According to the poverty statistics in Magna, males aged 18 to 24 years and females aged 5 years are the age groups that are most secure financially, with 99.2% of males and 100.0% of females in these age groups living above the poverty line.
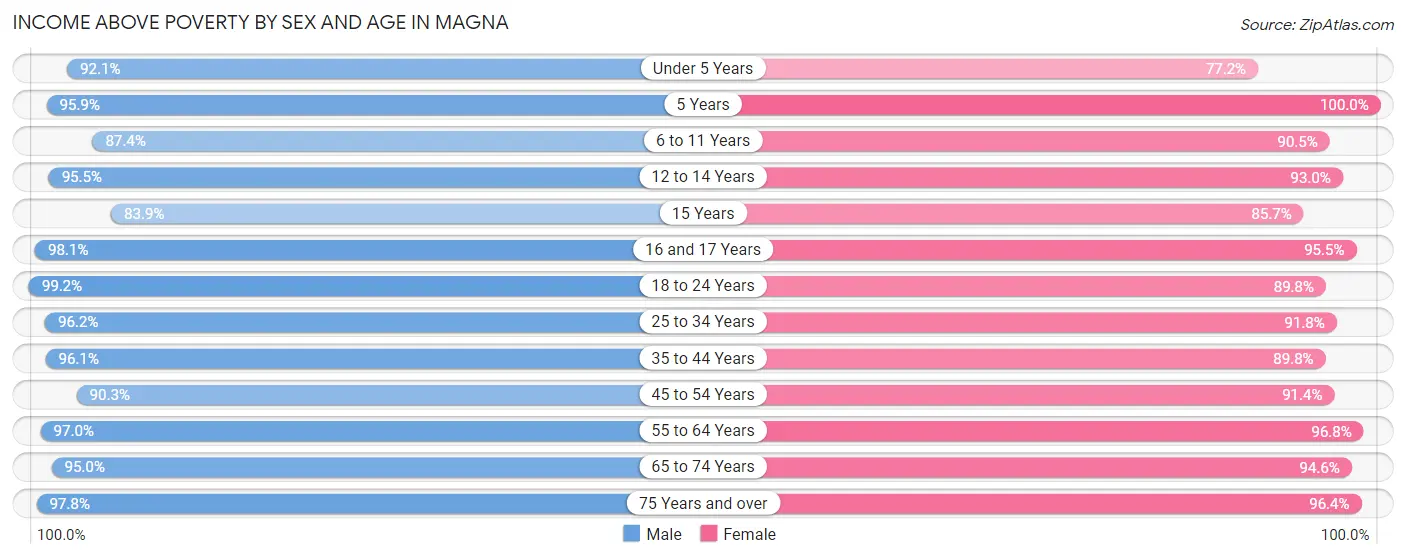
| Age Bracket | Male | Female |
| Under 5 Years | 1,165 (92.1%) | 828 (77.2%) |
| 5 Years | 212 (95.9%) | 109 (100.0%) |
| 6 to 11 Years | 1,206 (87.4%) | 1,290 (90.5%) |
| 12 to 14 Years | 704 (95.5%) | 515 (93.0%) |
| 15 Years | 162 (83.9%) | 198 (85.7%) |
| 16 and 17 Years | 502 (98.1%) | 486 (95.5%) |
| 18 to 24 Years | 1,485 (99.2%) | 1,033 (89.8%) |
| 25 to 34 Years | 2,043 (96.2%) | 1,902 (91.8%) |
| 35 to 44 Years | 2,418 (96.1%) | 2,061 (89.8%) |
| 45 to 54 Years | 1,522 (90.3%) | 1,721 (91.4%) |
| 55 to 64 Years | 1,690 (97.0%) | 1,440 (96.8%) |
| 65 to 74 Years | 703 (95.0%) | 776 (94.6%) |
| 75 Years and over | 354 (97.8%) | 350 (96.4%) |
| Total | 14,166 (94.6%) | 12,709 (91.0%) |
Income Below Poverty Among Married-Couple Families in Magna
The poverty statistics for married-couple families in Magna show that 2.4% or 115 of the total 4,708 families live below the poverty line. Families with 5 or more children have the highest poverty rate of 45.6%, comprising of 31 families. On the other hand, families with 1 or 2 children have the lowest poverty rate of 0.7%, which includes 11 families.
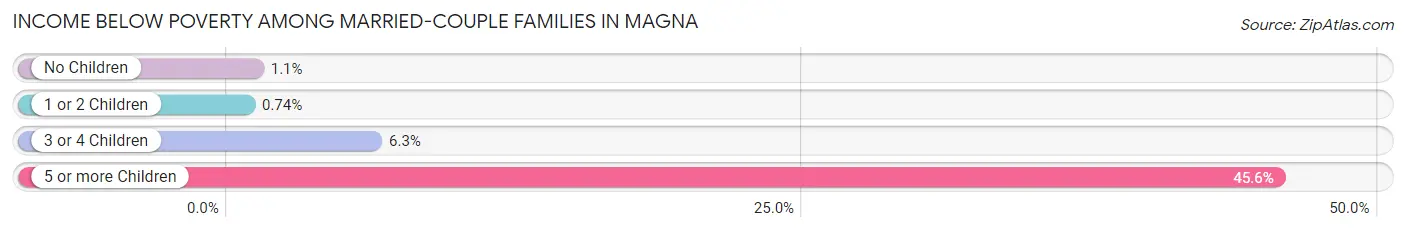
| Children | Above Poverty | Below Poverty |
| No Children | 2,387 (98.9%) | 27 (1.1%) |
| 1 or 2 Children | 1,481 (99.3%) | 11 (0.7%) |
| 3 or 4 Children | 688 (93.7%) | 46 (6.3%) |
| 5 or more Children | 37 (54.4%) | 31 (45.6%) |
| Total | 4,593 (97.6%) | 115 (2.4%) |
Income Below Poverty Among Single-Parent Households in Magna
According to the poverty data in Magna, 2.9% or 23 single-father households and 11.6% or 157 single-mother households are living below the poverty line. Among single-father households, those with 1 or 2 children have the highest poverty rate, with 14 households (3.7%) experiencing poverty. Likewise, among single-mother households, those with 1 or 2 children have the highest poverty rate, with 118 households (16.1%) falling below the poverty line.
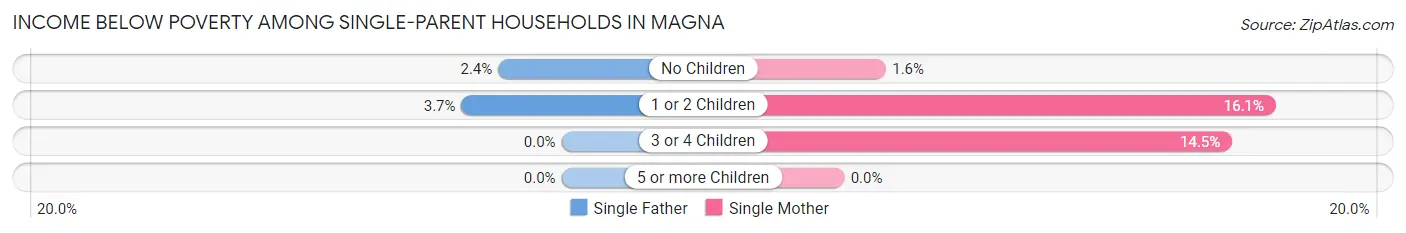
| Children | Single Father | Single Mother |
| No Children | 9 (2.4%) | 6 (1.5%) |
| 1 or 2 Children | 14 (3.7%) | 118 (16.1%) |
| 3 or 4 Children | 0 (0.0%) | 33 (14.5%) |
| 5 or more Children | 0 (0.0%) | 0 (0.0%) |
| Total | 23 (2.9%) | 157 (11.6%) |
Income Below Poverty Among Married-Couple vs Single-Parent Households in Magna
The poverty data for Magna shows that 115 of the married-couple family households (2.4%) and 180 of the single-parent households (8.4%) are living below the poverty level. Within the married-couple family households, those with 5 or more children have the highest poverty rate, with 31 households (45.6%) falling below the poverty line. Among the single-parent households, those with 3 or 4 children have the highest poverty rate, with 33 household (14.1%) living below poverty.
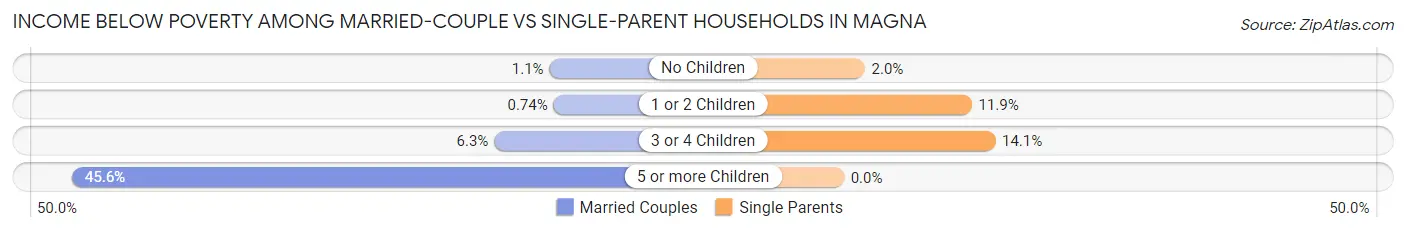
| Children | Married-Couple Families | Single-Parent Households |
| No Children | 27 (1.1%) | 15 (1.9%) |
| 1 or 2 Children | 11 (0.7%) | 132 (11.9%) |
| 3 or 4 Children | 46 (6.3%) | 33 (14.1%) |
| 5 or more Children | 31 (45.6%) | 0 (0.0%) |
| Total | 115 (2.4%) | 180 (8.4%) |
Race in Magna
The most populous races in Magna are White / Caucasian (18,996 | 64.9%), Hispanic or Latino (9,698 | 33.1%), and Some other Race (5,467 | 18.7%).
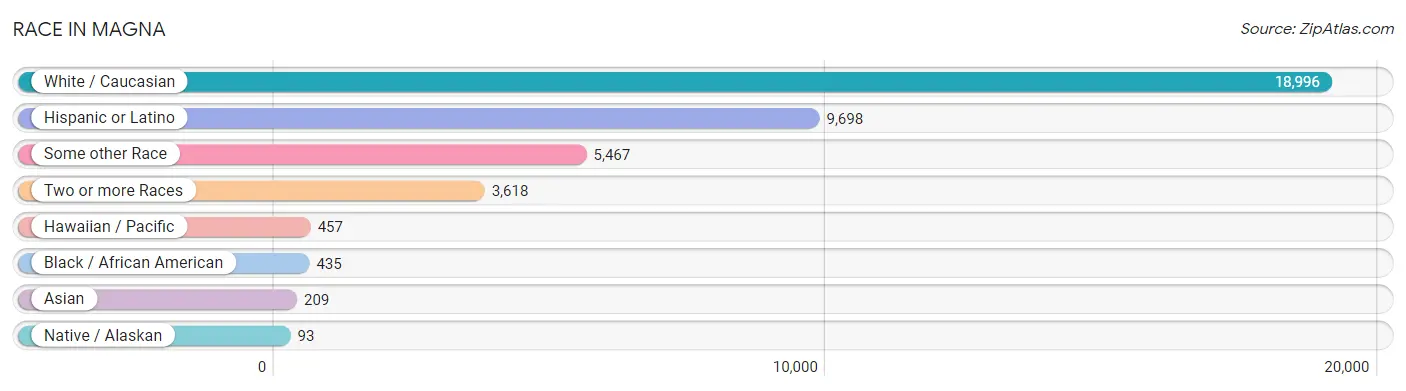
| Race | # Population | % Population |
| Asian | 209 | 0.7% |
| Black / African American | 435 | 1.5% |
| Hawaiian / Pacific | 457 | 1.6% |
| Hispanic or Latino | 9,698 | 33.1% |
| Native / Alaskan | 93 | 0.3% |
| White / Caucasian | 18,996 | 64.9% |
| Two or more Races | 3,618 | 12.4% |
| Some other Race | 5,467 | 18.7% |
| Total | 29,275 | 100.0% |
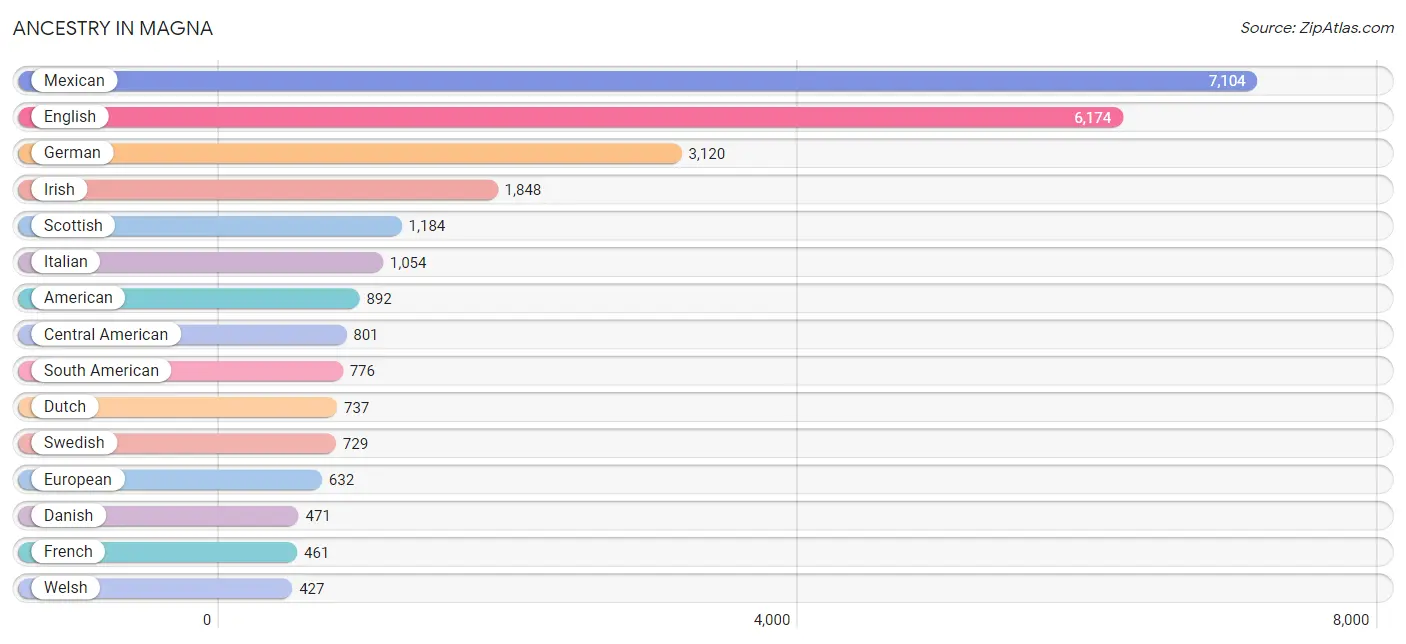
Ancestry in Magna
The most populous ancestries reported in Magna are Mexican (7,104 | 24.3%), English (6,174 | 21.1%), German (3,120 | 10.7%), Irish (1,848 | 6.3%), and Scottish (1,184 | 4.0%), together accounting for 66.4% of all Magna residents.
| Ancestry | # Population | % Population |
| Albanian | 96 | 0.3% |
| American | 892 | 3.0% |
| Armenian | 8 | 0.0% |
| Austrian | 18 | 0.1% |
| Belgian | 52 | 0.2% |
| Bhutanese | 175 | 0.6% |
| Brazilian | 30 | 0.1% |
| British | 149 | 0.5% |
| Burmese | 23 | 0.1% |
| Canadian | 8 | 0.0% |
| Central American | 801 | 2.7% |
| Central American Indian | 18 | 0.1% |
| Chilean | 76 | 0.3% |
| Colombian | 120 | 0.4% |
| Costa Rican | 16 | 0.1% |
| Cuban | 103 | 0.4% |
| Danish | 471 | 1.6% |
| Dutch | 737 | 2.5% |
| Eastern European | 32 | 0.1% |
| English | 6,174 | 21.1% |
| European | 632 | 2.2% |
| Finnish | 103 | 0.4% |
| French | 461 | 1.6% |
| French Canadian | 7 | 0.0% |
| German | 3,120 | 10.7% |
| Greek | 240 | 0.8% |
| Guatemalan | 61 | 0.2% |
| Honduran | 364 | 1.2% |
| Hungarian | 60 | 0.2% |
| Icelander | 11 | 0.0% |
| Indian (Asian) | 206 | 0.7% |
| Indonesian | 41 | 0.1% |
| Iranian | 34 | 0.1% |
| Irish | 1,848 | 6.3% |
| Italian | 1,054 | 3.6% |
| Jamaican | 35 | 0.1% |
| Japanese | 27 | 0.1% |
| Korean | 136 | 0.5% |
| Laotian | 11 | 0.0% |
| Lithuanian | 24 | 0.1% |
| Luxembourger | 15 | 0.1% |
| Malaysian | 6 | 0.0% |
| Mexican | 7,104 | 24.3% |
| Mexican American Indian | 14 | 0.1% |
| Navajo | 164 | 0.6% |
| New Zealander | 42 | 0.1% |
| Northern European | 107 | 0.4% |
| Norwegian | 373 | 1.3% |
| Peruvian | 370 | 1.3% |
| Polish | 344 | 1.2% |
| Portuguese | 28 | 0.1% |
| Puerto Rican | 110 | 0.4% |
| Romanian | 52 | 0.2% |
| Russian | 24 | 0.1% |
| Salvadoran | 360 | 1.2% |
| Samoan | 378 | 1.3% |
| Scandinavian | 93 | 0.3% |
| Scotch-Irish | 242 | 0.8% |
| Scottish | 1,184 | 4.0% |
| Shoshone | 220 | 0.7% |
| Sioux | 15 | 0.1% |
| Somali | 240 | 0.8% |
| South American | 776 | 2.6% |
| Spaniard | 120 | 0.4% |
| Spanish | 313 | 1.1% |
| Subsaharan African | 275 | 0.9% |
| Swedish | 729 | 2.5% |
| Swiss | 229 | 0.8% |
| Tlingit-Haida | 108 | 0.4% |
| Tongan | 286 | 1.0% |
| Ukrainian | 21 | 0.1% |
| Ute | 37 | 0.1% |
| Venezuelan | 210 | 0.7% |
| Welsh | 427 | 1.5% |
| Yugoslavian | 7 | 0.0% | View All 75 Rows |
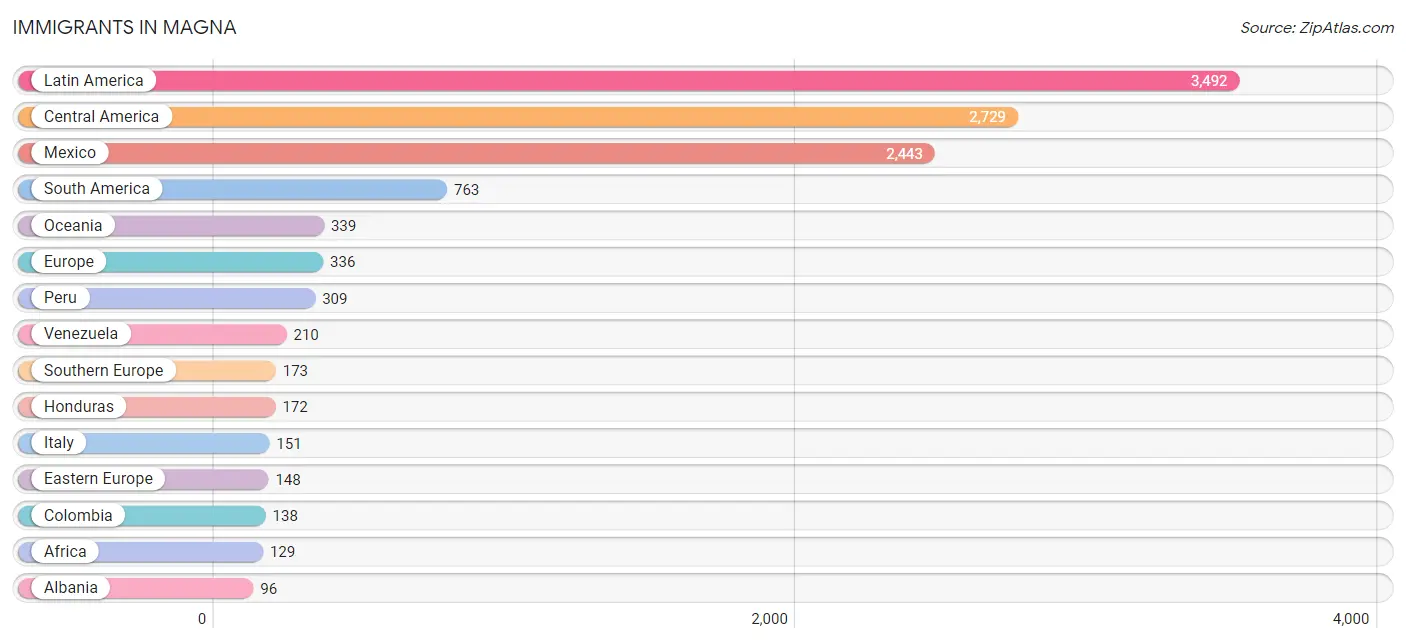
Immigrants in Magna
The most numerous immigrant groups reported in Magna came from Latin America (3,492 | 11.9%), Central America (2,729 | 9.3%), Mexico (2,443 | 8.4%), South America (763 | 2.6%), and Oceania (339 | 1.2%), together accounting for 33.4% of all Magna residents.
| Immigration Origin | # Population | % Population |
| Africa | 129 | 0.4% |
| Albania | 96 | 0.3% |
| Asia | 90 | 0.3% |
| Brazil | 30 | 0.1% |
| Cambodia | 15 | 0.1% |
| Canada | 9 | 0.0% |
| Central America | 2,729 | 9.3% |
| Chile | 76 | 0.3% |
| China | 26 | 0.1% |
| Colombia | 138 | 0.5% |
| Costa Rica | 16 | 0.1% |
| Eastern Africa | 94 | 0.3% |
| Eastern Asia | 30 | 0.1% |
| Eastern Europe | 148 | 0.5% |
| El Salvador | 90 | 0.3% |
| Europe | 336 | 1.1% |
| Fiji | 66 | 0.2% |
| Guatemala | 8 | 0.0% |
| Honduras | 172 | 0.6% |
| Hong Kong | 26 | 0.1% |
| Italy | 151 | 0.5% |
| Japan | 4 | 0.0% |
| Kenya | 33 | 0.1% |
| Latin America | 3,492 | 11.9% |
| Liberia | 35 | 0.1% |
| Mexico | 2,443 | 8.4% |
| Northern Europe | 15 | 0.1% |
| Oceania | 339 | 1.2% |
| Pakistan | 4 | 0.0% |
| Peru | 309 | 1.1% |
| Romania | 52 | 0.2% |
| Somalia | 61 | 0.2% |
| South America | 763 | 2.6% |
| South Central Asia | 4 | 0.0% |
| South Eastern Asia | 56 | 0.2% |
| Southern Europe | 173 | 0.6% |
| Spain | 22 | 0.1% |
| Venezuela | 210 | 0.7% |
| Western Africa | 35 | 0.1% | View All 39 Rows |
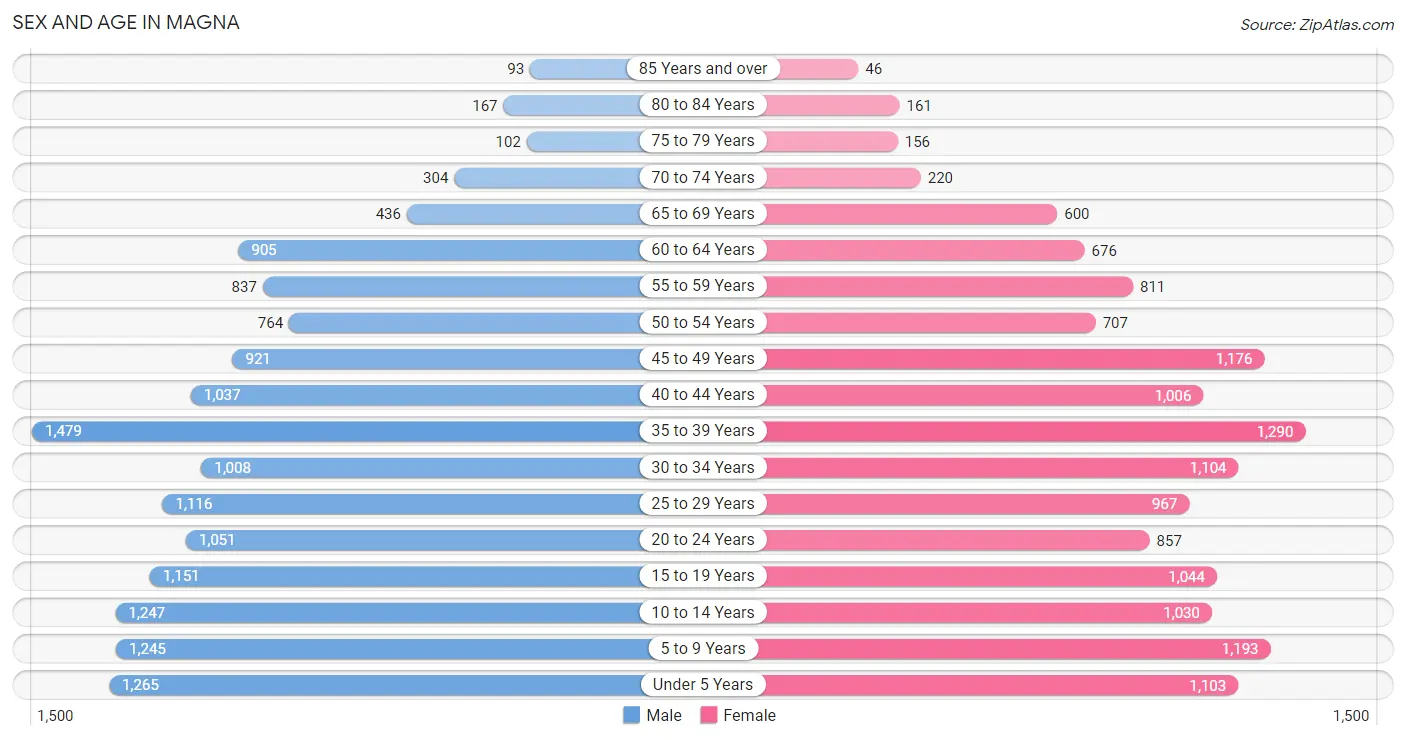
Sex and Age in Magna
Sex and Age in Magna
The most populous age groups in Magna are 35 to 39 Years (1,479 | 9.8%) for men and 35 to 39 Years (1,290 | 9.1%) for women.
| Age Bracket | Male | Female |
| Under 5 Years | 1,265 (8.4%) | 1,103 (7.8%) |
| 5 to 9 Years | 1,245 (8.2%) | 1,193 (8.4%) |
| 10 to 14 Years | 1,247 (8.2%) | 1,030 (7.3%) |
| 15 to 19 Years | 1,151 (7.6%) | 1,044 (7.4%) |
| 20 to 24 Years | 1,051 (7.0%) | 857 (6.1%) |
| 25 to 29 Years | 1,116 (7.4%) | 967 (6.8%) |
| 30 to 34 Years | 1,008 (6.7%) | 1,104 (7.8%) |
| 35 to 39 Years | 1,479 (9.8%) | 1,290 (9.1%) |
| 40 to 44 Years | 1,037 (6.9%) | 1,006 (7.1%) |
| 45 to 49 Years | 921 (6.1%) | 1,176 (8.3%) |
| 50 to 54 Years | 764 (5.1%) | 707 (5.0%) |
| 55 to 59 Years | 837 (5.5%) | 811 (5.7%) |
| 60 to 64 Years | 905 (6.0%) | 676 (4.8%) |
| 65 to 69 Years | 436 (2.9%) | 600 (4.2%) |
| 70 to 74 Years | 304 (2.0%) | 220 (1.6%) |
| 75 to 79 Years | 102 (0.7%) | 156 (1.1%) |
| 80 to 84 Years | 167 (1.1%) | 161 (1.1%) |
| 85 Years and over | 93 (0.6%) | 46 (0.3%) |
| Total | 15,128 (100.0%) | 14,147 (100.0%) |
Families and Households in Magna
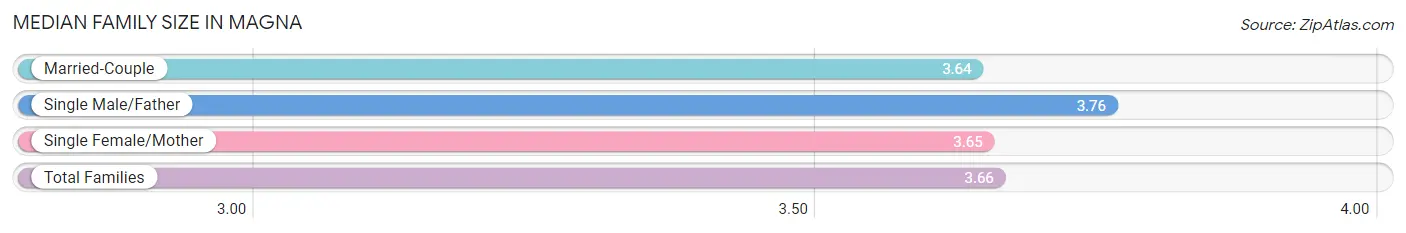
Median Family Size in Magna
The median family size in Magna is 3.66 persons per family, with single male/father families (803 | 11.7%) accounting for the largest median family size of 3.76 persons per family. On the other hand, married-couple families (4,708 | 68.6%) represent the smallest median family size with 3.64 persons per family.
| Family Type | # Families | Family Size |
| Married-Couple | 4,708 (68.6%) | 3.64 |
| Single Male/Father | 803 (11.7%) | 3.76 |
| Single Female/Mother | 1,351 (19.7%) | 3.65 |
| Total Families | 6,862 (100.0%) | 3.66 |
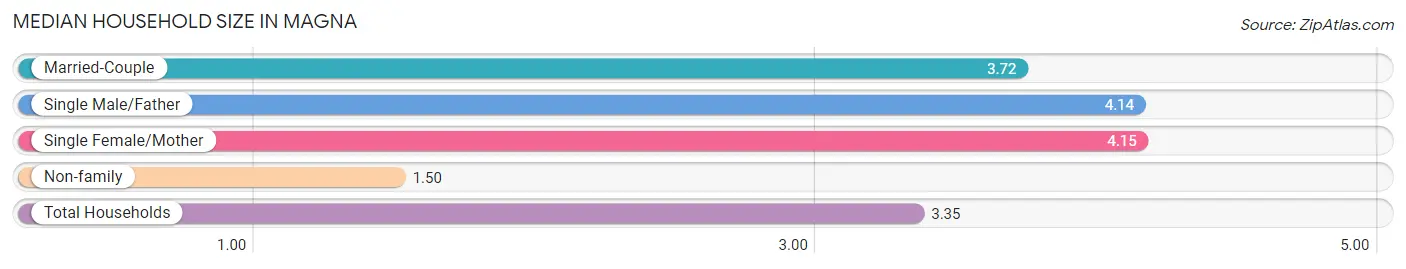
Median Household Size in Magna
The median household size in Magna is 3.35 persons per household, with single female/mother households (1,351 | 15.5%) accounting for the largest median household size of 4.15 persons per household. non-family households (1,876 | 21.5%) represent the smallest median household size with 1.50 persons per household.
| Household Type | # Households | Household Size |
| Married-Couple | 4,708 (53.9%) | 3.72 |
| Single Male/Father | 803 (9.2%) | 4.14 |
| Single Female/Mother | 1,351 (15.5%) | 4.15 |
| Non-family | 1,876 (21.5%) | 1.50 |
| Total Households | 8,738 (100.0%) | 3.35 |
Household Size by Marriage Status in Magna
Out of a total of 8,738 households in Magna, 6,862 (78.5%) are family households, while 1,876 (21.5%) are nonfamily households. The most numerous type of family households are 2-person households, comprising 1,909, and the most common type of nonfamily households are 1-person households, comprising 1,382.
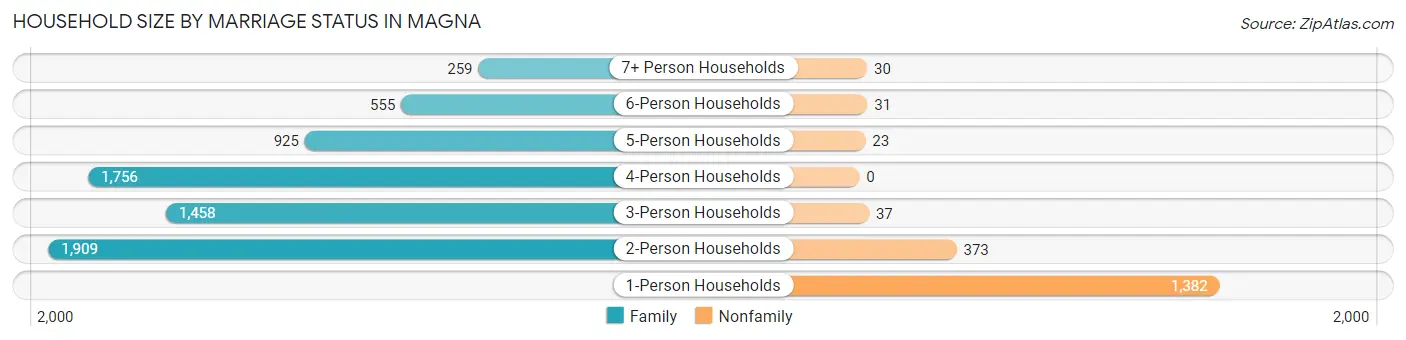
| Household Size | Family Households | Nonfamily Households |
| 1-Person Households | - | 1,382 (15.8%) |
| 2-Person Households | 1,909 (21.8%) | 373 (4.3%) |
| 3-Person Households | 1,458 (16.7%) | 37 (0.4%) |
| 4-Person Households | 1,756 (20.1%) | 0 (0.0%) |
| 5-Person Households | 925 (10.6%) | 23 (0.3%) |
| 6-Person Households | 555 (6.4%) | 31 (0.4%) |
| 7+ Person Households | 259 (3.0%) | 30 (0.3%) |
| Total | 6,862 (78.5%) | 1,876 (21.5%) |
Female Fertility in Magna
Fertility by Age in Magna
Average fertility rate in Magna is 51.0 births per 1,000 women. Women in the age bracket of 20 to 34 years have the highest fertility rate with 92.0 births per 1,000 women. Women in the age bracket of 20 to 34 years acount for 69.0% of all women with births.
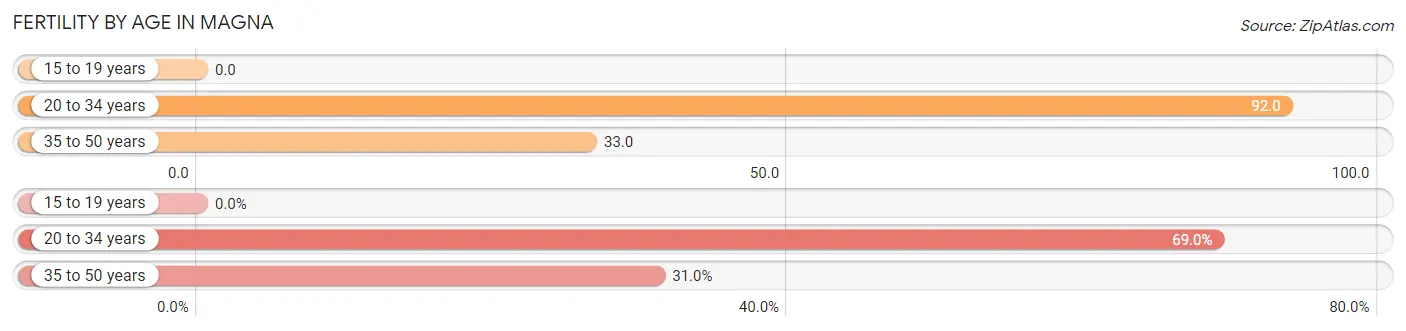
| Age Bracket | Women with Births | Births / 1,000 Women |
| 15 to 19 years | 0 (0.0%) | 0.0 |
| 20 to 34 years | 269 (69.0%) | 92.0 |
| 35 to 50 years | 121 (31.0%) | 33.0 |
| Total | 390 (100.0%) | 51.0 |
Fertility by Age by Marriage Status in Magna
66.9% of women with births (390) in Magna are married. The highest percentage of unmarried women with births falls into 35 to 50 years age bracket with 57.9% of them unmarried at the time of birth, while the lowest percentage of unmarried women with births belong to 20 to 34 years age bracket with 21.9% of them unmarried.
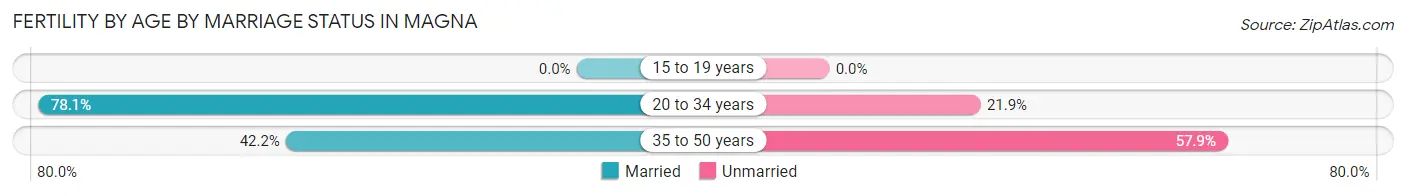
| Age Bracket | Married | Unmarried |
| 15 to 19 years | 0 (0.0%) | 0 (0.0%) |
| 20 to 34 years | 210 (78.1%) | 59 (21.9%) |
| 35 to 50 years | 51 (42.1%) | 70 (57.9%) |
| Total | 261 (66.9%) | 129 (33.1%) |
Fertility by Education in Magna
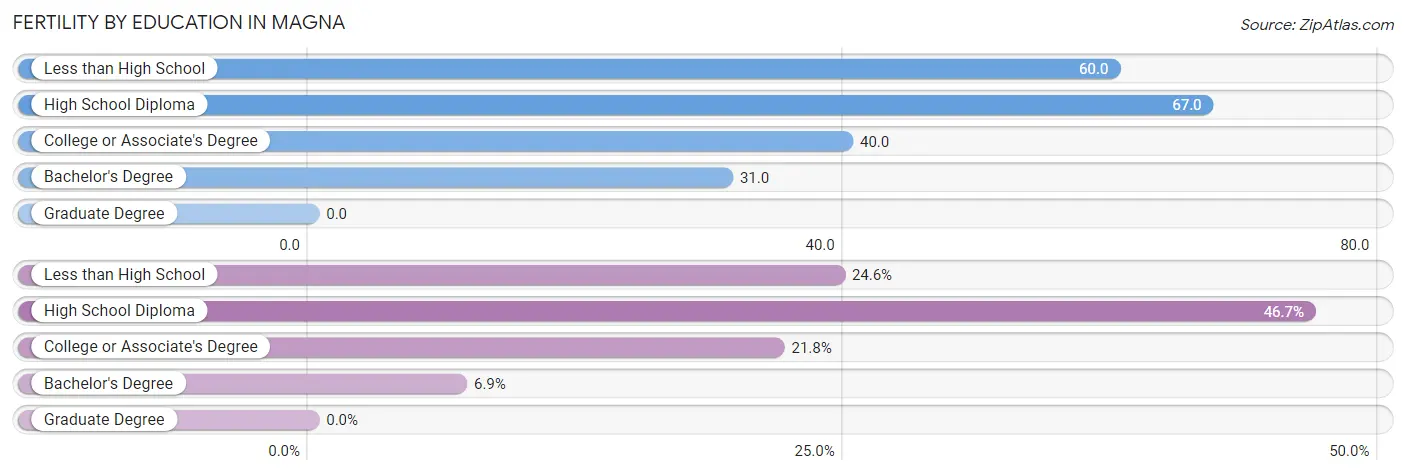
| Educational Attainment | Women with Births | Births / 1,000 Women |
| Less than High School | 96 (24.6%) | 60.0 |
| High School Diploma | 182 (46.7%) | 67.0 |
| College or Associate's Degree | 85 (21.8%) | 40.0 |
| Bachelor's Degree | 27 (6.9%) | 31.0 |
| Graduate Degree | 0 (0.0%) | 0.0 |
| Total | 390 (100.0%) | 51.0 |
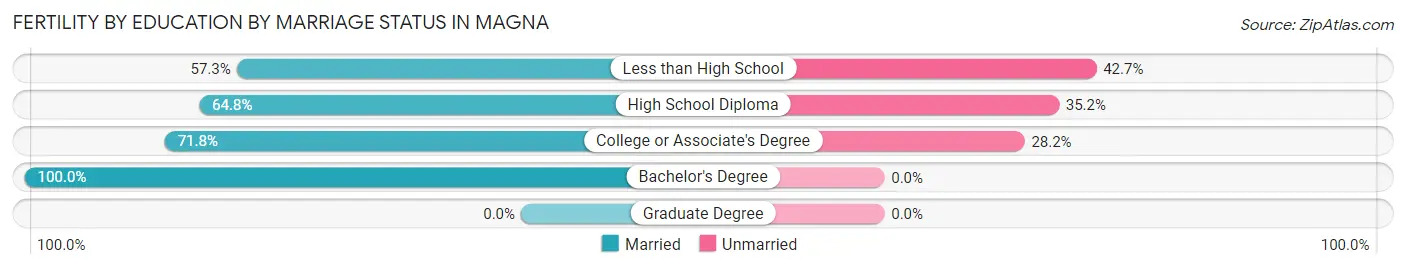
Fertility by Education by Marriage Status in Magna
33.1% of women with births in Magna are unmarried. Women with the educational attainment of bachelor's degree are most likely to be married with 100.0% of them married at childbirth, while women with the educational attainment of less than high school are least likely to be married with 42.7% of them unmarried at childbirth.
| Educational Attainment | Married | Unmarried |
| Less than High School | 55 (57.3%) | 41 (42.7%) |
| High School Diploma | 118 (64.8%) | 64 (35.2%) |
| College or Associate's Degree | 61 (71.8%) | 24 (28.2%) |
| Bachelor's Degree | 27 (100.0%) | 0 (0.0%) |
| Graduate Degree | 0 (0.0%) | 0 (0.0%) |
| Total | 261 (66.9%) | 129 (33.1%) |
Employment Characteristics in Magna
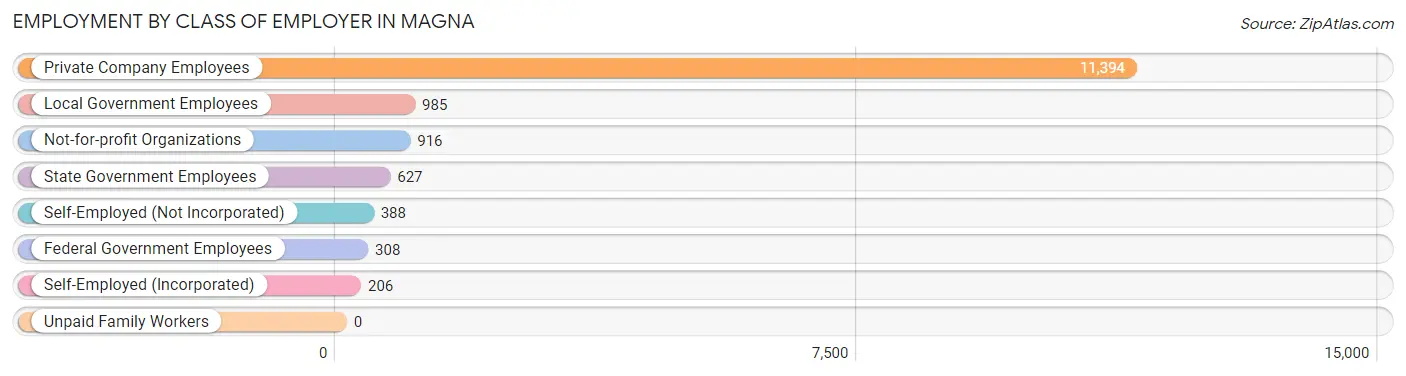
Employment by Class of Employer in Magna
Among the 14,824 employed individuals in Magna, private company employees (11,394 | 76.9%), local government employees (985 | 6.6%), and not-for-profit organizations (916 | 6.2%) make up the most common classes of employment.
| Employer Class | # Employees | % Employees |
| Private Company Employees | 11,394 | 76.9% |
| Self-Employed (Incorporated) | 206 | 1.4% |
| Self-Employed (Not Incorporated) | 388 | 2.6% |
| Not-for-profit Organizations | 916 | 6.2% |
| Local Government Employees | 985 | 6.6% |
| State Government Employees | 627 | 4.2% |
| Federal Government Employees | 308 | 2.1% |
| Unpaid Family Workers | 0 | 0.0% |
| Total | 14,824 | 100.0% |
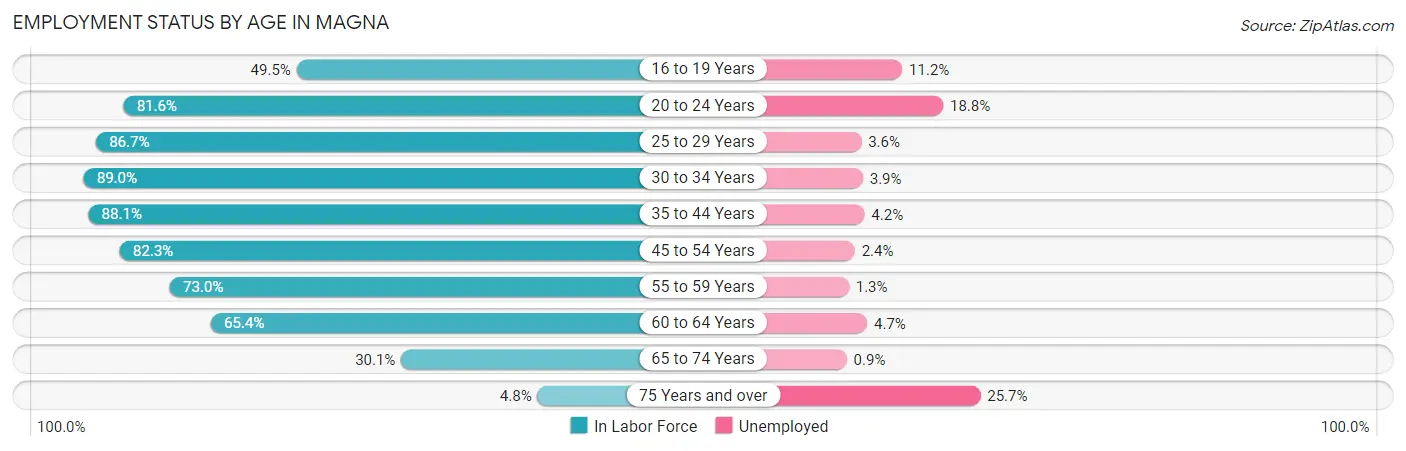
Employment Status by Age in Magna
According to the labor force statistics for Magna, out of the total population over 16 years of age (21,768), 73.7% or 16,043 individuals are in the labor force, with 5.3% or 850 of them unemployed. The age group with the highest labor force participation rate is 30 to 34 years, with 89.0% or 1,880 individuals in the labor force. Within the labor force, the 75 years and over age range has the highest percentage of unemployed individuals, with 25.7% or 9 of them being unemployed.
| Age Bracket | In Labor Force | Unemployed |
| 16 to 19 Years | 877 (49.5%) | 98 (11.2%) |
| 20 to 24 Years | 1,557 (81.6%) | 293 (18.8%) |
| 25 to 29 Years | 1,806 (86.7%) | 65 (3.6%) |
| 30 to 34 Years | 1,880 (89.0%) | 73 (3.9%) |
| 35 to 44 Years | 4,239 (88.1%) | 178 (4.2%) |
| 45 to 54 Years | 2,936 (82.3%) | 70 (2.4%) |
| 55 to 59 Years | 1,203 (73.0%) | 16 (1.3%) |
| 60 to 64 Years | 1,034 (65.4%) | 49 (4.7%) |
| 65 to 74 Years | 470 (30.1%) | 4 (0.9%) |
| 75 Years and over | 35 (4.8%) | 9 (25.7%) |
| Total | 16,043 (73.7%) | 850 (5.3%) |
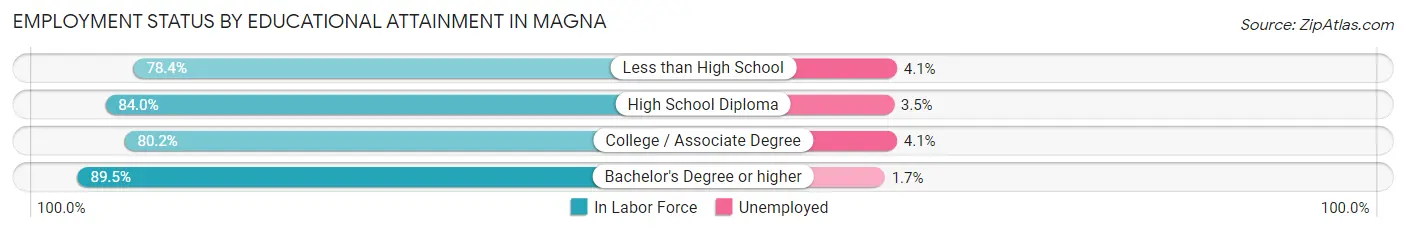
Employment Status by Educational Attainment in Magna
According to labor force statistics for Magna, 82.9% of individuals (13,102) out of the total population between 25 and 64 years of age (15,804) are in the labor force, with 3.5% or 459 of them being unemployed. The group with the highest labor force participation rate are those with the educational attainment of bachelor's degree or higher, with 89.5% or 2,211 individuals in the labor force. Within the labor force, individuals with less than high school education have the highest percentage of unemployment, with 4.1% or 80 of them being unemployed.
| Educational Attainment | In Labor Force | Unemployed |
| Less than High School | 1,953 (78.4%) | 102 (4.1%) |
| High School Diploma | 5,413 (84.0%) | 226 (3.5%) |
| College / Associate Degree | 3,528 (80.2%) | 180 (4.1%) |
| Bachelor's Degree or higher | 2,211 (89.5%) | 42 (1.7%) |
| Total | 13,102 (82.9%) | 553 (3.5%) |
Employment Occupations by Sex in Magna
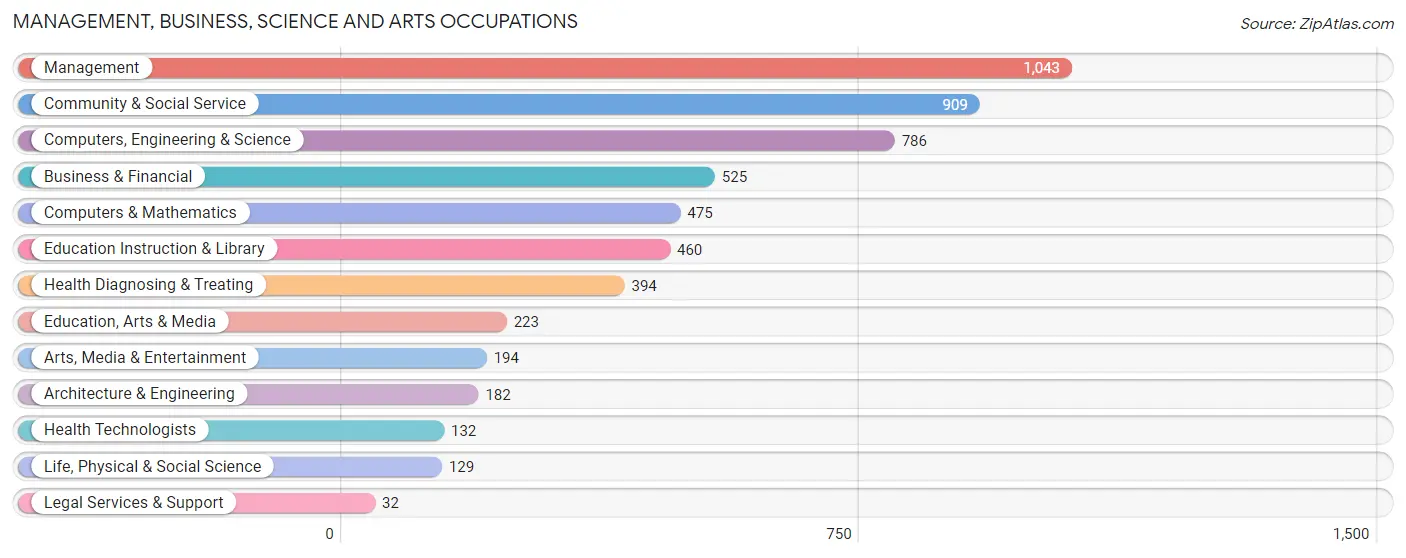
Management, Business, Science and Arts Occupations
The most common Management, Business, Science and Arts occupations in Magna are Management (1,043 | 6.9%), Community & Social Service (909 | 6.0%), Computers, Engineering & Science (786 | 5.2%), Business & Financial (525 | 3.5%), and Computers & Mathematics (475 | 3.1%).
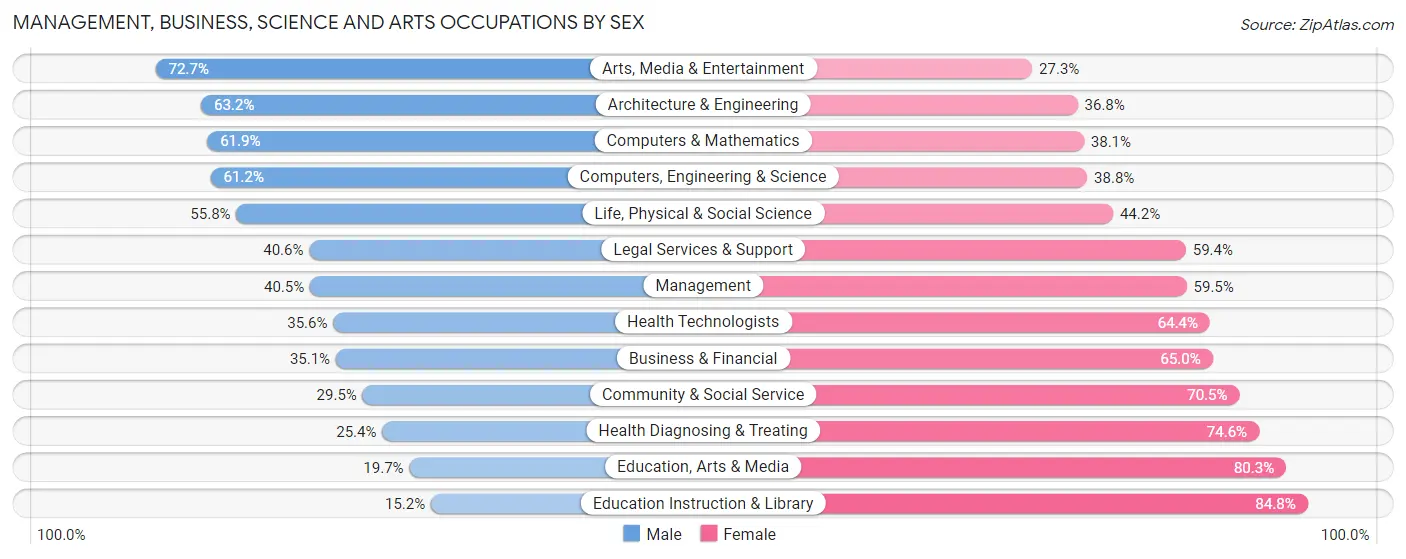
Management, Business, Science and Arts Occupations by Sex
Within the Management, Business, Science and Arts occupations in Magna, the most male-oriented occupations are Arts, Media & Entertainment (72.7%), Architecture & Engineering (63.2%), and Computers & Mathematics (61.9%), while the most female-oriented occupations are Education Instruction & Library (84.8%), Education, Arts & Media (80.3%), and Health Diagnosing & Treating (74.6%).
| Occupation | Male | Female |
| Management | 422 (40.5%) | 621 (59.5%) |
| Business & Financial | 184 (35.0%) | 341 (64.9%) |
| Computers, Engineering & Science | 481 (61.2%) | 305 (38.8%) |
| Computers & Mathematics | 294 (61.9%) | 181 (38.1%) |
| Architecture & Engineering | 115 (63.2%) | 67 (36.8%) |
| Life, Physical & Social Science | 72 (55.8%) | 57 (44.2%) |
| Community & Social Service | 268 (29.5%) | 641 (70.5%) |
| Education, Arts & Media | 44 (19.7%) | 179 (80.3%) |
| Legal Services & Support | 13 (40.6%) | 19 (59.4%) |
| Education Instruction & Library | 70 (15.2%) | 390 (84.8%) |
| Arts, Media & Entertainment | 141 (72.7%) | 53 (27.3%) |
| Health Diagnosing & Treating | 100 (25.4%) | 294 (74.6%) |
| Health Technologists | 47 (35.6%) | 85 (64.4%) |
| Total (Category) | 1,455 (39.8%) | 2,202 (60.2%) |
| Total (Overall) | 8,325 (54.9%) | 6,825 (45.1%) |
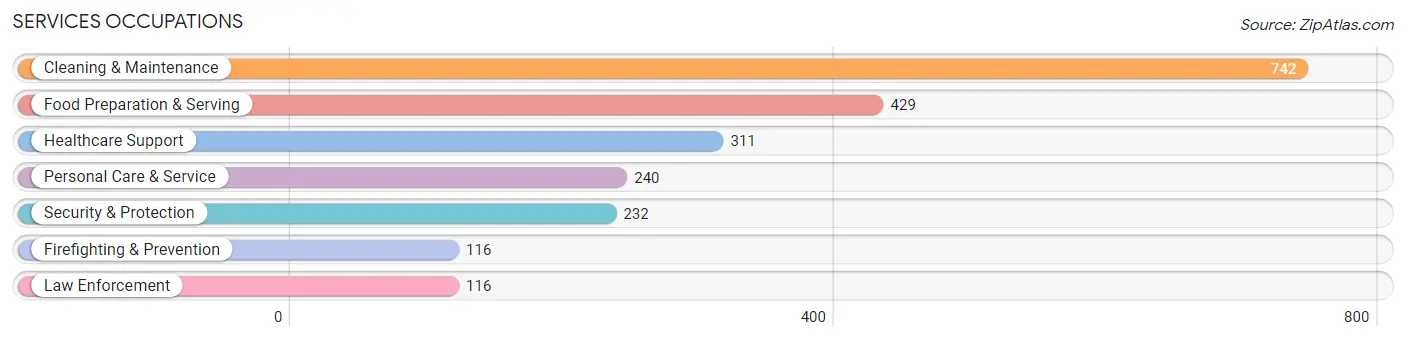
Services Occupations
The most common Services occupations in Magna are Cleaning & Maintenance (742 | 4.9%), Food Preparation & Serving (429 | 2.8%), Healthcare Support (311 | 2.1%), Personal Care & Service (240 | 1.6%), and Security & Protection (232 | 1.5%).
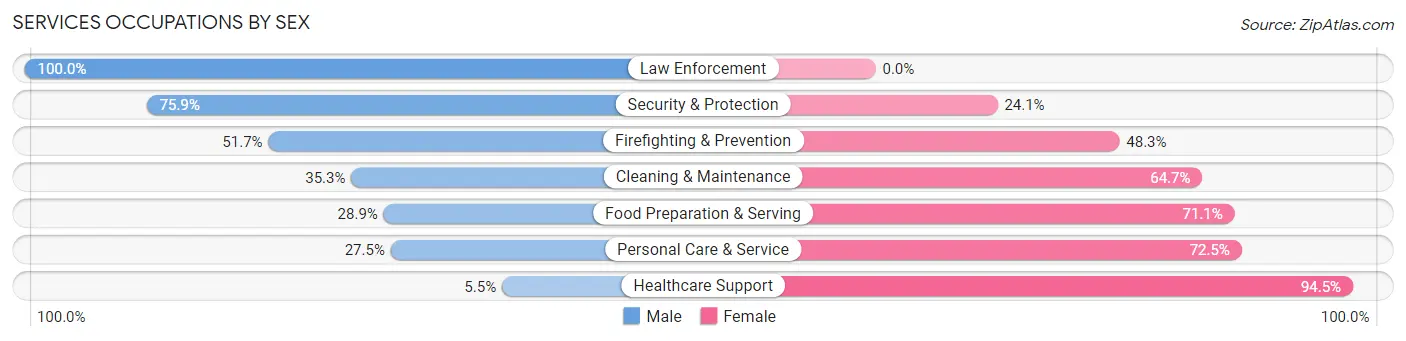
Services Occupations by Sex
Within the Services occupations in Magna, the most male-oriented occupations are Law Enforcement (100.0%), Security & Protection (75.9%), and Firefighting & Prevention (51.7%), while the most female-oriented occupations are Healthcare Support (94.5%), Personal Care & Service (72.5%), and Food Preparation & Serving (71.1%).
| Occupation | Male | Female |
| Healthcare Support | 17 (5.5%) | 294 (94.5%) |
| Security & Protection | 176 (75.9%) | 56 (24.1%) |
| Firefighting & Prevention | 60 (51.7%) | 56 (48.3%) |
| Law Enforcement | 116 (100.0%) | 0 (0.0%) |
| Food Preparation & Serving | 124 (28.9%) | 305 (71.1%) |
| Cleaning & Maintenance | 262 (35.3%) | 480 (64.7%) |
| Personal Care & Service | 66 (27.5%) | 174 (72.5%) |
| Total (Category) | 645 (33.0%) | 1,309 (67.0%) |
| Total (Overall) | 8,325 (54.9%) | 6,825 (45.1%) |
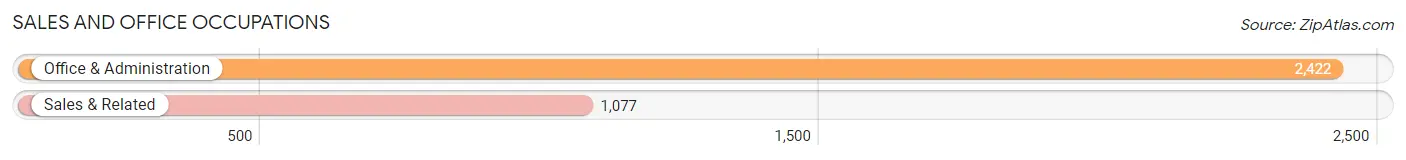
Sales and Office Occupations
The most common Sales and Office occupations in Magna are Office & Administration (2,422 | 16.0%), and Sales & Related (1,077 | 7.1%).
Sales and Office Occupations by Sex
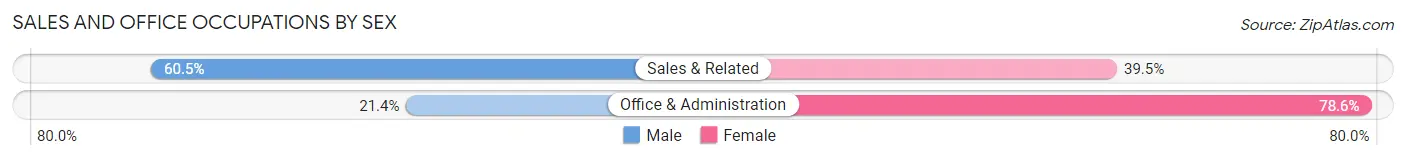
| Occupation | Male | Female |
| Sales & Related | 652 (60.5%) | 425 (39.5%) |
| Office & Administration | 519 (21.4%) | 1,903 (78.6%) |
| Total (Category) | 1,171 (33.5%) | 2,328 (66.5%) |
| Total (Overall) | 8,325 (54.9%) | 6,825 (45.1%) |
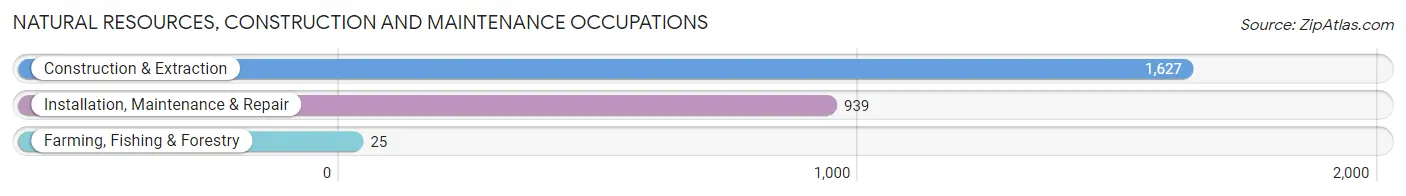
Natural Resources, Construction and Maintenance Occupations
The most common Natural Resources, Construction and Maintenance occupations in Magna are Construction & Extraction (1,627 | 10.7%), Installation, Maintenance & Repair (939 | 6.2%), and Farming, Fishing & Forestry (25 | 0.2%).
Natural Resources, Construction and Maintenance Occupations by Sex
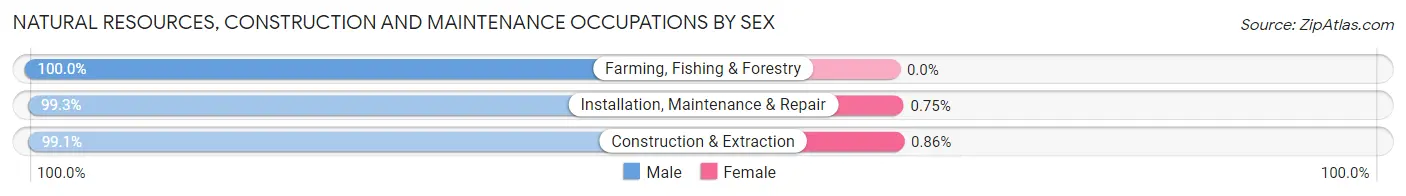
| Occupation | Male | Female |
| Farming, Fishing & Forestry | 25 (100.0%) | 0 (0.0%) |
| Construction & Extraction | 1,613 (99.1%) | 14 (0.9%) |
| Installation, Maintenance & Repair | 932 (99.3%) | 7 (0.7%) |
| Total (Category) | 2,570 (99.2%) | 21 (0.8%) |
| Total (Overall) | 8,325 (54.9%) | 6,825 (45.1%) |
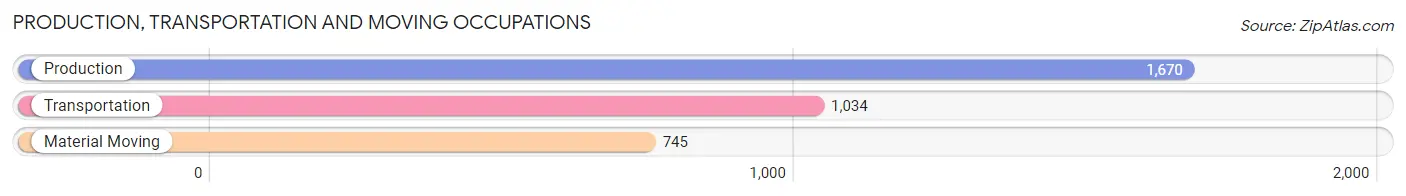
Production, Transportation and Moving Occupations
The most common Production, Transportation and Moving occupations in Magna are Production (1,670 | 11.0%), Transportation (1,034 | 6.8%), and Material Moving (745 | 4.9%).
Production, Transportation and Moving Occupations by Sex
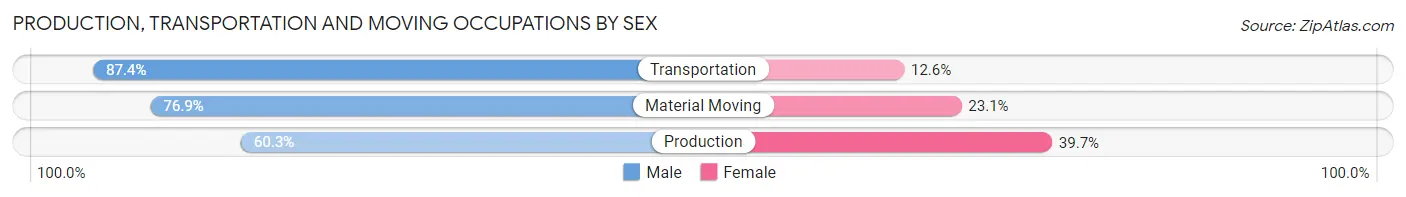
| Occupation | Male | Female |
| Production | 1,007 (60.3%) | 663 (39.7%) |
| Transportation | 904 (87.4%) | 130 (12.6%) |
| Material Moving | 573 (76.9%) | 172 (23.1%) |
| Total (Category) | 2,484 (72.0%) | 965 (28.0%) |
| Total (Overall) | 8,325 (54.9%) | 6,825 (45.1%) |
Employment Industries by Sex in Magna
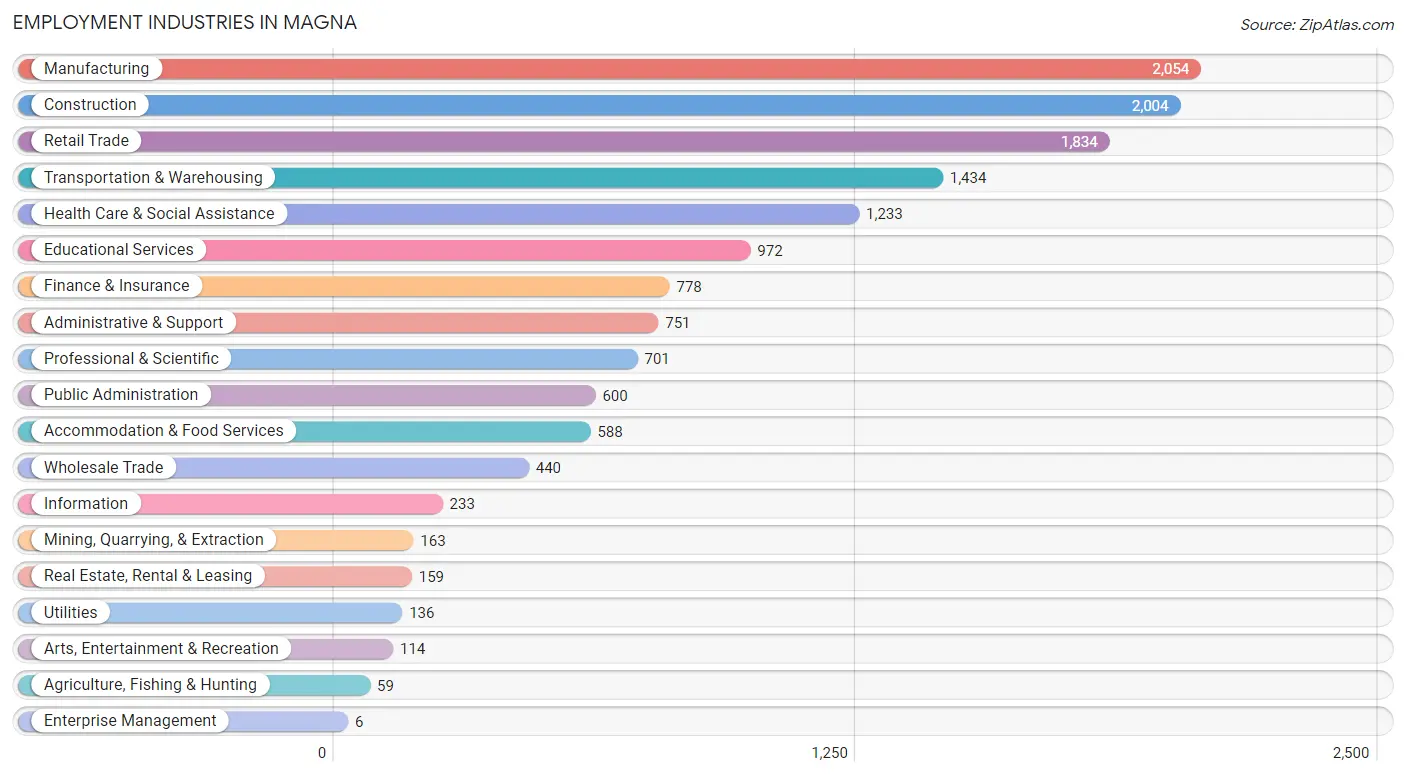
Employment Industries in Magna
The major employment industries in Magna include Manufacturing (2,054 | 13.6%), Construction (2,004 | 13.2%), Retail Trade (1,834 | 12.1%), Transportation & Warehousing (1,434 | 9.5%), and Health Care & Social Assistance (1,233 | 8.1%).
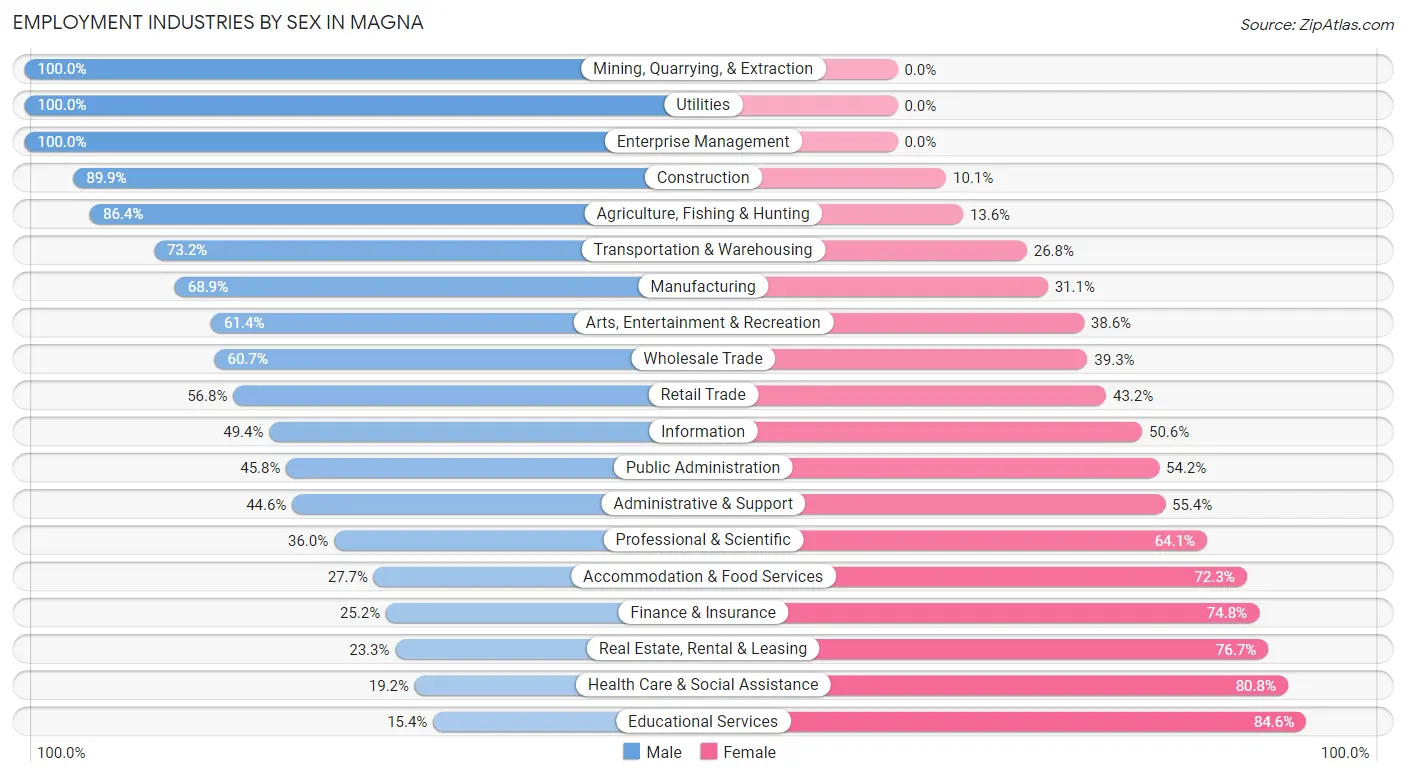
Employment Industries by Sex in Magna
The Magna industries that see more men than women are Mining, Quarrying, & Extraction (100.0%), Utilities (100.0%), and Enterprise Management (100.0%), whereas the industries that tend to have a higher number of women are Educational Services (84.6%), Health Care & Social Assistance (80.8%), and Real Estate, Rental & Leasing (76.7%).
| Industry | Male | Female |
| Agriculture, Fishing & Hunting | 51 (86.4%) | 8 (13.6%) |
| Mining, Quarrying, & Extraction | 163 (100.0%) | 0 (0.0%) |
| Construction | 1,802 (89.9%) | 202 (10.1%) |
| Manufacturing | 1,415 (68.9%) | 639 (31.1%) |
| Wholesale Trade | 267 (60.7%) | 173 (39.3%) |
| Retail Trade | 1,042 (56.8%) | 792 (43.2%) |
| Transportation & Warehousing | 1,050 (73.2%) | 384 (26.8%) |
| Utilities | 136 (100.0%) | 0 (0.0%) |
| Information | 115 (49.4%) | 118 (50.6%) |
| Finance & Insurance | 196 (25.2%) | 582 (74.8%) |
| Real Estate, Rental & Leasing | 37 (23.3%) | 122 (76.7%) |
| Professional & Scientific | 252 (35.9%) | 449 (64.0%) |
| Enterprise Management | 6 (100.0%) | 0 (0.0%) |
| Administrative & Support | 335 (44.6%) | 416 (55.4%) |
| Educational Services | 150 (15.4%) | 822 (84.6%) |
| Health Care & Social Assistance | 237 (19.2%) | 996 (80.8%) |
| Arts, Entertainment & Recreation | 70 (61.4%) | 44 (38.6%) |
| Accommodation & Food Services | 163 (27.7%) | 425 (72.3%) |
| Public Administration | 275 (45.8%) | 325 (54.2%) |
| Total | 8,325 (54.9%) | 6,825 (45.1%) |
Education in Magna
School Enrollment in Magna
The most common levels of schooling among the 7,876 students in Magna are elementary school (2,064 | 26.2%), high school (1,791 | 22.7%), and middle school (1,724 | 21.9%).
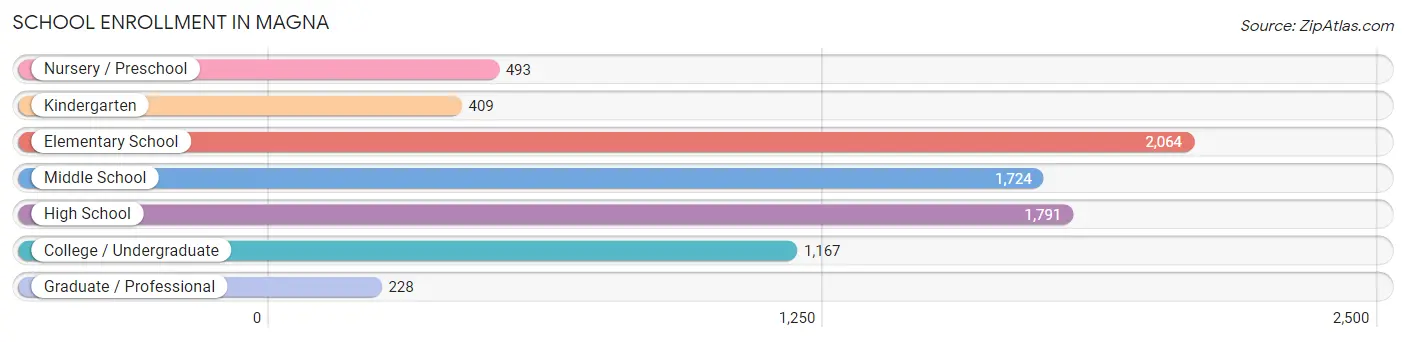
| School Level | # Students | % Students |
| Nursery / Preschool | 493 | 6.3% |
| Kindergarten | 409 | 5.2% |
| Elementary School | 2,064 | 26.2% |
| Middle School | 1,724 | 21.9% |
| High School | 1,791 | 22.7% |
| College / Undergraduate | 1,167 | 14.8% |
| Graduate / Professional | 228 | 2.9% |
| Total | 7,876 | 100.0% |
School Enrollment by Age by Funding Source in Magna
Out of a total of 7,876 students who are enrolled in schools in Magna, 488 (6.2%) attend a private institution, while the remaining 7,388 (93.8%) are enrolled in public schools. The age group of 35 years and over has the highest likelihood of being enrolled in private schools, with 130 (29.2% in the age bracket) enrolled. Conversely, the age group of 15 to 17 year olds has the lowest likelihood of being enrolled in a private school, with 1,324 (97.6% in the age bracket) attending a public institution.
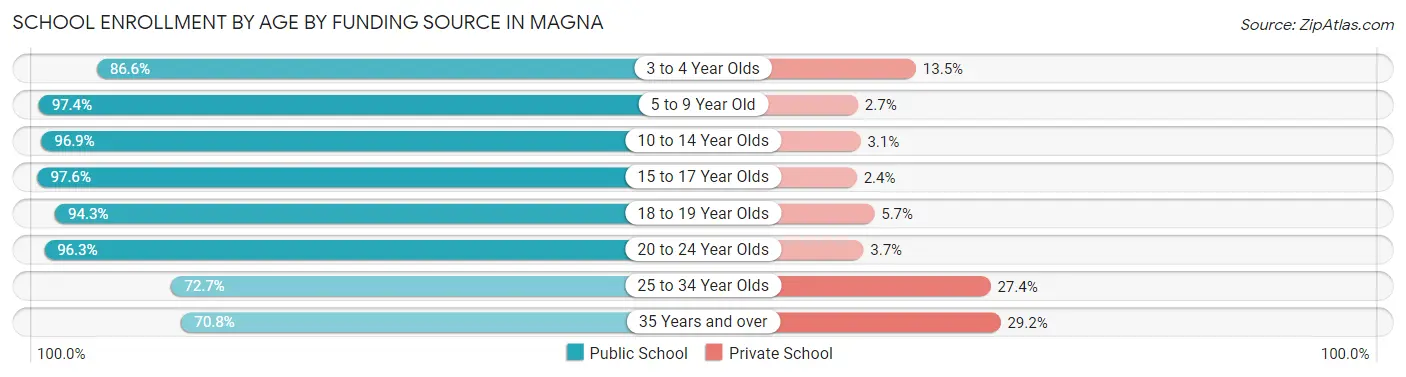
| Age Bracket | Public School | Private School |
| 3 to 4 Year Olds | 399 (86.6%) | 62 (13.5%) |
| 5 to 9 Year Old | 2,275 (97.4%) | 62 (2.6%) |
| 10 to 14 Year Olds | 2,137 (96.9%) | 69 (3.1%) |
| 15 to 17 Year Olds | 1,324 (97.6%) | 33 (2.4%) |
| 18 to 19 Year Olds | 281 (94.3%) | 17 (5.7%) |
| 20 to 24 Year Olds | 395 (96.3%) | 15 (3.7%) |
| 25 to 34 Year Olds | 263 (72.7%) | 99 (27.4%) |
| 35 Years and over | 315 (70.8%) | 130 (29.2%) |
| Total | 7,388 (93.8%) | 488 (6.2%) |
Educational Attainment by Field of Study in Magna
Business (571 | 19.3%), education (511 | 17.2%), science & technology (260 | 8.8%), liberal arts & history (255 | 8.6%), and bio, nature & agricultural (228 | 7.7%) are the most common fields of study among 2,966 individuals in Magna who have obtained a bachelor's degree or higher.
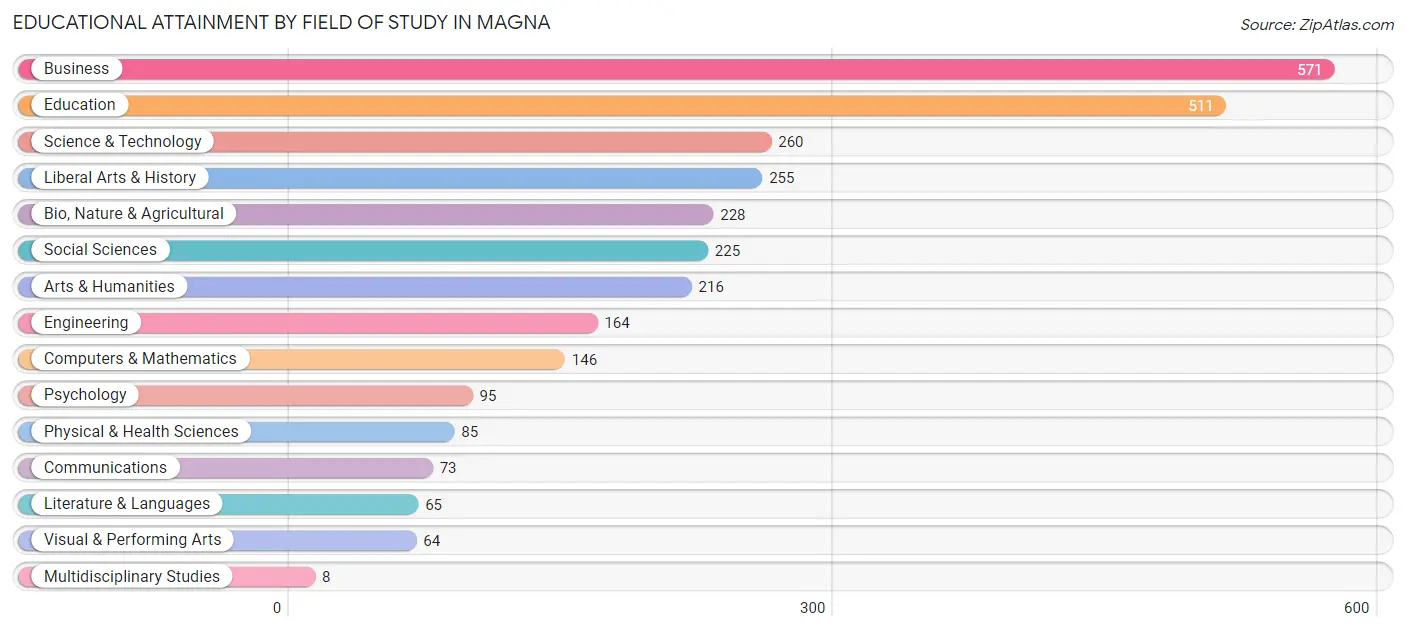
| Field of Study | # Graduates | % Graduates |
| Computers & Mathematics | 146 | 4.9% |
| Bio, Nature & Agricultural | 228 | 7.7% |
| Physical & Health Sciences | 85 | 2.9% |
| Psychology | 95 | 3.2% |
| Social Sciences | 225 | 7.6% |
| Engineering | 164 | 5.5% |
| Multidisciplinary Studies | 8 | 0.3% |
| Science & Technology | 260 | 8.8% |
| Business | 571 | 19.3% |
| Education | 511 | 17.2% |
| Literature & Languages | 65 | 2.2% |
| Liberal Arts & History | 255 | 8.6% |
| Visual & Performing Arts | 64 | 2.2% |
| Communications | 73 | 2.5% |
| Arts & Humanities | 216 | 7.3% |
| Total | 2,966 | 100.0% |
Transportation & Commute in Magna
Vehicle Availability by Sex in Magna
The most prevalent vehicle ownership categories in Magna are males with 2 vehicles (2,939, accounting for 35.7%) and females with 2 vehicles (2,401, making up 44.6%).
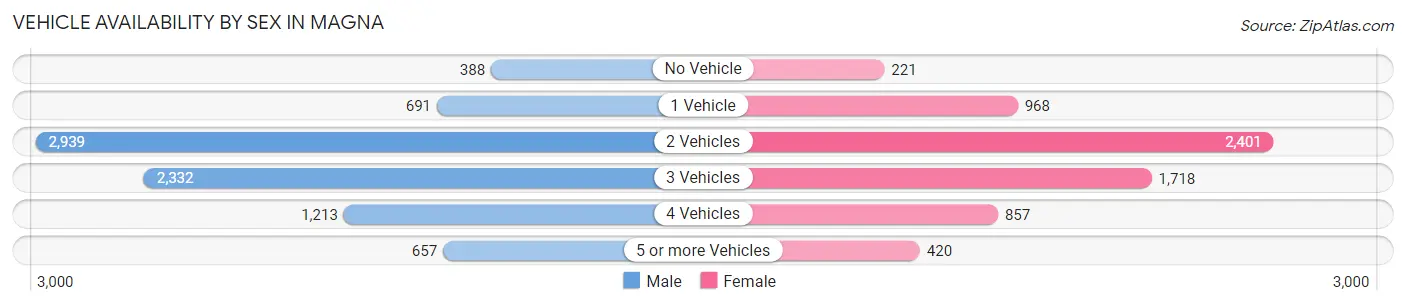
| Vehicles Available | Male | Female |
| No Vehicle | 388 (4.7%) | 221 (3.4%) |
| 1 Vehicle | 691 (8.4%) | 968 (14.7%) |
| 2 Vehicles | 2,939 (35.7%) | 2,401 (36.5%) |
| 3 Vehicles | 2,332 (28.4%) | 1,718 (26.1%) |
| 4 Vehicles | 1,213 (14.8%) | 857 (13.0%) |
| 5 or more Vehicles | 657 (8.0%) | 420 (6.4%) |
| Total | 8,220 (100.0%) | 6,585 (100.0%) |
Commute Time in Magna
The most frequently occuring commute durations in Magna are 15 to 19 minutes (2,927 commuters, 21.5%), 20 to 24 minutes (2,746 commuters, 20.2%), and 30 to 34 minutes (1,797 commuters, 13.2%).
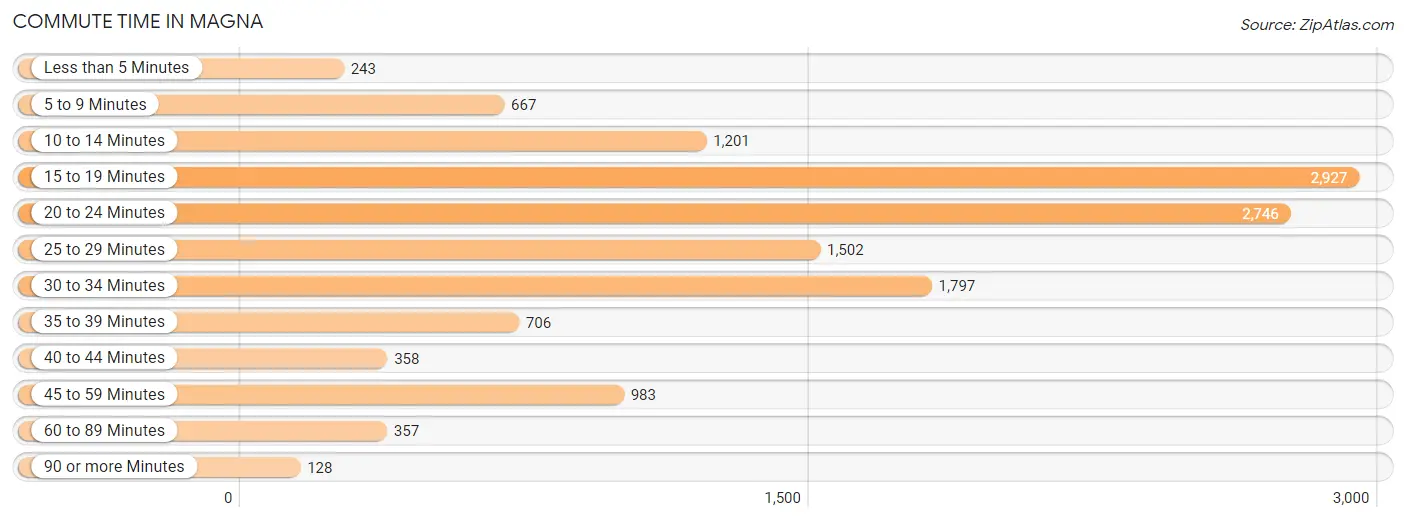
| Commute Time | # Commuters | % Commuters |
| Less than 5 Minutes | 243 | 1.8% |
| 5 to 9 Minutes | 667 | 4.9% |
| 10 to 14 Minutes | 1,201 | 8.8% |
| 15 to 19 Minutes | 2,927 | 21.5% |
| 20 to 24 Minutes | 2,746 | 20.2% |
| 25 to 29 Minutes | 1,502 | 11.0% |
| 30 to 34 Minutes | 1,797 | 13.2% |
| 35 to 39 Minutes | 706 | 5.2% |
| 40 to 44 Minutes | 358 | 2.6% |
| 45 to 59 Minutes | 983 | 7.2% |
| 60 to 89 Minutes | 357 | 2.6% |
| 90 or more Minutes | 128 | 0.9% |
Commute Time by Sex in Magna
The most common commute times in Magna are 15 to 19 minutes (1,894 commuters, 24.3%) for males and 20 to 24 minutes (1,196 commuters, 20.5%) for females.
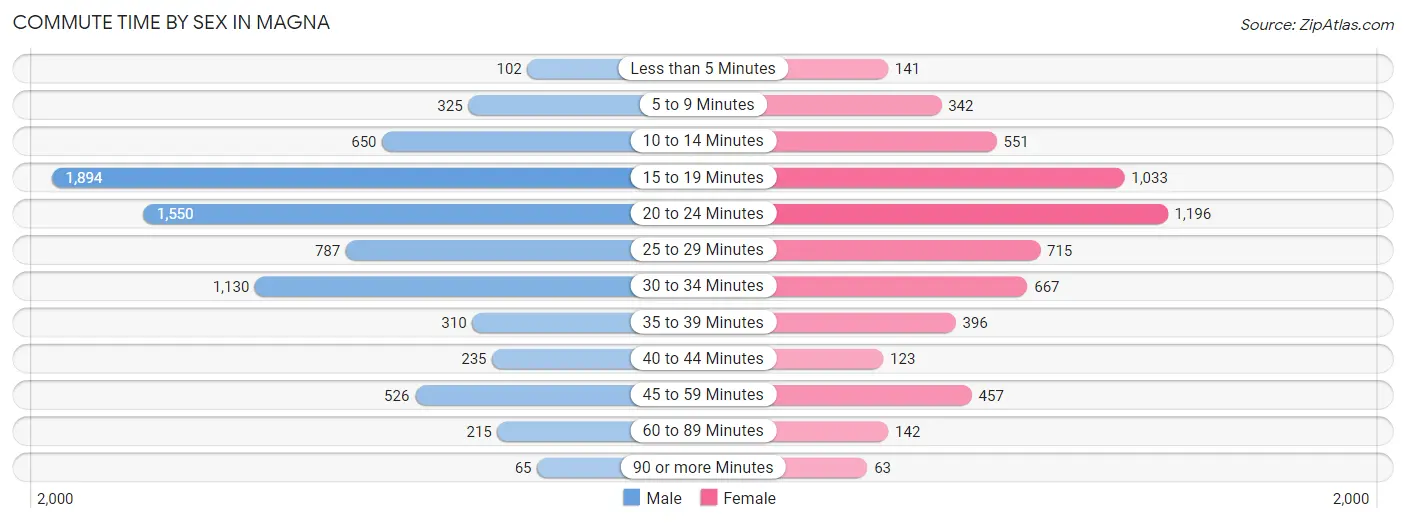
| Commute Time | Male | Female |
| Less than 5 Minutes | 102 (1.3%) | 141 (2.4%) |
| 5 to 9 Minutes | 325 (4.2%) | 342 (5.9%) |
| 10 to 14 Minutes | 650 (8.4%) | 551 (9.5%) |
| 15 to 19 Minutes | 1,894 (24.3%) | 1,033 (17.7%) |
| 20 to 24 Minutes | 1,550 (19.9%) | 1,196 (20.5%) |
| 25 to 29 Minutes | 787 (10.1%) | 715 (12.3%) |
| 30 to 34 Minutes | 1,130 (14.5%) | 667 (11.5%) |
| 35 to 39 Minutes | 310 (4.0%) | 396 (6.8%) |
| 40 to 44 Minutes | 235 (3.0%) | 123 (2.1%) |
| 45 to 59 Minutes | 526 (6.8%) | 457 (7.8%) |
| 60 to 89 Minutes | 215 (2.8%) | 142 (2.4%) |
| 90 or more Minutes | 65 (0.8%) | 63 (1.1%) |
Time of Departure to Work by Sex in Magna
The most frequent times of departure to work in Magna are 7:00 AM to 7:29 AM (1,034, 13.3%) for males and 7:00 AM to 7:29 AM (1,060, 18.2%) for females.
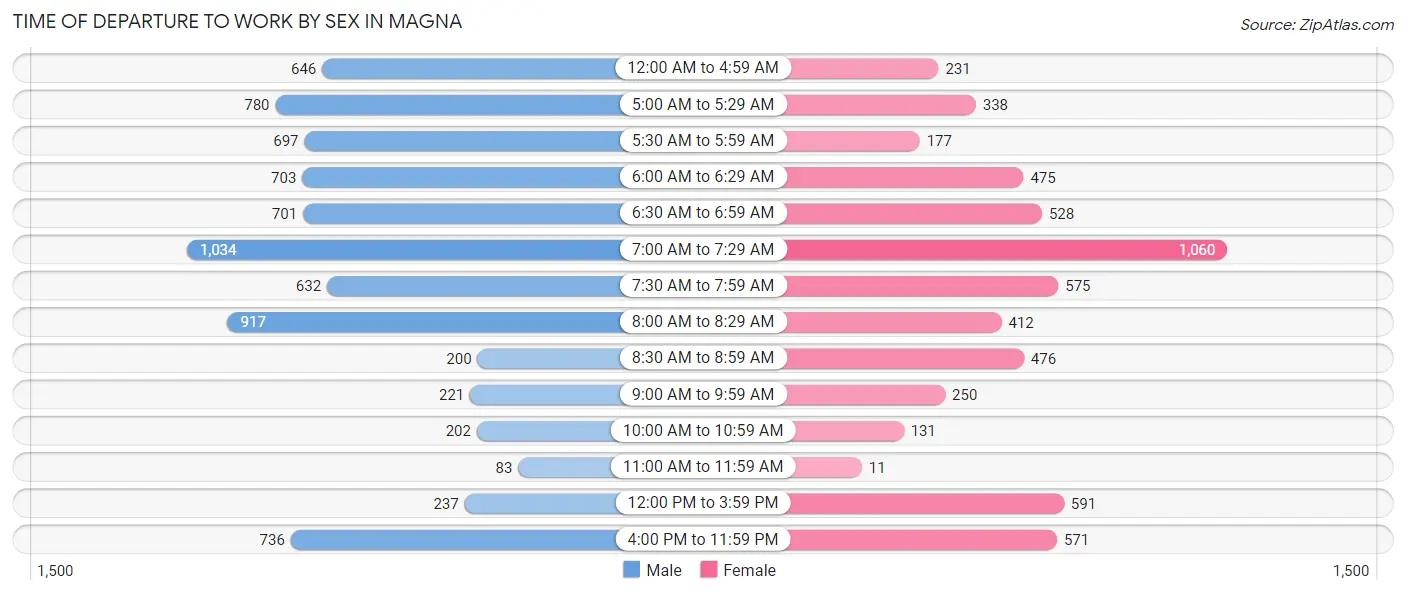
| Time of Departure | Male | Female |
| 12:00 AM to 4:59 AM | 646 (8.3%) | 231 (4.0%) |
| 5:00 AM to 5:29 AM | 780 (10.0%) | 338 (5.8%) |
| 5:30 AM to 5:59 AM | 697 (8.9%) | 177 (3.0%) |
| 6:00 AM to 6:29 AM | 703 (9.0%) | 475 (8.2%) |
| 6:30 AM to 6:59 AM | 701 (9.0%) | 528 (9.1%) |
| 7:00 AM to 7:29 AM | 1,034 (13.3%) | 1,060 (18.2%) |
| 7:30 AM to 7:59 AM | 632 (8.1%) | 575 (9.9%) |
| 8:00 AM to 8:29 AM | 917 (11.8%) | 412 (7.1%) |
| 8:30 AM to 8:59 AM | 200 (2.6%) | 476 (8.2%) |
| 9:00 AM to 9:59 AM | 221 (2.8%) | 250 (4.3%) |
| 10:00 AM to 10:59 AM | 202 (2.6%) | 131 (2.2%) |
| 11:00 AM to 11:59 AM | 83 (1.1%) | 11 (0.2%) |
| 12:00 PM to 3:59 PM | 237 (3.0%) | 591 (10.1%) |
| 4:00 PM to 11:59 PM | 736 (9.5%) | 571 (9.8%) |
| Total | 7,789 (100.0%) | 5,826 (100.0%) |
Housing Occupancy in Magna
Occupancy by Ownership in Magna
Of the total 8,738 dwellings in Magna, owner-occupied units account for 7,016 (80.3%), while renter-occupied units make up 1,722 (19.7%).
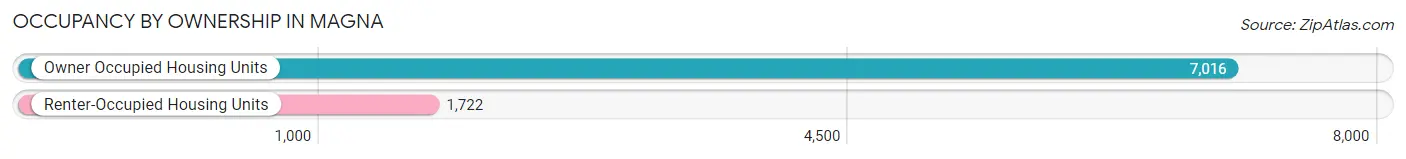
| Occupancy | # Housing Units | % Housing Units |
| Owner Occupied Housing Units | 7,016 | 80.3% |
| Renter-Occupied Housing Units | 1,722 | 19.7% |
| Total Occupied Housing Units | 8,738 | 100.0% |
Occupancy by Household Size in Magna
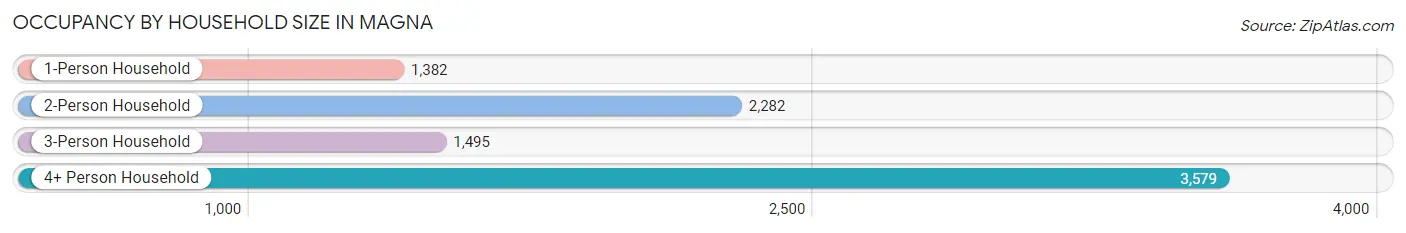
| Household Size | # Housing Units | % Housing Units |
| 1-Person Household | 1,382 | 15.8% |
| 2-Person Household | 2,282 | 26.1% |
| 3-Person Household | 1,495 | 17.1% |
| 4+ Person Household | 3,579 | 41.0% |
| Total Housing Units | 8,738 | 100.0% |
Occupancy by Ownership by Household Size in Magna
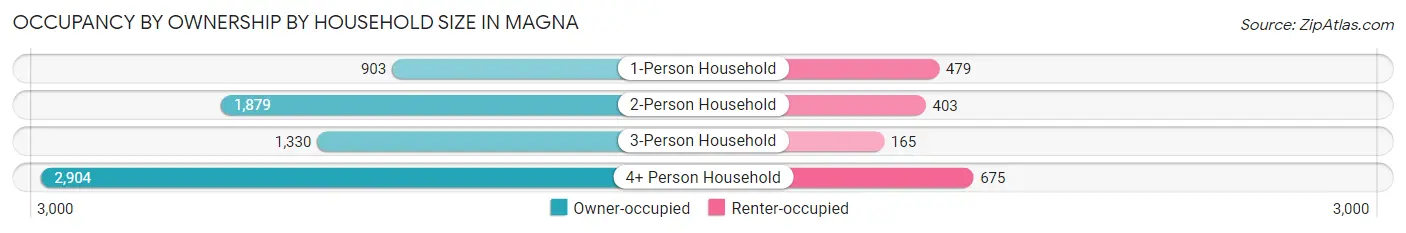
| Household Size | Owner-occupied | Renter-occupied |
| 1-Person Household | 903 (65.3%) | 479 (34.7%) |
| 2-Person Household | 1,879 (82.3%) | 403 (17.7%) |
| 3-Person Household | 1,330 (89.0%) | 165 (11.0%) |
| 4+ Person Household | 2,904 (81.1%) | 675 (18.9%) |
| Total Housing Units | 7,016 (80.3%) | 1,722 (19.7%) |
Occupancy by Educational Attainment in Magna
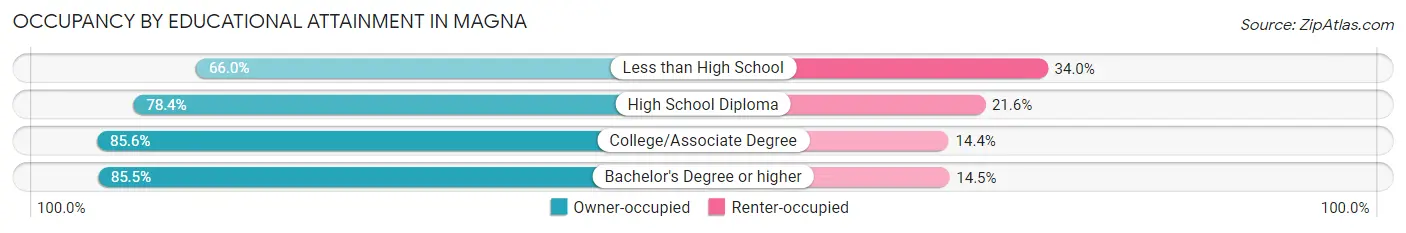
| Household Size | Owner-occupied | Renter-occupied |
| Less than High School | 804 (66.0%) | 414 (34.0%) |
| High School Diploma | 2,455 (78.4%) | 675 (21.6%) |
| College/Associate Degree | 2,473 (85.6%) | 415 (14.4%) |
| Bachelor's Degree or higher | 1,284 (85.5%) | 218 (14.5%) |
Occupancy by Age of Householder in Magna
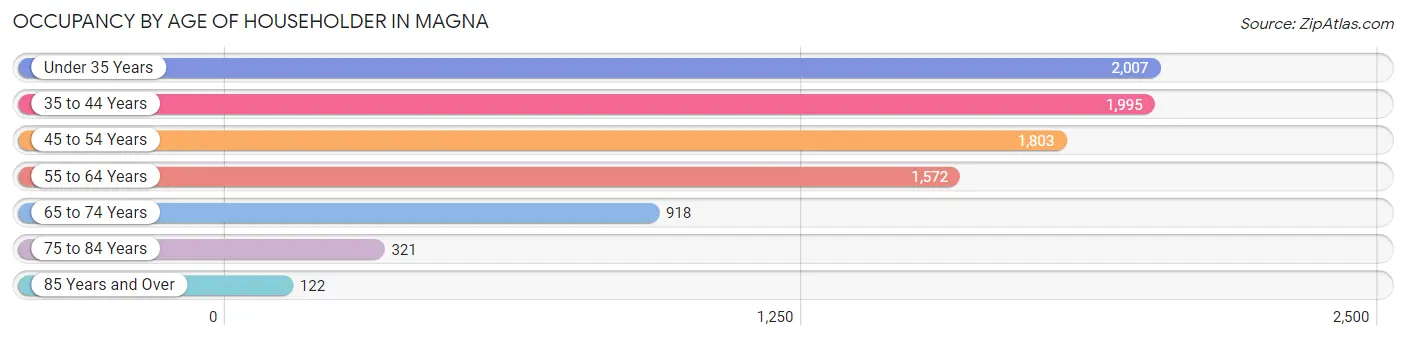
| Age Bracket | # Households | % Households |
| Under 35 Years | 2,007 | 23.0% |
| 35 to 44 Years | 1,995 | 22.8% |
| 45 to 54 Years | 1,803 | 20.6% |
| 55 to 64 Years | 1,572 | 18.0% |
| 65 to 74 Years | 918 | 10.5% |
| 75 to 84 Years | 321 | 3.7% |
| 85 Years and Over | 122 | 1.4% |
| Total | 8,738 | 100.0% |
Housing Finances in Magna
Median Income by Occupancy in Magna
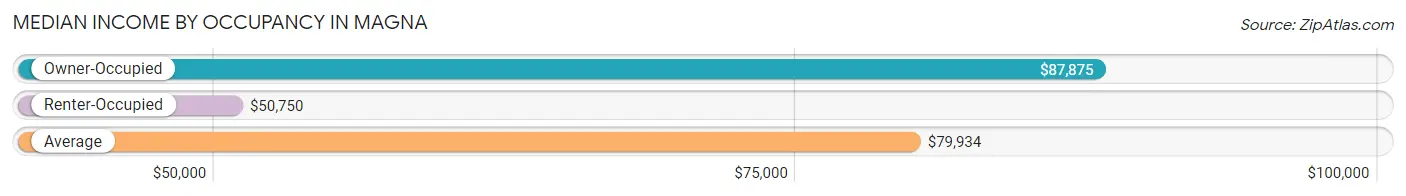
| Occupancy Type | # Households | Median Income |
| Owner-Occupied | 7,016 (80.3%) | $87,875 |
| Renter-Occupied | 1,722 (19.7%) | $50,750 |
| Average | 8,738 (100.0%) | $79,934 |
Occupancy by Householder Income Bracket in Magna
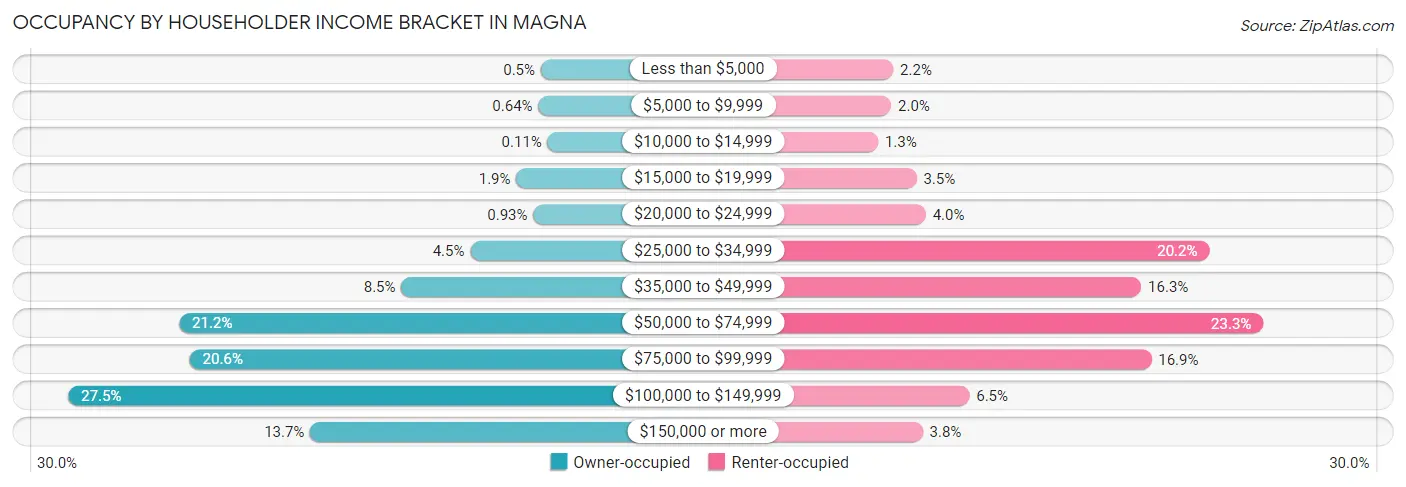
| Income Bracket | Owner-occupied | Renter-occupied |
| Less than $5,000 | 35 (0.5%) | 37 (2.1%) |
| $5,000 to $9,999 | 45 (0.6%) | 35 (2.0%) |
| $10,000 to $14,999 | 8 (0.1%) | 22 (1.3%) |
| $15,000 to $19,999 | 133 (1.9%) | 60 (3.5%) |
| $20,000 to $24,999 | 65 (0.9%) | 69 (4.0%) |
| $25,000 to $34,999 | 318 (4.5%) | 348 (20.2%) |
| $35,000 to $49,999 | 594 (8.5%) | 281 (16.3%) |
| $50,000 to $74,999 | 1,485 (21.2%) | 401 (23.3%) |
| $75,000 to $99,999 | 1,443 (20.6%) | 291 (16.9%) |
| $100,000 to $149,999 | 1,930 (27.5%) | 112 (6.5%) |
| $150,000 or more | 960 (13.7%) | 66 (3.8%) |
| Total | 7,016 (100.0%) | 1,722 (100.0%) |
Monthly Housing Cost Tiers in Magna
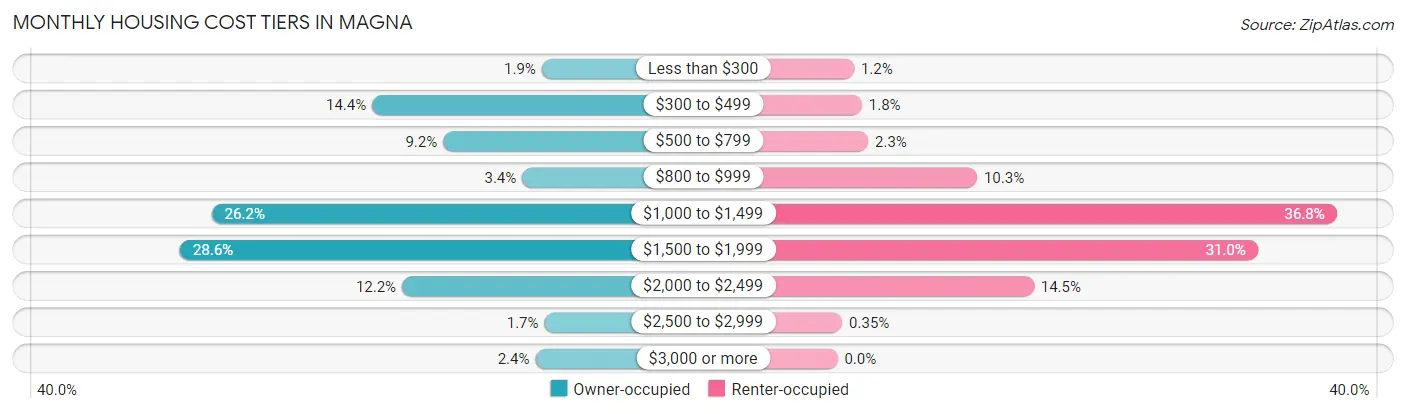
| Monthly Cost | Owner-occupied | Renter-occupied |
| Less than $300 | 135 (1.9%) | 21 (1.2%) |
| $300 to $499 | 1,011 (14.4%) | 31 (1.8%) |
| $500 to $799 | 644 (9.2%) | 39 (2.3%) |
| $800 to $999 | 236 (3.4%) | 177 (10.3%) |
| $1,000 to $1,499 | 1,840 (26.2%) | 633 (36.8%) |
| $1,500 to $1,999 | 2,004 (28.6%) | 533 (30.9%) |
| $2,000 to $2,499 | 857 (12.2%) | 249 (14.5%) |
| $2,500 to $2,999 | 121 (1.7%) | 6 (0.4%) |
| $3,000 or more | 168 (2.4%) | 0 (0.0%) |
| Total | 7,016 (100.0%) | 1,722 (100.0%) |
Physical Housing Characteristics in Magna
Housing Structures in Magna
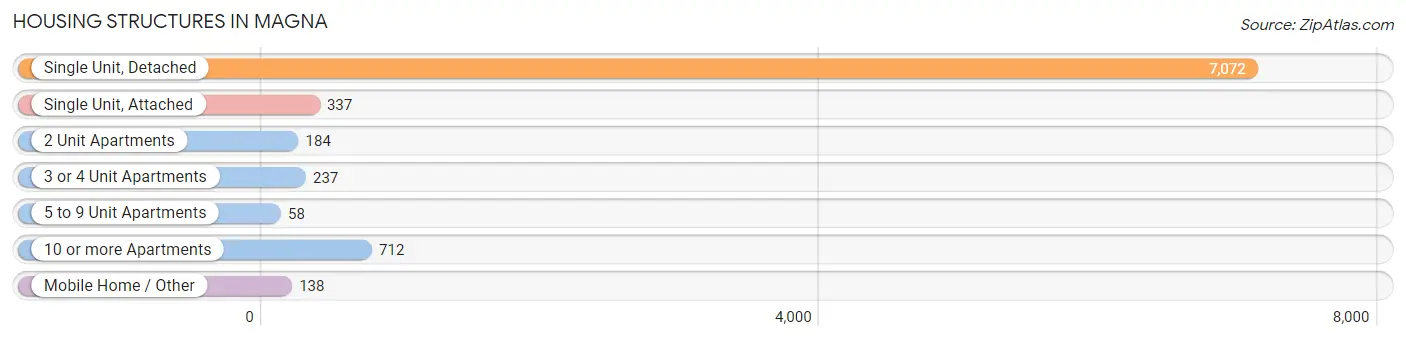
| Structure Type | # Housing Units | % Housing Units |
| Single Unit, Detached | 7,072 | 80.9% |
| Single Unit, Attached | 337 | 3.9% |
| 2 Unit Apartments | 184 | 2.1% |
| 3 or 4 Unit Apartments | 237 | 2.7% |
| 5 to 9 Unit Apartments | 58 | 0.7% |
| 10 or more Apartments | 712 | 8.2% |
| Mobile Home / Other | 138 | 1.6% |
| Total | 8,738 | 100.0% |
Housing Structures by Occupancy in Magna
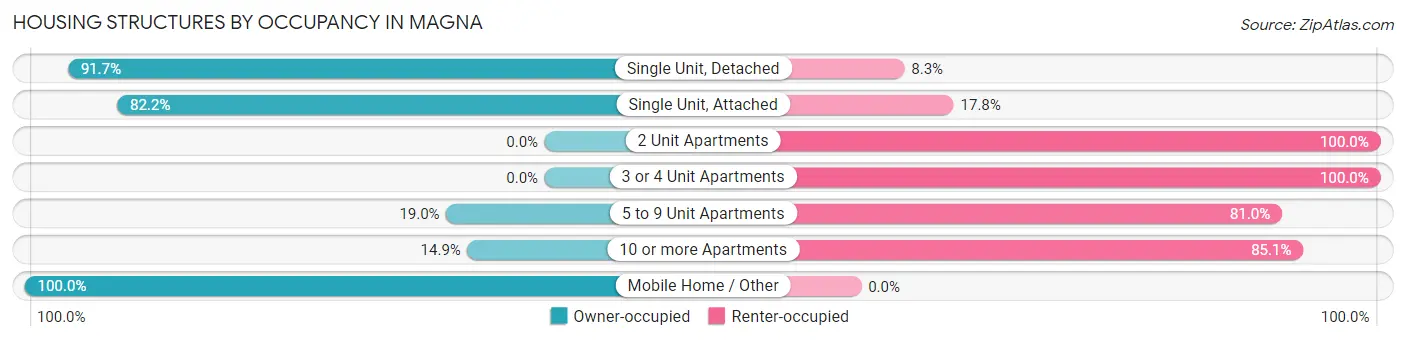
| Structure Type | Owner-occupied | Renter-occupied |
| Single Unit, Detached | 6,484 (91.7%) | 588 (8.3%) |
| Single Unit, Attached | 277 (82.2%) | 60 (17.8%) |
| 2 Unit Apartments | 0 (0.0%) | 184 (100.0%) |
| 3 or 4 Unit Apartments | 0 (0.0%) | 237 (100.0%) |
| 5 to 9 Unit Apartments | 11 (19.0%) | 47 (81.0%) |
| 10 or more Apartments | 106 (14.9%) | 606 (85.1%) |
| Mobile Home / Other | 138 (100.0%) | 0 (0.0%) |
| Total | 7,016 (80.3%) | 1,722 (19.7%) |
Housing Structures by Number of Rooms in Magna
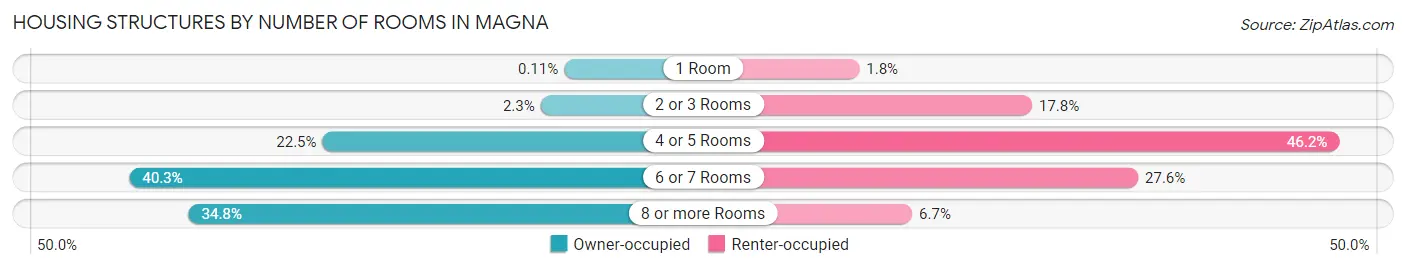
| Number of Rooms | Owner-occupied | Renter-occupied |
| 1 Room | 8 (0.1%) | 31 (1.8%) |
| 2 or 3 Rooms | 160 (2.3%) | 306 (17.8%) |
| 4 or 5 Rooms | 1,576 (22.5%) | 795 (46.2%) |
| 6 or 7 Rooms | 2,828 (40.3%) | 475 (27.6%) |
| 8 or more Rooms | 2,444 (34.8%) | 115 (6.7%) |
| Total | 7,016 (100.0%) | 1,722 (100.0%) |
Housing Structure by Heating Type in Magna
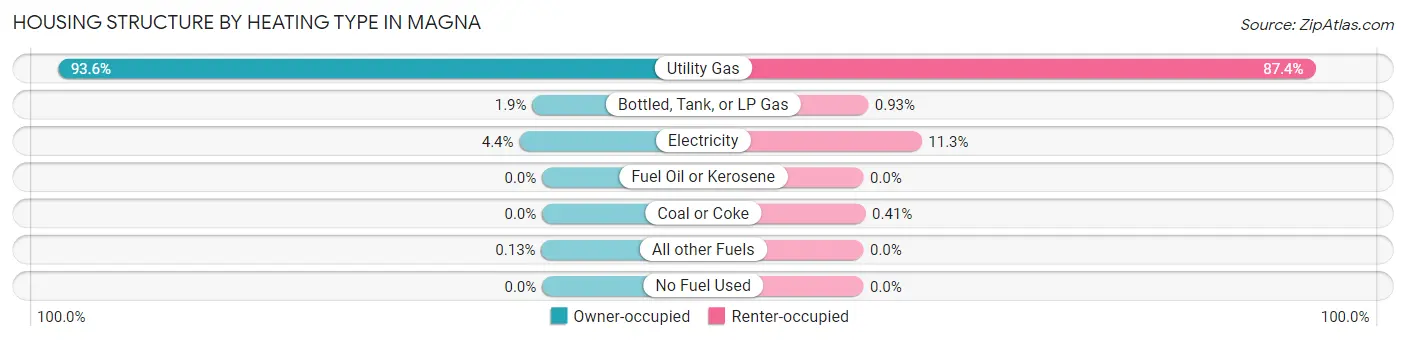
| Heating Type | Owner-occupied | Renter-occupied |
| Utility Gas | 6,567 (93.6%) | 1,505 (87.4%) |
| Bottled, Tank, or LP Gas | 132 (1.9%) | 16 (0.9%) |
| Electricity | 308 (4.4%) | 194 (11.3%) |
| Fuel Oil or Kerosene | 0 (0.0%) | 0 (0.0%) |
| Coal or Coke | 0 (0.0%) | 7 (0.4%) |
| All other Fuels | 9 (0.1%) | 0 (0.0%) |
| No Fuel Used | 0 (0.0%) | 0 (0.0%) |
| Total | 7,016 (100.0%) | 1,722 (100.0%) |
Household Vehicle Usage in Magna
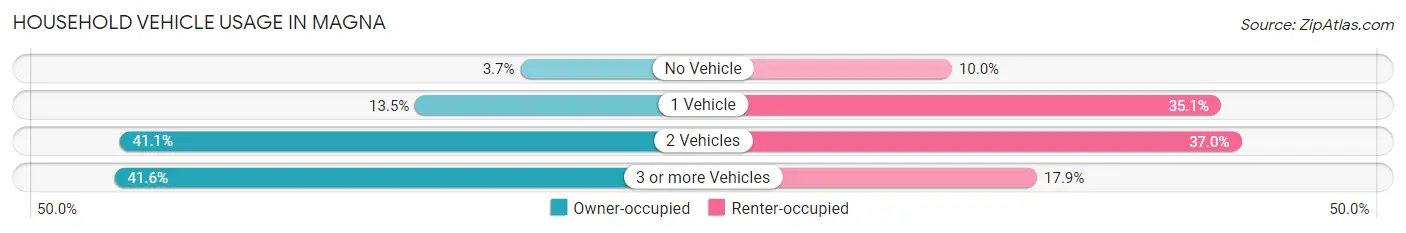
| Vehicles per Household | Owner-occupied | Renter-occupied |
| No Vehicle | 262 (3.7%) | 172 (10.0%) |
| 1 Vehicle | 950 (13.5%) | 604 (35.1%) |
| 2 Vehicles | 2,886 (41.1%) | 637 (37.0%) |
| 3 or more Vehicles | 2,918 (41.6%) | 309 (17.9%) |
| Total | 7,016 (100.0%) | 1,722 (100.0%) |
Real Estate & Mortgages in Magna
Real Estate and Mortgage Overview in Magna
| Characteristic | Without Mortgage | With Mortgage |
| Housing Units | 1,676 | 5,340 |
| Median Property Value | $287,100 | $303,400 |
| Median Household Income | $71,812 | $834 |
| Monthly Housing Costs | $452 | $168 |
| Real Estate Taxes | $2,329 | $139 |
Property Value by Mortgage Status in Magna
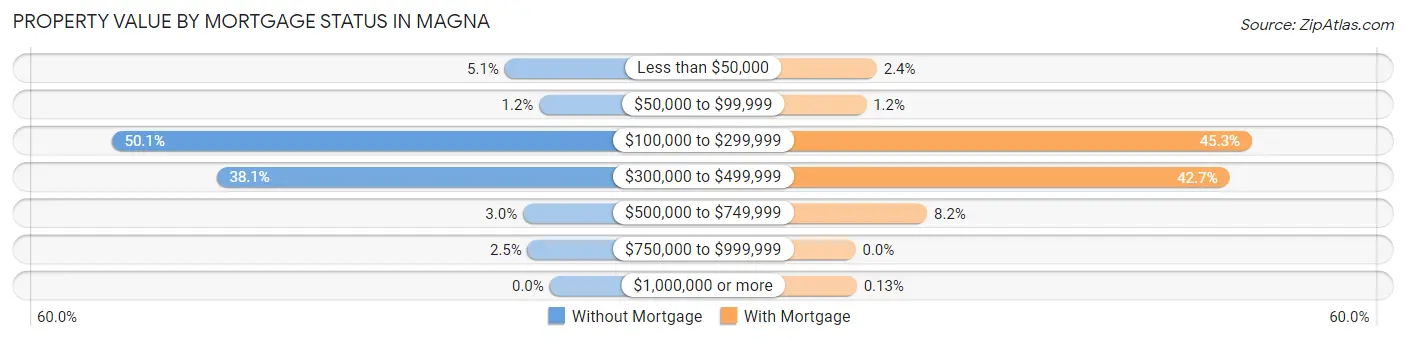
| Property Value | Without Mortgage | With Mortgage |
| Less than $50,000 | 86 (5.1%) | 130 (2.4%) |
| $50,000 to $99,999 | 20 (1.2%) | 65 (1.2%) |
| $100,000 to $299,999 | 839 (50.1%) | 2,419 (45.3%) |
| $300,000 to $499,999 | 638 (38.1%) | 2,282 (42.7%) |
| $500,000 to $749,999 | 51 (3.0%) | 437 (8.2%) |
| $750,000 to $999,999 | 42 (2.5%) | 0 (0.0%) |
| $1,000,000 or more | 0 (0.0%) | 7 (0.1%) |
| Total | 1,676 (100.0%) | 5,340 (100.0%) |
Household Income by Mortgage Status in Magna
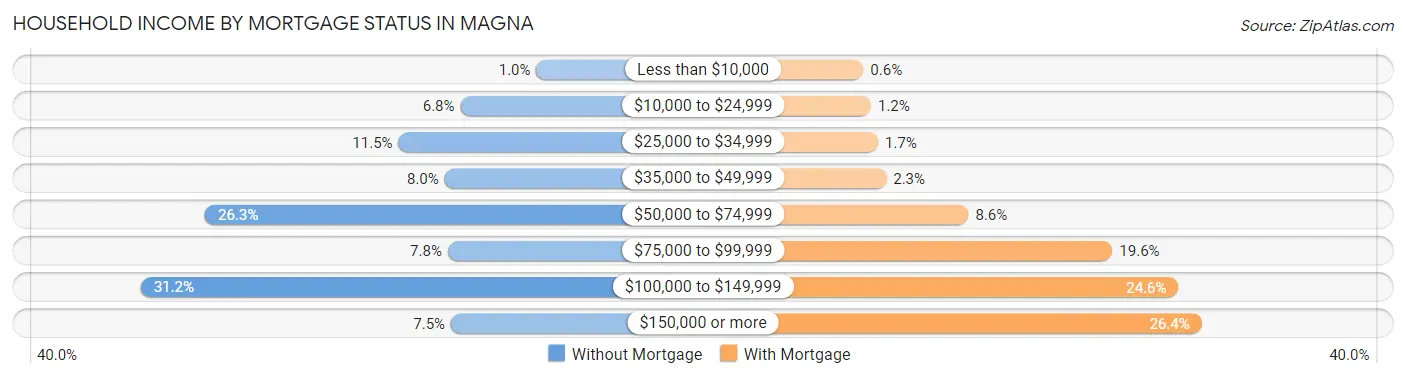
| Household Income | Without Mortgage | With Mortgage |
| Less than $10,000 | 17 (1.0%) | 32 (0.6%) |
| $10,000 to $24,999 | 114 (6.8%) | 63 (1.2%) |
| $25,000 to $34,999 | 193 (11.5%) | 92 (1.7%) |
| $35,000 to $49,999 | 134 (8.0%) | 125 (2.3%) |
| $50,000 to $74,999 | 440 (26.3%) | 460 (8.6%) |
| $75,000 to $99,999 | 130 (7.8%) | 1,045 (19.6%) |
| $100,000 to $149,999 | 522 (31.1%) | 1,313 (24.6%) |
| $150,000 or more | 126 (7.5%) | 1,408 (26.4%) |
| Total | 1,676 (100.0%) | 5,340 (100.0%) |
Property Value to Household Income Ratio in Magna
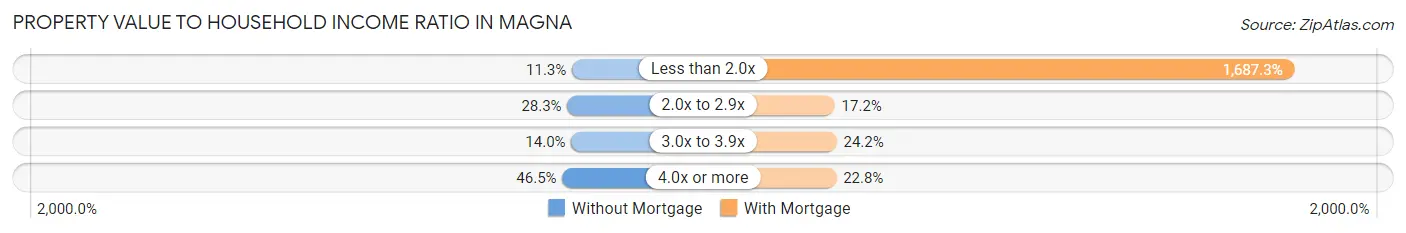
| Value-to-Income Ratio | Without Mortgage | With Mortgage |
| Less than 2.0x | 189 (11.3%) | 90,104 (1,687.3%) |
| 2.0x to 2.9x | 474 (28.3%) | 917 (17.2%) |
| 3.0x to 3.9x | 234 (14.0%) | 1,290 (24.2%) |
| 4.0x or more | 779 (46.5%) | 1,219 (22.8%) |
| Total | 1,676 (100.0%) | 5,340 (100.0%) |
Real Estate Taxes by Mortgage Status in Magna

| Property Taxes | Without Mortgage | With Mortgage |
| Less than $800 | 56 (3.3%) | 0 (0.0%) |
| $800 to $1,499 | 137 (8.2%) | 337 (6.3%) |
| $800 to $1,499 | 1,436 (85.7%) | 730 (13.7%) |
| Total | 1,676 (100.0%) | 5,340 (100.0%) |
Health & Disability in Magna
Health Insurance Coverage by Age in Magna
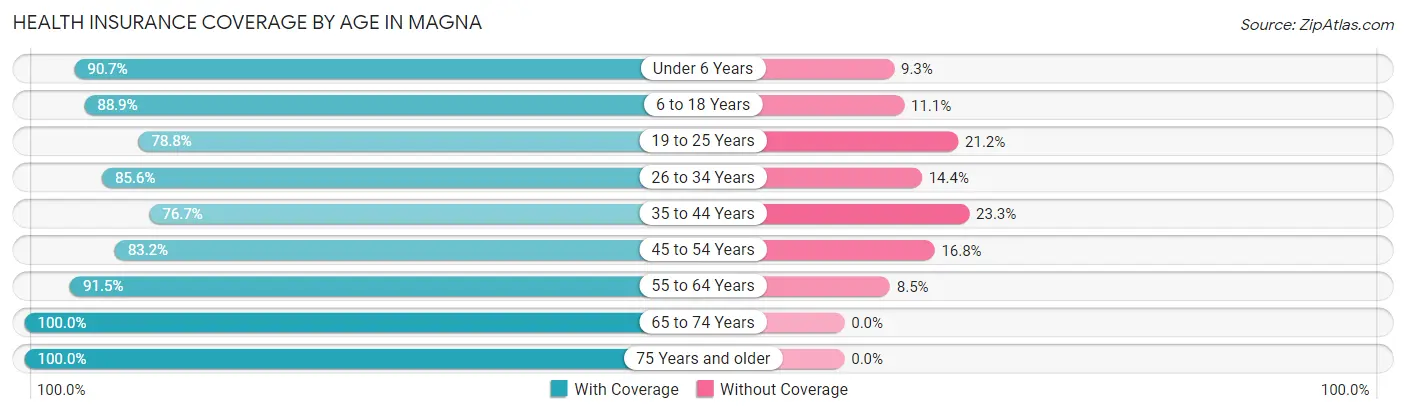
| Age Bracket | With Coverage | Without Coverage |
| Under 6 Years | 2,484 (90.7%) | 254 (9.3%) |
| 6 to 18 Years | 5,458 (88.9%) | 684 (11.1%) |
| 19 to 25 Years | 2,022 (78.8%) | 545 (21.2%) |
| 26 to 34 Years | 3,348 (85.6%) | 565 (14.4%) |
| 35 to 44 Years | 3,692 (76.7%) | 1,120 (23.3%) |
| 45 to 54 Years | 2,939 (83.2%) | 594 (16.8%) |
| 55 to 64 Years | 2,955 (91.5%) | 274 (8.5%) |
| 65 to 74 Years | 1,560 (100.0%) | 0 (0.0%) |
| 75 Years and older | 725 (100.0%) | 0 (0.0%) |
| Total | 25,183 (86.2%) | 4,036 (13.8%) |
Health Insurance Coverage by Citizenship Status in Magna
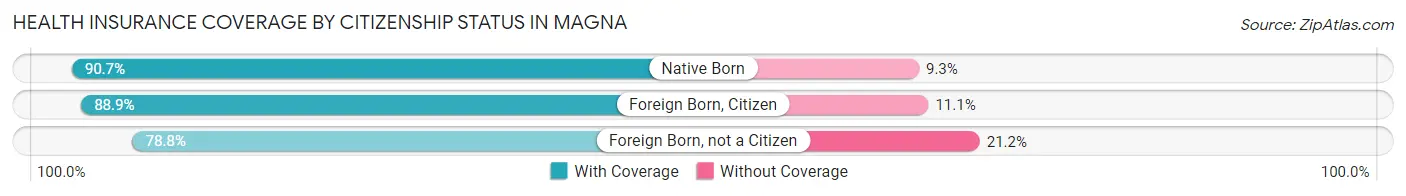
| Citizenship Status | With Coverage | Without Coverage |
| Native Born | 2,484 (90.7%) | 254 (9.3%) |
| Foreign Born, Citizen | 5,458 (88.9%) | 684 (11.1%) |
| Foreign Born, not a Citizen | 2,022 (78.8%) | 545 (21.2%) |
Health Insurance Coverage by Household Income in Magna
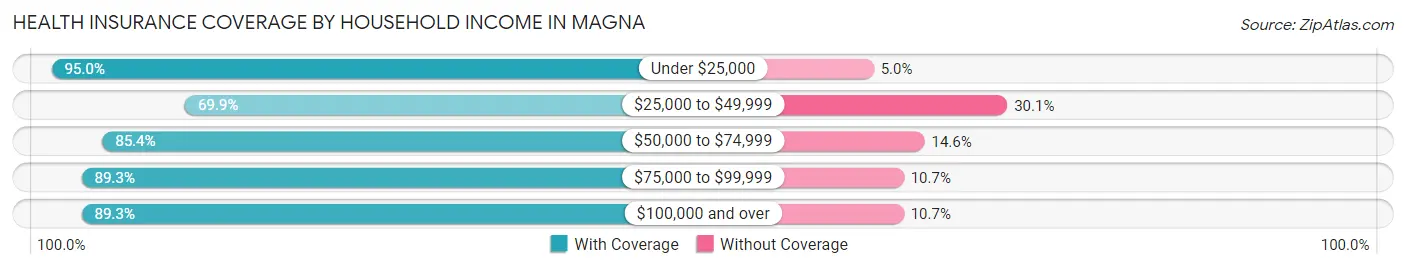
| Household Income | With Coverage | Without Coverage |
| Under $25,000 | 961 (95.0%) | 51 (5.0%) |
| $25,000 to $49,999 | 2,657 (69.9%) | 1,142 (30.1%) |
| $50,000 to $74,999 | 5,173 (85.4%) | 882 (14.6%) |
| $75,000 to $99,999 | 5,431 (89.3%) | 649 (10.7%) |
| $100,000 and over | 10,941 (89.3%) | 1,307 (10.7%) |
Public vs Private Health Insurance Coverage by Age in Magna
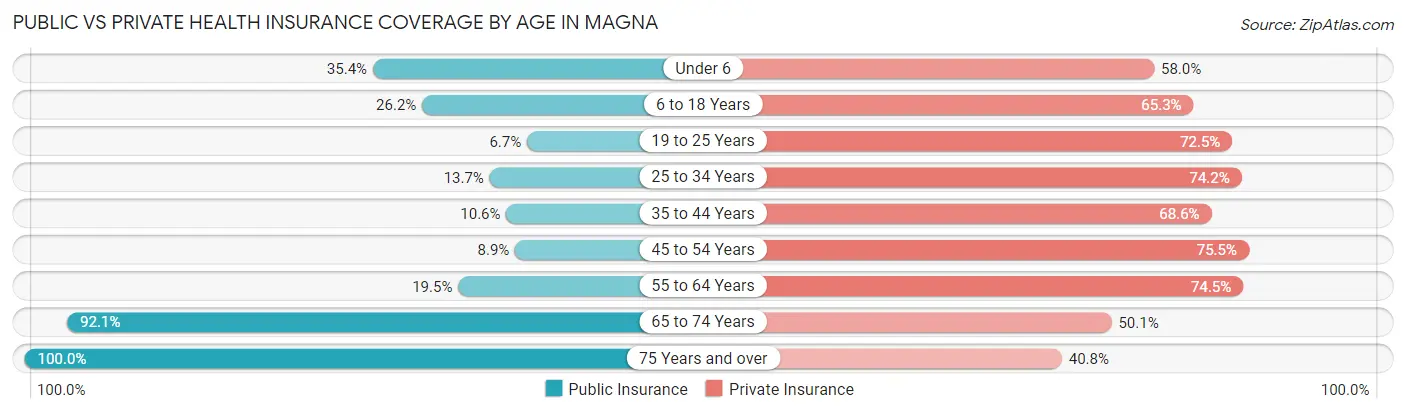
| Age Bracket | Public Insurance | Private Insurance |
| Under 6 | 968 (35.3%) | 1,587 (58.0%) |
| 6 to 18 Years | 1,610 (26.2%) | 4,008 (65.3%) |
| 19 to 25 Years | 173 (6.7%) | 1,860 (72.5%) |
| 25 to 34 Years | 535 (13.7%) | 2,903 (74.2%) |
| 35 to 44 Years | 509 (10.6%) | 3,301 (68.6%) |
| 45 to 54 Years | 316 (8.9%) | 2,669 (75.5%) |
| 55 to 64 Years | 630 (19.5%) | 2,405 (74.5%) |
| 65 to 74 Years | 1,437 (92.1%) | 781 (50.1%) |
| 75 Years and over | 725 (100.0%) | 296 (40.8%) |
| Total | 6,903 (23.6%) | 19,810 (67.8%) |
Disability Status by Sex by Age in Magna
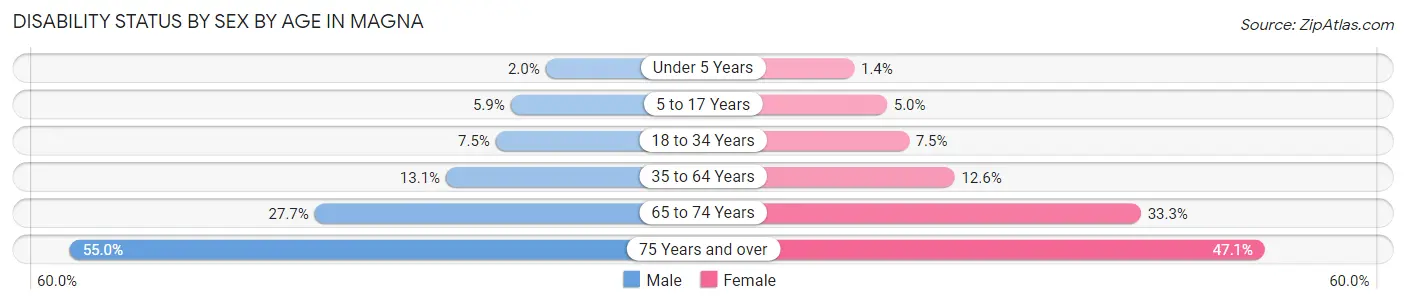
| Age Bracket | Male | Female |
| Under 5 Years | 25 (2.0%) | 15 (1.4%) |
| 5 to 17 Years | 188 (5.9%) | 148 (5.0%) |
| 18 to 34 Years | 273 (7.5%) | 240 (7.4%) |
| 35 to 64 Years | 773 (13.1%) | 711 (12.6%) |
| 65 to 74 Years | 205 (27.7%) | 273 (33.3%) |
| 75 Years and over | 199 (55.0%) | 171 (47.1%) |
Disability Class by Sex by Age in Magna
Disability Class: Hearing Difficulty
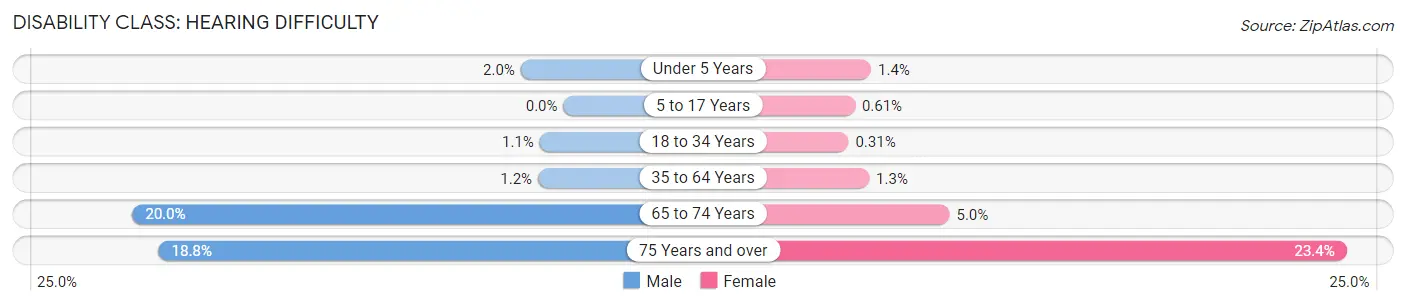
| Age Bracket | Male | Female |
| Under 5 Years | 25 (2.0%) | 15 (1.4%) |
| 5 to 17 Years | 0 (0.0%) | 18 (0.6%) |
| 18 to 34 Years | 40 (1.1%) | 10 (0.3%) |
| 35 to 64 Years | 70 (1.2%) | 72 (1.3%) |
| 65 to 74 Years | 148 (20.0%) | 41 (5.0%) |
| 75 Years and over | 68 (18.8%) | 85 (23.4%) |
Disability Class: Vision Difficulty
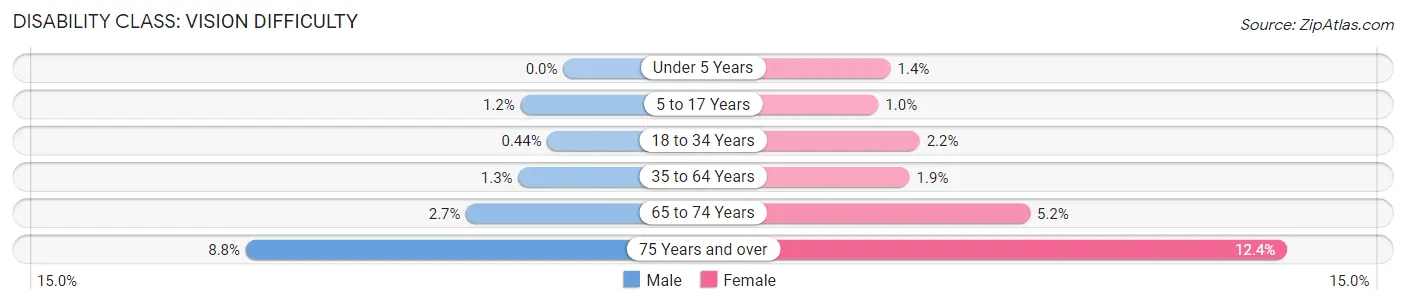
| Age Bracket | Male | Female |
| Under 5 Years | 0 (0.0%) | 15 (1.4%) |
| 5 to 17 Years | 38 (1.2%) | 30 (1.0%) |
| 18 to 34 Years | 16 (0.4%) | 70 (2.2%) |
| 35 to 64 Years | 74 (1.3%) | 107 (1.9%) |
| 65 to 74 Years | 20 (2.7%) | 43 (5.2%) |
| 75 Years and over | 32 (8.8%) | 45 (12.4%) |
Disability Class: Cognitive Difficulty
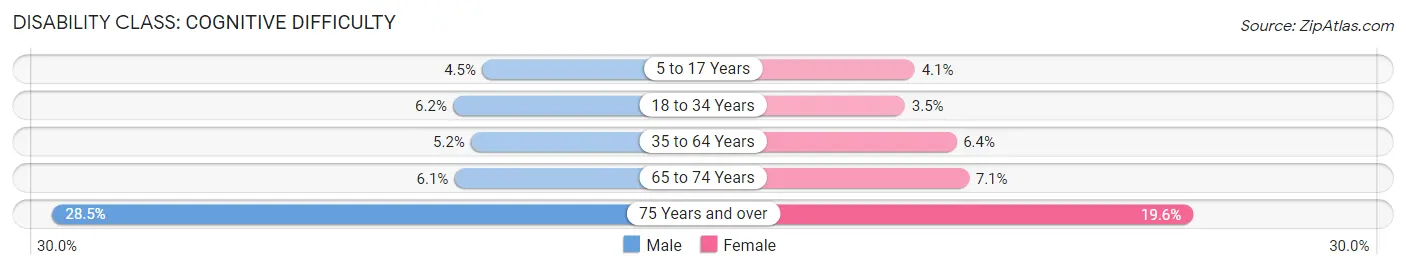
| Age Bracket | Male | Female |
| 5 to 17 Years | 145 (4.5%) | 120 (4.1%) |
| 18 to 34 Years | 223 (6.2%) | 113 (3.5%) |
| 35 to 64 Years | 305 (5.2%) | 361 (6.4%) |
| 65 to 74 Years | 45 (6.1%) | 58 (7.1%) |
| 75 Years and over | 103 (28.4%) | 71 (19.6%) |
Disability Class: Ambulatory Difficulty
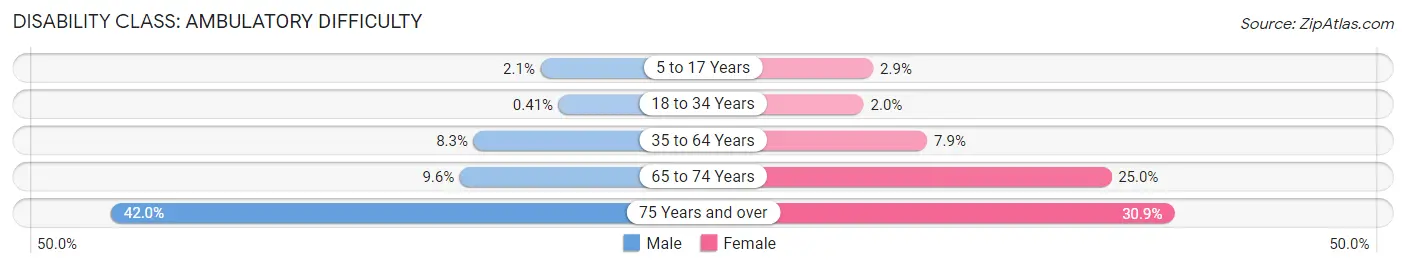
| Age Bracket | Male | Female |
| 5 to 17 Years | 67 (2.1%) | 86 (2.9%) |
| 18 to 34 Years | 15 (0.4%) | 65 (2.0%) |
| 35 to 64 Years | 491 (8.3%) | 449 (7.9%) |
| 65 to 74 Years | 71 (9.6%) | 205 (25.0%) |
| 75 Years and over | 152 (42.0%) | 112 (30.8%) |
Disability Class: Self-Care Difficulty
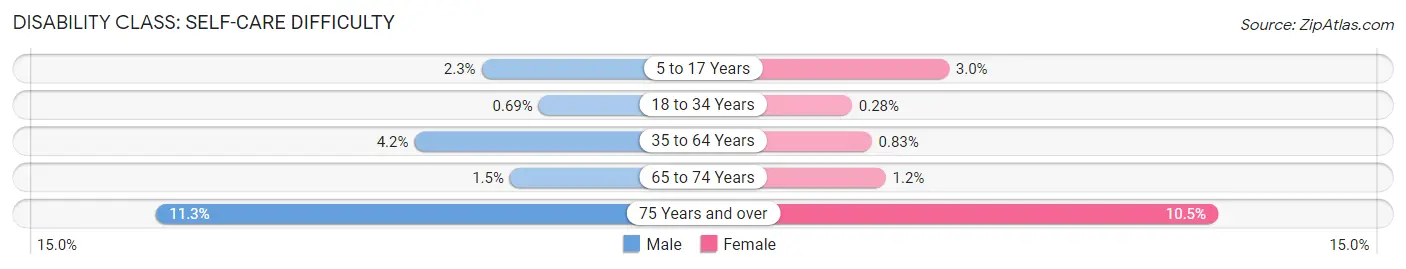
| Age Bracket | Male | Female |
| 5 to 17 Years | 73 (2.3%) | 88 (3.0%) |
| 18 to 34 Years | 25 (0.7%) | 9 (0.3%) |
| 35 to 64 Years | 245 (4.2%) | 47 (0.8%) |
| 65 to 74 Years | 11 (1.5%) | 10 (1.2%) |
| 75 Years and over | 41 (11.3%) | 38 (10.5%) |
Technology Access in Magna
Computing Device Access in Magna
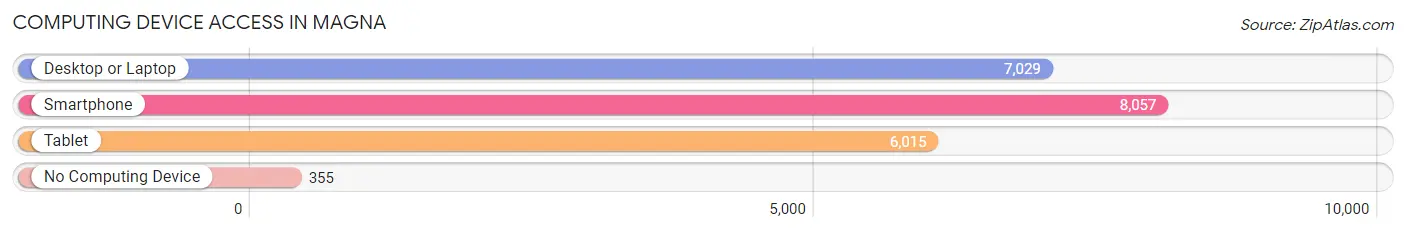
| Device Type | # Households | % Households |
| Desktop or Laptop | 7,029 | 80.4% |
| Smartphone | 8,057 | 92.2% |
| Tablet | 6,015 | 68.8% |
| No Computing Device | 355 | 4.1% |
| Total | 8,738 | 100.0% |
Internet Access in Magna
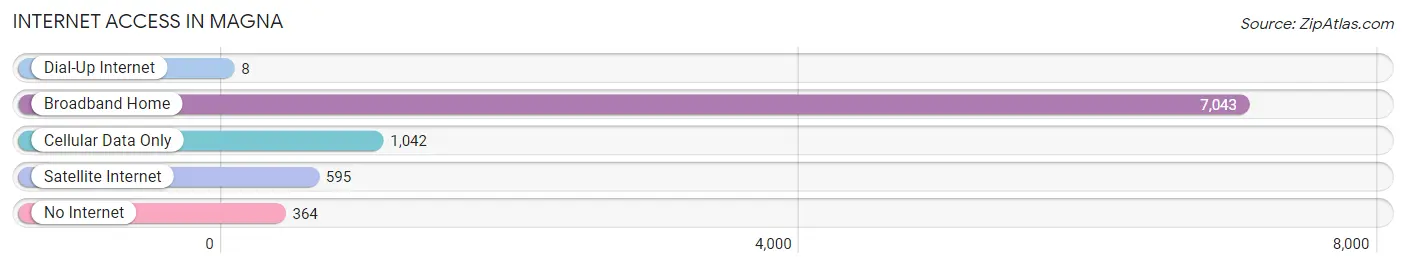
| Internet Type | # Households | % Households |
| Dial-Up Internet | 8 | 0.1% |
| Broadband Home | 7,043 | 80.6% |
| Cellular Data Only | 1,042 | 11.9% |
| Satellite Internet | 595 | 6.8% |
| No Internet | 364 | 4.2% |
| Total | 8,738 | 100.0% |
Magna Summary
Magna is a small city located in Salt Lake County, Utah, United States. It is part of the Salt Lake City metropolitan area. The population was 26,505 at the 2010 census, making it the most populous unincorporated community in the state.
History
The area that is now Magna was first settled in 1851 by a group of Mormon pioneers led by William Pace. The pioneers named the area Pleasant Green, and it was later renamed Magna, which is Latin for “great”. The area was originally used for farming and ranching, and the first post office was established in 1872.
In the early 1900s, the area began to develop into an industrial center. The Magna Copper Company was established in 1906, and the area soon became known as the “Copper City”. The company was the largest copper producer in the United States at the time, and it employed thousands of people.
The area continued to grow and develop throughout the 20th century. In the 1950s, the area was annexed by Salt Lake City, and in the 1960s, the area was incorporated as a city.
Geography
Magna is located in the northwest corner of Salt Lake County, about 15 miles west of Salt Lake City. It is bordered by the cities of West Valley City to the north, Taylorsville to the east, and West Jordan to the south. The Oquirrh Mountains are located to the west of the city.
The city has a total area of 8.3 square miles, all of which is land. The elevation is 4,400 feet above sea level.
Economy
The economy of Magna is largely based on manufacturing and industry. The city is home to several large industrial companies, including the Magna Copper Company, Kennecott Utah Copper, and the Magna Steel Company.
The city also has a growing retail sector, with several large shopping centers and malls located in the area.
Demographics
As of the 2010 census, there were 26,505 people, 8,845 households, and 6,717 families residing in the city. The population density was 3,183.3 people per square mile. The racial makeup of the city was 73.3% White, 1.3% African American, 0.7% Native American, 1.2% Asian, 0.2% Pacific Islander, 19.7% from other races, and 3.8% from two or more races. Hispanic or Latino of any race were 33.2% of the population.
The median income for a household in the city was $45,945, and the median income for a family was $51,945. The per capita income for the city was $20,945. About 11.2% of families and 14.2% of the population were below the poverty line, including 19.2% of those under age 18 and 8.2% of those age 65 or over.
Common Questions
What is Per Capita Income in Magna?
Per Capita income in Magna is $27,941.
What is the Median Family Income in Magna?
Median Family Income in Magna is $84,850.
What is the Median Household income in Magna?
Median Household Income in Magna is $79,934.
What is Income or Wage Gap in Magna?
Income or Wage Gap in Magna is 31.8%.
Women in Magna earn 68.2 cents for every dollar earned by a man.
What is Family Income Deficit in Magna?
Family Income Deficit in Magna is $13,566.
Families that are below poverty line in Magna earn $13,566 less on average than the poverty threshold level.
What is Inequality or Gini Index in Magna?
Inequality or Gini Index in Magna is 0.32.
What is the Total Population of Magna?
Total Population of Magna is 29,275.
What is the Total Male Population of Magna?
Total Male Population of Magna is 15,128.
What is the Total Female Population of Magna?
Total Female Population of Magna is 14,147.
What is the Ratio of Males per 100 Females in Magna?
There are 106.93 Males per 100 Females in Magna.
What is the Ratio of Females per 100 Males in Magna?
There are 93.52 Females per 100 Males in Magna.
What is the Median Population Age in Magna?
Median Population Age in Magna is 32.9 Years.
What is the Average Family Size in Magna
Average Family Size in Magna is 3.7 People.
What is the Average Household Size in Magna
Average Household Size in Magna is 3.4 People.
How Large is the Labor Force in Magna?
There are 16,043 People in the Labor Forcein in Magna.
What is the Percentage of People in the Labor Force in Magna?
73.7% of People are in the Labor Force in Magna.
What is the Unemployment Rate in Magna?
Unemployment Rate in Magna is 5.3%.