Escalante, UT Map & Demographics
Escalante Map
Escalante Overview
$32,818
PER CAPITA INCOME
$84,297
AVG FAMILY INCOME
$41,938
AVG HOUSEHOLD INCOME
6.4%
WAGE / INCOME GAP [ % ]
93.6¢/ $1
WAGE / INCOME GAP [ $ ]
0.40
INEQUALITY / GINI INDEX
657
TOTAL POPULATION
373
MALE POPULATION
284
FEMALE POPULATION
131.34
MALES / 100 FEMALES
76.14
FEMALES / 100 MALES
57.9
MEDIAN AGE
2.0
AVG FAMILY SIZE
1.7
AVG HOUSEHOLD SIZE
413
LABOR FORCE [ PEOPLE ]
66.4%
PERCENT IN LABOR FORCE
Escalante Zip Codes
Escalante Area Codes
Income in Escalante
Income Overview in Escalante
Per Capita Income in Escalante is $32,818, while median incomes of families and households are $84,297 and $41,938 respectively.
| Characteristic | Number | Measure |
| Per Capita Income | 657 | $32,818 |
| Median Family Income | 191 | $84,297 |
| Mean Family Income | 191 | $86,033 |
| Median Household Income | 395 | $41,938 |
| Mean Household Income | 395 | $60,186 |
| Income Deficit | 191 | $0 |
| Wage / Income Gap (%) | 657 | 6.39% |
| Wage / Income Gap ($) | 657 | 93.61¢ per $1 |
| Gini / Inequality Index | 657 | 0.40 |
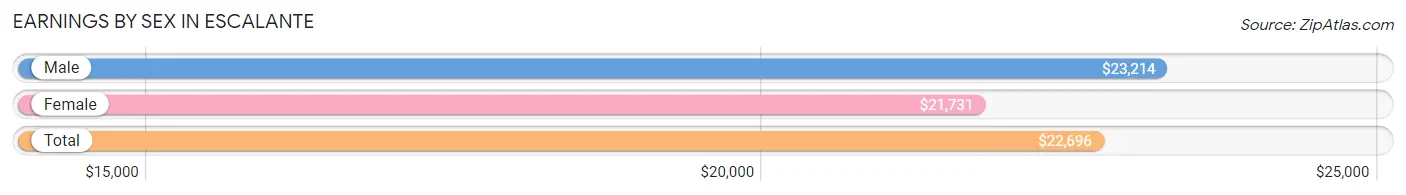
Earnings by Sex in Escalante
Average Earnings in Escalante are $22,696, $23,214 for men and $21,731 for women, a difference of 6.4%.
| Sex | Number | Average Earnings |
| Male | 284 (62.6%) | $23,214 |
| Female | 170 (37.4%) | $21,731 |
| Total | 454 (100.0%) | $22,696 |
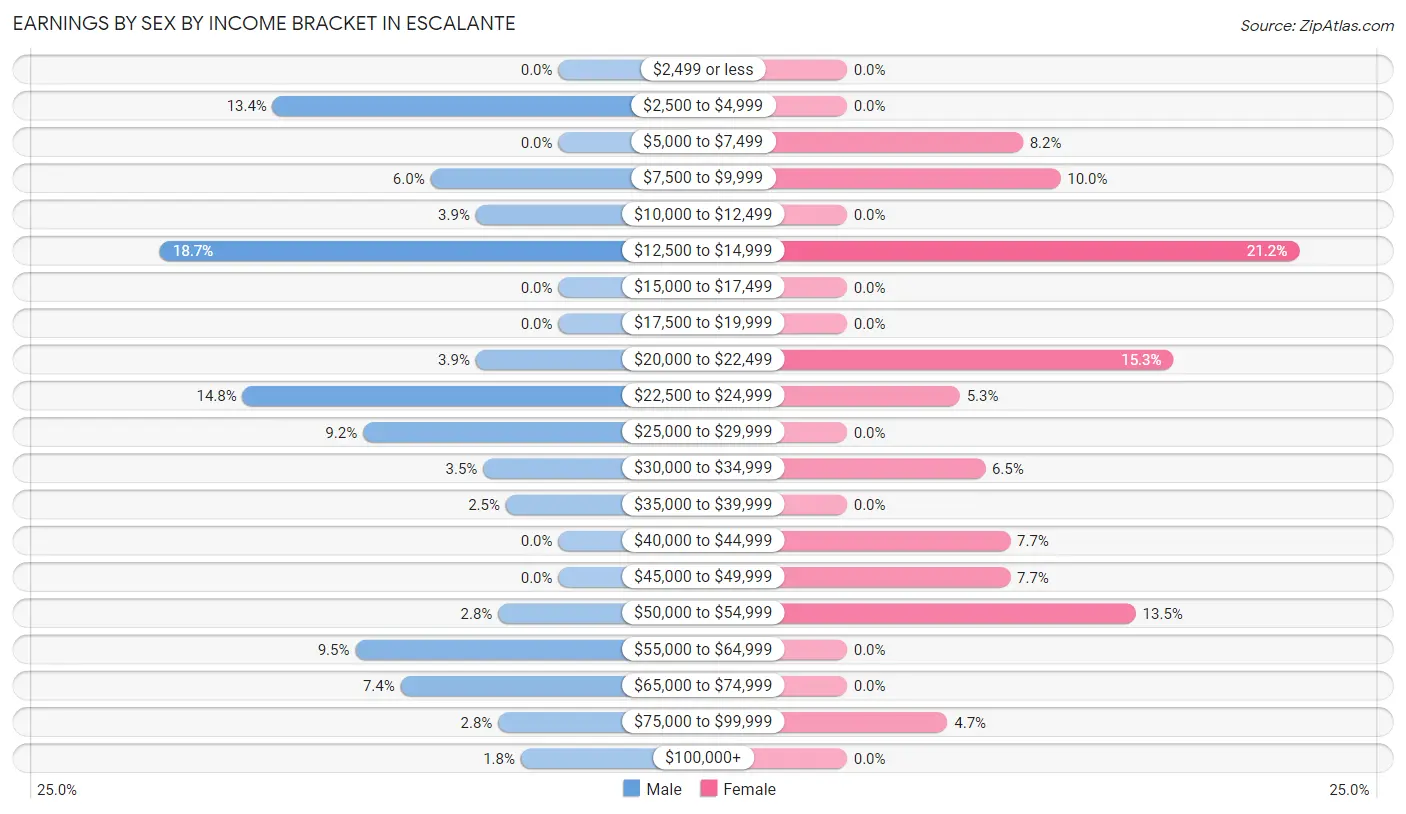
Earnings by Sex by Income Bracket in Escalante
The most common earnings brackets in Escalante are $12,500 to $14,999 for men (53 | 18.7%) and $12,500 to $14,999 for women (36 | 21.2%).
| Income | Male | Female |
| $2,499 or less | 0 (0.0%) | 0 (0.0%) |
| $2,500 to $4,999 | 38 (13.4%) | 0 (0.0%) |
| $5,000 to $7,499 | 0 (0.0%) | 14 (8.2%) |
| $7,500 to $9,999 | 17 (6.0%) | 17 (10.0%) |
| $10,000 to $12,499 | 11 (3.9%) | 0 (0.0%) |
| $12,500 to $14,999 | 53 (18.7%) | 36 (21.2%) |
| $15,000 to $17,499 | 0 (0.0%) | 0 (0.0%) |
| $17,500 to $19,999 | 0 (0.0%) | 0 (0.0%) |
| $20,000 to $22,499 | 11 (3.9%) | 26 (15.3%) |
| $22,500 to $24,999 | 42 (14.8%) | 9 (5.3%) |
| $25,000 to $29,999 | 26 (9.1%) | 0 (0.0%) |
| $30,000 to $34,999 | 10 (3.5%) | 11 (6.5%) |
| $35,000 to $39,999 | 7 (2.5%) | 0 (0.0%) |
| $40,000 to $44,999 | 0 (0.0%) | 13 (7.6%) |
| $45,000 to $49,999 | 0 (0.0%) | 13 (7.6%) |
| $50,000 to $54,999 | 8 (2.8%) | 23 (13.5%) |
| $55,000 to $64,999 | 27 (9.5%) | 0 (0.0%) |
| $65,000 to $74,999 | 21 (7.4%) | 0 (0.0%) |
| $75,000 to $99,999 | 8 (2.8%) | 8 (4.7%) |
| $100,000+ | 5 (1.8%) | 0 (0.0%) |
| Total | 284 (100.0%) | 170 (100.0%) |
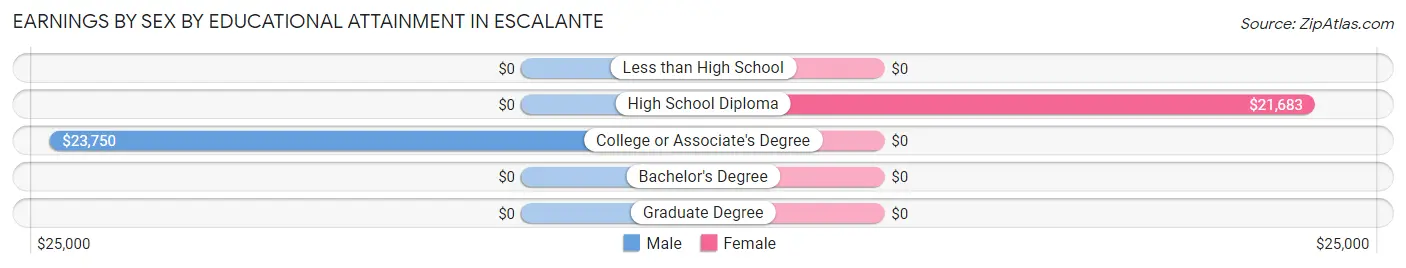
Earnings by Sex by Educational Attainment in Escalante
Average earnings in Escalante are $23,274 for men and $21,731 for women, a difference of 6.6%. Men with an educational attainment of college or associate's degree enjoy the highest average annual earnings of $23,750, while those with college or associate's degree education earn the least with $23,750. Women with an educational attainment of high school diploma earn the most with the average annual earnings of $21,683, while those with high school diploma education have the smallest earnings of $21,683.
| Educational Attainment | Male Income | Female Income |
| Less than High School | - | - |
| High School Diploma | - | - |
| College or Associate's Degree | $23,750 | $0 |
| Bachelor's Degree | - | - |
| Graduate Degree | - | - |
| Total | $23,274 | $21,731 |
Family Income in Escalante
Family Income Brackets in Escalante
According to the Escalante family income data, there are 49 families falling into the $75,000 to $99,999 income range, which is the most common income bracket and makes up 25.7% of all families.
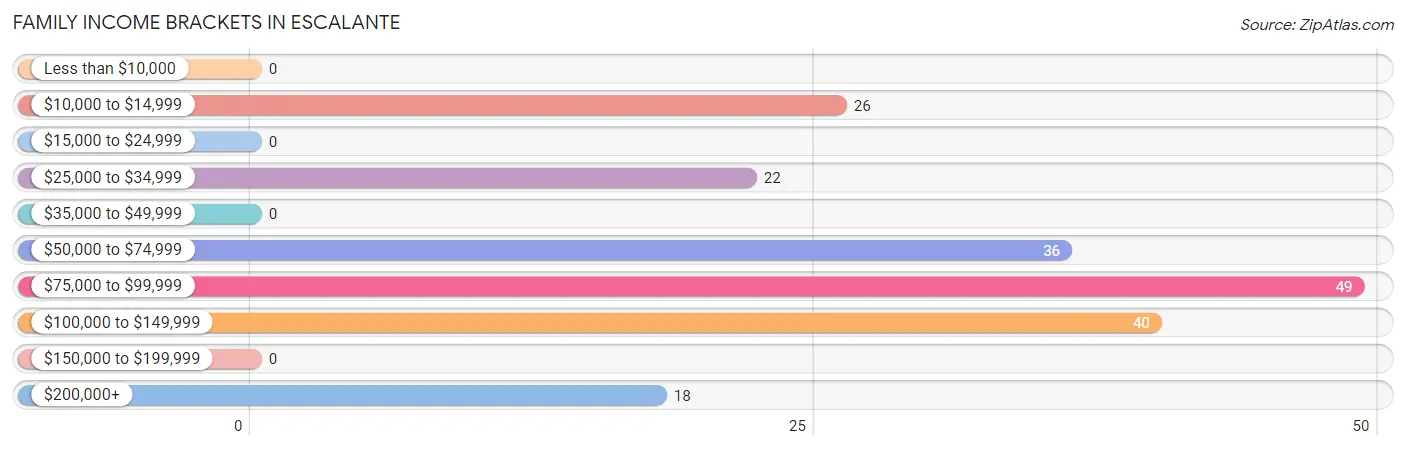
| Income Bracket | # Families | % Families |
| Less than $10,000 | 0 | 0.0% |
| $10,000 to $14,999 | 26 | 13.6% |
| $15,000 to $24,999 | 0 | 0.0% |
| $25,000 to $34,999 | 22 | 11.5% |
| $35,000 to $49,999 | 0 | 0.0% |
| $50,000 to $74,999 | 36 | 18.8% |
| $75,000 to $99,999 | 49 | 25.7% |
| $100,000 to $149,999 | 40 | 20.9% |
| $150,000 to $199,999 | 0 | 0.0% |
| $200,000+ | 18 | 9.4% |
Family Income by Famaliy Size in Escalante
2-person families (150 | 78.5%) account for the highest median family income in Escalante with $92,841 per family, while 2-person families (150 | 78.5%) have the highest median income of $46,420 per family member.
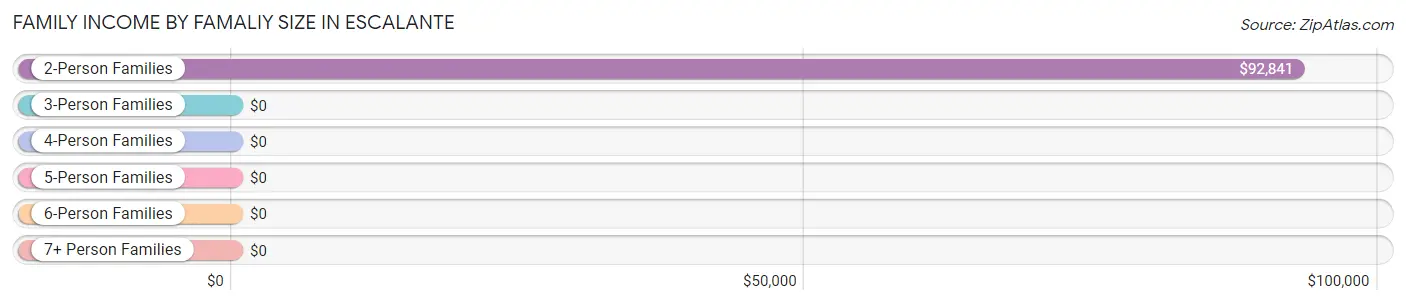
| Income Bracket | # Families | Median Income |
| 2-Person Families | 150 (78.5%) | $92,841 |
| 3-Person Families | 41 (21.5%) | $0 |
| 4-Person Families | 0 (0.0%) | $0 |
| 5-Person Families | 0 (0.0%) | $0 |
| 6-Person Families | 0 (0.0%) | $0 |
| 7+ Person Families | 0 (0.0%) | $0 |
| Total | 191 (100.0%) | $84,297 |
Family Income by Number of Earners in Escalante
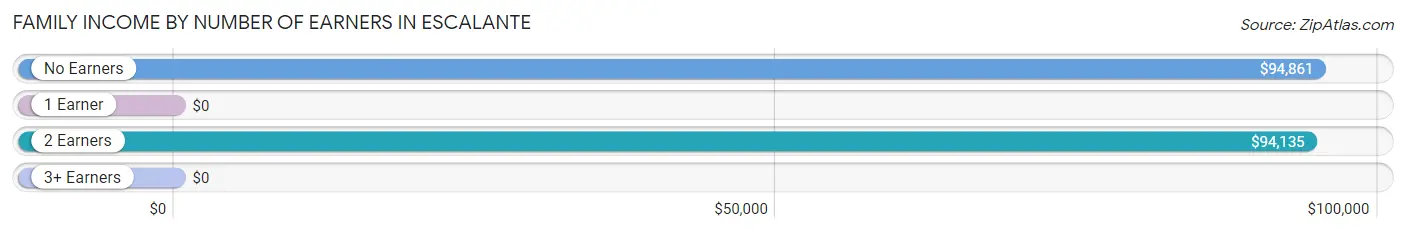
| Number of Earners | # Families | Median Income |
| No Earners | 29 (15.2%) | $94,861 |
| 1 Earner | 63 (33.0%) | $0 |
| 2 Earners | 97 (50.8%) | $94,135 |
| 3+ Earners | 2 (1.1%) | $0 |
| Total | 191 (100.0%) | $84,297 |
Household Income in Escalante
Household Income Brackets in Escalante
With 119 households falling in the category, the $35,000 to $49,999 income range is the most frequent in Escalante, accounting for 30.1% of all households.
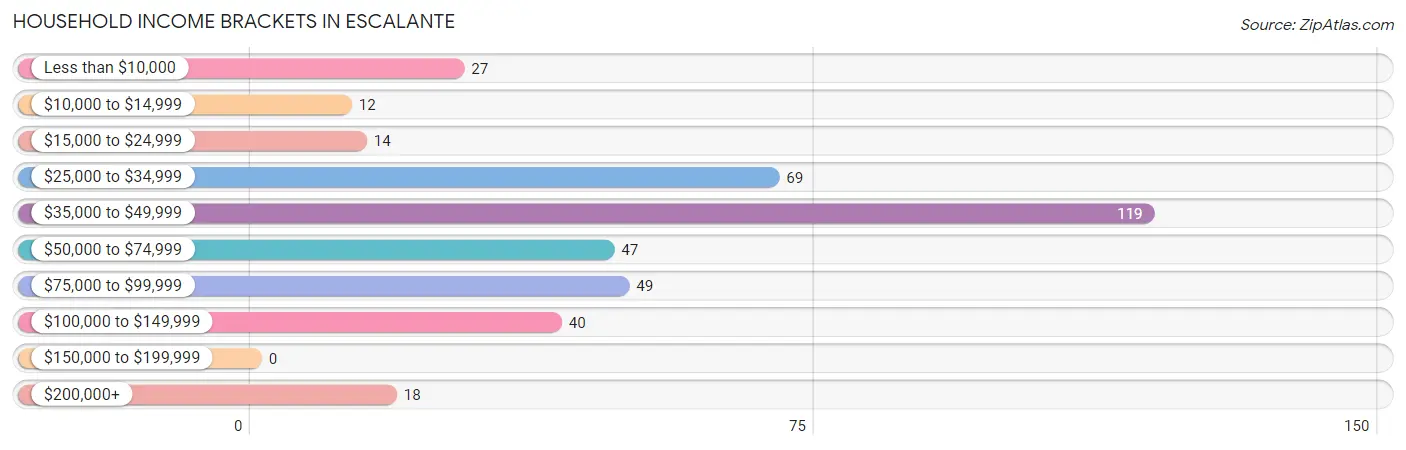
| Income Bracket | # Households | % Households |
| Less than $10,000 | 27 | 6.8% |
| $10,000 to $14,999 | 12 | 3.0% |
| $15,000 to $24,999 | 14 | 3.5% |
| $25,000 to $34,999 | 69 | 17.5% |
| $35,000 to $49,999 | 119 | 30.1% |
| $50,000 to $74,999 | 47 | 11.9% |
| $75,000 to $99,999 | 49 | 12.4% |
| $100,000 to $149,999 | 40 | 10.1% |
| $150,000 to $199,999 | 0 | 0.0% |
| $200,000+ | 18 | 4.6% |
Household Income by Householder Age in Escalante
The median household income in Escalante is $41,938, with the highest median household income of $45,192 found in the 45 to 64 years age bracket for the primary householder. A total of 212 households (53.7%) fall into this category.
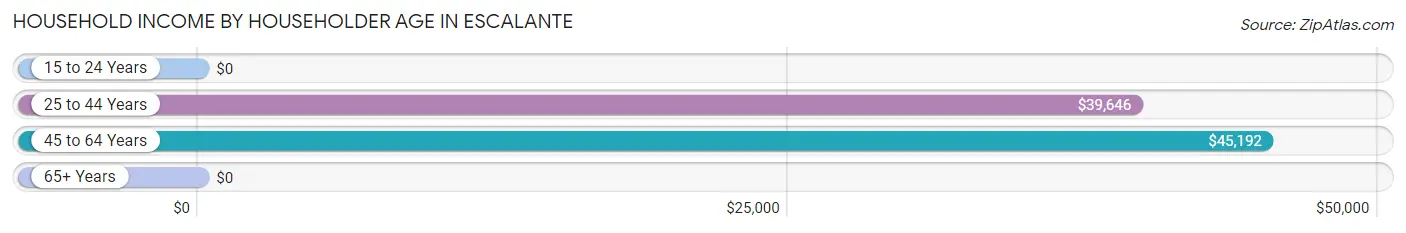
| Income Bracket | # Households | Median Income |
| 15 to 24 Years | 0 (0.0%) | $0 |
| 25 to 44 Years | 91 (23.0%) | $39,646 |
| 45 to 64 Years | 212 (53.7%) | $45,192 |
| 65+ Years | 92 (23.3%) | $0 |
| Total | 395 (100.0%) | $41,938 |
Poverty in Escalante
Income Below Poverty by Sex and Age in Escalante
With 23.6% poverty level for males and 21.8% for females among the residents of Escalante, 45 to 54 year old males and 5 year old females are the most vulnerable to poverty, with 20 males (60.6%) and 12 females (100.0%) in their respective age groups living below the poverty level.
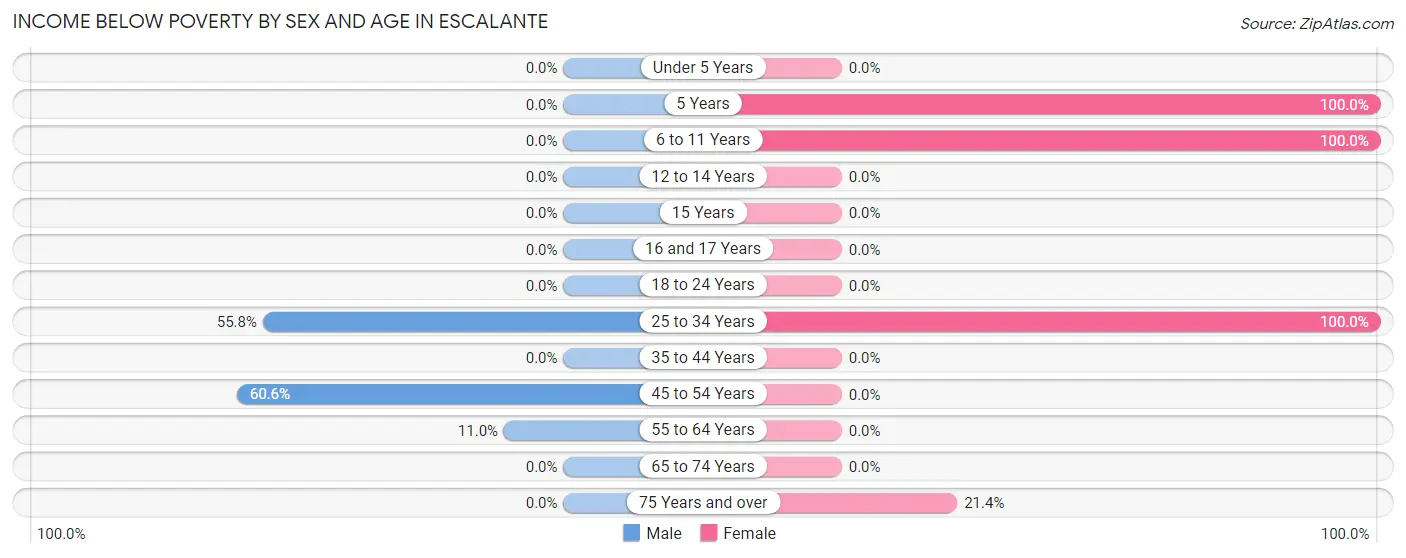
| Age Bracket | Male | Female |
| Under 5 Years | 0 (0.0%) | 0 (0.0%) |
| 5 Years | 0 (0.0%) | 12 (100.0%) |
| 6 to 11 Years | 0 (0.0%) | 12 (100.0%) |
| 12 to 14 Years | 0 (0.0%) | 0 (0.0%) |
| 15 Years | 0 (0.0%) | 0 (0.0%) |
| 16 and 17 Years | 0 (0.0%) | 0 (0.0%) |
| 18 to 24 Years | 0 (0.0%) | 0 (0.0%) |
| 25 to 34 Years | 53 (55.8%) | 26 (100.0%) |
| 35 to 44 Years | 0 (0.0%) | 0 (0.0%) |
| 45 to 54 Years | 20 (60.6%) | 0 (0.0%) |
| 55 to 64 Years | 15 (11.0%) | 0 (0.0%) |
| 65 to 74 Years | 0 (0.0%) | 0 (0.0%) |
| 75 Years and over | 0 (0.0%) | 12 (21.4%) |
| Total | 88 (23.6%) | 62 (21.8%) |
Income Above Poverty by Sex and Age in Escalante
According to the poverty statistics in Escalante, males aged 12 to 14 years and females aged 35 to 44 years are the age groups that are most secure financially, with 100.0% of males and 100.0% of females in these age groups living above the poverty line.
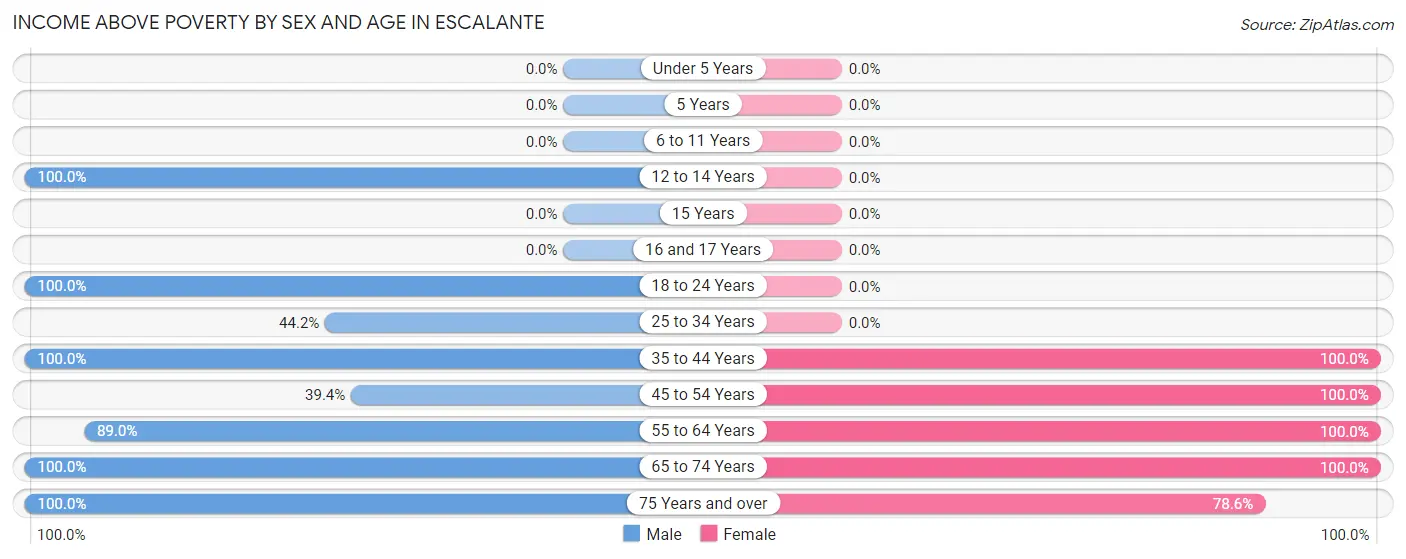
| Age Bracket | Male | Female |
| Under 5 Years | 0 (0.0%) | 0 (0.0%) |
| 5 Years | 0 (0.0%) | 0 (0.0%) |
| 6 to 11 Years | 0 (0.0%) | 0 (0.0%) |
| 12 to 14 Years | 11 (100.0%) | 0 (0.0%) |
| 15 Years | 0 (0.0%) | 0 (0.0%) |
| 16 and 17 Years | 0 (0.0%) | 0 (0.0%) |
| 18 to 24 Years | 2 (100.0%) | 0 (0.0%) |
| 25 to 34 Years | 42 (44.2%) | 0 (0.0%) |
| 35 to 44 Years | 28 (100.0%) | 12 (100.0%) |
| 45 to 54 Years | 13 (39.4%) | 18 (100.0%) |
| 55 to 64 Years | 121 (89.0%) | 134 (100.0%) |
| 65 to 74 Years | 39 (100.0%) | 14 (100.0%) |
| 75 Years and over | 29 (100.0%) | 44 (78.6%) |
| Total | 285 (76.4%) | 222 (78.2%) |
Income Below Poverty Among Married-Couple Families in Escalante
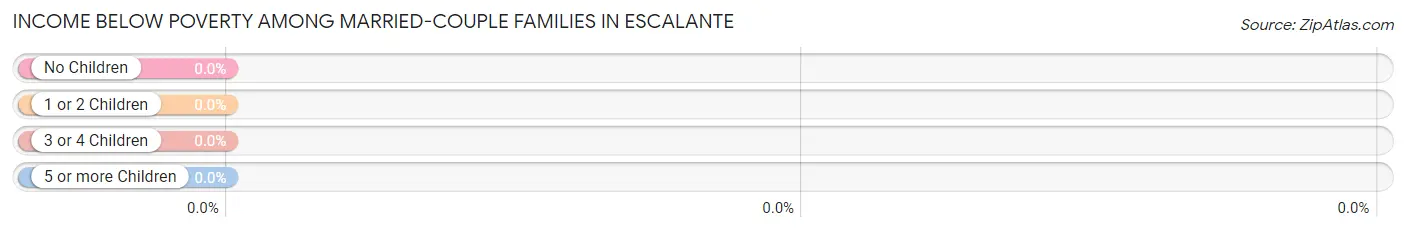
| Children | Above Poverty | Below Poverty |
| No Children | 155 (100.0%) | 0 (0.0%) |
| 1 or 2 Children | 0 (0.0%) | 0 (0.0%) |
| 3 or 4 Children | 0 (0.0%) | 0 (0.0%) |
| 5 or more Children | 0 (0.0%) | 0 (0.0%) |
| Total | 155 (100.0%) | 0 (0.0%) |
Income Below Poverty Among Single-Parent Households in Escalante
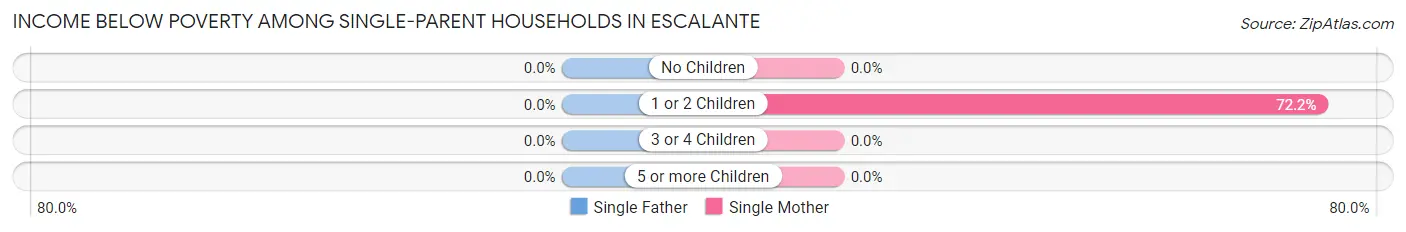
| Children | Single Father | Single Mother |
| No Children | 0 (0.0%) | 0 (0.0%) |
| 1 or 2 Children | 0 (0.0%) | 26 (72.2%) |
| 3 or 4 Children | 0 (0.0%) | 0 (0.0%) |
| 5 or more Children | 0 (0.0%) | 0 (0.0%) |
| Total | 0 (0.0%) | 26 (72.2%) |
Income Below Poverty Among Married-Couple vs Single-Parent Households in Escalante
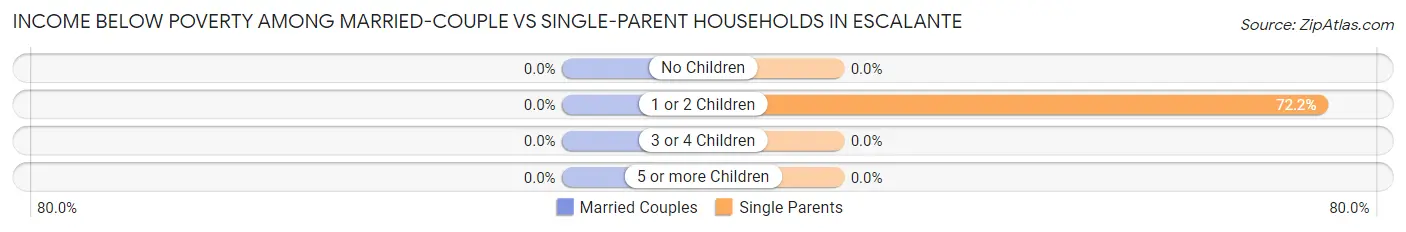
| Children | Married-Couple Families | Single-Parent Households |
| No Children | 0 (0.0%) | 0 (0.0%) |
| 1 or 2 Children | 0 (0.0%) | 26 (72.2%) |
| 3 or 4 Children | 0 (0.0%) | 0 (0.0%) |
| 5 or more Children | 0 (0.0%) | 0 (0.0%) |
| Total | 0 (0.0%) | 26 (72.2%) |
Race in Escalante
The most populous races in Escalante are White / Caucasian (649 | 98.8%), Hispanic or Latino (76 | 11.6%), and Two or more Races (8 | 1.2%).
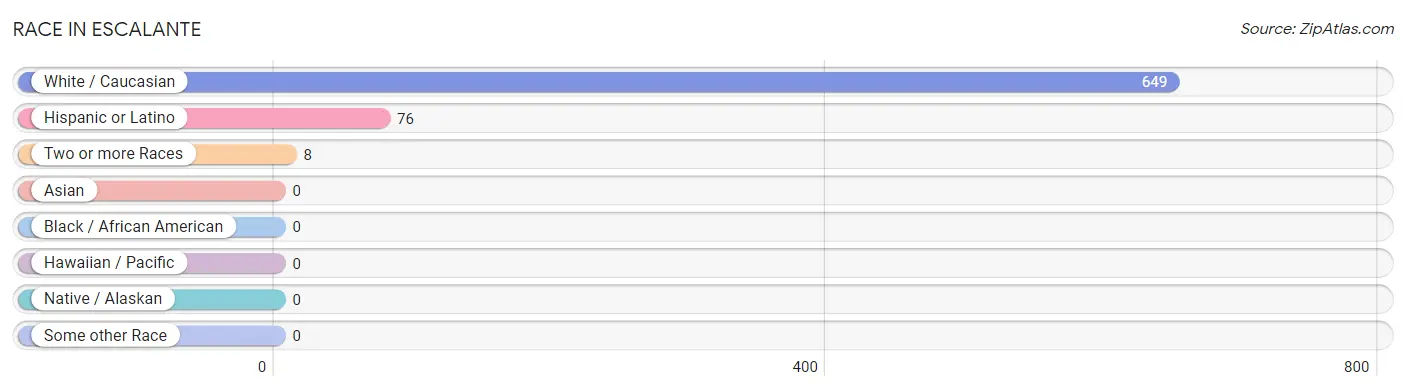
| Race | # Population | % Population |
| Asian | 0 | 0.0% |
| Black / African American | 0 | 0.0% |
| Hawaiian / Pacific | 0 | 0.0% |
| Hispanic or Latino | 76 | 11.6% |
| Native / Alaskan | 0 | 0.0% |
| White / Caucasian | 649 | 98.8% |
| Two or more Races | 8 | 1.2% |
| Some other Race | 0 | 0.0% |
| Total | 657 | 100.0% |
Ancestry in Escalante
The most populous ancestries reported in Escalante are English (203 | 30.9%), European (104 | 15.8%), German (90 | 13.7%), Irish (78 | 11.9%), and Mexican (76 | 11.6%), together accounting for 83.9% of all Escalante residents.
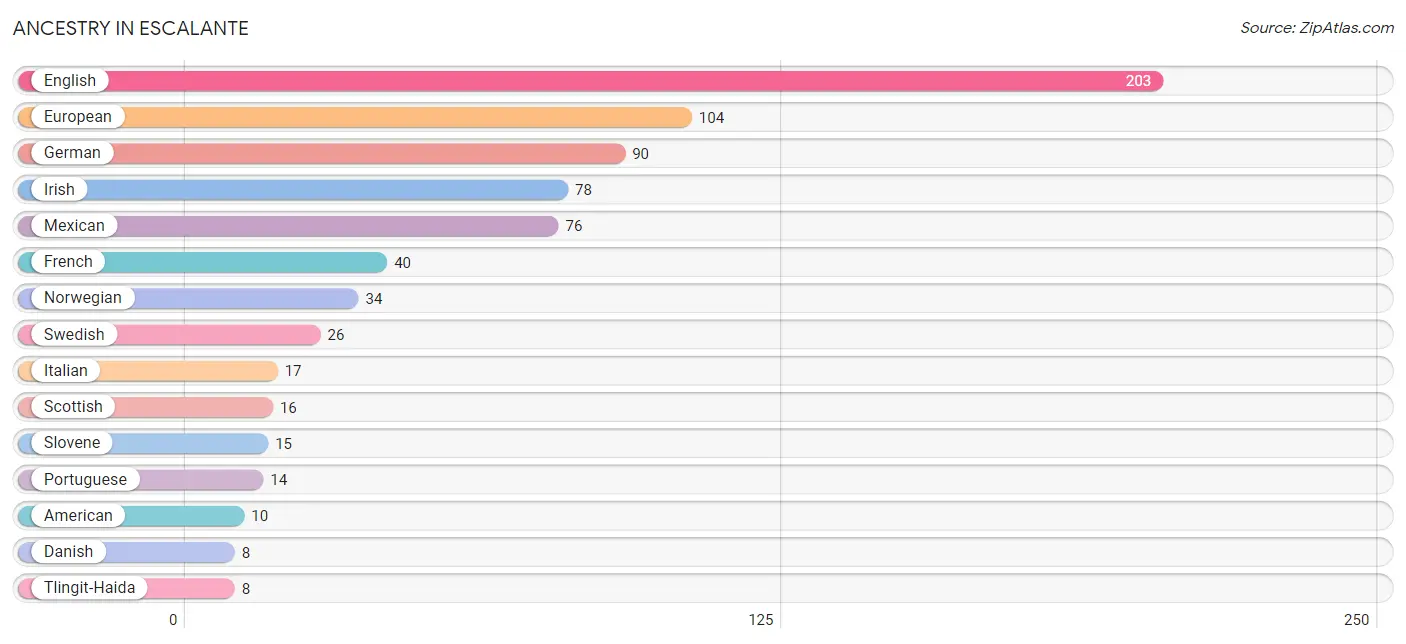
| Ancestry | # Population | % Population |
| American | 10 | 1.5% |
| Danish | 8 | 1.2% |
| English | 203 | 30.9% |
| European | 104 | 15.8% |
| French | 40 | 6.1% |
| German | 90 | 13.7% |
| Irish | 78 | 11.9% |
| Italian | 17 | 2.6% |
| Mexican | 76 | 11.6% |
| Norwegian | 34 | 5.2% |
| Portuguese | 14 | 2.1% |
| Scottish | 16 | 2.4% |
| Slovene | 15 | 2.3% |
| Swedish | 26 | 4.0% |
| Tlingit-Haida | 8 | 1.2% | View All 15 Rows |
Immigrants in Escalante
The most numerous immigrant groups reported in Escalante came from Central America (52 | 7.9%), Latin America (52 | 7.9%), and Mexico (52 | 7.9%), together accounting for 23.7% of all Escalante residents.
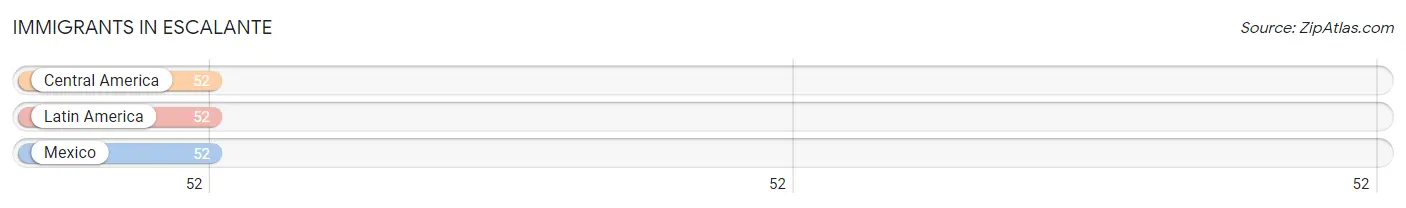
| Immigration Origin | # Population | % Population |
| Central America | 52 | 7.9% |
| Latin America | 52 | 7.9% |
| Mexico | 52 | 7.9% | View All 3 Rows |
Sex and Age in Escalante
Sex and Age in Escalante
The most populous age groups in Escalante are 25 to 29 Years (85 | 22.8%) for men and 55 to 59 Years (67 | 23.6%) for women.
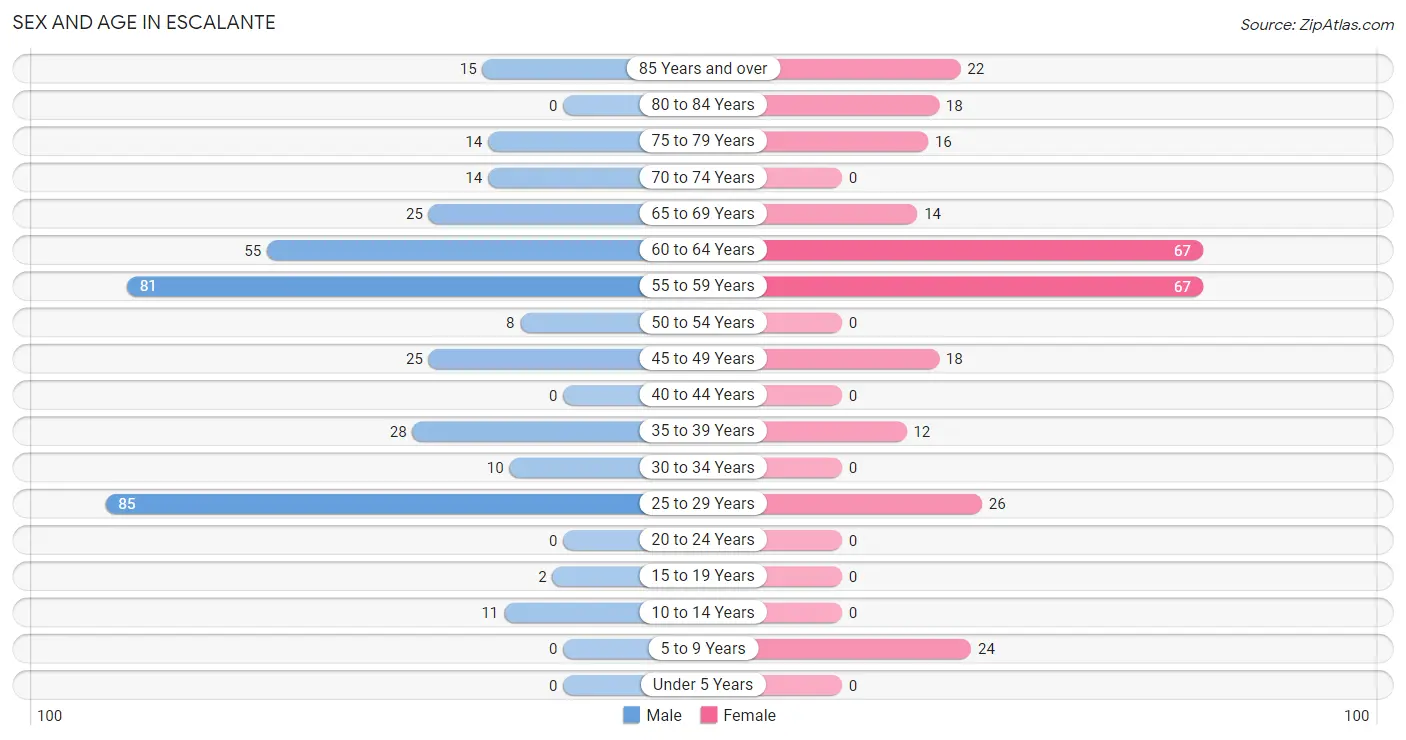
| Age Bracket | Male | Female |
| Under 5 Years | 0 (0.0%) | 0 (0.0%) |
| 5 to 9 Years | 0 (0.0%) | 24 (8.5%) |
| 10 to 14 Years | 11 (2.9%) | 0 (0.0%) |
| 15 to 19 Years | 2 (0.5%) | 0 (0.0%) |
| 20 to 24 Years | 0 (0.0%) | 0 (0.0%) |
| 25 to 29 Years | 85 (22.8%) | 26 (9.1%) |
| 30 to 34 Years | 10 (2.7%) | 0 (0.0%) |
| 35 to 39 Years | 28 (7.5%) | 12 (4.2%) |
| 40 to 44 Years | 0 (0.0%) | 0 (0.0%) |
| 45 to 49 Years | 25 (6.7%) | 18 (6.3%) |
| 50 to 54 Years | 8 (2.1%) | 0 (0.0%) |
| 55 to 59 Years | 81 (21.7%) | 67 (23.6%) |
| 60 to 64 Years | 55 (14.7%) | 67 (23.6%) |
| 65 to 69 Years | 25 (6.7%) | 14 (4.9%) |
| 70 to 74 Years | 14 (3.7%) | 0 (0.0%) |
| 75 to 79 Years | 14 (3.7%) | 16 (5.6%) |
| 80 to 84 Years | 0 (0.0%) | 18 (6.3%) |
| 85 Years and over | 15 (4.0%) | 22 (7.7%) |
| Total | 373 (100.0%) | 284 (100.0%) |
Families and Households in Escalante
Median Family Size in Escalante
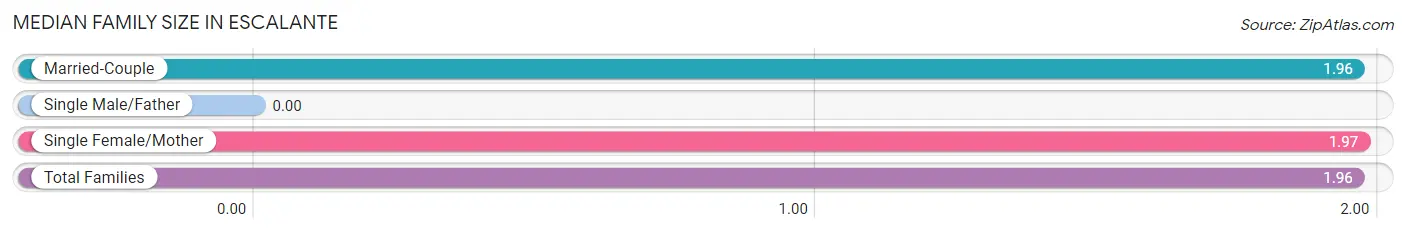
| Family Type | # Families | Family Size |
| Married-Couple | 155 (81.1%) | 1.96 |
| Single Male/Father | 0 (0.0%) | - |
| Single Female/Mother | 36 (18.9%) | 1.97 |
| Total Families | 191 (100.0%) | 1.96 |
Median Household Size in Escalante
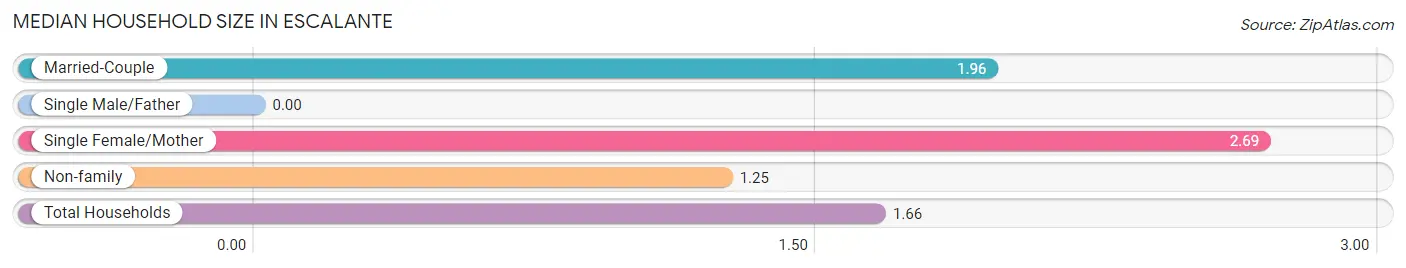
| Household Type | # Households | Household Size |
| Married-Couple | 155 (39.2%) | 1.96 |
| Single Male/Father | 0 (0.0%) | - |
| Single Female/Mother | 36 (9.1%) | 2.69 |
| Non-family | 204 (51.6%) | 1.25 |
| Total Households | 395 (100.0%) | 1.66 |
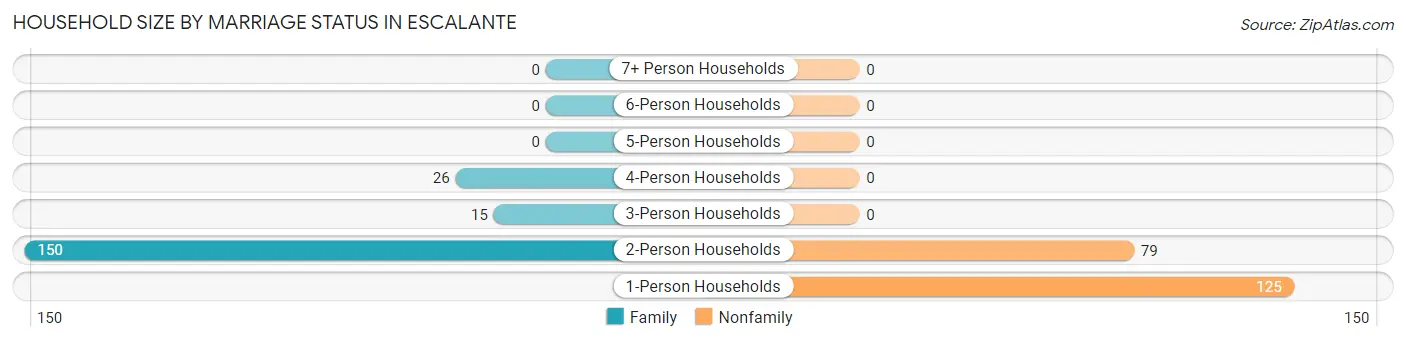
Household Size by Marriage Status in Escalante
Out of a total of 395 households in Escalante, 191 (48.3%) are family households, while 204 (51.6%) are nonfamily households. The most numerous type of family households are 2-person households, comprising 150, and the most common type of nonfamily households are 1-person households, comprising 125.
| Household Size | Family Households | Nonfamily Households |
| 1-Person Households | - | 125 (31.7%) |
| 2-Person Households | 150 (38.0%) | 79 (20.0%) |
| 3-Person Households | 15 (3.8%) | 0 (0.0%) |
| 4-Person Households | 26 (6.6%) | 0 (0.0%) |
| 5-Person Households | 0 (0.0%) | 0 (0.0%) |
| 6-Person Households | 0 (0.0%) | 0 (0.0%) |
| 7+ Person Households | 0 (0.0%) | 0 (0.0%) |
| Total | 191 (48.3%) | 204 (51.6%) |
Female Fertility in Escalante
Fertility by Age in Escalante
| Age Bracket | Women with Births | Births / 1,000 Women |
| 15 to 19 years | 0 (0.0%) | 0.0 |
| 20 to 34 years | 0 (0.0%) | 0.0 |
| 35 to 50 years | 0 (0.0%) | 0.0 |
| Total | 0 (0.0%) | 0.0 |
Fertility by Age by Marriage Status in Escalante
| Age Bracket | Married | Unmarried |
| 15 to 19 years | 0 (0.0%) | 0 (0.0%) |
| 20 to 34 years | 0 (0.0%) | 0 (0.0%) |
| 35 to 50 years | 0 (0.0%) | 0 (0.0%) |
| Total | 0 (0.0%) | 0 (0.0%) |
Fertility by Education in Escalante
| Educational Attainment | Women with Births | Births / 1,000 Women |
| Less than High School | 0 (0.0%) | 0.0 |
| High School Diploma | 0 (0.0%) | 0.0 |
| College or Associate's Degree | 0 (0.0%) | 0.0 |
| Bachelor's Degree | 0 (0.0%) | 0.0 |
| Graduate Degree | 0 (0.0%) | 0.0 |
| Total | 0 (0.0%) | 0.0 |
Fertility by Education by Marriage Status in Escalante
| Educational Attainment | Married | Unmarried |
| Less than High School | 0 (0.0%) | 0 (0.0%) |
| High School Diploma | 0 (0.0%) | 0 (0.0%) |
| College or Associate's Degree | 0 (0.0%) | 0 (0.0%) |
| Bachelor's Degree | 0 (0.0%) | 0 (0.0%) |
| Graduate Degree | 0 (0.0%) | 0 (0.0%) |
| Total | 0 (0.0%) | 0 (0.0%) |
Employment Characteristics in Escalante
Employment by Class of Employer in Escalante
Among the 413 employed individuals in Escalante, private company employees (277 | 67.1%), federal government employees (42 | 10.2%), and local government employees (35 | 8.5%) make up the most common classes of employment.
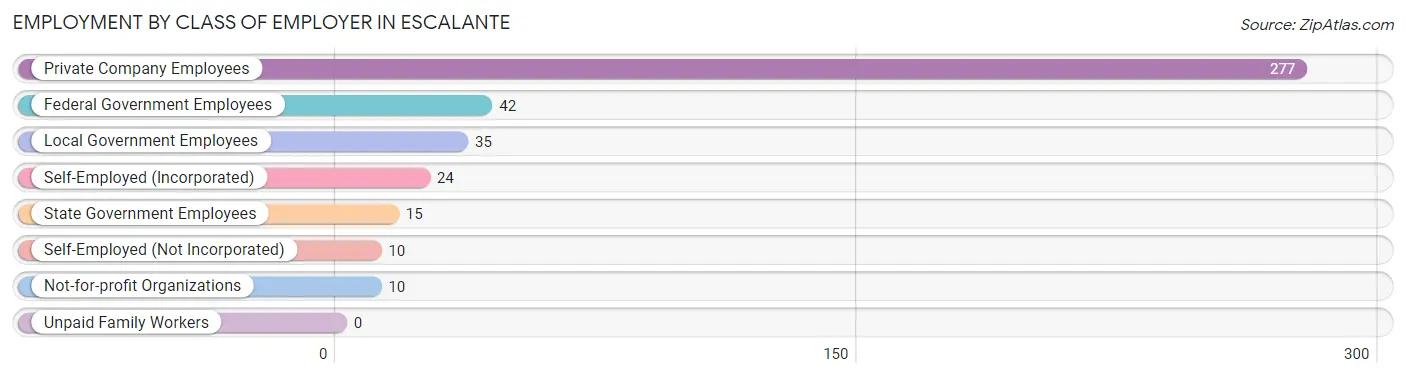
| Employer Class | # Employees | % Employees |
| Private Company Employees | 277 | 67.1% |
| Self-Employed (Incorporated) | 24 | 5.8% |
| Self-Employed (Not Incorporated) | 10 | 2.4% |
| Not-for-profit Organizations | 10 | 2.4% |
| Local Government Employees | 35 | 8.5% |
| State Government Employees | 15 | 3.6% |
| Federal Government Employees | 42 | 10.2% |
| Unpaid Family Workers | 0 | 0.0% |
| Total | 413 | 100.0% |
Employment Status by Age in Escalante
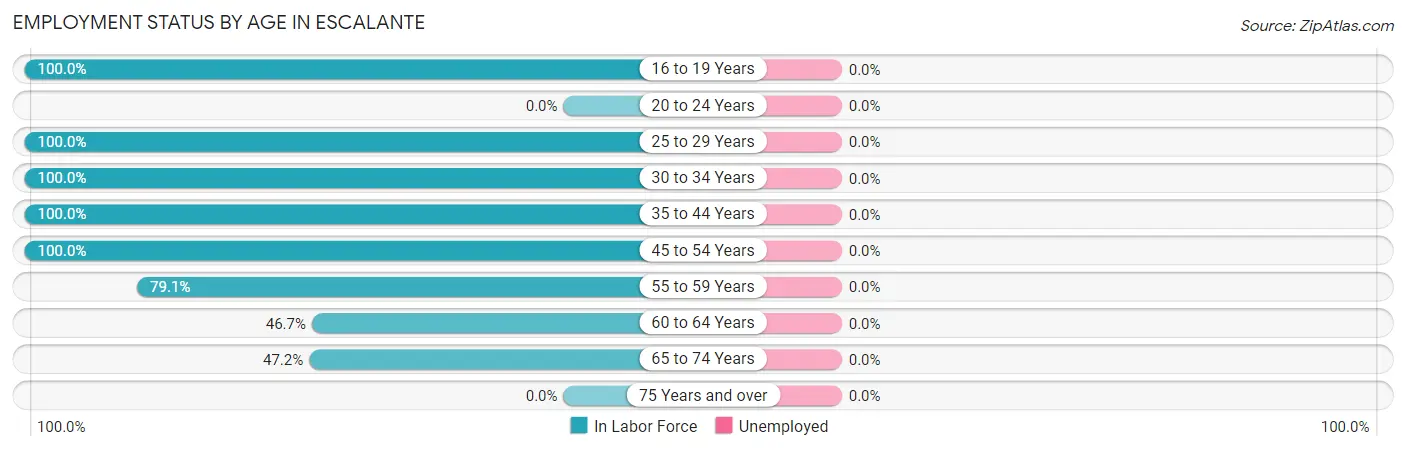
| Age Bracket | In Labor Force | Unemployed |
| 16 to 19 Years | 2 (100.0%) | 0 (0.0%) |
| 20 to 24 Years | 0 (0.0%) | 0 (0.0%) |
| 25 to 29 Years | 111 (100.0%) | 0 (0.0%) |
| 30 to 34 Years | 10 (100.0%) | 0 (0.0%) |
| 35 to 44 Years | 40 (100.0%) | 0 (0.0%) |
| 45 to 54 Years | 51 (100.0%) | 0 (0.0%) |
| 55 to 59 Years | 117 (79.1%) | 0 (0.0%) |
| 60 to 64 Years | 57 (46.7%) | 0 (0.0%) |
| 65 to 74 Years | 25 (47.2%) | 0 (0.0%) |
| 75 Years and over | 0 (0.0%) | 0 (0.0%) |
| Total | 413 (66.4%) | 0 (0.0%) |
Employment Status by Educational Attainment in Escalante
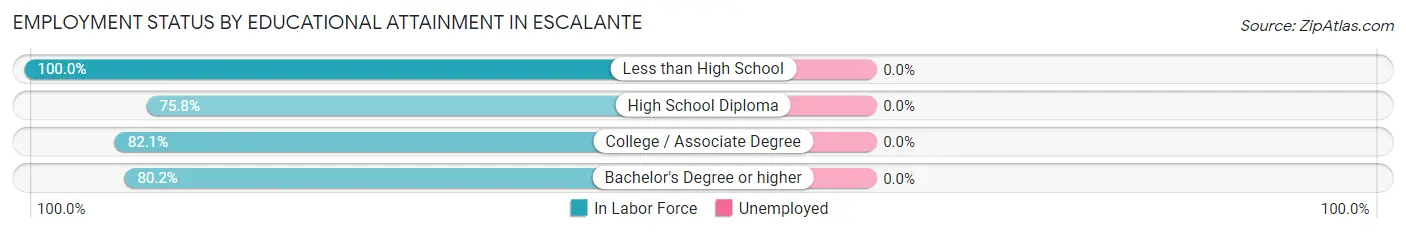
| Educational Attainment | In Labor Force | Unemployed |
| Less than High School | 8 (100.0%) | 0 (0.0%) |
| High School Diploma | 116 (75.8%) | 0 (0.0%) |
| College / Associate Degree | 197 (82.1%) | 0 (0.0%) |
| Bachelor's Degree or higher | 65 (80.2%) | 0 (0.0%) |
| Total | 386 (80.1%) | 0 (0.0%) |
Employment Occupations by Sex in Escalante
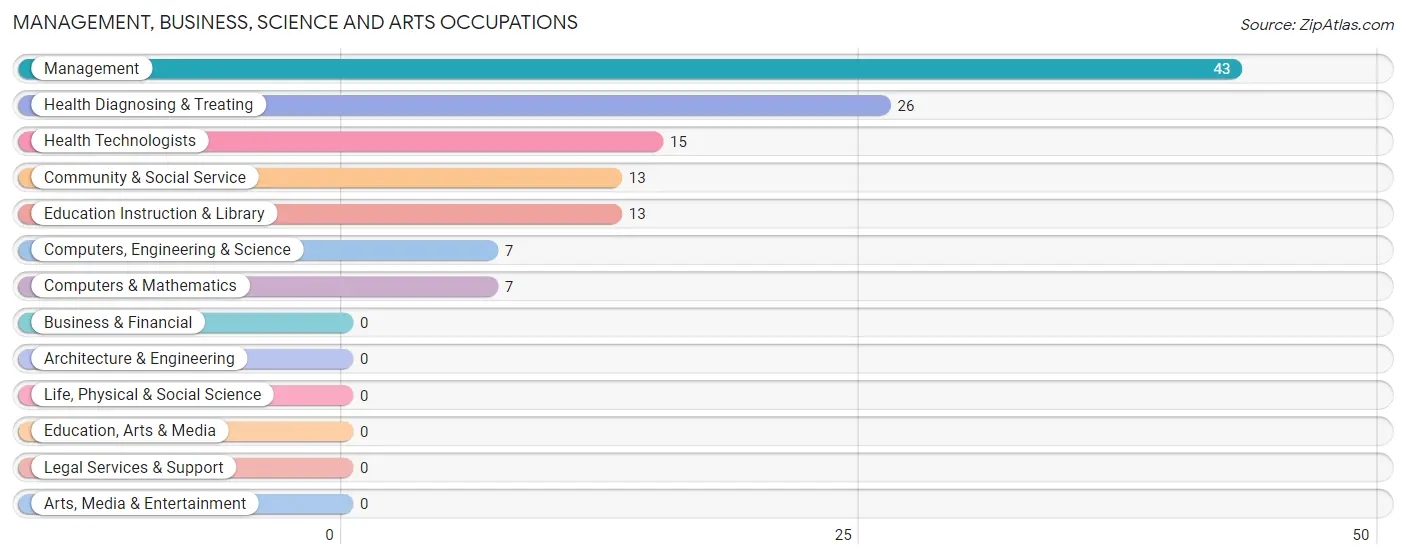
Management, Business, Science and Arts Occupations
The most common Management, Business, Science and Arts occupations in Escalante are Management (43 | 10.4%), Health Diagnosing & Treating (26 | 6.3%), Health Technologists (15 | 3.6%), Community & Social Service (13 | 3.2%), and Education Instruction & Library (13 | 3.2%).
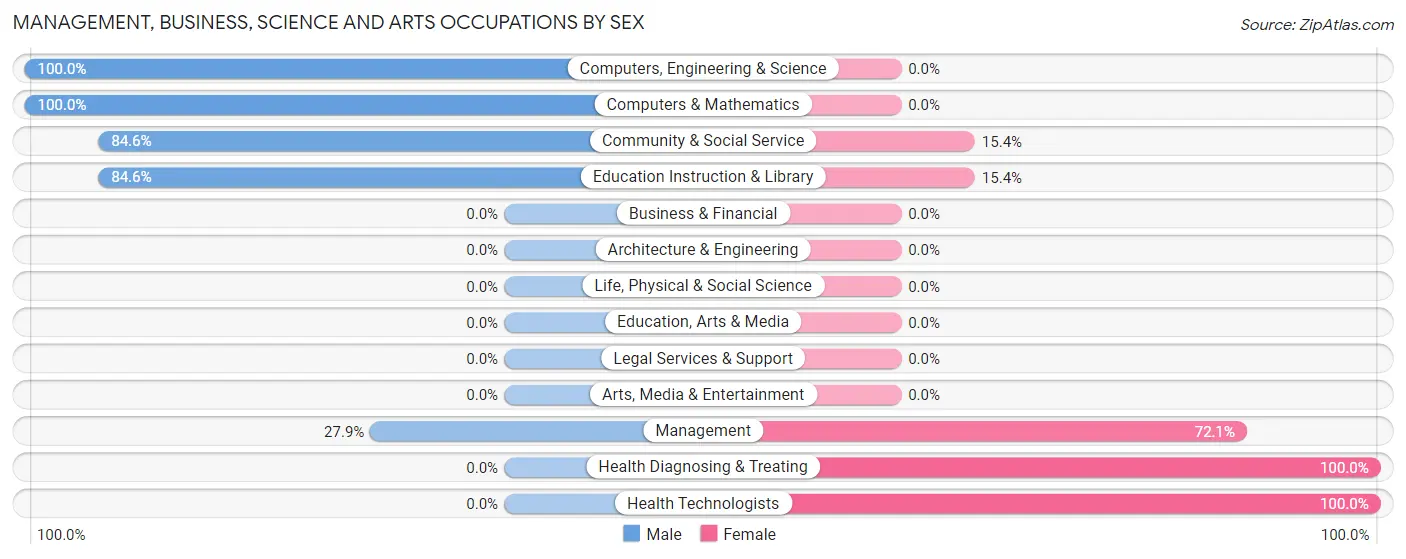
Management, Business, Science and Arts Occupations by Sex
Within the Management, Business, Science and Arts occupations in Escalante, the most male-oriented occupations are Computers, Engineering & Science (100.0%), Computers & Mathematics (100.0%), and Community & Social Service (84.6%), while the most female-oriented occupations are Health Diagnosing & Treating (100.0%), Health Technologists (100.0%), and Management (72.1%).
| Occupation | Male | Female |
| Management | 12 (27.9%) | 31 (72.1%) |
| Business & Financial | 0 (0.0%) | 0 (0.0%) |
| Computers, Engineering & Science | 7 (100.0%) | 0 (0.0%) |
| Computers & Mathematics | 7 (100.0%) | 0 (0.0%) |
| Architecture & Engineering | 0 (0.0%) | 0 (0.0%) |
| Life, Physical & Social Science | 0 (0.0%) | 0 (0.0%) |
| Community & Social Service | 11 (84.6%) | 2 (15.4%) |
| Education, Arts & Media | 0 (0.0%) | 0 (0.0%) |
| Legal Services & Support | 0 (0.0%) | 0 (0.0%) |
| Education Instruction & Library | 11 (84.6%) | 2 (15.4%) |
| Arts, Media & Entertainment | 0 (0.0%) | 0 (0.0%) |
| Health Diagnosing & Treating | 0 (0.0%) | 26 (100.0%) |
| Health Technologists | 0 (0.0%) | 15 (100.0%) |
| Total (Category) | 30 (33.7%) | 59 (66.3%) |
| Total (Overall) | 257 (62.2%) | 156 (37.8%) |
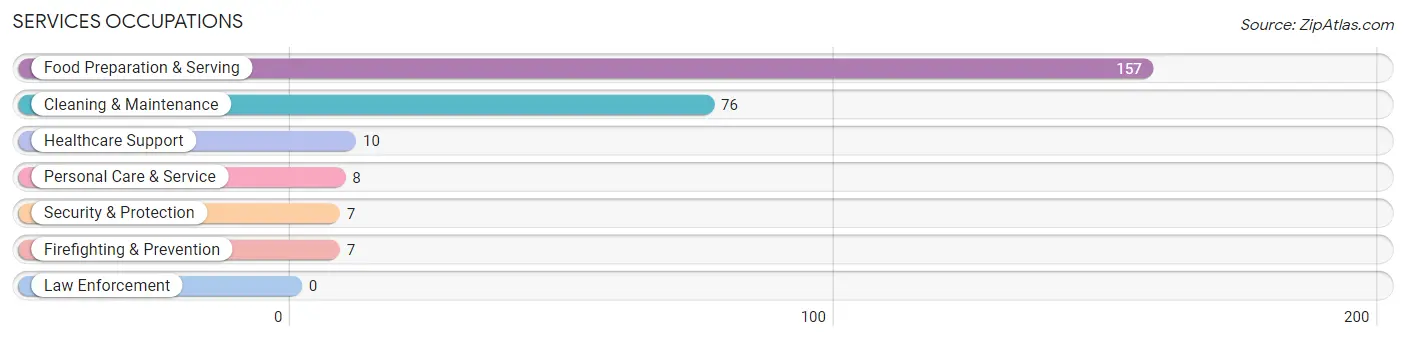
Services Occupations
The most common Services occupations in Escalante are Food Preparation & Serving (157 | 38.0%), Cleaning & Maintenance (76 | 18.4%), Healthcare Support (10 | 2.4%), Personal Care & Service (8 | 1.9%), and Security & Protection (7 | 1.7%).
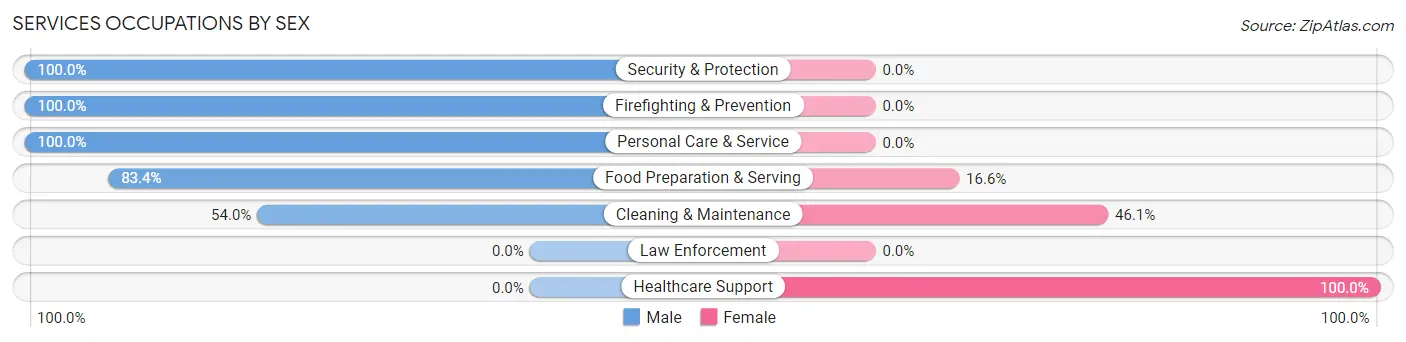
Services Occupations by Sex
Within the Services occupations in Escalante, the most male-oriented occupations are Security & Protection (100.0%), Firefighting & Prevention (100.0%), and Personal Care & Service (100.0%), while the most female-oriented occupations are Healthcare Support (100.0%), Cleaning & Maintenance (46.1%), and Food Preparation & Serving (16.6%).
| Occupation | Male | Female |
| Healthcare Support | 0 (0.0%) | 10 (100.0%) |
| Security & Protection | 7 (100.0%) | 0 (0.0%) |
| Firefighting & Prevention | 7 (100.0%) | 0 (0.0%) |
| Law Enforcement | 0 (0.0%) | 0 (0.0%) |
| Food Preparation & Serving | 131 (83.4%) | 26 (16.6%) |
| Cleaning & Maintenance | 41 (53.9%) | 35 (46.1%) |
| Personal Care & Service | 8 (100.0%) | 0 (0.0%) |
| Total (Category) | 187 (72.5%) | 71 (27.5%) |
| Total (Overall) | 257 (62.2%) | 156 (37.8%) |
Sales and Office Occupations
The most common Sales and Office occupations in Escalante are , and Office & Administration (26 | 6.3%).
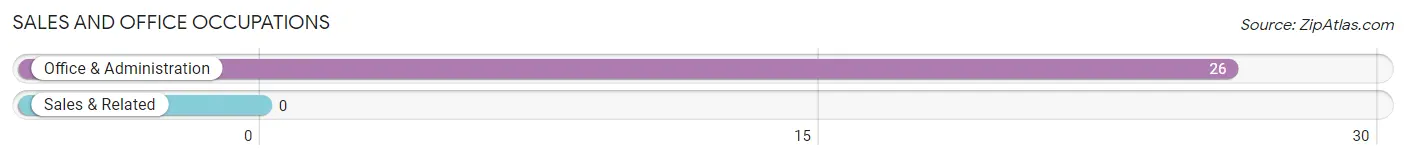
Sales and Office Occupations by Sex
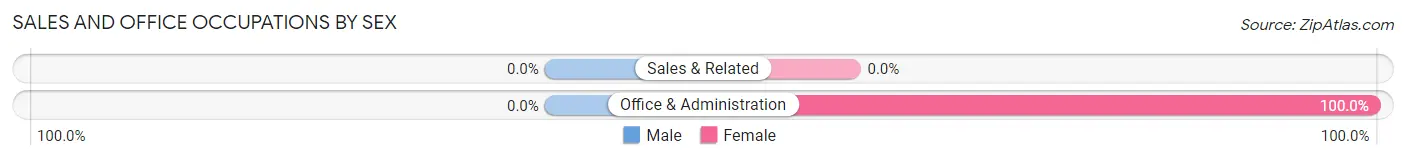
| Occupation | Male | Female |
| Sales & Related | 0 (0.0%) | 0 (0.0%) |
| Office & Administration | 0 (0.0%) | 26 (100.0%) |
| Total (Category) | 0 (0.0%) | 26 (100.0%) |
| Total (Overall) | 257 (62.2%) | 156 (37.8%) |
Natural Resources, Construction and Maintenance Occupations
The most common Natural Resources, Construction and Maintenance occupations in Escalante are Construction & Extraction (21 | 5.1%), and Installation, Maintenance & Repair (8 | 1.9%).
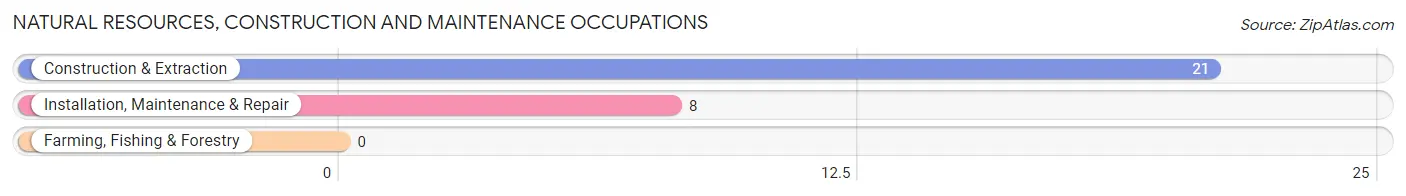
Natural Resources, Construction and Maintenance Occupations by Sex
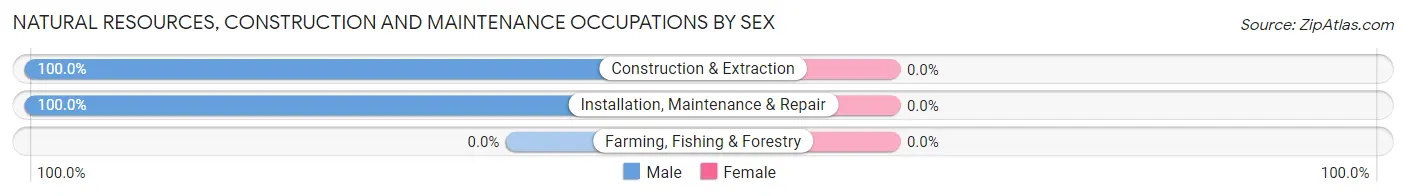
| Occupation | Male | Female |
| Farming, Fishing & Forestry | 0 (0.0%) | 0 (0.0%) |
| Construction & Extraction | 21 (100.0%) | 0 (0.0%) |
| Installation, Maintenance & Repair | 8 (100.0%) | 0 (0.0%) |
| Total (Category) | 29 (100.0%) | 0 (0.0%) |
| Total (Overall) | 257 (62.2%) | 156 (37.8%) |
Production, Transportation and Moving Occupations
The most common Production, Transportation and Moving occupations in Escalante are , and Transportation (11 | 2.7%).
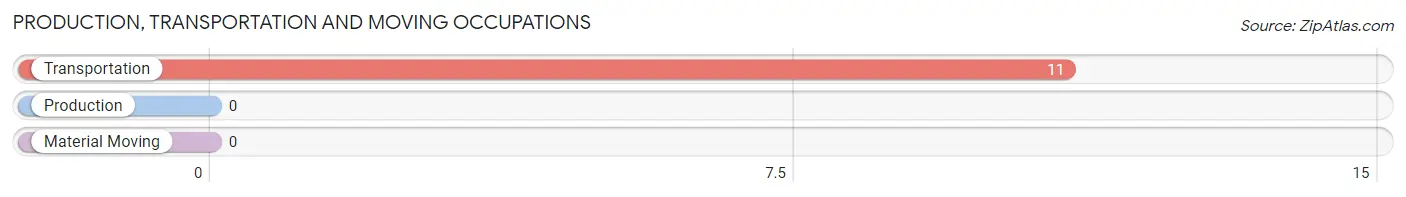
Production, Transportation and Moving Occupations by Sex
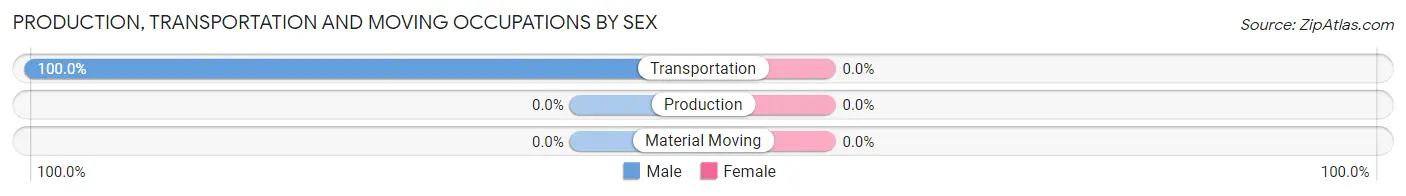
| Occupation | Male | Female |
| Production | 0 (0.0%) | 0 (0.0%) |
| Transportation | 11 (100.0%) | 0 (0.0%) |
| Material Moving | 0 (0.0%) | 0 (0.0%) |
| Total (Category) | 11 (100.0%) | 0 (0.0%) |
| Total (Overall) | 257 (62.2%) | 156 (37.8%) |
Employment Industries by Sex in Escalante
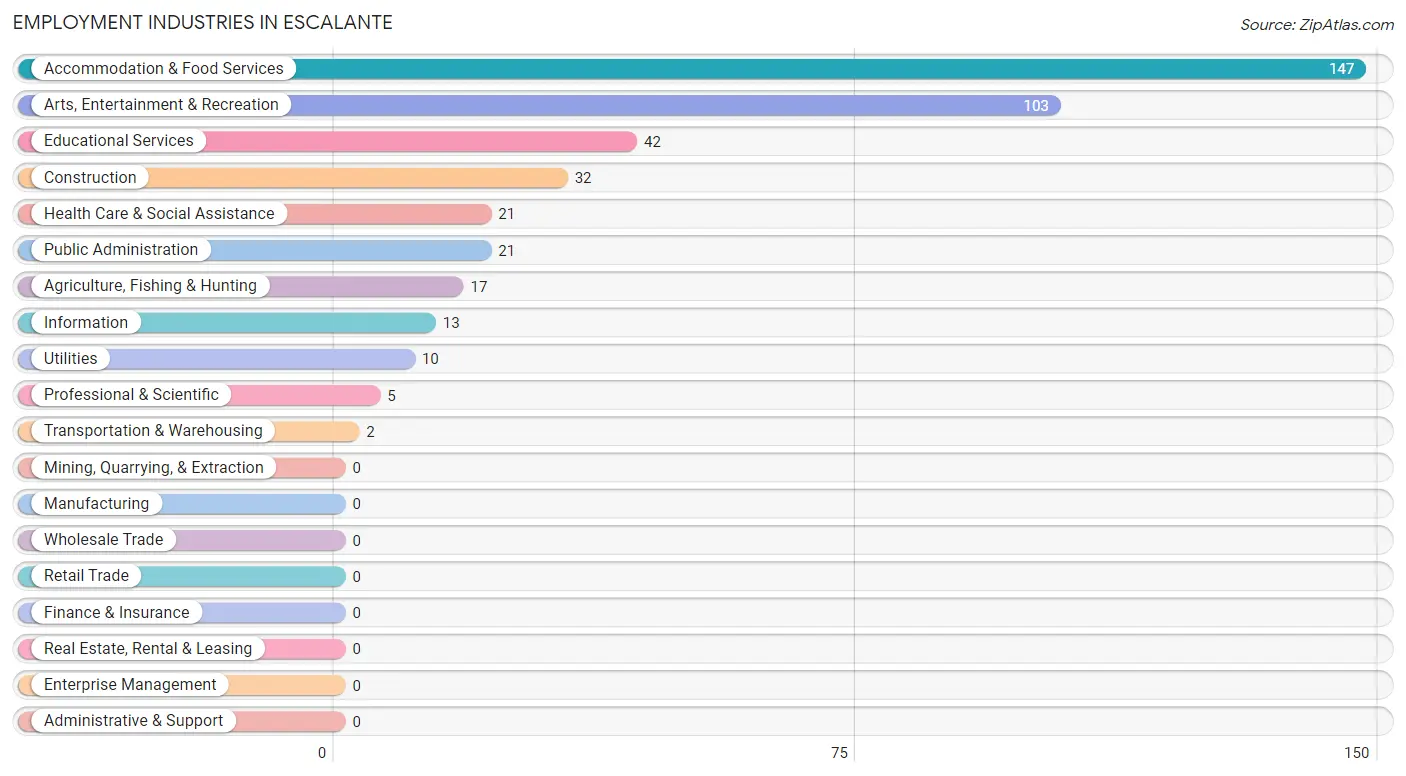
Employment Industries in Escalante
The major employment industries in Escalante include Accommodation & Food Services (147 | 35.6%), Arts, Entertainment & Recreation (103 | 24.9%), Educational Services (42 | 10.2%), Construction (32 | 7.7%), and Health Care & Social Assistance (21 | 5.1%).
Employment Industries by Sex in Escalante
The Escalante industries that see more men than women are Agriculture, Fishing & Hunting (100.0%), Construction (100.0%), and Transportation & Warehousing (100.0%), whereas the industries that tend to have a higher number of women are Information (100.0%), Health Care & Social Assistance (100.0%), and Public Administration (61.9%).
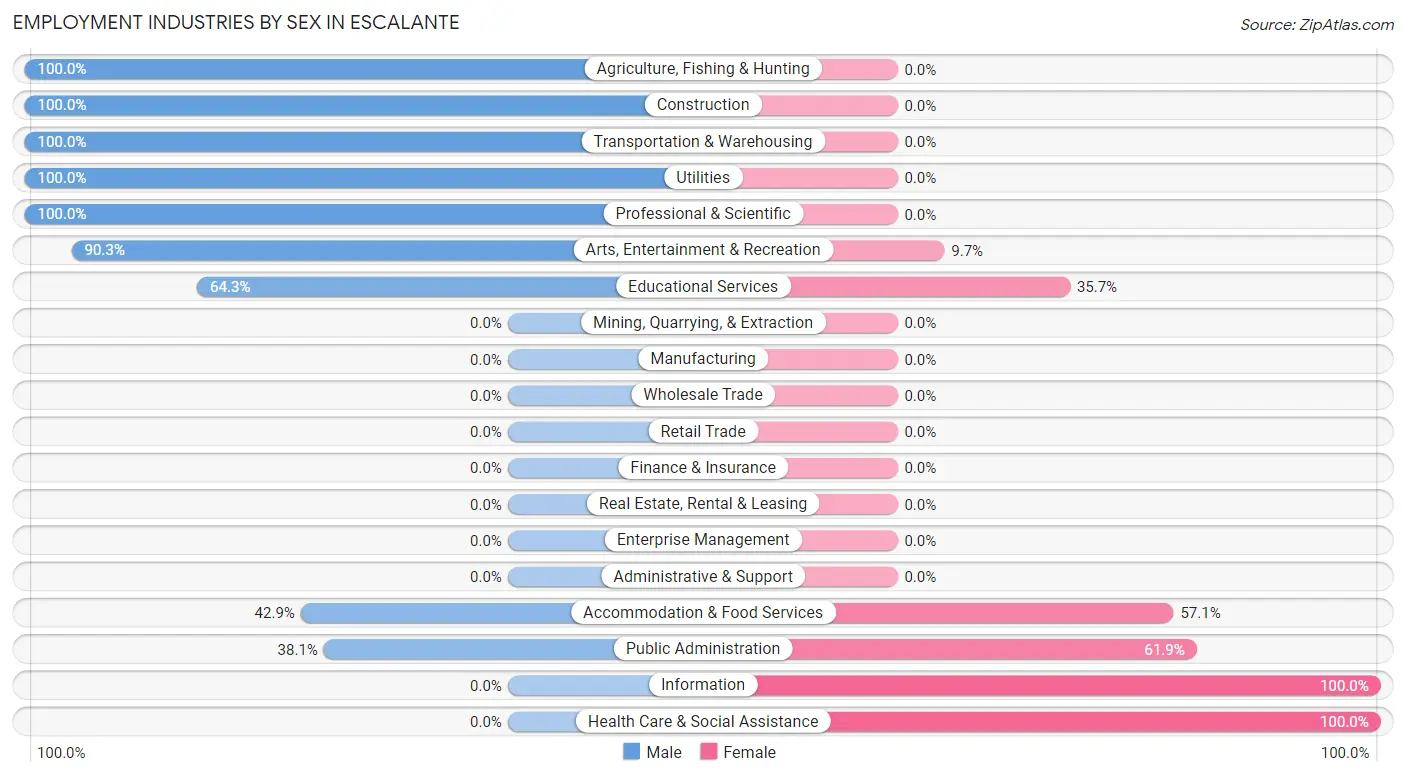
| Industry | Male | Female |
| Agriculture, Fishing & Hunting | 17 (100.0%) | 0 (0.0%) |
| Mining, Quarrying, & Extraction | 0 (0.0%) | 0 (0.0%) |
| Construction | 32 (100.0%) | 0 (0.0%) |
| Manufacturing | 0 (0.0%) | 0 (0.0%) |
| Wholesale Trade | 0 (0.0%) | 0 (0.0%) |
| Retail Trade | 0 (0.0%) | 0 (0.0%) |
| Transportation & Warehousing | 2 (100.0%) | 0 (0.0%) |
| Utilities | 10 (100.0%) | 0 (0.0%) |
| Information | 0 (0.0%) | 13 (100.0%) |
| Finance & Insurance | 0 (0.0%) | 0 (0.0%) |
| Real Estate, Rental & Leasing | 0 (0.0%) | 0 (0.0%) |
| Professional & Scientific | 5 (100.0%) | 0 (0.0%) |
| Enterprise Management | 0 (0.0%) | 0 (0.0%) |
| Administrative & Support | 0 (0.0%) | 0 (0.0%) |
| Educational Services | 27 (64.3%) | 15 (35.7%) |
| Health Care & Social Assistance | 0 (0.0%) | 21 (100.0%) |
| Arts, Entertainment & Recreation | 93 (90.3%) | 10 (9.7%) |
| Accommodation & Food Services | 63 (42.9%) | 84 (57.1%) |
| Public Administration | 8 (38.1%) | 13 (61.9%) |
| Total | 257 (62.2%) | 156 (37.8%) |
Education in Escalante
School Enrollment in Escalante
The most common levels of schooling among the 25 students in Escalante are elementary school (12 | 48.0%), middle school (11 | 44.0%), and high school (2 | 8.0%).
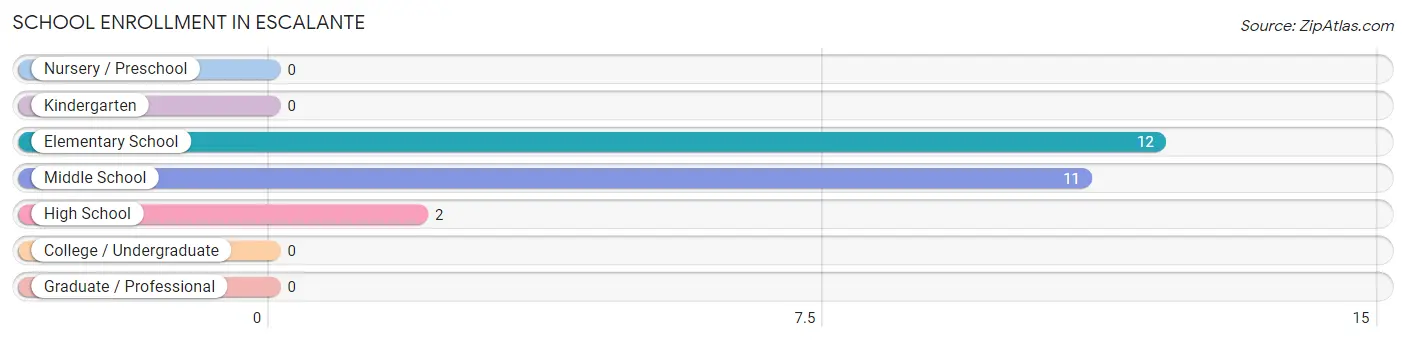
| School Level | # Students | % Students |
| Nursery / Preschool | 0 | 0.0% |
| Kindergarten | 0 | 0.0% |
| Elementary School | 12 | 48.0% |
| Middle School | 11 | 44.0% |
| High School | 2 | 8.0% |
| College / Undergraduate | 0 | 0.0% |
| Graduate / Professional | 0 | 0.0% |
| Total | 25 | 100.0% |
School Enrollment by Age by Funding Source in Escalante
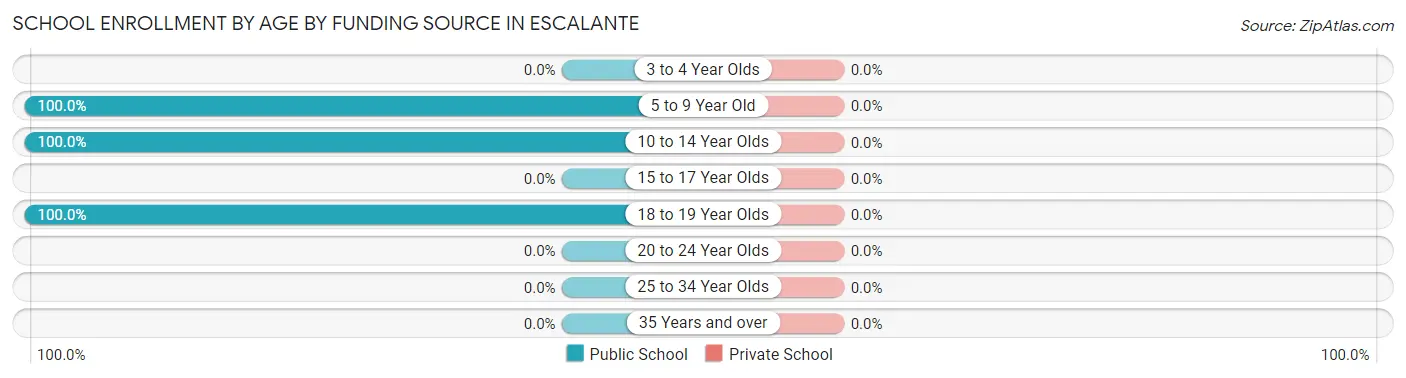
| Age Bracket | Public School | Private School |
| 3 to 4 Year Olds | 0 (0.0%) | 0 (0.0%) |
| 5 to 9 Year Old | 12 (100.0%) | 0 (0.0%) |
| 10 to 14 Year Olds | 11 (100.0%) | 0 (0.0%) |
| 15 to 17 Year Olds | 0 (0.0%) | 0 (0.0%) |
| 18 to 19 Year Olds | 2 (100.0%) | 0 (0.0%) |
| 20 to 24 Year Olds | 0 (0.0%) | 0 (0.0%) |
| 25 to 34 Year Olds | 0 (0.0%) | 0 (0.0%) |
| 35 Years and over | 0 (0.0%) | 0 (0.0%) |
| Total | 25 (100.0%) | 0 (0.0%) |
Educational Attainment by Field of Study in Escalante
Bio, nature & agricultural (32 | 23.5%), science & technology (32 | 23.5%), psychology (30 | 22.1%), education (27 | 19.9%), and business (8 | 5.9%) are the most common fields of study among 136 individuals in Escalante who have obtained a bachelor's degree or higher.
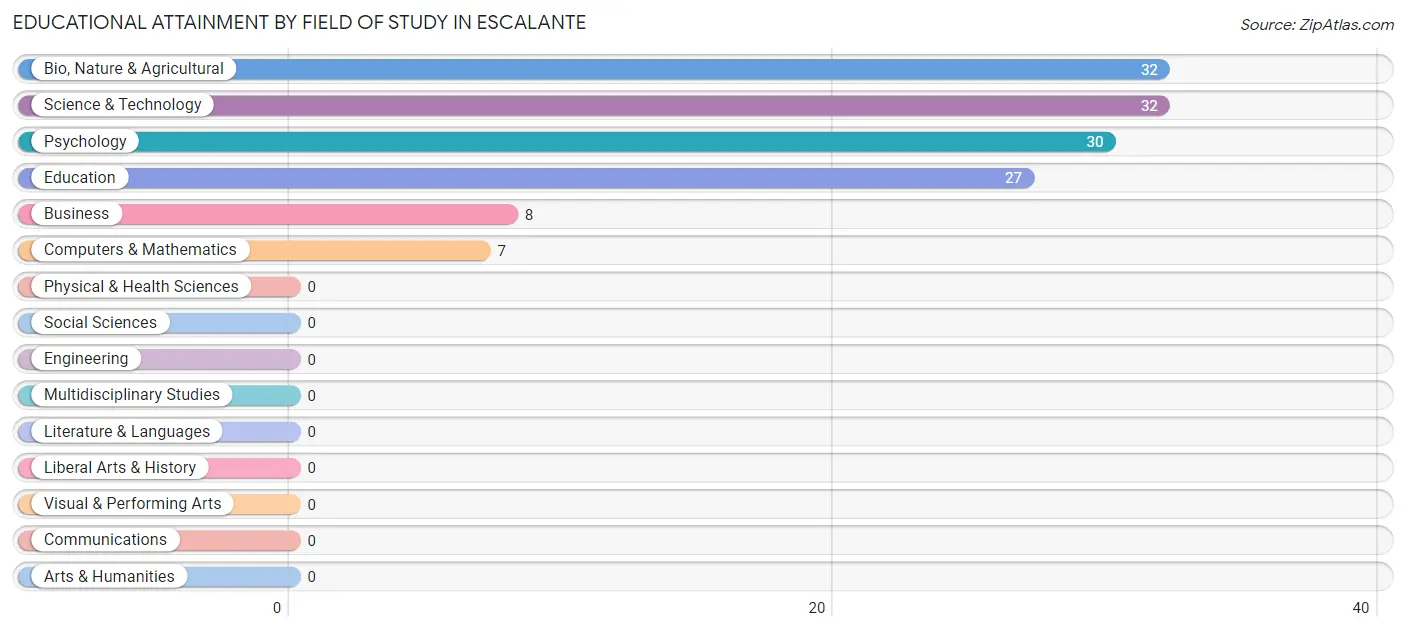
| Field of Study | # Graduates | % Graduates |
| Computers & Mathematics | 7 | 5.1% |
| Bio, Nature & Agricultural | 32 | 23.5% |
| Physical & Health Sciences | 0 | 0.0% |
| Psychology | 30 | 22.1% |
| Social Sciences | 0 | 0.0% |
| Engineering | 0 | 0.0% |
| Multidisciplinary Studies | 0 | 0.0% |
| Science & Technology | 32 | 23.5% |
| Business | 8 | 5.9% |
| Education | 27 | 19.9% |
| Literature & Languages | 0 | 0.0% |
| Liberal Arts & History | 0 | 0.0% |
| Visual & Performing Arts | 0 | 0.0% |
| Communications | 0 | 0.0% |
| Arts & Humanities | 0 | 0.0% |
| Total | 136 | 100.0% |
Transportation & Commute in Escalante
Vehicle Availability by Sex in Escalante
The most prevalent vehicle ownership categories in Escalante are males with 1 vehicle (112, accounting for 43.6%) and females with 1 vehicle (56, making up 71.8%).
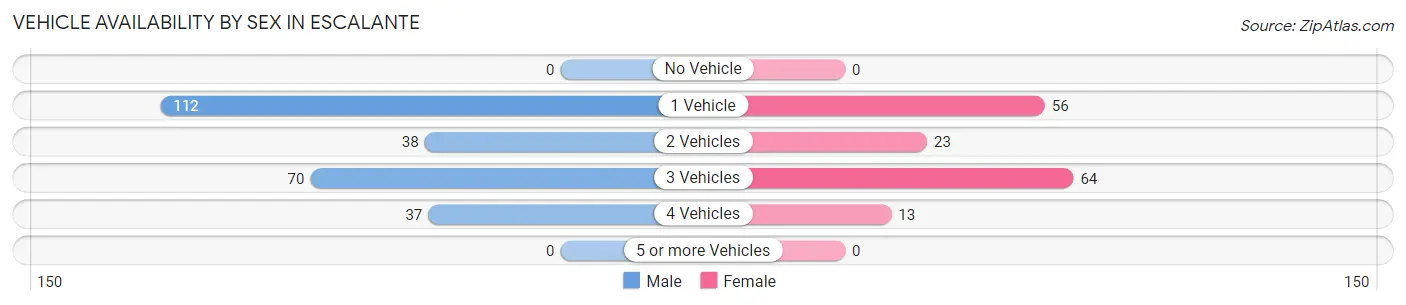
| Vehicles Available | Male | Female |
| No Vehicle | 0 (0.0%) | 0 (0.0%) |
| 1 Vehicle | 112 (43.6%) | 56 (35.9%) |
| 2 Vehicles | 38 (14.8%) | 23 (14.7%) |
| 3 Vehicles | 70 (27.2%) | 64 (41.0%) |
| 4 Vehicles | 37 (14.4%) | 13 (8.3%) |
| 5 or more Vehicles | 0 (0.0%) | 0 (0.0%) |
| Total | 257 (100.0%) | 156 (100.0%) |
Commute Time in Escalante
The most frequently occuring commute durations in Escalante are 5 to 9 minutes (143 commuters, 36.7%), 10 to 14 minutes (126 commuters, 32.3%), and less than 5 minutes (96 commuters, 24.6%).
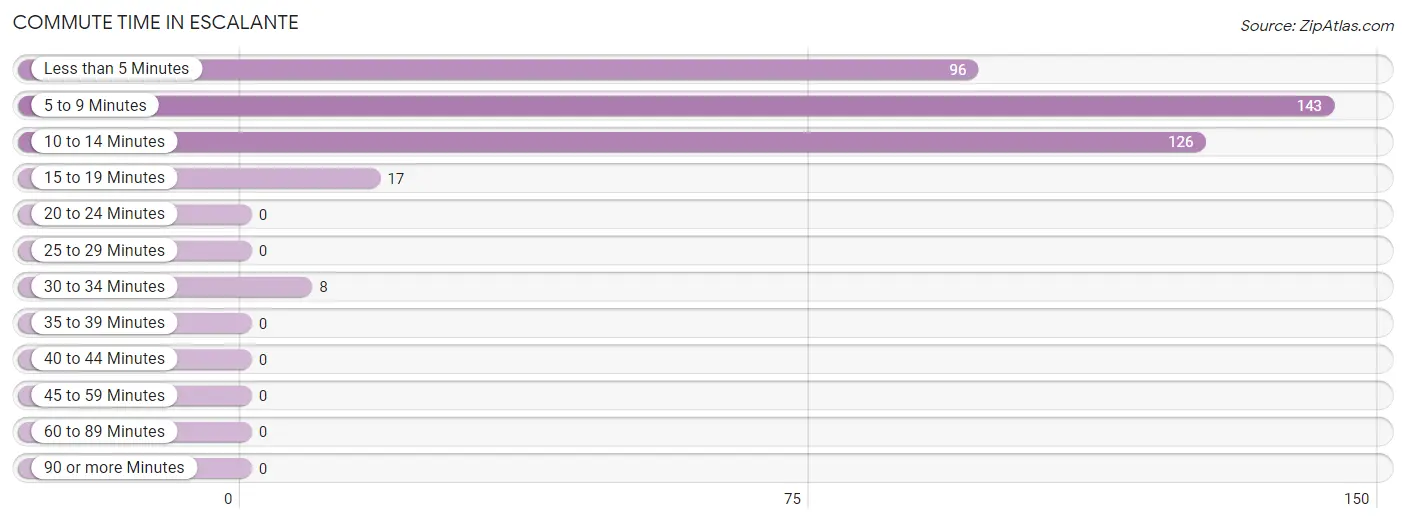
| Commute Time | # Commuters | % Commuters |
| Less than 5 Minutes | 96 | 24.6% |
| 5 to 9 Minutes | 143 | 36.7% |
| 10 to 14 Minutes | 126 | 32.3% |
| 15 to 19 Minutes | 17 | 4.4% |
| 20 to 24 Minutes | 0 | 0.0% |
| 25 to 29 Minutes | 0 | 0.0% |
| 30 to 34 Minutes | 8 | 2.1% |
| 35 to 39 Minutes | 0 | 0.0% |
| 40 to 44 Minutes | 0 | 0.0% |
| 45 to 59 Minutes | 0 | 0.0% |
| 60 to 89 Minutes | 0 | 0.0% |
| 90 or more Minutes | 0 | 0.0% |
Commute Time by Sex in Escalante
The most common commute times in Escalante are 10 to 14 minutes (102 commuters, 41.8%) for males and 5 to 9 minutes (78 commuters, 53.4%) for females.
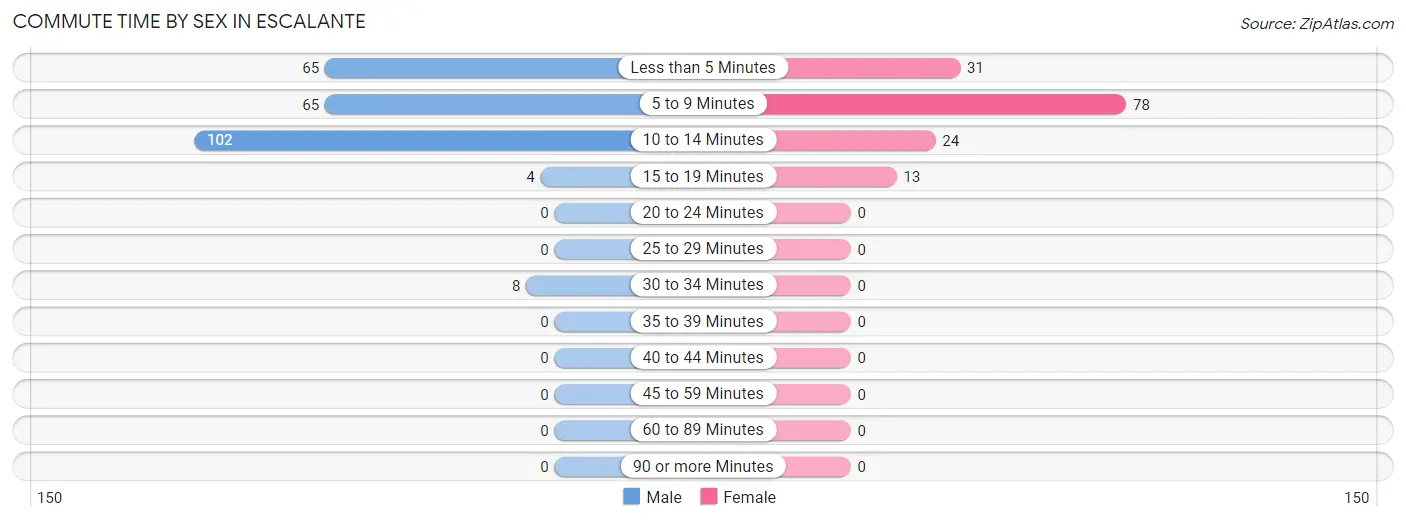
| Commute Time | Male | Female |
| Less than 5 Minutes | 65 (26.6%) | 31 (21.2%) |
| 5 to 9 Minutes | 65 (26.6%) | 78 (53.4%) |
| 10 to 14 Minutes | 102 (41.8%) | 24 (16.4%) |
| 15 to 19 Minutes | 4 (1.6%) | 13 (8.9%) |
| 20 to 24 Minutes | 0 (0.0%) | 0 (0.0%) |
| 25 to 29 Minutes | 0 (0.0%) | 0 (0.0%) |
| 30 to 34 Minutes | 8 (3.3%) | 0 (0.0%) |
| 35 to 39 Minutes | 0 (0.0%) | 0 (0.0%) |
| 40 to 44 Minutes | 0 (0.0%) | 0 (0.0%) |
| 45 to 59 Minutes | 0 (0.0%) | 0 (0.0%) |
| 60 to 89 Minutes | 0 (0.0%) | 0 (0.0%) |
| 90 or more Minutes | 0 (0.0%) | 0 (0.0%) |
Time of Departure to Work by Sex in Escalante
The most frequent times of departure to work in Escalante are 10:00 AM to 10:59 AM (53, 21.7%) for males and 8:30 AM to 8:59 AM (49, 33.6%) for females.
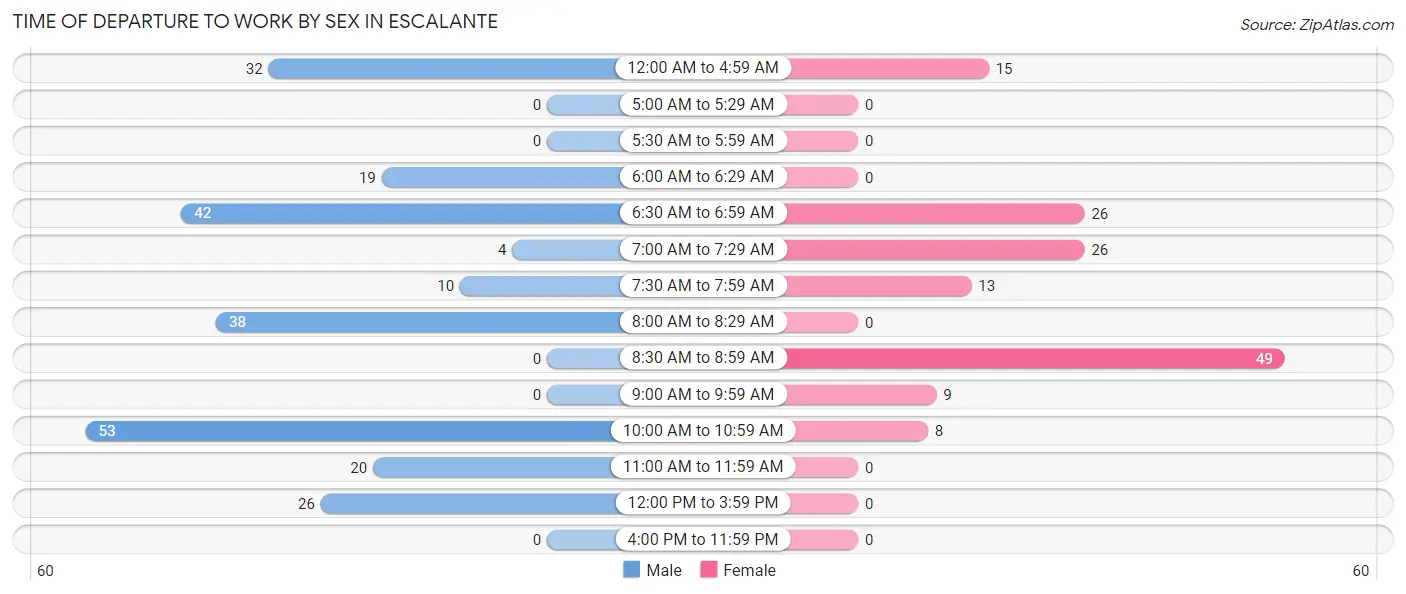
| Time of Departure | Male | Female |
| 12:00 AM to 4:59 AM | 32 (13.1%) | 15 (10.3%) |
| 5:00 AM to 5:29 AM | 0 (0.0%) | 0 (0.0%) |
| 5:30 AM to 5:59 AM | 0 (0.0%) | 0 (0.0%) |
| 6:00 AM to 6:29 AM | 19 (7.8%) | 0 (0.0%) |
| 6:30 AM to 6:59 AM | 42 (17.2%) | 26 (17.8%) |
| 7:00 AM to 7:29 AM | 4 (1.6%) | 26 (17.8%) |
| 7:30 AM to 7:59 AM | 10 (4.1%) | 13 (8.9%) |
| 8:00 AM to 8:29 AM | 38 (15.6%) | 0 (0.0%) |
| 8:30 AM to 8:59 AM | 0 (0.0%) | 49 (33.6%) |
| 9:00 AM to 9:59 AM | 0 (0.0%) | 9 (6.2%) |
| 10:00 AM to 10:59 AM | 53 (21.7%) | 8 (5.5%) |
| 11:00 AM to 11:59 AM | 20 (8.2%) | 0 (0.0%) |
| 12:00 PM to 3:59 PM | 26 (10.7%) | 0 (0.0%) |
| 4:00 PM to 11:59 PM | 0 (0.0%) | 0 (0.0%) |
| Total | 244 (100.0%) | 146 (100.0%) |
Housing Occupancy in Escalante
Occupancy by Ownership in Escalante
Of the total 395 dwellings in Escalante, owner-occupied units account for 224 (56.7%), while renter-occupied units make up 171 (43.3%).
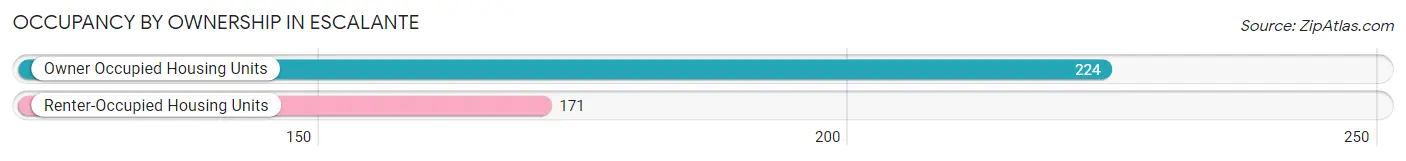
| Occupancy | # Housing Units | % Housing Units |
| Owner Occupied Housing Units | 224 | 56.7% |
| Renter-Occupied Housing Units | 171 | 43.3% |
| Total Occupied Housing Units | 395 | 100.0% |
Occupancy by Household Size in Escalante
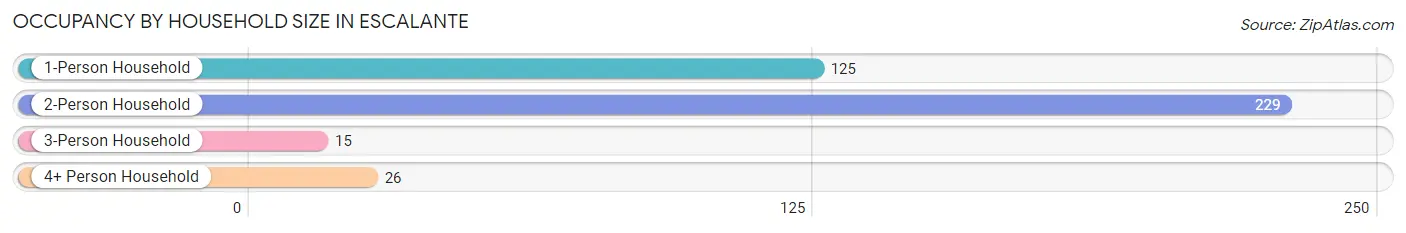
| Household Size | # Housing Units | % Housing Units |
| 1-Person Household | 125 | 31.7% |
| 2-Person Household | 229 | 58.0% |
| 3-Person Household | 15 | 3.8% |
| 4+ Person Household | 26 | 6.6% |
| Total Housing Units | 395 | 100.0% |
Occupancy by Ownership by Household Size in Escalante
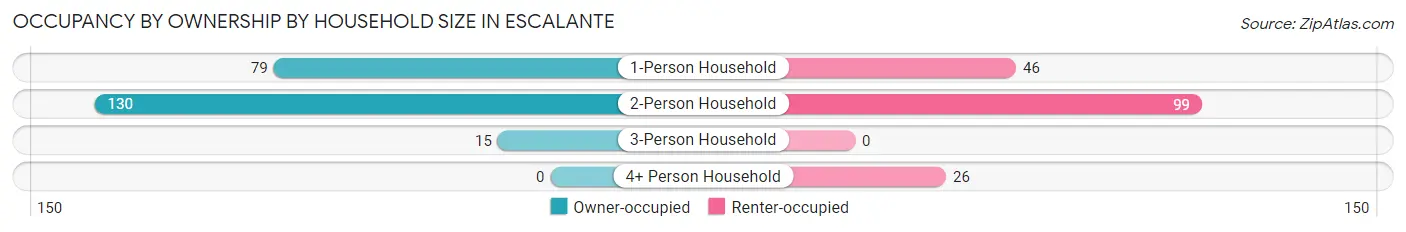
| Household Size | Owner-occupied | Renter-occupied |
| 1-Person Household | 79 (63.2%) | 46 (36.8%) |
| 2-Person Household | 130 (56.8%) | 99 (43.2%) |
| 3-Person Household | 15 (100.0%) | 0 (0.0%) |
| 4+ Person Household | 0 (0.0%) | 26 (100.0%) |
| Total Housing Units | 224 (56.7%) | 171 (43.3%) |
Occupancy by Educational Attainment in Escalante
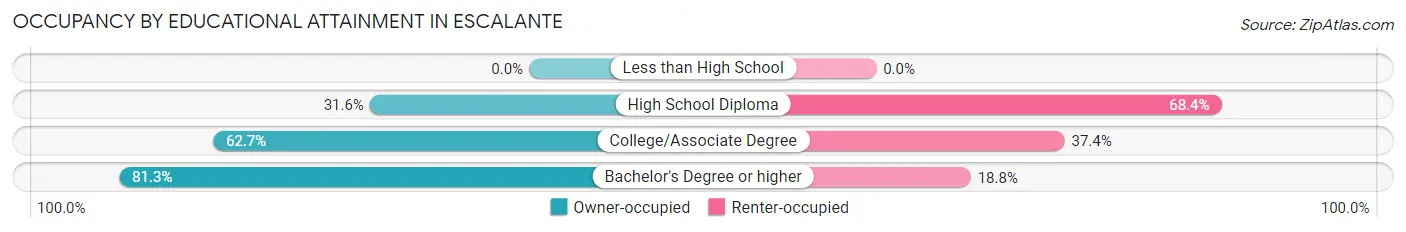
| Household Size | Owner-occupied | Renter-occupied |
| Less than High School | 0 (0.0%) | 0 (0.0%) |
| High School Diploma | 42 (31.6%) | 91 (68.4%) |
| College/Associate Degree | 104 (62.6%) | 62 (37.3%) |
| Bachelor's Degree or higher | 78 (81.2%) | 18 (18.8%) |
Occupancy by Age of Householder in Escalante
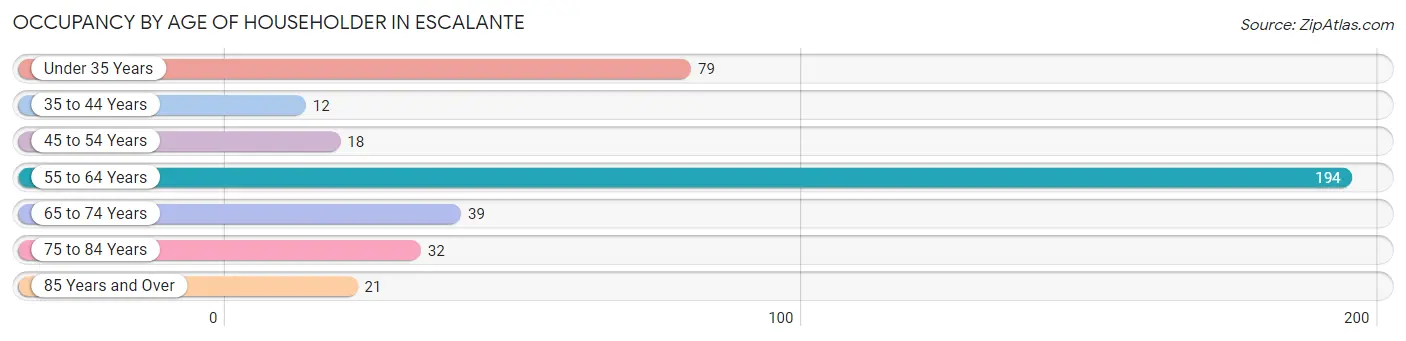
| Age Bracket | # Households | % Households |
| Under 35 Years | 79 | 20.0% |
| 35 to 44 Years | 12 | 3.0% |
| 45 to 54 Years | 18 | 4.6% |
| 55 to 64 Years | 194 | 49.1% |
| 65 to 74 Years | 39 | 9.9% |
| 75 to 84 Years | 32 | 8.1% |
| 85 Years and Over | 21 | 5.3% |
| Total | 395 | 100.0% |
Housing Finances in Escalante
Median Income by Occupancy in Escalante
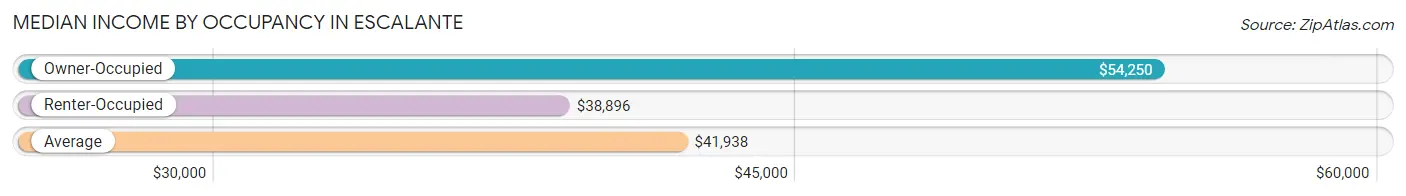
| Occupancy Type | # Households | Median Income |
| Owner-Occupied | 224 (56.7%) | $54,250 |
| Renter-Occupied | 171 (43.3%) | $38,896 |
| Average | 395 (100.0%) | $41,938 |
Occupancy by Householder Income Bracket in Escalante
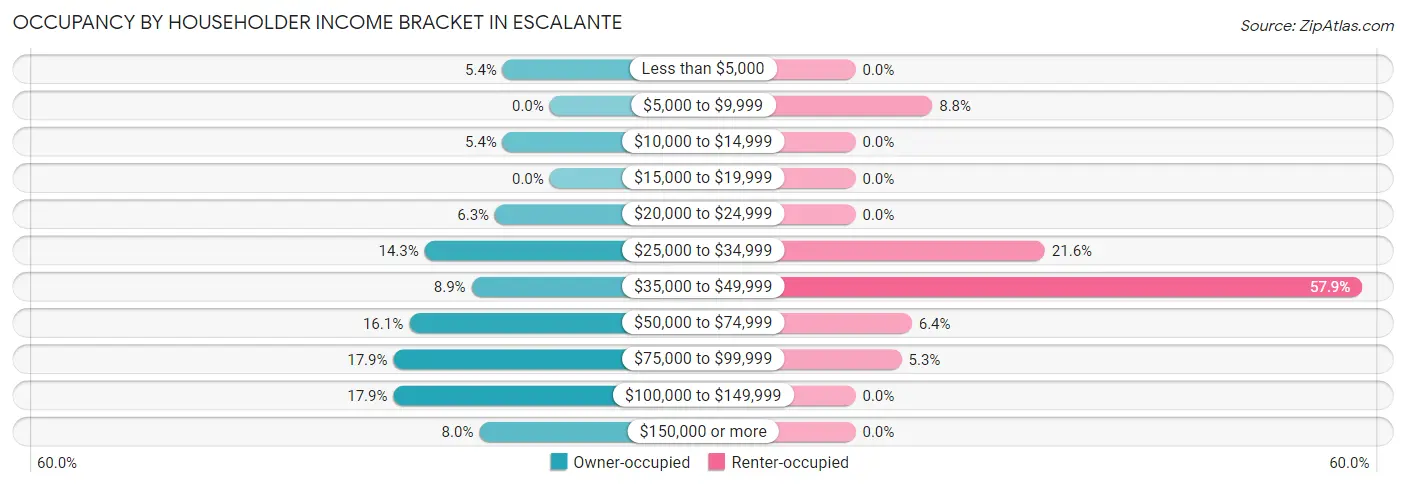
| Income Bracket | Owner-occupied | Renter-occupied |
| Less than $5,000 | 12 (5.4%) | 0 (0.0%) |
| $5,000 to $9,999 | 0 (0.0%) | 15 (8.8%) |
| $10,000 to $14,999 | 12 (5.4%) | 0 (0.0%) |
| $15,000 to $19,999 | 0 (0.0%) | 0 (0.0%) |
| $20,000 to $24,999 | 14 (6.2%) | 0 (0.0%) |
| $25,000 to $34,999 | 32 (14.3%) | 37 (21.6%) |
| $35,000 to $49,999 | 20 (8.9%) | 99 (57.9%) |
| $50,000 to $74,999 | 36 (16.1%) | 11 (6.4%) |
| $75,000 to $99,999 | 40 (17.9%) | 9 (5.3%) |
| $100,000 to $149,999 | 40 (17.9%) | 0 (0.0%) |
| $150,000 or more | 18 (8.0%) | 0 (0.0%) |
| Total | 224 (100.0%) | 171 (100.0%) |
Monthly Housing Cost Tiers in Escalante
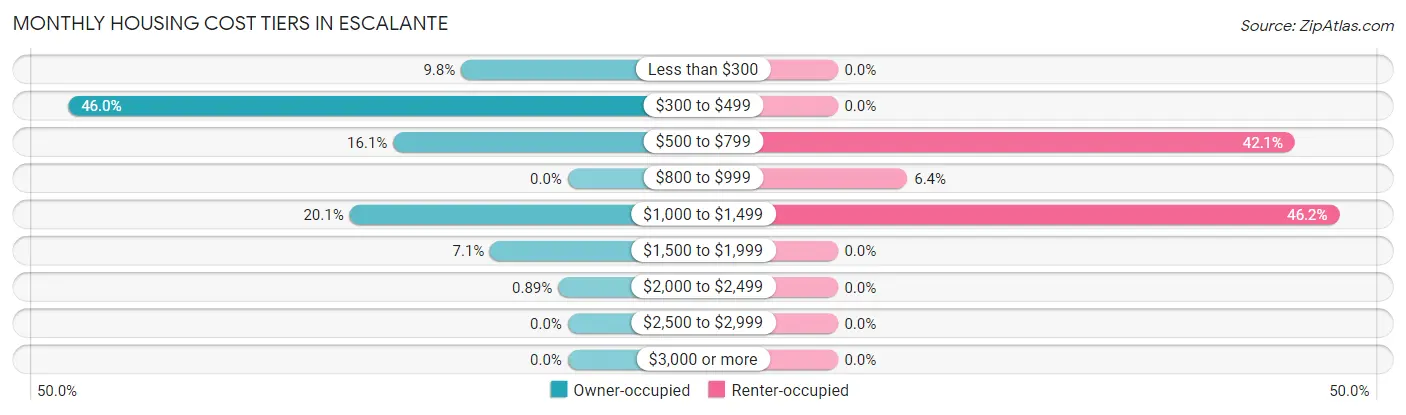
| Monthly Cost | Owner-occupied | Renter-occupied |
| Less than $300 | 22 (9.8%) | 0 (0.0%) |
| $300 to $499 | 103 (46.0%) | 0 (0.0%) |
| $500 to $799 | 36 (16.1%) | 72 (42.1%) |
| $800 to $999 | 0 (0.0%) | 11 (6.4%) |
| $1,000 to $1,499 | 45 (20.1%) | 79 (46.2%) |
| $1,500 to $1,999 | 16 (7.1%) | 0 (0.0%) |
| $2,000 to $2,499 | 2 (0.9%) | 0 (0.0%) |
| $2,500 to $2,999 | 0 (0.0%) | 0 (0.0%) |
| $3,000 or more | 0 (0.0%) | 0 (0.0%) |
| Total | 224 (100.0%) | 171 (100.0%) |
Physical Housing Characteristics in Escalante
Housing Structures in Escalante
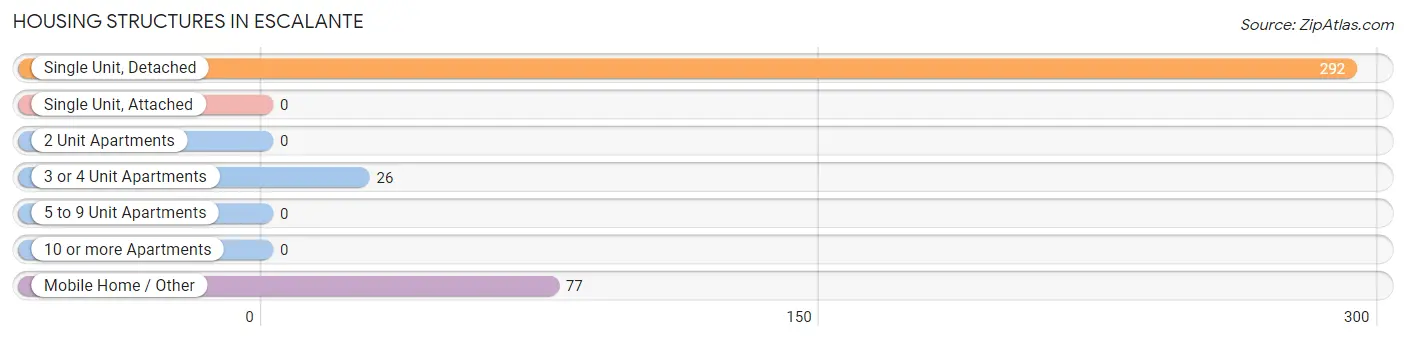
| Structure Type | # Housing Units | % Housing Units |
| Single Unit, Detached | 292 | 73.9% |
| Single Unit, Attached | 0 | 0.0% |
| 2 Unit Apartments | 0 | 0.0% |
| 3 or 4 Unit Apartments | 26 | 6.6% |
| 5 to 9 Unit Apartments | 0 | 0.0% |
| 10 or more Apartments | 0 | 0.0% |
| Mobile Home / Other | 77 | 19.5% |
| Total | 395 | 100.0% |
Housing Structures by Occupancy in Escalante
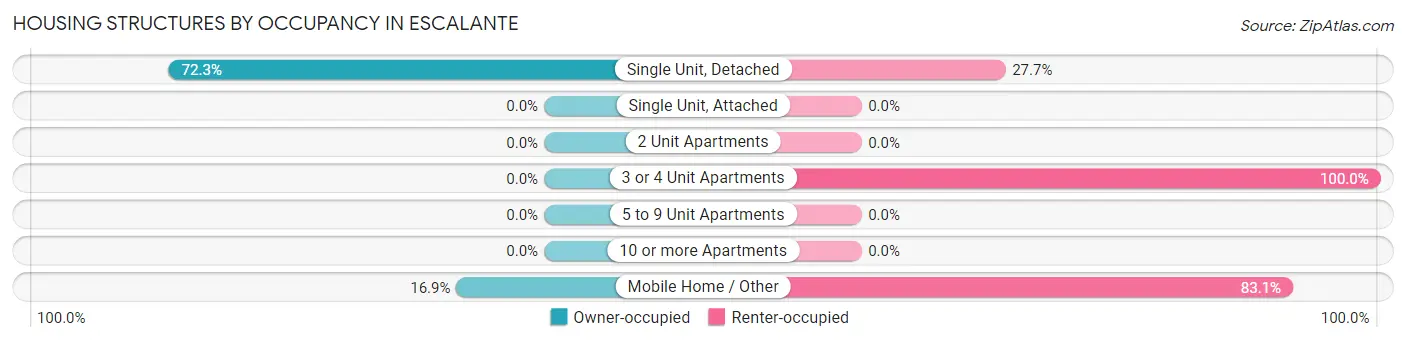
| Structure Type | Owner-occupied | Renter-occupied |
| Single Unit, Detached | 211 (72.3%) | 81 (27.7%) |
| Single Unit, Attached | 0 (0.0%) | 0 (0.0%) |
| 2 Unit Apartments | 0 (0.0%) | 0 (0.0%) |
| 3 or 4 Unit Apartments | 0 (0.0%) | 26 (100.0%) |
| 5 to 9 Unit Apartments | 0 (0.0%) | 0 (0.0%) |
| 10 or more Apartments | 0 (0.0%) | 0 (0.0%) |
| Mobile Home / Other | 13 (16.9%) | 64 (83.1%) |
| Total | 224 (56.7%) | 171 (43.3%) |
Housing Structures by Number of Rooms in Escalante
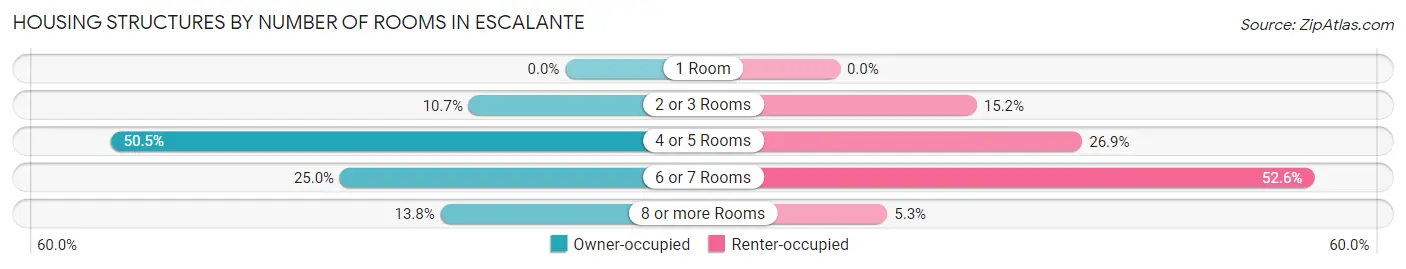
| Number of Rooms | Owner-occupied | Renter-occupied |
| 1 Room | 0 (0.0%) | 0 (0.0%) |
| 2 or 3 Rooms | 24 (10.7%) | 26 (15.2%) |
| 4 or 5 Rooms | 113 (50.4%) | 46 (26.9%) |
| 6 or 7 Rooms | 56 (25.0%) | 90 (52.6%) |
| 8 or more Rooms | 31 (13.8%) | 9 (5.3%) |
| Total | 224 (100.0%) | 171 (100.0%) |
Housing Structure by Heating Type in Escalante
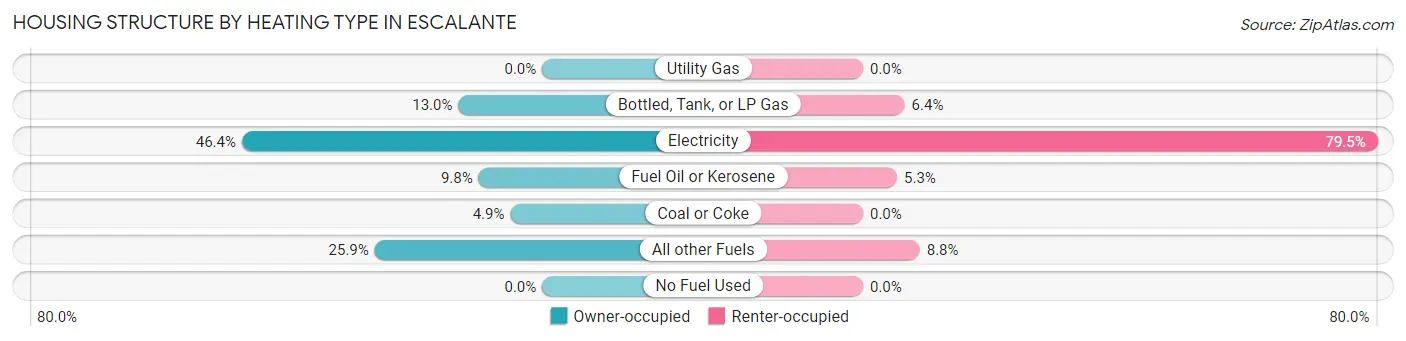
| Heating Type | Owner-occupied | Renter-occupied |
| Utility Gas | 0 (0.0%) | 0 (0.0%) |
| Bottled, Tank, or LP Gas | 29 (13.0%) | 11 (6.4%) |
| Electricity | 104 (46.4%) | 136 (79.5%) |
| Fuel Oil or Kerosene | 22 (9.8%) | 9 (5.3%) |
| Coal or Coke | 11 (4.9%) | 0 (0.0%) |
| All other Fuels | 58 (25.9%) | 15 (8.8%) |
| No Fuel Used | 0 (0.0%) | 0 (0.0%) |
| Total | 224 (100.0%) | 171 (100.0%) |
Household Vehicle Usage in Escalante
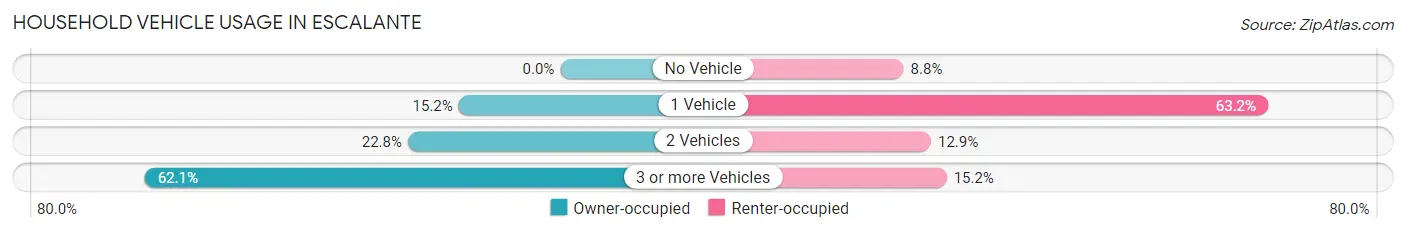
| Vehicles per Household | Owner-occupied | Renter-occupied |
| No Vehicle | 0 (0.0%) | 15 (8.8%) |
| 1 Vehicle | 34 (15.2%) | 108 (63.2%) |
| 2 Vehicles | 51 (22.8%) | 22 (12.9%) |
| 3 or more Vehicles | 139 (62.1%) | 26 (15.2%) |
| Total | 224 (100.0%) | 171 (100.0%) |
Real Estate & Mortgages in Escalante
Real Estate and Mortgage Overview in Escalante
| Characteristic | Without Mortgage | With Mortgage |
| Housing Units | 151 | 73 |
| Median Property Value | $235,500 | $292,200 |
| Median Household Income | $50,250 | $8 |
| Monthly Housing Costs | $336 | $0 |
| Real Estate Taxes | $818 | $0 |
Property Value by Mortgage Status in Escalante
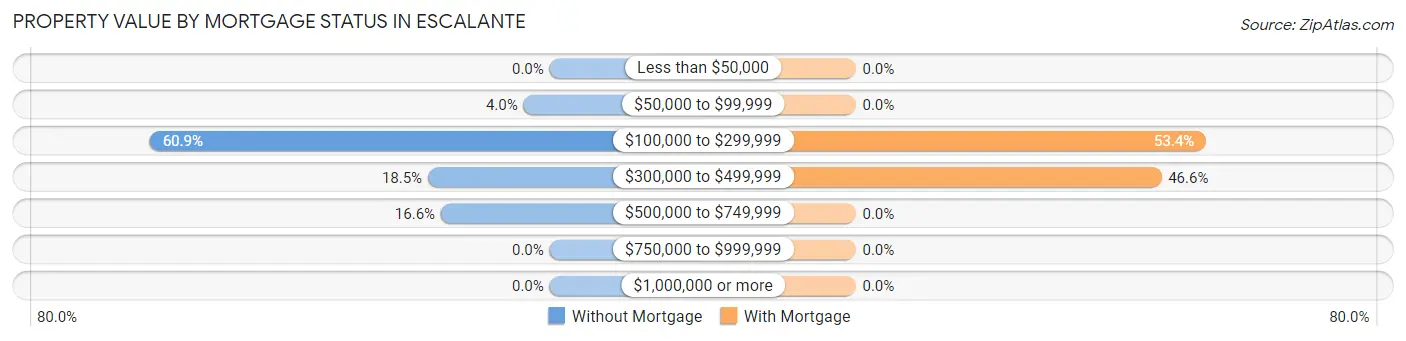
| Property Value | Without Mortgage | With Mortgage |
| Less than $50,000 | 0 (0.0%) | 0 (0.0%) |
| $50,000 to $99,999 | 6 (4.0%) | 0 (0.0%) |
| $100,000 to $299,999 | 92 (60.9%) | 39 (53.4%) |
| $300,000 to $499,999 | 28 (18.5%) | 34 (46.6%) |
| $500,000 to $749,999 | 25 (16.6%) | 0 (0.0%) |
| $750,000 to $999,999 | 0 (0.0%) | 0 (0.0%) |
| $1,000,000 or more | 0 (0.0%) | 0 (0.0%) |
| Total | 151 (100.0%) | 73 (100.0%) |
Household Income by Mortgage Status in Escalante
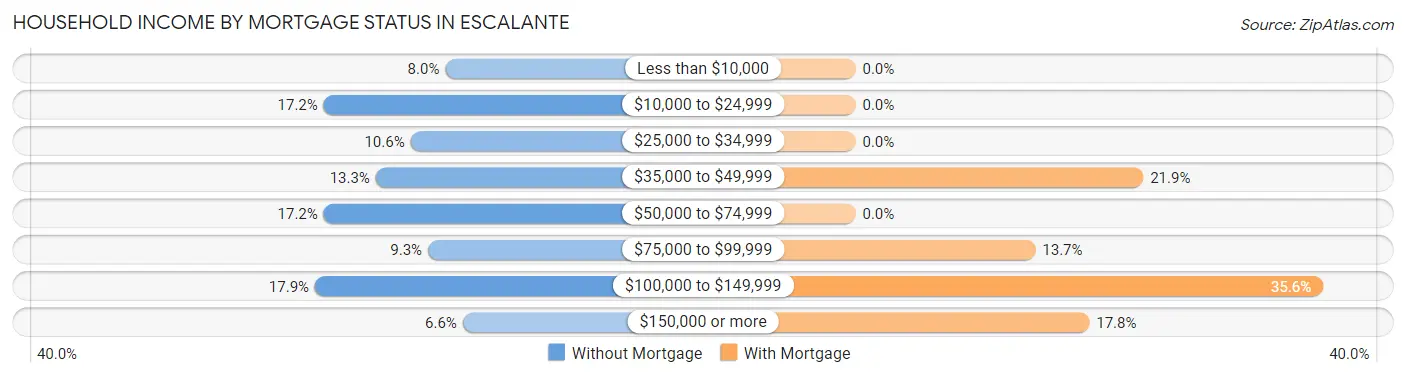
| Household Income | Without Mortgage | With Mortgage |
| Less than $10,000 | 12 (8.0%) | 0 (0.0%) |
| $10,000 to $24,999 | 26 (17.2%) | 0 (0.0%) |
| $25,000 to $34,999 | 16 (10.6%) | 0 (0.0%) |
| $35,000 to $49,999 | 20 (13.3%) | 16 (21.9%) |
| $50,000 to $74,999 | 26 (17.2%) | 0 (0.0%) |
| $75,000 to $99,999 | 14 (9.3%) | 10 (13.7%) |
| $100,000 to $149,999 | 27 (17.9%) | 26 (35.6%) |
| $150,000 or more | 10 (6.6%) | 13 (17.8%) |
| Total | 151 (100.0%) | 73 (100.0%) |
Property Value to Household Income Ratio in Escalante
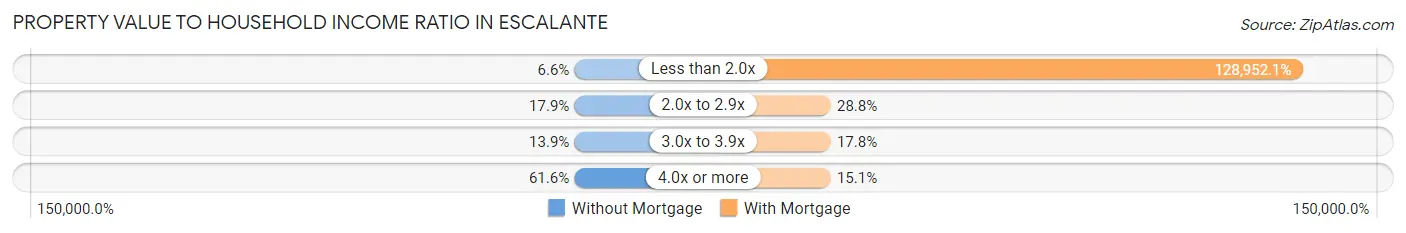
| Value-to-Income Ratio | Without Mortgage | With Mortgage |
| Less than 2.0x | 10 (6.6%) | 94,135 (128,952.1%) |
| 2.0x to 2.9x | 27 (17.9%) | 21 (28.8%) |
| 3.0x to 3.9x | 21 (13.9%) | 13 (17.8%) |
| 4.0x or more | 93 (61.6%) | 11 (15.1%) |
| Total | 151 (100.0%) | 73 (100.0%) |
Real Estate Taxes by Mortgage Status in Escalante
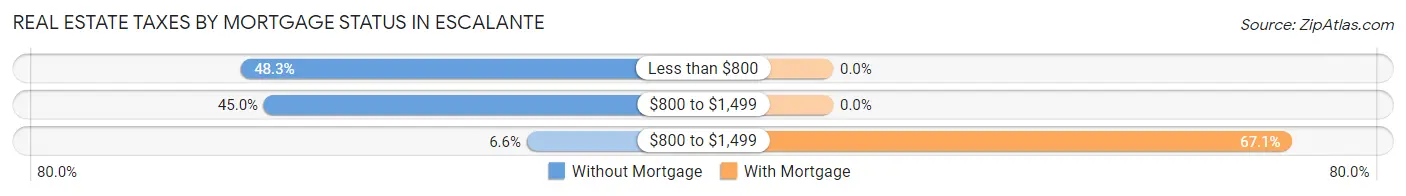
| Property Taxes | Without Mortgage | With Mortgage |
| Less than $800 | 73 (48.3%) | 0 (0.0%) |
| $800 to $1,499 | 68 (45.0%) | 0 (0.0%) |
| $800 to $1,499 | 10 (6.6%) | 49 (67.1%) |
| Total | 151 (100.0%) | 73 (100.0%) |
Health & Disability in Escalante
Health Insurance Coverage by Age in Escalante
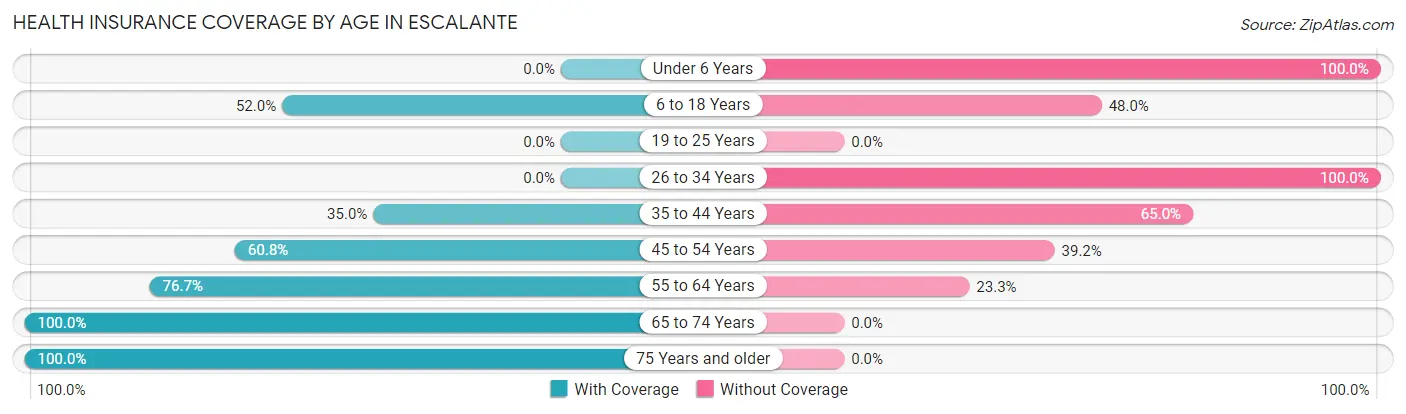
| Age Bracket | With Coverage | Without Coverage |
| Under 6 Years | 0 (0.0%) | 12 (100.0%) |
| 6 to 18 Years | 13 (52.0%) | 12 (48.0%) |
| 19 to 25 Years | 0 (0.0%) | 0 (0.0%) |
| 26 to 34 Years | 0 (0.0%) | 121 (100.0%) |
| 35 to 44 Years | 14 (35.0%) | 26 (65.0%) |
| 45 to 54 Years | 31 (60.8%) | 20 (39.2%) |
| 55 to 64 Years | 207 (76.7%) | 63 (23.3%) |
| 65 to 74 Years | 53 (100.0%) | 0 (0.0%) |
| 75 Years and older | 85 (100.0%) | 0 (0.0%) |
| Total | 403 (61.3%) | 254 (38.7%) |
Health Insurance Coverage by Citizenship Status in Escalante
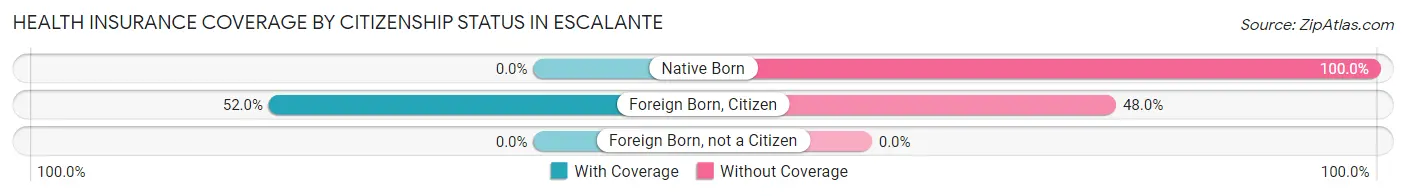
| Citizenship Status | With Coverage | Without Coverage |
| Native Born | 0 (0.0%) | 12 (100.0%) |
| Foreign Born, Citizen | 13 (52.0%) | 12 (48.0%) |
| Foreign Born, not a Citizen | 0 (0.0%) | 0 (0.0%) |
Health Insurance Coverage by Household Income in Escalante
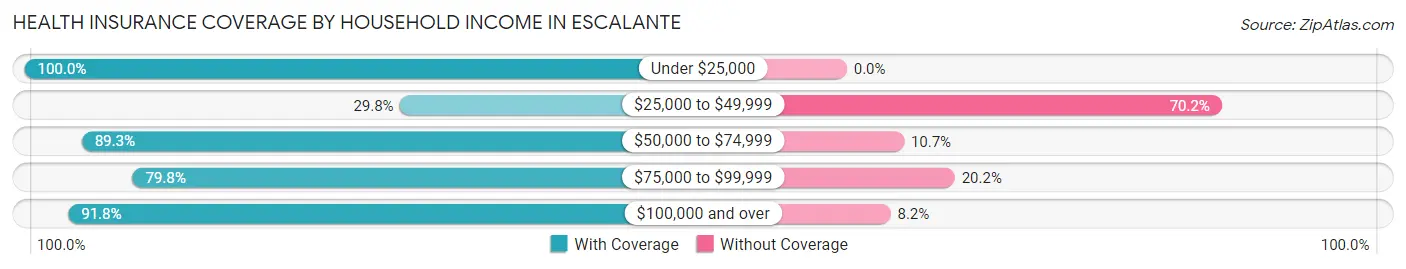
| Household Income | With Coverage | Without Coverage |
| Under $25,000 | 53 (100.0%) | 0 (0.0%) |
| $25,000 to $49,999 | 92 (29.8%) | 217 (70.2%) |
| $50,000 to $74,999 | 75 (89.3%) | 9 (10.7%) |
| $75,000 to $99,999 | 71 (79.8%) | 18 (20.2%) |
| $100,000 and over | 112 (91.8%) | 10 (8.2%) |
Public vs Private Health Insurance Coverage by Age in Escalante
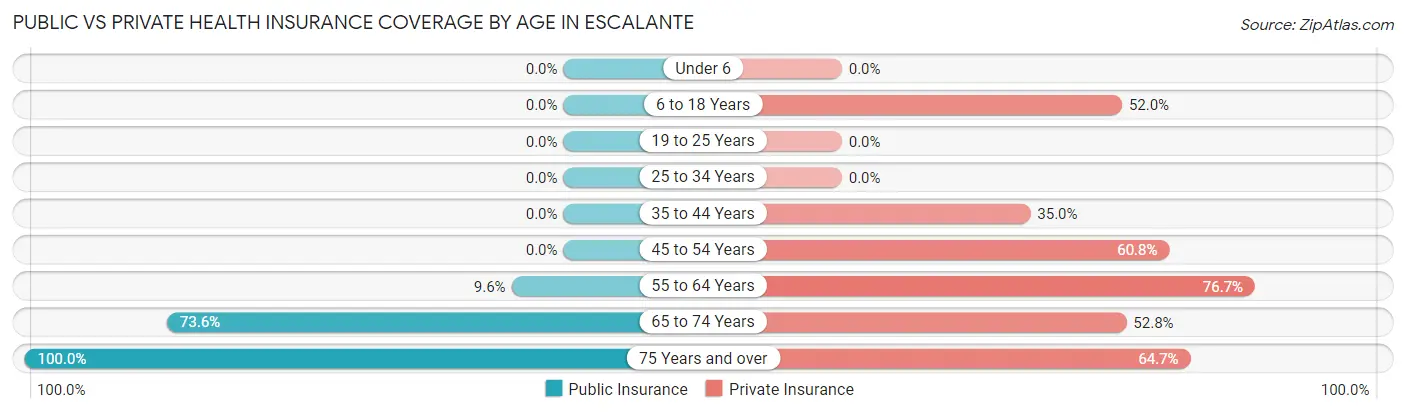
| Age Bracket | Public Insurance | Private Insurance |
| Under 6 | 0 (0.0%) | 0 (0.0%) |
| 6 to 18 Years | 0 (0.0%) | 13 (52.0%) |
| 19 to 25 Years | 0 (0.0%) | 0 (0.0%) |
| 25 to 34 Years | 0 (0.0%) | 0 (0.0%) |
| 35 to 44 Years | 0 (0.0%) | 14 (35.0%) |
| 45 to 54 Years | 0 (0.0%) | 31 (60.8%) |
| 55 to 64 Years | 26 (9.6%) | 207 (76.7%) |
| 65 to 74 Years | 39 (73.6%) | 28 (52.8%) |
| 75 Years and over | 85 (100.0%) | 55 (64.7%) |
| Total | 150 (22.8%) | 348 (53.0%) |
Disability Status by Sex by Age in Escalante
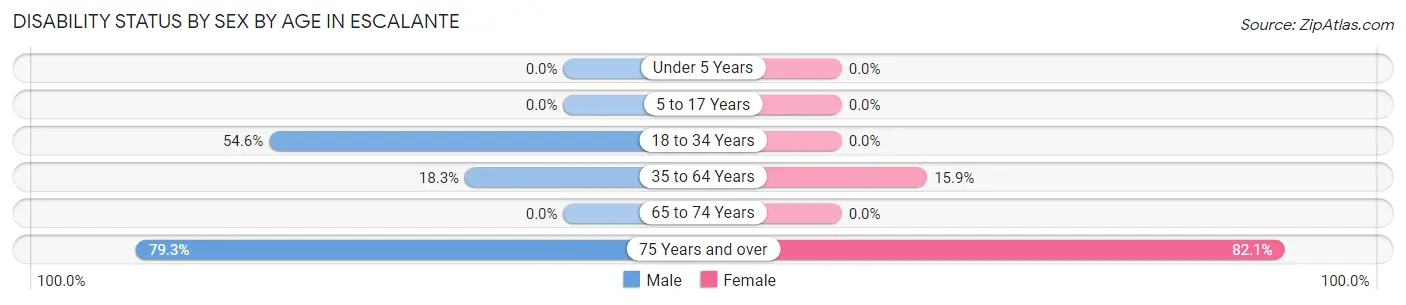
| Age Bracket | Male | Female |
| Under 5 Years | 0 (0.0%) | 0 (0.0%) |
| 5 to 17 Years | 0 (0.0%) | 0 (0.0%) |
| 18 to 34 Years | 53 (54.6%) | 0 (0.0%) |
| 35 to 64 Years | 36 (18.3%) | 26 (15.9%) |
| 65 to 74 Years | 0 (0.0%) | 0 (0.0%) |
| 75 Years and over | 23 (79.3%) | 46 (82.1%) |
Disability Class by Sex by Age in Escalante
Disability Class: Hearing Difficulty
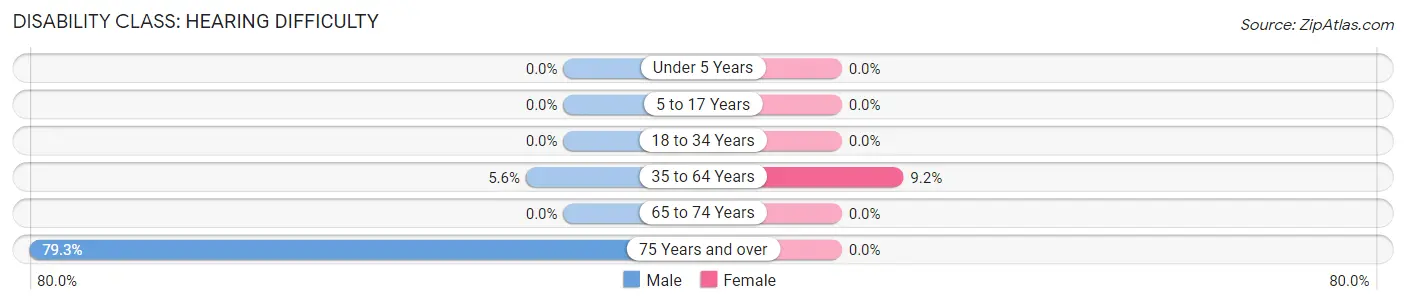
| Age Bracket | Male | Female |
| Under 5 Years | 0 (0.0%) | 0 (0.0%) |
| 5 to 17 Years | 0 (0.0%) | 0 (0.0%) |
| 18 to 34 Years | 0 (0.0%) | 0 (0.0%) |
| 35 to 64 Years | 11 (5.6%) | 15 (9.1%) |
| 65 to 74 Years | 0 (0.0%) | 0 (0.0%) |
| 75 Years and over | 23 (79.3%) | 0 (0.0%) |
Disability Class: Vision Difficulty
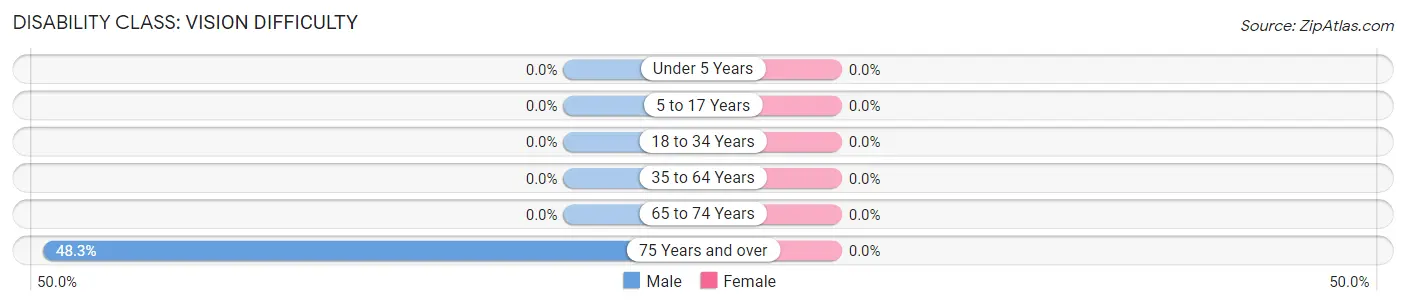
| Age Bracket | Male | Female |
| Under 5 Years | 0 (0.0%) | 0 (0.0%) |
| 5 to 17 Years | 0 (0.0%) | 0 (0.0%) |
| 18 to 34 Years | 0 (0.0%) | 0 (0.0%) |
| 35 to 64 Years | 0 (0.0%) | 0 (0.0%) |
| 65 to 74 Years | 0 (0.0%) | 0 (0.0%) |
| 75 Years and over | 14 (48.3%) | 0 (0.0%) |
Disability Class: Cognitive Difficulty
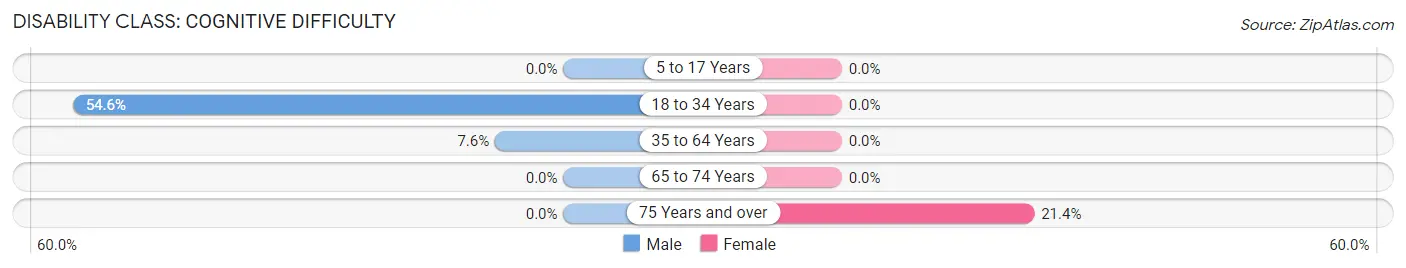
| Age Bracket | Male | Female |
| 5 to 17 Years | 0 (0.0%) | 0 (0.0%) |
| 18 to 34 Years | 53 (54.6%) | 0 (0.0%) |
| 35 to 64 Years | 15 (7.6%) | 0 (0.0%) |
| 65 to 74 Years | 0 (0.0%) | 0 (0.0%) |
| 75 Years and over | 0 (0.0%) | 12 (21.4%) |
Disability Class: Ambulatory Difficulty
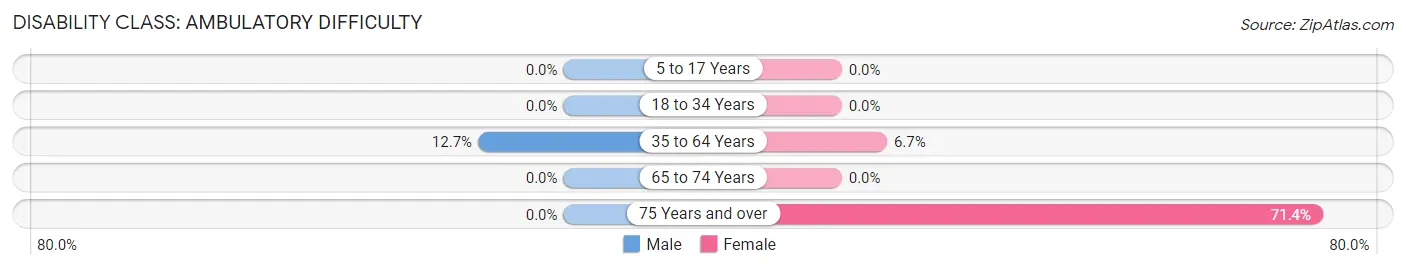
| Age Bracket | Male | Female |
| 5 to 17 Years | 0 (0.0%) | 0 (0.0%) |
| 18 to 34 Years | 0 (0.0%) | 0 (0.0%) |
| 35 to 64 Years | 25 (12.7%) | 11 (6.7%) |
| 65 to 74 Years | 0 (0.0%) | 0 (0.0%) |
| 75 Years and over | 0 (0.0%) | 40 (71.4%) |
Disability Class: Self-Care Difficulty
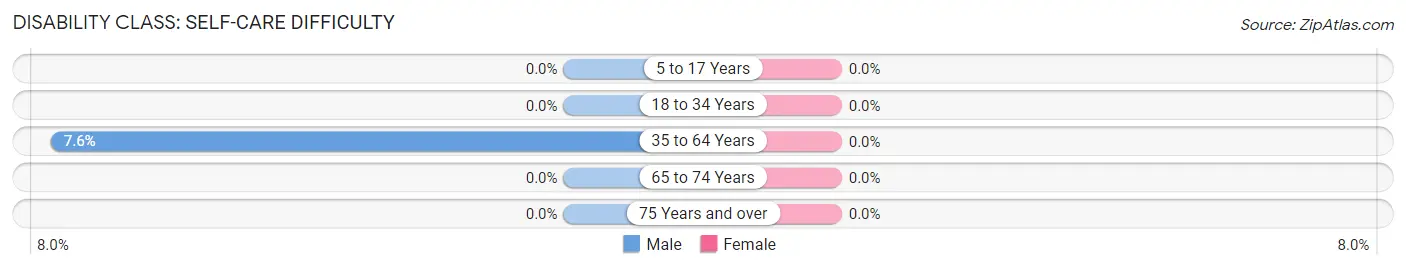
| Age Bracket | Male | Female |
| 5 to 17 Years | 0 (0.0%) | 0 (0.0%) |
| 18 to 34 Years | 0 (0.0%) | 0 (0.0%) |
| 35 to 64 Years | 15 (7.6%) | 0 (0.0%) |
| 65 to 74 Years | 0 (0.0%) | 0 (0.0%) |
| 75 Years and over | 0 (0.0%) | 0 (0.0%) |
Technology Access in Escalante
Computing Device Access in Escalante
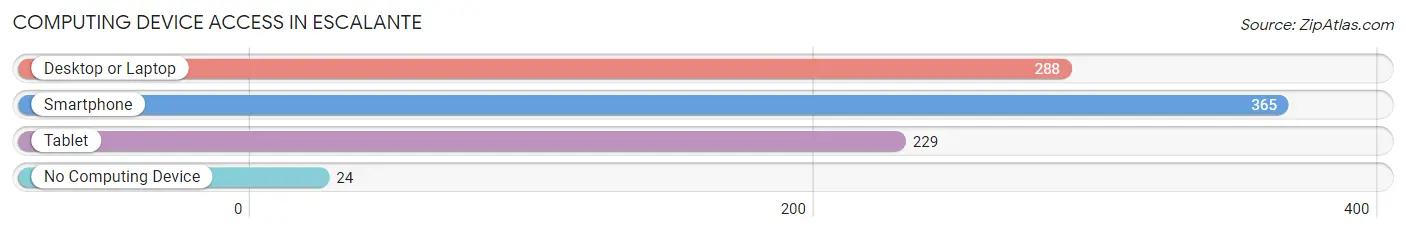
| Device Type | # Households | % Households |
| Desktop or Laptop | 288 | 72.9% |
| Smartphone | 365 | 92.4% |
| Tablet | 229 | 58.0% |
| No Computing Device | 24 | 6.1% |
| Total | 395 | 100.0% |
Internet Access in Escalante
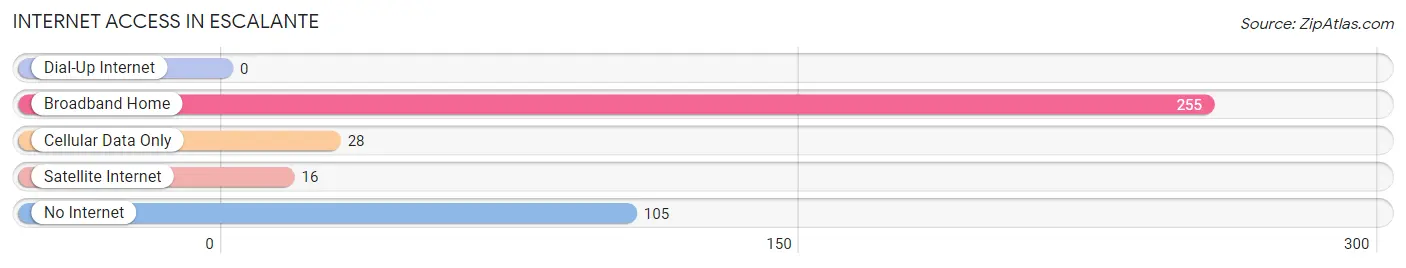
| Internet Type | # Households | % Households |
| Dial-Up Internet | 0 | 0.0% |
| Broadband Home | 255 | 64.6% |
| Cellular Data Only | 28 | 7.1% |
| Satellite Internet | 16 | 4.1% |
| No Internet | 105 | 26.6% |
| Total | 395 | 100.0% |
Escalante Summary
Escalante, Utah is a small town located in Garfield County in the south-central part of the state. It is situated in the heart of the Grand Staircase-Escalante National Monument, a protected area of 1.9 million acres of public land. The town is surrounded by stunning red rock canyons, sandstone cliffs, and other natural wonders. Escalante is a popular destination for outdoor enthusiasts, offering a variety of activities such as hiking, camping, fishing, and horseback riding.
History
Escalante was founded in 1876 by Mormon settlers who were sent to the area by Brigham Young. The town was named after Silvestre Vélez de Escalante, a Spanish Franciscan missionary who explored the area in 1776. The settlers built a fort and established a trading post, which served as a hub for the surrounding area.
In the early 1900s, Escalante became a popular tourist destination due to its proximity to Bryce Canyon National Park. The town was also home to a number of businesses, including a hotel, a general store, and a sawmill.
In the late 1960s, the town was threatened by the proposed construction of a dam on the nearby Escalante River. The dam would have flooded much of the town, but the project was eventually abandoned due to public outcry.
In 1996, the Grand Staircase-Escalante National Monument was established, protecting the area from development and preserving its natural beauty.
Geography
Escalante is located in south-central Utah, about 150 miles south of Salt Lake City. It is situated in the heart of the Grand Staircase-Escalante National Monument, a protected area of 1.9 million acres of public land. The town is surrounded by stunning red rock canyons, sandstone cliffs, and other natural wonders.
The town is located at an elevation of 5,800 feet, and the surrounding area is mostly desert. The climate is semi-arid, with hot summers and cold winters. The average annual precipitation is 8.5 inches.
Economy
The economy of Escalante is largely based on tourism. The town is a popular destination for outdoor enthusiasts, offering a variety of activities such as hiking, camping, fishing, and horseback riding. The town is also home to a number of businesses, including restaurants, hotels, and shops.
The town is also home to a number of federal and state government agencies, including the Bureau of Land Management, the National Park Service, and the Utah Division of Wildlife Resources.
Demographics
As of the 2010 census, Escalante had a population of 876. The racial makeup of the town was 94.2% White, 0.2% African American, 0.7% Native American, 0.2% Asian, 0.1% Pacific Islander, 2.3% from other races, and 2.4% from two or more races. Hispanic or Latino of any race were 5.2% of the population.
The median household income in Escalante was $37,500, and the median family income was $41,250. The per capita income was $17,845. About 11.2% of families and 14.2% of the population were below the poverty line, including 17.2% of those under age 18 and 8.3% of those age 65 or over.
Common Questions
What is Per Capita Income in Escalante?
Per Capita income in Escalante is $32,818.
What is the Median Family Income in Escalante?
Median Family Income in Escalante is $84,297.
What is the Median Household income in Escalante?
Median Household Income in Escalante is $41,938.
What is Income or Wage Gap in Escalante?
Income or Wage Gap in Escalante is 6.4%.
Women in Escalante earn 93.6 cents for every dollar earned by a man.
What is Inequality or Gini Index in Escalante?
Inequality or Gini Index in Escalante is 0.40.
What is the Total Population of Escalante?
Total Population of Escalante is 657.
What is the Total Male Population of Escalante?
Total Male Population of Escalante is 373.
What is the Total Female Population of Escalante?
Total Female Population of Escalante is 284.
What is the Ratio of Males per 100 Females in Escalante?
There are 131.34 Males per 100 Females in Escalante.
What is the Ratio of Females per 100 Males in Escalante?
There are 76.14 Females per 100 Males in Escalante.
What is the Median Population Age in Escalante?
Median Population Age in Escalante is 57.9 Years.
What is the Average Family Size in Escalante
Average Family Size in Escalante is 2.0 People.
What is the Average Household Size in Escalante
Average Household Size in Escalante is 1.7 People.
How Large is the Labor Force in Escalante?
There are 413 People in the Labor Forcein in Escalante.
What is the Percentage of People in the Labor Force in Escalante?
66.4% of People are in the Labor Force in Escalante.