Lindon, UT Map & Demographics
Lindon Map
Lindon Overview
$35,855
PER CAPITA INCOME
$114,741
AVG FAMILY INCOME
$101,188
AVG HOUSEHOLD INCOME
51.0%
WAGE / INCOME GAP [ % ]
49.0¢/ $1
WAGE / INCOME GAP [ $ ]
0.41
INEQUALITY / GINI INDEX
11,478
TOTAL POPULATION
6,168
MALE POPULATION
5,310
FEMALE POPULATION
116.16
MALES / 100 FEMALES
86.09
FEMALES / 100 MALES
30.1
MEDIAN AGE
3.9
AVG FAMILY SIZE
3.6
AVG HOUSEHOLD SIZE
5,480
LABOR FORCE [ PEOPLE ]
66.3%
PERCENT IN LABOR FORCE
3.7%
UNEMPLOYMENT RATE
Lindon Zip Codes
Income in Lindon
Income Overview in Lindon
Per Capita Income in Lindon is $35,855, while median incomes of families and households are $114,741 and $101,188 respectively.
| Characteristic | Number | Measure |
| Per Capita Income | 11,478 | $35,855 |
| Median Family Income | 2,739 | $114,741 |
| Mean Family Income | 2,739 | $139,403 |
| Median Household Income | 3,125 | $101,188 |
| Mean Household Income | 3,125 | $128,970 |
| Income Deficit | 2,739 | $0 |
| Wage / Income Gap (%) | 11,478 | 50.96% |
| Wage / Income Gap ($) | 11,478 | 49.04¢ per $1 |
| Gini / Inequality Index | 11,478 | 0.41 |
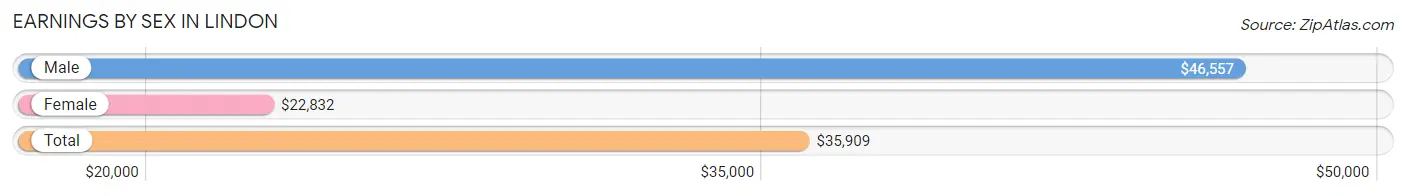
Earnings by Sex in Lindon
Average Earnings in Lindon are $35,909, $46,557 for men and $22,832 for women, a difference of 51.0%.
| Sex | Number | Average Earnings |
| Male | 3,490 (60.1%) | $46,557 |
| Female | 2,320 (39.9%) | $22,832 |
| Total | 5,810 (100.0%) | $35,909 |
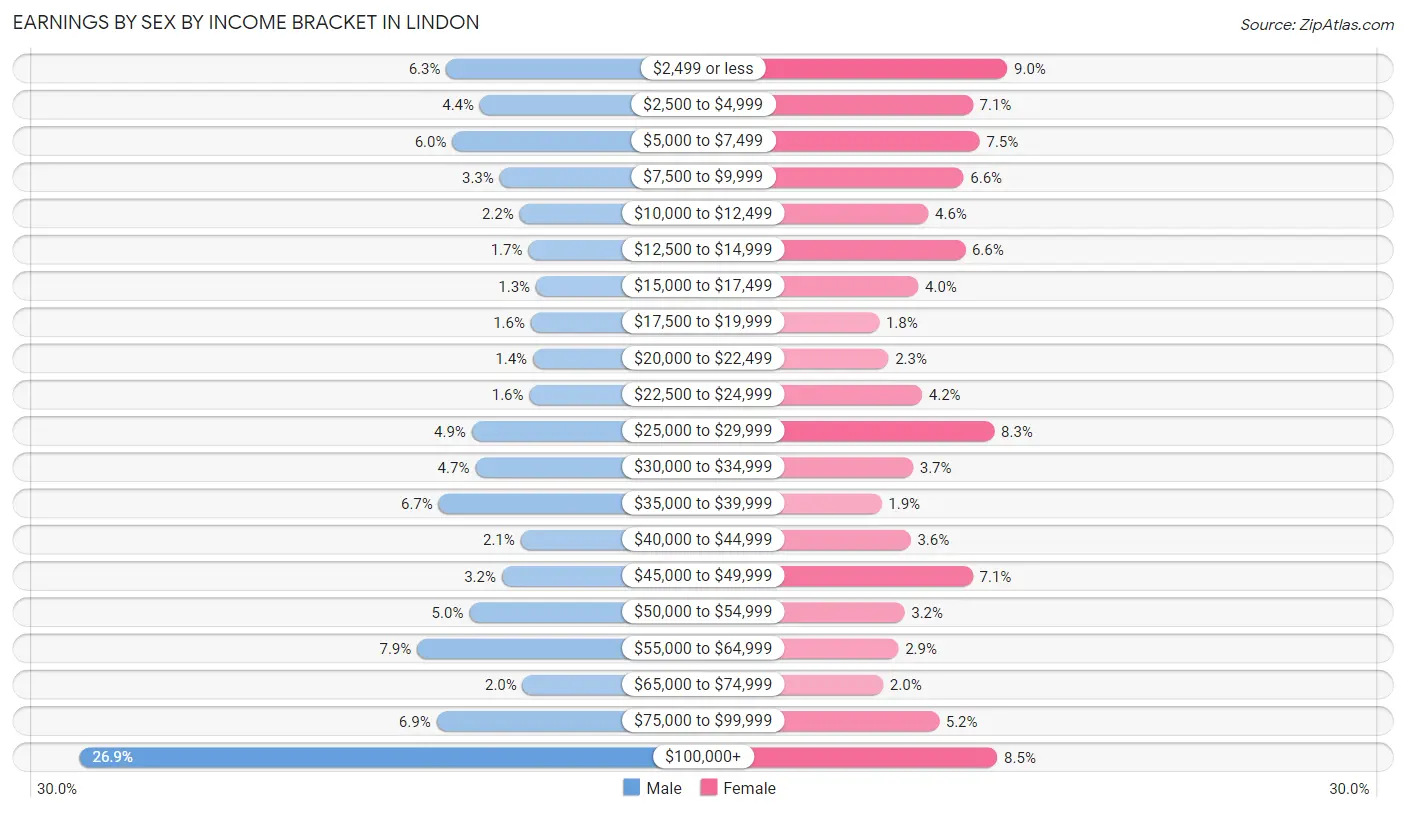
Earnings by Sex by Income Bracket in Lindon
The most common earnings brackets in Lindon are $100,000+ for men (939 | 26.9%) and $2,499 or less for women (209 | 9.0%).
| Income | Male | Female |
| $2,499 or less | 220 (6.3%) | 209 (9.0%) |
| $2,500 to $4,999 | 154 (4.4%) | 164 (7.1%) |
| $5,000 to $7,499 | 208 (6.0%) | 173 (7.5%) |
| $7,500 to $9,999 | 115 (3.3%) | 152 (6.6%) |
| $10,000 to $12,499 | 76 (2.2%) | 106 (4.6%) |
| $12,500 to $14,999 | 59 (1.7%) | 154 (6.6%) |
| $15,000 to $17,499 | 44 (1.3%) | 93 (4.0%) |
| $17,500 to $19,999 | 54 (1.5%) | 42 (1.8%) |
| $20,000 to $22,499 | 50 (1.4%) | 54 (2.3%) |
| $22,500 to $24,999 | 57 (1.6%) | 98 (4.2%) |
| $25,000 to $29,999 | 170 (4.9%) | 192 (8.3%) |
| $30,000 to $34,999 | 163 (4.7%) | 86 (3.7%) |
| $35,000 to $39,999 | 235 (6.7%) | 45 (1.9%) |
| $40,000 to $44,999 | 74 (2.1%) | 83 (3.6%) |
| $45,000 to $49,999 | 111 (3.2%) | 164 (7.1%) |
| $50,000 to $54,999 | 175 (5.0%) | 75 (3.2%) |
| $55,000 to $64,999 | 277 (7.9%) | 67 (2.9%) |
| $65,000 to $74,999 | 70 (2.0%) | 47 (2.0%) |
| $75,000 to $99,999 | 239 (6.9%) | 120 (5.2%) |
| $100,000+ | 939 (26.9%) | 196 (8.5%) |
| Total | 3,490 (100.0%) | 2,320 (100.0%) |
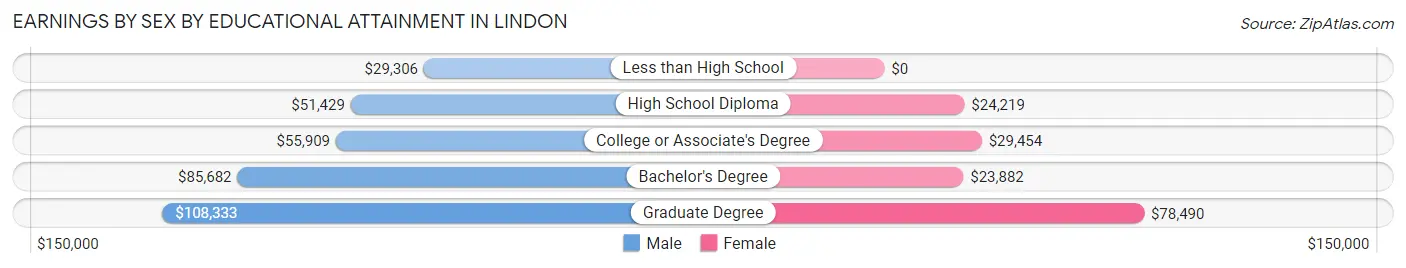
Earnings by Sex by Educational Attainment in Lindon
Average earnings in Lindon are $66,932 for men and $29,161 for women, a difference of 56.4%. Men with an educational attainment of graduate degree enjoy the highest average annual earnings of $108,333, while those with less than high school education earn the least with $29,306. Women with an educational attainment of graduate degree earn the most with the average annual earnings of $78,490, while those with bachelor's degree education have the smallest earnings of $23,882.
| Educational Attainment | Male Income | Female Income |
| Less than High School | $29,306 | $0 |
| High School Diploma | $51,429 | $24,219 |
| College or Associate's Degree | $55,909 | $29,454 |
| Bachelor's Degree | $85,682 | $23,882 |
| Graduate Degree | $108,333 | $78,490 |
| Total | $66,932 | $29,161 |
Family Income in Lindon
Family Income Brackets in Lindon
According to the Lindon family income data, there are 564 families falling into the $50,000 to $74,999 income range, which is the most common income bracket and makes up 20.6% of all families. Conversely, the $10,000 to $14,999 income bracket is the least frequent group with only 11 families (0.4%) belonging to this category.
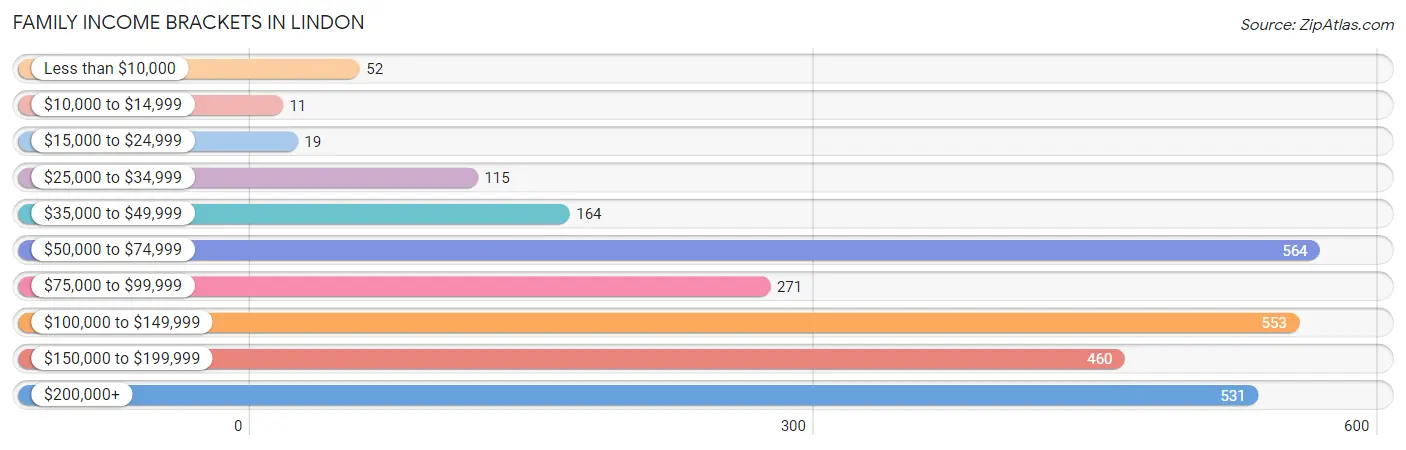
| Income Bracket | # Families | % Families |
| Less than $10,000 | 52 | 1.9% |
| $10,000 to $14,999 | 11 | 0.4% |
| $15,000 to $24,999 | 19 | 0.7% |
| $25,000 to $34,999 | 115 | 4.2% |
| $35,000 to $49,999 | 164 | 6.0% |
| $50,000 to $74,999 | 564 | 20.6% |
| $75,000 to $99,999 | 271 | 9.9% |
| $100,000 to $149,999 | 553 | 20.2% |
| $150,000 to $199,999 | 460 | 16.8% |
| $200,000+ | 531 | 19.4% |
Family Income by Famaliy Size in Lindon
7+ person families (274 | 10.0%) account for the highest median family income in Lindon with $172,125 per family, while 3-person families (486 | 17.7%) have the highest median income of $45,867 per family member.
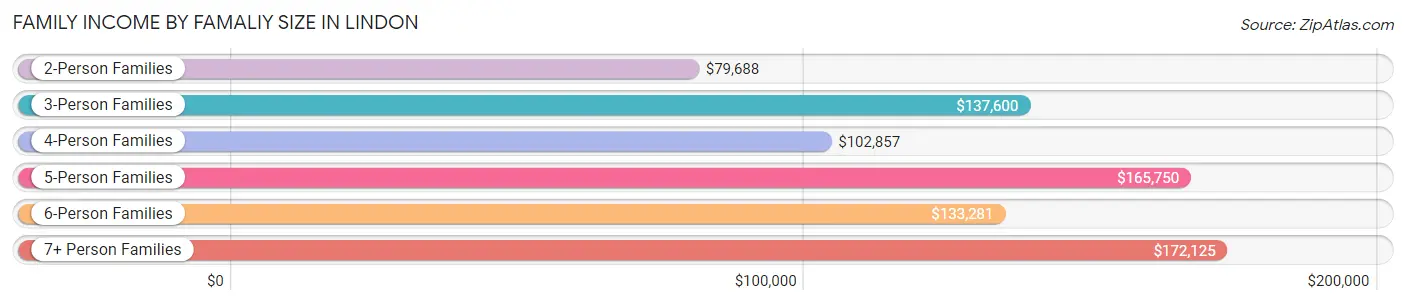
| Income Bracket | # Families | Median Income |
| 2-Person Families | 952 (34.8%) | $79,688 |
| 3-Person Families | 486 (17.7%) | $137,600 |
| 4-Person Families | 482 (17.6%) | $102,857 |
| 5-Person Families | 320 (11.7%) | $165,750 |
| 6-Person Families | 225 (8.2%) | $133,281 |
| 7+ Person Families | 274 (10.0%) | $172,125 |
| Total | 2,739 (100.0%) | $114,741 |
Family Income by Number of Earners in Lindon
The median family income in Lindon is $114,741, with families comprising 3+ earners (671) having the highest median family income of $166,583, while families with no earners (255) have the lowest median family income of $53,819, accounting for 24.5% and 9.3% of families, respectively.
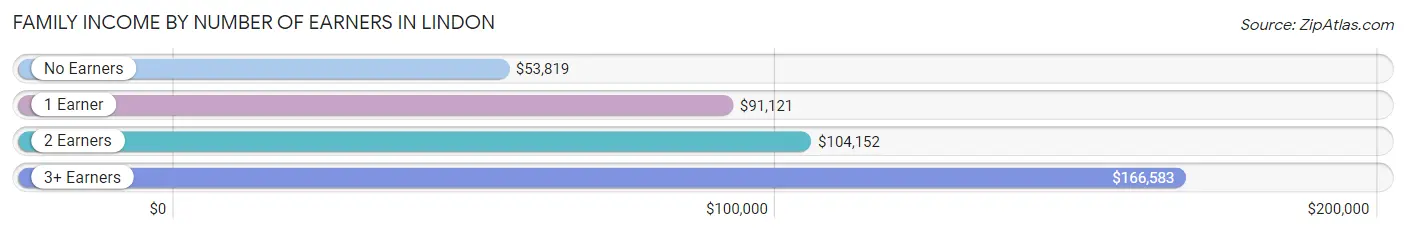
| Number of Earners | # Families | Median Income |
| No Earners | 255 (9.3%) | $53,819 |
| 1 Earner | 768 (28.0%) | $91,121 |
| 2 Earners | 1,045 (38.2%) | $104,152 |
| 3+ Earners | 671 (24.5%) | $166,583 |
| Total | 2,739 (100.0%) | $114,741 |
Household Income in Lindon
Household Income Brackets in Lindon
With 609 households falling in the category, the $50,000 to $74,999 income range is the most frequent in Lindon, accounting for 19.5% of all households. In contrast, only 28 households (0.9%) fall into the $10,000 to $14,999 income bracket, making it the least populous group.
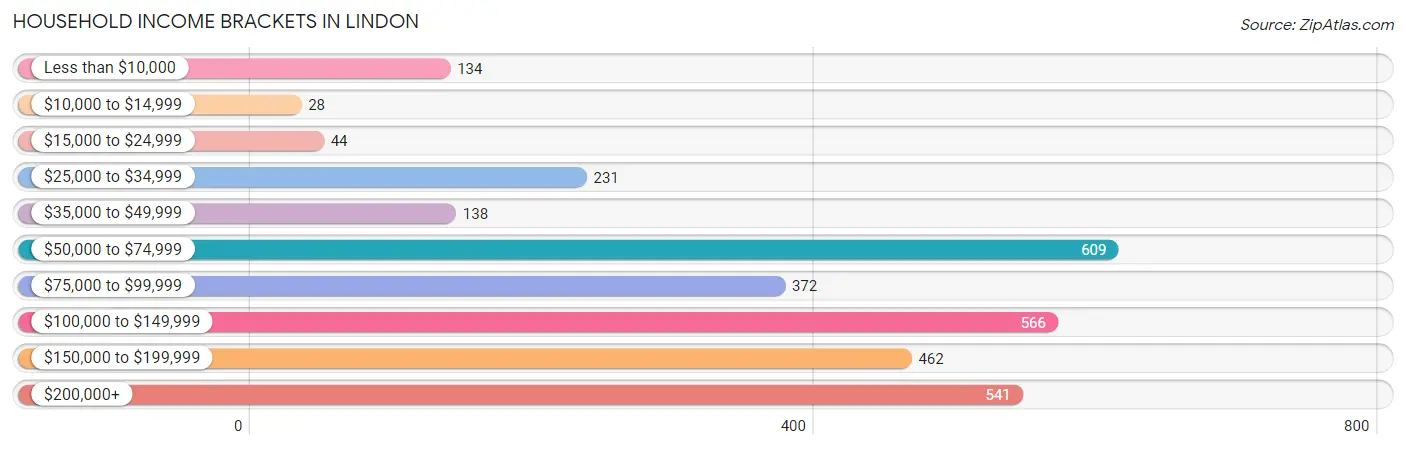
| Income Bracket | # Households | % Households |
| Less than $10,000 | 134 | 4.3% |
| $10,000 to $14,999 | 28 | 0.9% |
| $15,000 to $24,999 | 44 | 1.4% |
| $25,000 to $34,999 | 231 | 7.4% |
| $35,000 to $49,999 | 138 | 4.4% |
| $50,000 to $74,999 | 609 | 19.5% |
| $75,000 to $99,999 | 372 | 11.9% |
| $100,000 to $149,999 | 566 | 18.1% |
| $150,000 to $199,999 | 462 | 14.8% |
| $200,000+ | 541 | 17.3% |
Household Income by Householder Age in Lindon
The median household income in Lindon is $101,188, with the highest median household income of $135,893 found in the 45 to 64 years age bracket for the primary householder. A total of 1,392 households (44.5%) fall into this category. Meanwhile, the 15 to 24 years age bracket for the primary householder has the lowest median household income of $51,833, with 122 households (3.9%) in this group.
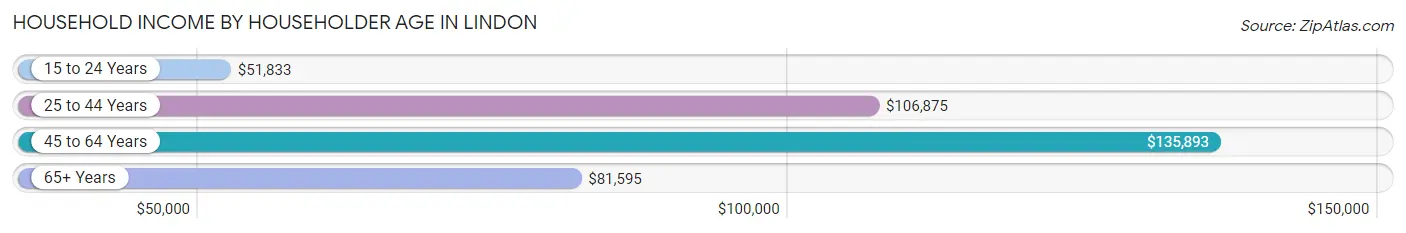
| Income Bracket | # Households | Median Income |
| 15 to 24 Years | 122 (3.9%) | $51,833 |
| 25 to 44 Years | 770 (24.6%) | $106,875 |
| 45 to 64 Years | 1,392 (44.5%) | $135,893 |
| 65+ Years | 841 (26.9%) | $81,595 |
| Total | 3,125 (100.0%) | $101,188 |
Poverty in Lindon
Income Below Poverty by Sex and Age in Lindon
With 5.7% poverty level for males and 5.6% for females among the residents of Lindon, 16 and 17 year old males and 18 to 24 year old females are the most vulnerable to poverty, with 45 males (12.5%) and 53 females (11.2%) in their respective age groups living below the poverty level.
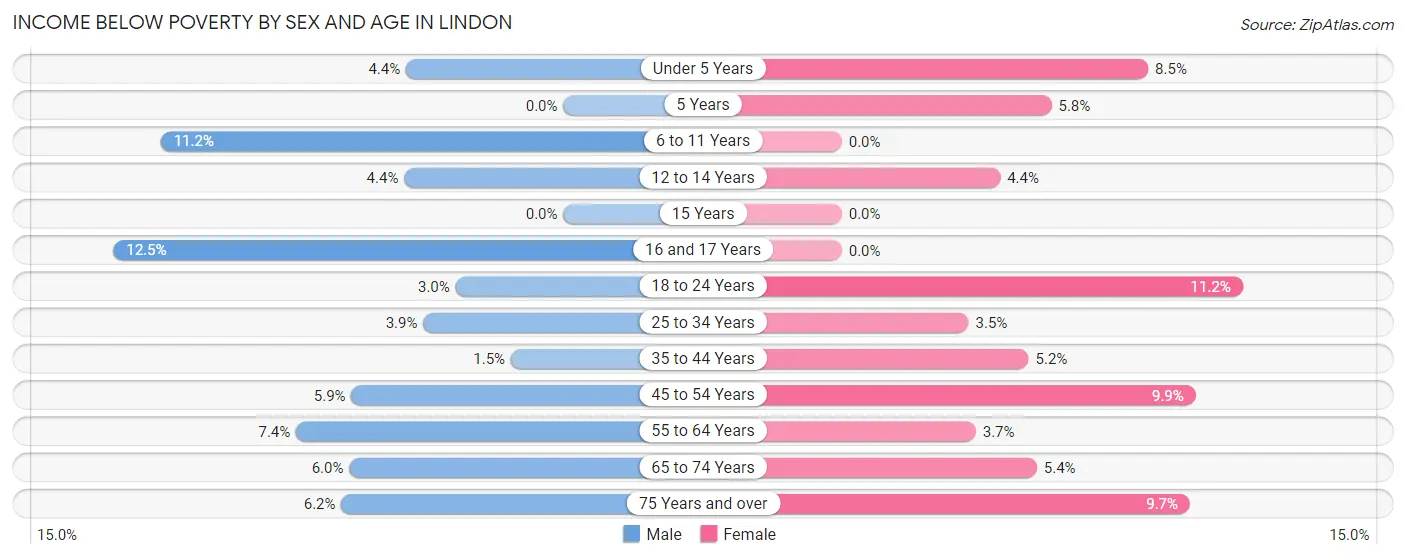
| Age Bracket | Male | Female |
| Under 5 Years | 13 (4.4%) | 22 (8.5%) |
| 5 Years | 0 (0.0%) | 9 (5.8%) |
| 6 to 11 Years | 86 (11.2%) | 0 (0.0%) |
| 12 to 14 Years | 22 (4.4%) | 19 (4.4%) |
| 15 Years | 0 (0.0%) | 0 (0.0%) |
| 16 and 17 Years | 45 (12.5%) | 0 (0.0%) |
| 18 to 24 Years | 28 (3.0%) | 53 (11.2%) |
| 25 to 34 Years | 16 (3.9%) | 14 (3.5%) |
| 35 to 44 Years | 9 (1.5%) | 33 (5.2%) |
| 45 to 54 Years | 41 (5.9%) | 78 (9.9%) |
| 55 to 64 Years | 47 (7.4%) | 22 (3.7%) |
| 65 to 74 Years | 34 (6.0%) | 25 (5.4%) |
| 75 Years and over | 11 (6.2%) | 22 (9.7%) |
| Total | 352 (5.7%) | 297 (5.6%) |
Income Above Poverty by Sex and Age in Lindon
According to the poverty statistics in Lindon, males aged 5 years and females aged 6 to 11 years are the age groups that are most secure financially, with 100.0% of males and 100.0% of females in these age groups living above the poverty line.
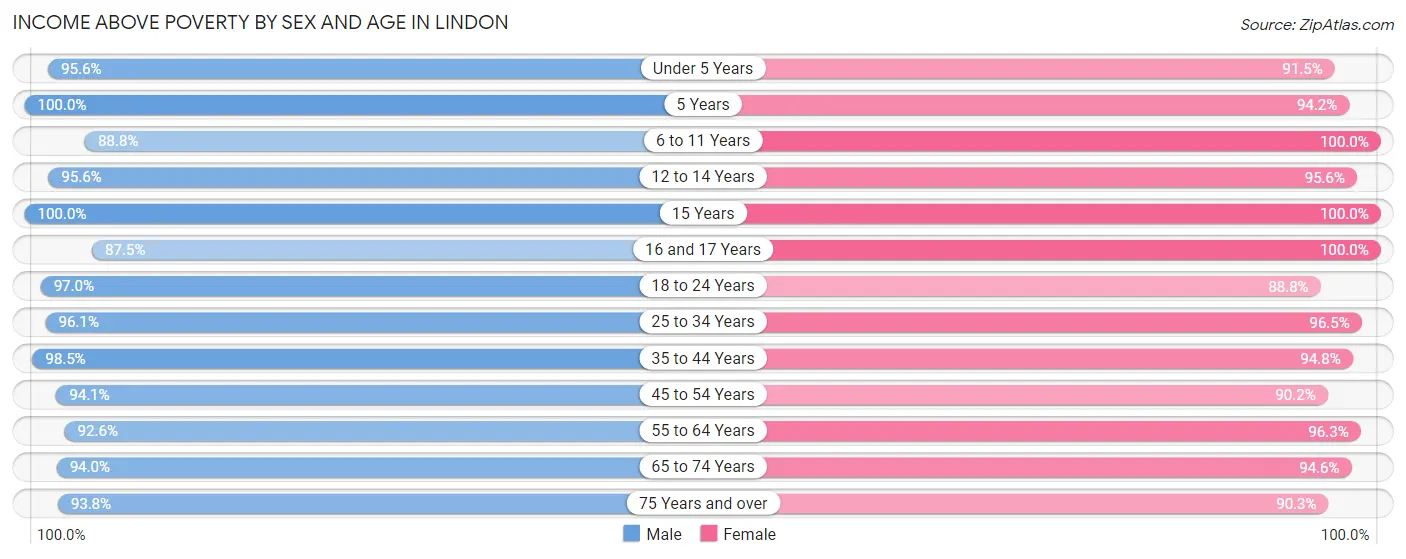
| Age Bracket | Male | Female |
| Under 5 Years | 284 (95.6%) | 236 (91.5%) |
| 5 Years | 66 (100.0%) | 145 (94.2%) |
| 6 to 11 Years | 681 (88.8%) | 502 (100.0%) |
| 12 to 14 Years | 475 (95.6%) | 412 (95.6%) |
| 15 Years | 147 (100.0%) | 93 (100.0%) |
| 16 and 17 Years | 314 (87.5%) | 296 (100.0%) |
| 18 to 24 Years | 905 (97.0%) | 422 (88.8%) |
| 25 to 34 Years | 394 (96.1%) | 383 (96.5%) |
| 35 to 44 Years | 608 (98.5%) | 602 (94.8%) |
| 45 to 54 Years | 654 (94.1%) | 714 (90.1%) |
| 55 to 64 Years | 585 (92.6%) | 568 (96.3%) |
| 65 to 74 Years | 536 (94.0%) | 435 (94.6%) |
| 75 Years and over | 167 (93.8%) | 205 (90.3%) |
| Total | 5,816 (94.3%) | 5,013 (94.4%) |
Income Below Poverty Among Married-Couple Families in Lindon
The poverty statistics for married-couple families in Lindon show that 4.0% or 96 of the total 2,379 families live below the poverty line. Families with 5 or more children have the highest poverty rate of 15.8%, comprising of 22 families. On the other hand, families with 3 or 4 children have the lowest poverty rate of 2.3%, which includes 9 families.
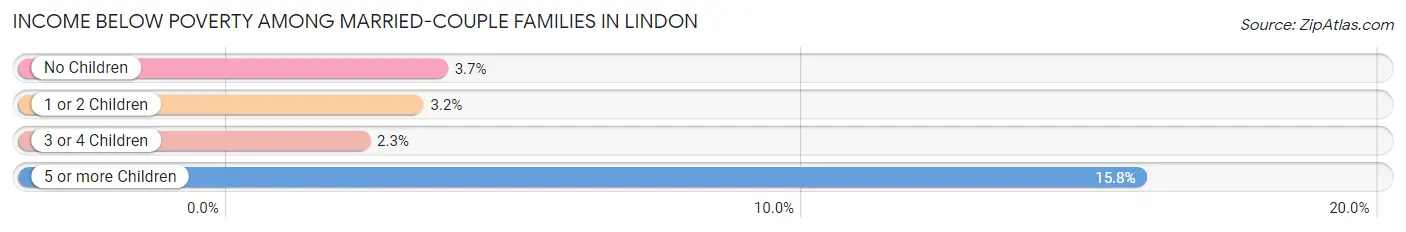
| Children | Above Poverty | Below Poverty |
| No Children | 1,215 (96.4%) | 46 (3.6%) |
| 1 or 2 Children | 569 (96.8%) | 19 (3.2%) |
| 3 or 4 Children | 382 (97.7%) | 9 (2.3%) |
| 5 or more Children | 117 (84.2%) | 22 (15.8%) |
| Total | 2,283 (96.0%) | 96 (4.0%) |
Income Below Poverty Among Single-Parent Households in Lindon
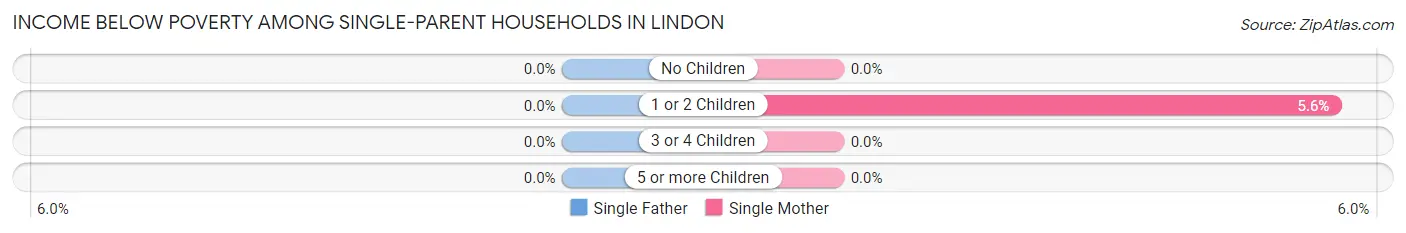
| Children | Single Father | Single Mother |
| No Children | 0 (0.0%) | 0 (0.0%) |
| 1 or 2 Children | 0 (0.0%) | 6 (5.6%) |
| 3 or 4 Children | 0 (0.0%) | 0 (0.0%) |
| 5 or more Children | 0 (0.0%) | 0 (0.0%) |
| Total | 0 (0.0%) | 6 (2.8%) |
Income Below Poverty Among Married-Couple vs Single-Parent Households in Lindon
The poverty data for Lindon shows that 96 of the married-couple family households (4.0%) and 6 of the single-parent households (1.7%) are living below the poverty level. Within the married-couple family households, those with 5 or more children have the highest poverty rate, with 22 households (15.8%) falling below the poverty line. Among the single-parent households, those with 1 or 2 children have the highest poverty rate, with 6 household (3.1%) living below poverty.
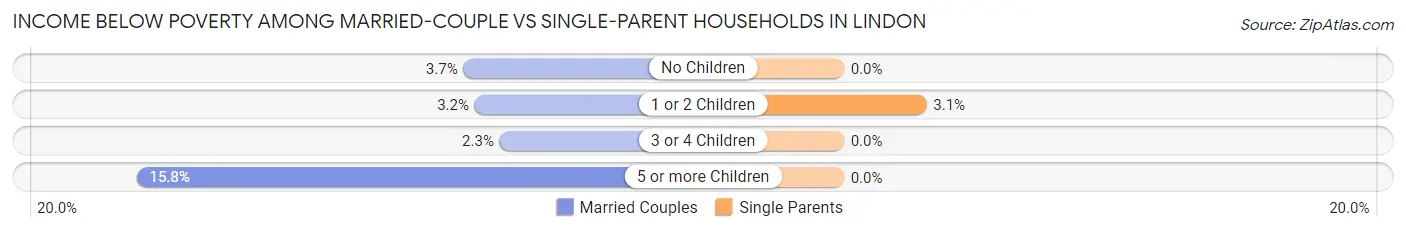
| Children | Married-Couple Families | Single-Parent Households |
| No Children | 46 (3.6%) | 0 (0.0%) |
| 1 or 2 Children | 19 (3.2%) | 6 (3.1%) |
| 3 or 4 Children | 9 (2.3%) | 0 (0.0%) |
| 5 or more Children | 22 (15.8%) | 0 (0.0%) |
| Total | 96 (4.0%) | 6 (1.7%) |
Race in Lindon
The most populous races in Lindon are White / Caucasian (9,971 | 86.9%), Two or more Races (808 | 7.0%), and Hispanic or Latino (662 | 5.8%).
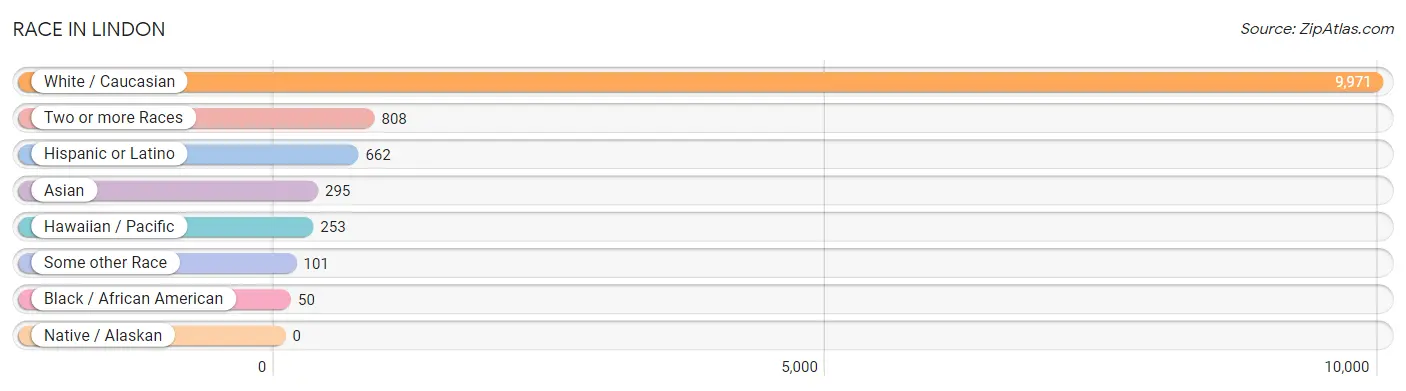
| Race | # Population | % Population |
| Asian | 295 | 2.6% |
| Black / African American | 50 | 0.4% |
| Hawaiian / Pacific | 253 | 2.2% |
| Hispanic or Latino | 662 | 5.8% |
| Native / Alaskan | 0 | 0.0% |
| White / Caucasian | 9,971 | 86.9% |
| Two or more Races | 808 | 7.0% |
| Some other Race | 101 | 0.9% |
| Total | 11,478 | 100.0% |
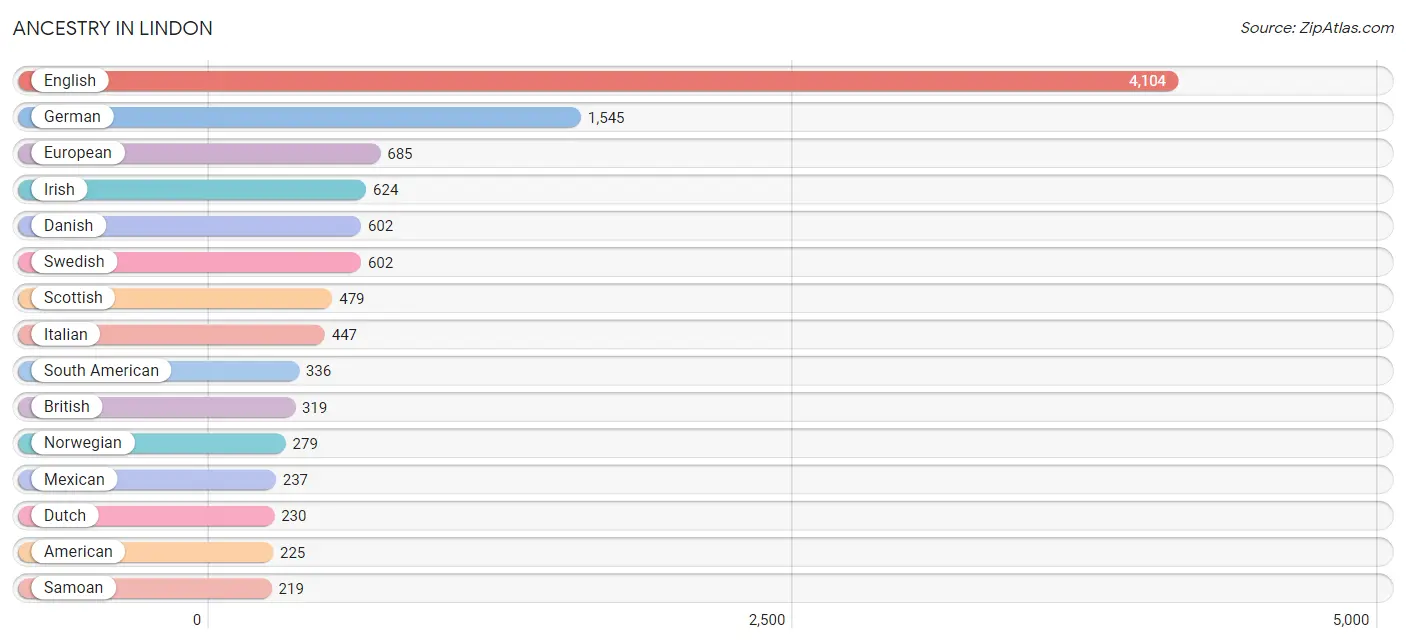
Ancestry in Lindon
The most populous ancestries reported in Lindon are English (4,104 | 35.8%), German (1,545 | 13.5%), European (685 | 6.0%), Irish (624 | 5.4%), and Danish (602 | 5.2%), together accounting for 65.9% of all Lindon residents.
| Ancestry | # Population | % Population |
| African | 14 | 0.1% |
| American | 225 | 2.0% |
| Argentinean | 6 | 0.1% |
| Australian | 6 | 0.1% |
| Austrian | 24 | 0.2% |
| Belgian | 10 | 0.1% |
| Bhutanese | 173 | 1.5% |
| Brazilian | 13 | 0.1% |
| British | 319 | 2.8% |
| Burmese | 185 | 1.6% |
| Canadian | 182 | 1.6% |
| Central American | 27 | 0.2% |
| Chilean | 136 | 1.2% |
| Colombian | 27 | 0.2% |
| Costa Rican | 5 | 0.0% |
| Danish | 602 | 5.2% |
| Dutch | 230 | 2.0% |
| Eastern European | 9 | 0.1% |
| Ecuadorian | 8 | 0.1% |
| English | 4,104 | 35.8% |
| Ethiopian | 24 | 0.2% |
| European | 685 | 6.0% |
| Finnish | 19 | 0.2% |
| French | 198 | 1.7% |
| French Canadian | 11 | 0.1% |
| German | 1,545 | 13.5% |
| Greek | 67 | 0.6% |
| Guatemalan | 22 | 0.2% |
| Icelander | 8 | 0.1% |
| Indian (Asian) | 23 | 0.2% |
| Irish | 624 | 5.4% |
| Italian | 447 | 3.9% |
| Korean | 21 | 0.2% |
| Lithuanian | 39 | 0.3% |
| Mexican | 237 | 2.1% |
| Native Hawaiian | 17 | 0.2% |
| Navajo | 13 | 0.1% |
| Northern European | 99 | 0.9% |
| Norwegian | 279 | 2.4% |
| Peruvian | 137 | 1.2% |
| Polish | 23 | 0.2% |
| Portuguese | 43 | 0.4% |
| Russian | 5 | 0.0% |
| Samoan | 219 | 1.9% |
| Scandinavian | 157 | 1.4% |
| Scotch-Irish | 74 | 0.6% |
| Scottish | 479 | 4.2% |
| Shoshone | 67 | 0.6% |
| Slovak | 12 | 0.1% |
| South African | 6 | 0.1% |
| South American | 336 | 2.9% |
| Spaniard | 26 | 0.2% |
| Spanish | 26 | 0.2% |
| Subsaharan African | 44 | 0.4% |
| Swedish | 602 | 5.2% |
| Swiss | 106 | 0.9% |
| Thai | 37 | 0.3% |
| Tongan | 20 | 0.2% |
| Turkish | 4 | 0.0% |
| Ukrainian | 9 | 0.1% |
| Venezuelan | 22 | 0.2% |
| Welsh | 144 | 1.3% | View All 62 Rows |
Immigrants in Lindon
The most numerous immigrant groups reported in Lindon came from Latin America (157 | 1.4%), Asia (138 | 1.2%), Eastern Asia (117 | 1.0%), South America (109 | 0.9%), and Oceania (104 | 0.9%), together accounting for 5.5% of all Lindon residents.
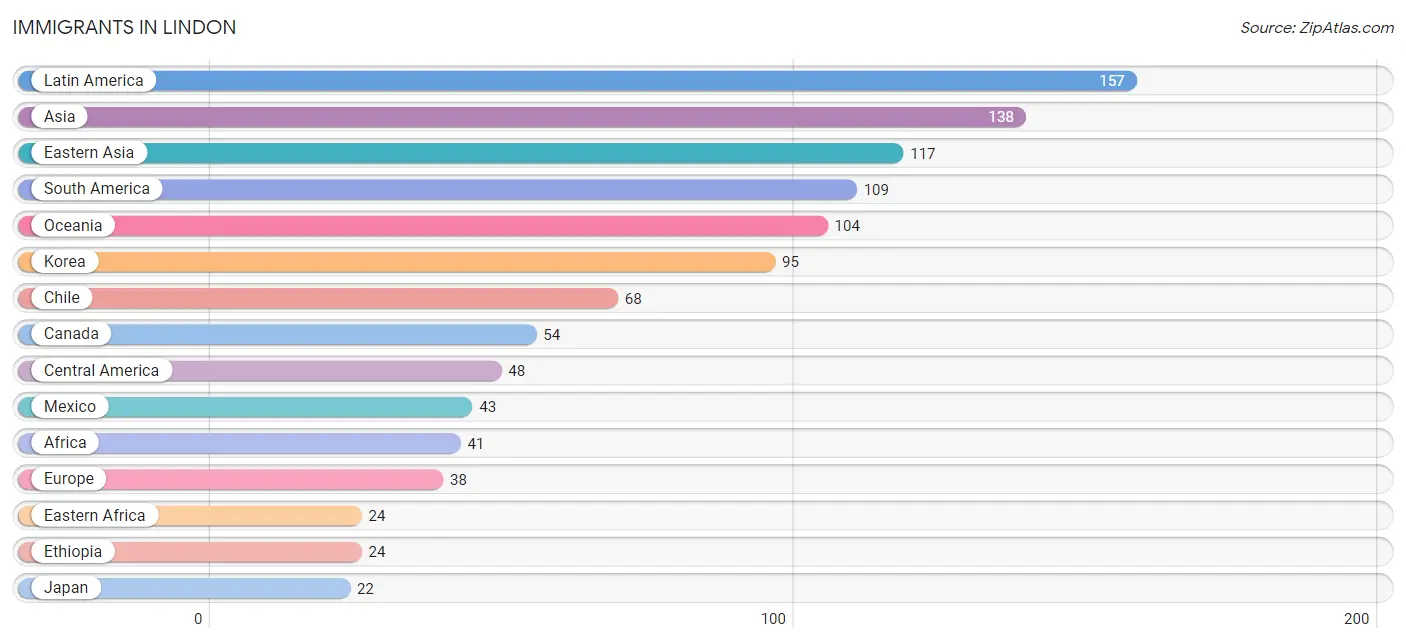
| Immigration Origin | # Population | % Population |
| Africa | 41 | 0.4% |
| Asia | 138 | 1.2% |
| Brazil | 7 | 0.1% |
| Canada | 54 | 0.5% |
| Central America | 48 | 0.4% |
| Chile | 68 | 0.6% |
| Colombia | 11 | 0.1% |
| Costa Rica | 5 | 0.0% |
| Eastern Africa | 24 | 0.2% |
| Eastern Asia | 117 | 1.0% |
| Eastern Europe | 4 | 0.0% |
| Ecuador | 8 | 0.1% |
| Ethiopia | 24 | 0.2% |
| Europe | 38 | 0.3% |
| Germany | 6 | 0.1% |
| India | 21 | 0.2% |
| Japan | 22 | 0.2% |
| Korea | 95 | 0.8% |
| Latin America | 157 | 1.4% |
| Mexico | 43 | 0.4% |
| Netherlands | 10 | 0.1% |
| Oceania | 104 | 0.9% |
| Peru | 15 | 0.1% |
| Poland | 4 | 0.0% |
| South Africa | 17 | 0.2% |
| South America | 109 | 0.9% |
| South Central Asia | 21 | 0.2% |
| Western Europe | 16 | 0.1% | View All 28 Rows |
Sex and Age in Lindon
Sex and Age in Lindon
The most populous age groups in Lindon are 10 to 14 Years (843 | 13.7%) for men and 10 to 14 Years (660 | 12.4%) for women.
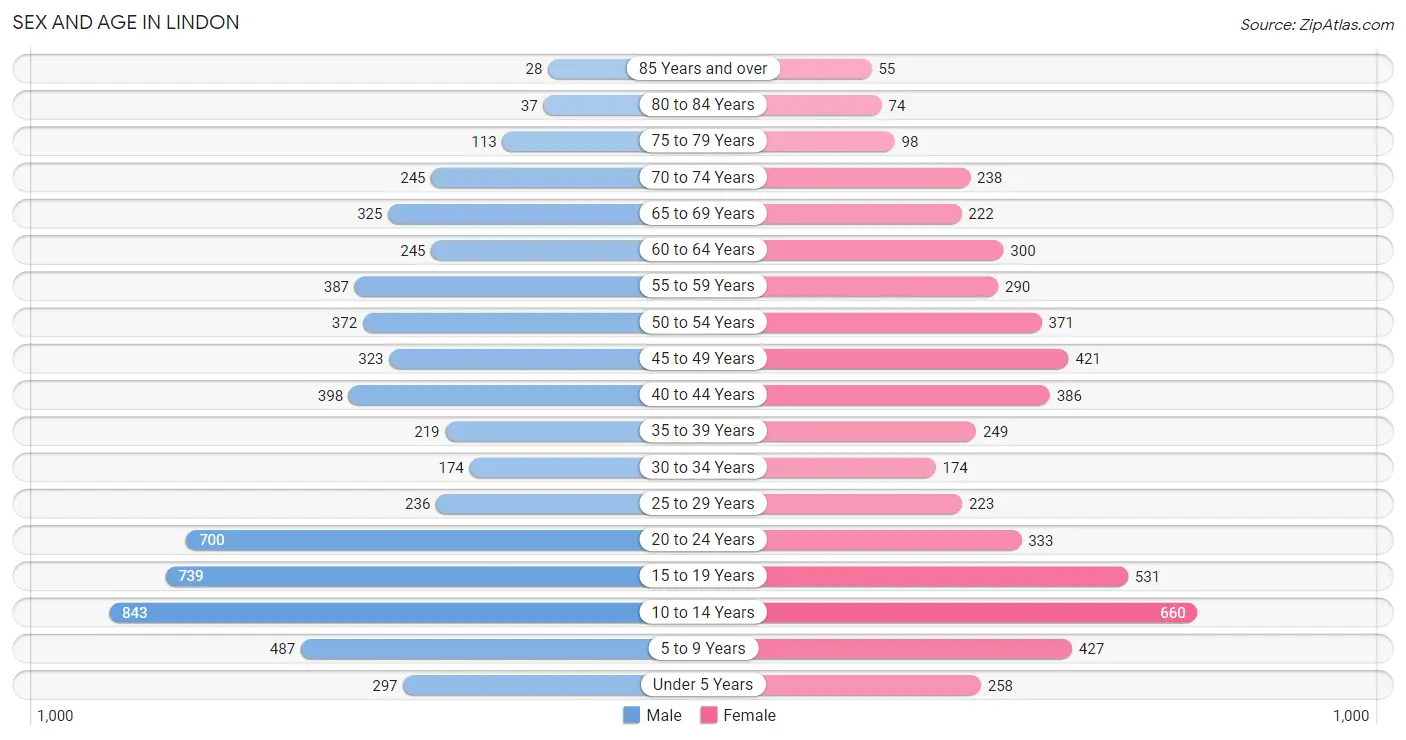
| Age Bracket | Male | Female |
| Under 5 Years | 297 (4.8%) | 258 (4.9%) |
| 5 to 9 Years | 487 (7.9%) | 427 (8.0%) |
| 10 to 14 Years | 843 (13.7%) | 660 (12.4%) |
| 15 to 19 Years | 739 (12.0%) | 531 (10.0%) |
| 20 to 24 Years | 700 (11.4%) | 333 (6.3%) |
| 25 to 29 Years | 236 (3.8%) | 223 (4.2%) |
| 30 to 34 Years | 174 (2.8%) | 174 (3.3%) |
| 35 to 39 Years | 219 (3.5%) | 249 (4.7%) |
| 40 to 44 Years | 398 (6.5%) | 386 (7.3%) |
| 45 to 49 Years | 323 (5.2%) | 421 (7.9%) |
| 50 to 54 Years | 372 (6.0%) | 371 (7.0%) |
| 55 to 59 Years | 387 (6.3%) | 290 (5.5%) |
| 60 to 64 Years | 245 (4.0%) | 300 (5.7%) |
| 65 to 69 Years | 325 (5.3%) | 222 (4.2%) |
| 70 to 74 Years | 245 (4.0%) | 238 (4.5%) |
| 75 to 79 Years | 113 (1.8%) | 98 (1.8%) |
| 80 to 84 Years | 37 (0.6%) | 74 (1.4%) |
| 85 Years and over | 28 (0.4%) | 55 (1.0%) |
| Total | 6,168 (100.0%) | 5,310 (100.0%) |
Families and Households in Lindon
Median Family Size in Lindon
The median family size in Lindon is 3.92 persons per family, with single male/father families (147 | 5.4%) accounting for the largest median family size of 6.45 persons per family. On the other hand, single female/mother families (213 | 7.8%) represent the smallest median family size with 3.17 persons per family.
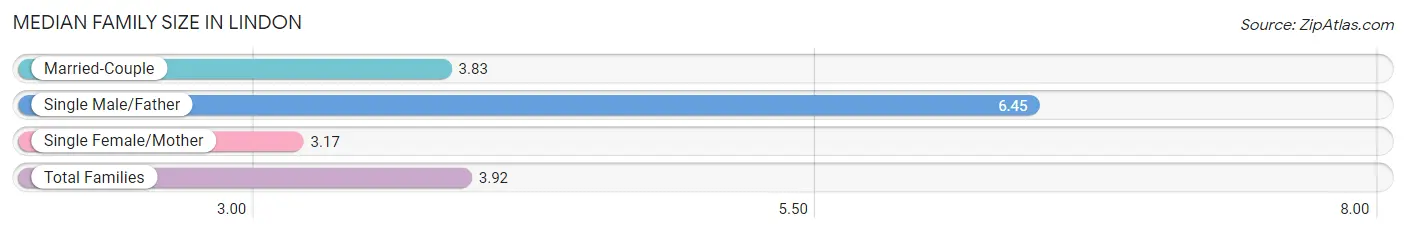
| Family Type | # Families | Family Size |
| Married-Couple | 2,379 (86.9%) | 3.83 |
| Single Male/Father | 147 (5.4%) | 6.45 |
| Single Female/Mother | 213 (7.8%) | 3.17 |
| Total Families | 2,739 (100.0%) | 3.92 |
Median Household Size in Lindon
The median household size in Lindon is 3.63 persons per household, with single male/father households (147 | 4.7%) accounting for the largest median household size of 6.48 persons per household. non-family households (386 | 12.3%) represent the smallest median household size with 1.17 persons per household.
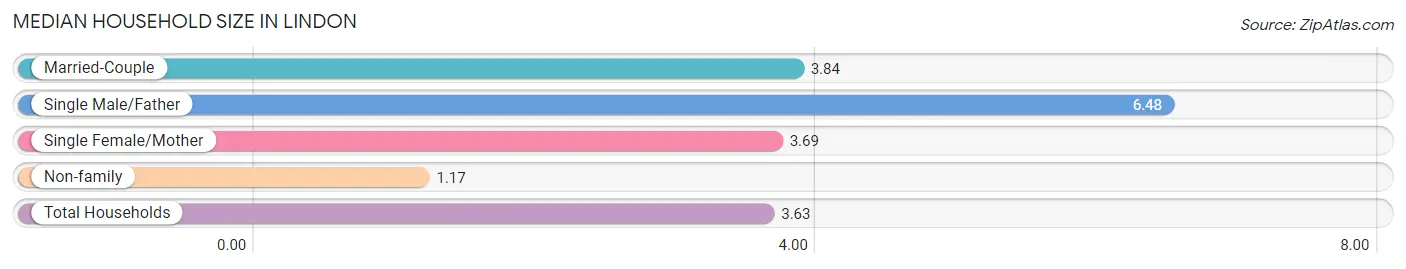
| Household Type | # Households | Household Size |
| Married-Couple | 2,379 (76.1%) | 3.84 |
| Single Male/Father | 147 (4.7%) | 6.48 |
| Single Female/Mother | 213 (6.8%) | 3.69 |
| Non-family | 386 (12.3%) | 1.17 |
| Total Households | 3,125 (100.0%) | 3.63 |
Household Size by Marriage Status in Lindon
Out of a total of 3,125 households in Lindon, 2,739 (87.6%) are family households, while 386 (12.3%) are nonfamily households. The most numerous type of family households are 2-person households, comprising 906, and the most common type of nonfamily households are 1-person households, comprising 335.
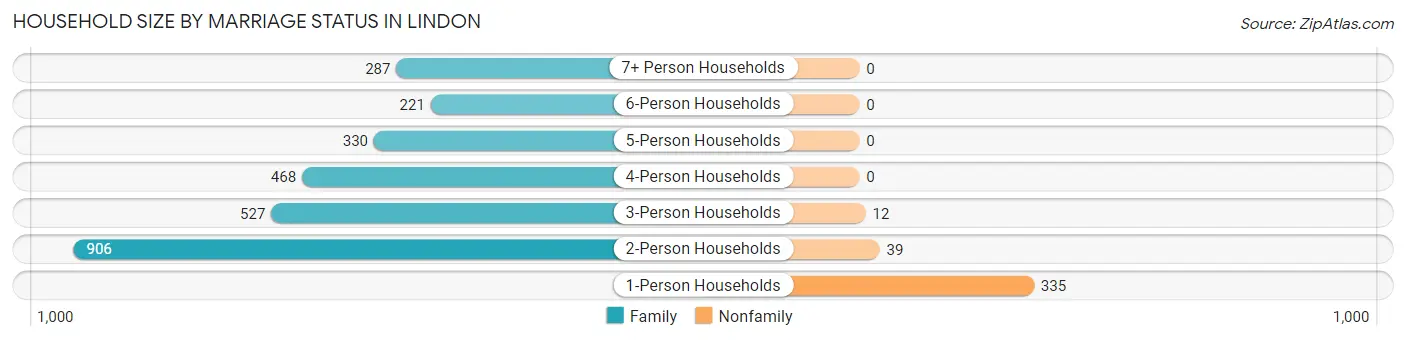
| Household Size | Family Households | Nonfamily Households |
| 1-Person Households | - | 335 (10.7%) |
| 2-Person Households | 906 (29.0%) | 39 (1.3%) |
| 3-Person Households | 527 (16.9%) | 12 (0.4%) |
| 4-Person Households | 468 (15.0%) | 0 (0.0%) |
| 5-Person Households | 330 (10.6%) | 0 (0.0%) |
| 6-Person Households | 221 (7.1%) | 0 (0.0%) |
| 7+ Person Households | 287 (9.2%) | 0 (0.0%) |
| Total | 2,739 (87.6%) | 386 (12.3%) |
Female Fertility in Lindon
Fertility by Age in Lindon
Average fertility rate in Lindon is 36.0 births per 1,000 women. Women in the age bracket of 20 to 34 years have the highest fertility rate with 99.0 births per 1,000 women. Women in the age bracket of 20 to 34 years acount for 81.8% of all women with births.
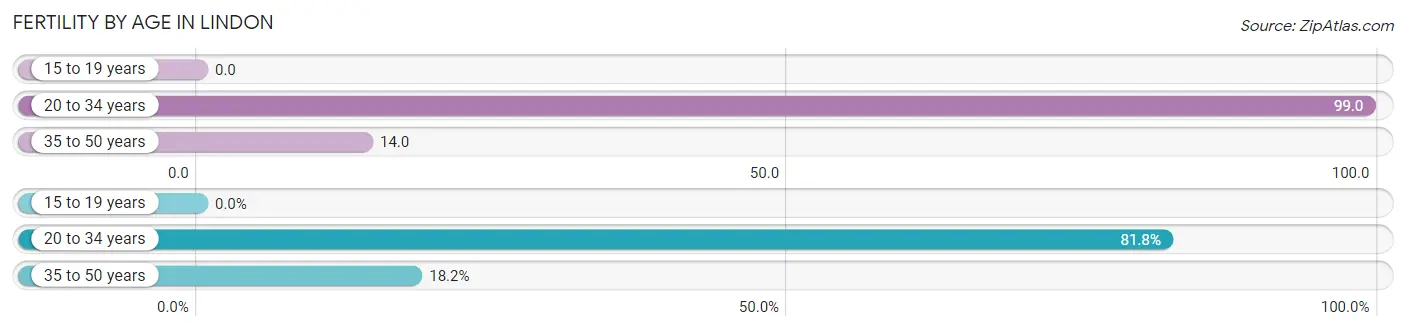
| Age Bracket | Women with Births | Births / 1,000 Women |
| 15 to 19 years | 0 (0.0%) | 0.0 |
| 20 to 34 years | 72 (81.8%) | 99.0 |
| 35 to 50 years | 16 (18.2%) | 14.0 |
| Total | 88 (100.0%) | 36.0 |
Fertility by Age by Marriage Status in Lindon
93.2% of women with births (88) in Lindon are married. The highest percentage of unmarried women with births falls into 35 to 50 years age bracket with 37.5% of them unmarried at the time of birth, while the lowest percentage of unmarried women with births belong to 20 to 34 years age bracket with 0.0% of them unmarried.
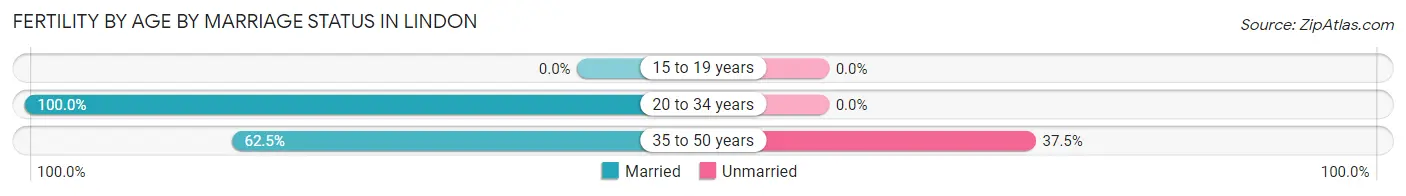
| Age Bracket | Married | Unmarried |
| 15 to 19 years | 0 (0.0%) | 0 (0.0%) |
| 20 to 34 years | 72 (100.0%) | 0 (0.0%) |
| 35 to 50 years | 10 (62.5%) | 6 (37.5%) |
| Total | 82 (93.2%) | 6 (6.8%) |
Fertility by Education in Lindon
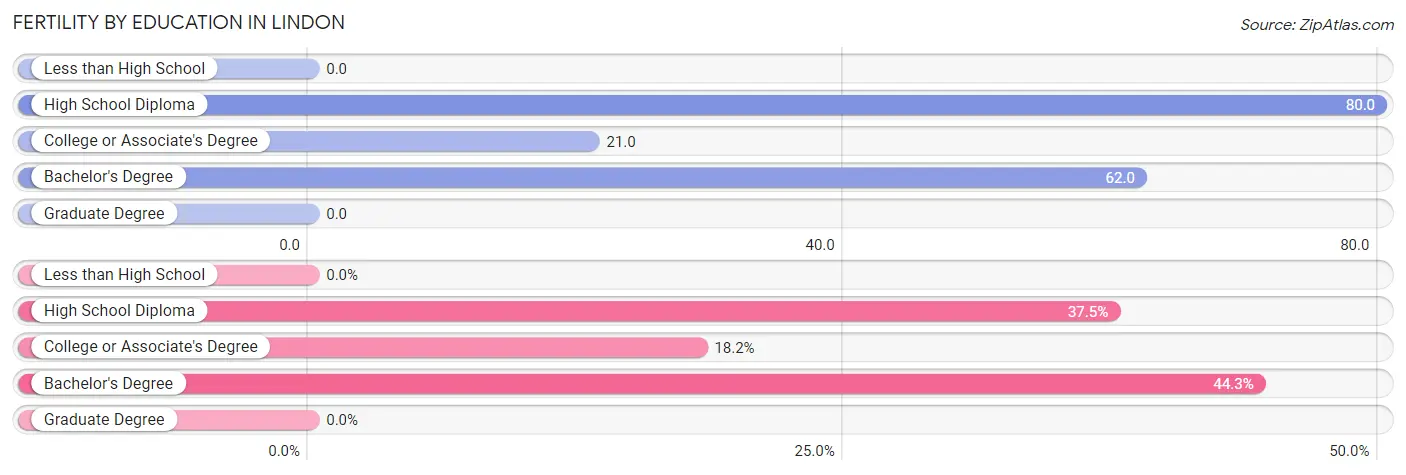
| Educational Attainment | Women with Births | Births / 1,000 Women |
| Less than High School | 0 (0.0%) | 0.0 |
| High School Diploma | 33 (37.5%) | 80.0 |
| College or Associate's Degree | 16 (18.2%) | 21.0 |
| Bachelor's Degree | 39 (44.3%) | 62.0 |
| Graduate Degree | 0 (0.0%) | 0.0 |
| Total | 88 (100.0%) | 36.0 |
Fertility by Education by Marriage Status in Lindon
6.8% of women with births in Lindon are unmarried. Women with the educational attainment of high school diploma are most likely to be married with 100.0% of them married at childbirth, while women with the educational attainment of bachelor's degree are least likely to be married with 15.4% of them unmarried at childbirth.
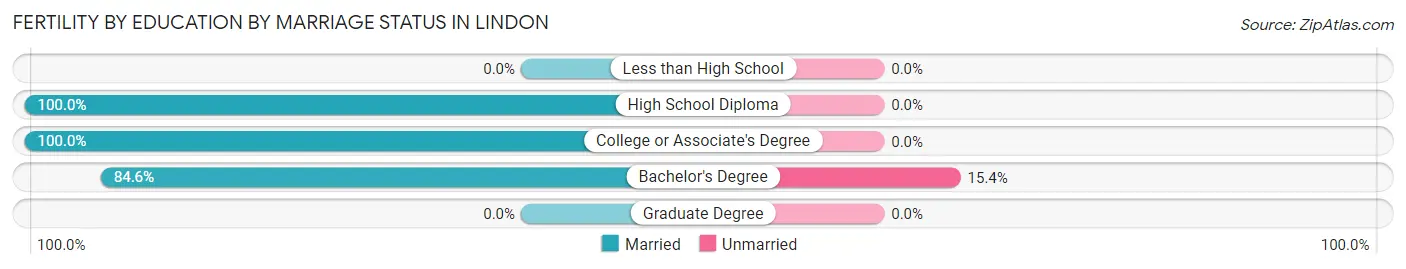
| Educational Attainment | Married | Unmarried |
| Less than High School | 0 (0.0%) | 0 (0.0%) |
| High School Diploma | 33 (100.0%) | 0 (0.0%) |
| College or Associate's Degree | 16 (100.0%) | 0 (0.0%) |
| Bachelor's Degree | 33 (84.6%) | 6 (15.4%) |
| Graduate Degree | 0 (0.0%) | 0 (0.0%) |
| Total | 82 (93.2%) | 6 (6.8%) |
Employment Characteristics in Lindon
Employment by Class of Employer in Lindon
Among the 5,040 employed individuals in Lindon, private company employees (3,257 | 64.6%), not-for-profit organizations (484 | 9.6%), and self-employed (incorporated) (444 | 8.8%) make up the most common classes of employment.
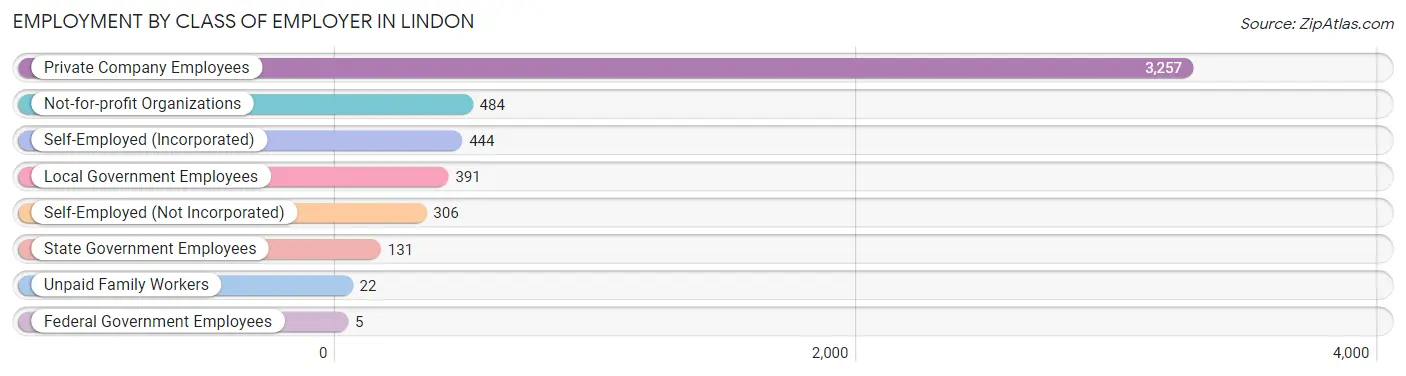
| Employer Class | # Employees | % Employees |
| Private Company Employees | 3,257 | 64.6% |
| Self-Employed (Incorporated) | 444 | 8.8% |
| Self-Employed (Not Incorporated) | 306 | 6.1% |
| Not-for-profit Organizations | 484 | 9.6% |
| Local Government Employees | 391 | 7.8% |
| State Government Employees | 131 | 2.6% |
| Federal Government Employees | 5 | 0.1% |
| Unpaid Family Workers | 22 | 0.4% |
| Total | 5,040 | 100.0% |
Employment Status by Age in Lindon
According to the labor force statistics for Lindon, out of the total population over 16 years of age (8,266), 66.3% or 5,480 individuals are in the labor force, with 3.7% or 203 of them unemployed. The age group with the highest labor force participation rate is 20 to 24 years, with 89.6% or 926 individuals in the labor force. Within the labor force, the 16 to 19 years age range has the highest percentage of unemployed individuals, with 19.7% or 103 of them being unemployed.
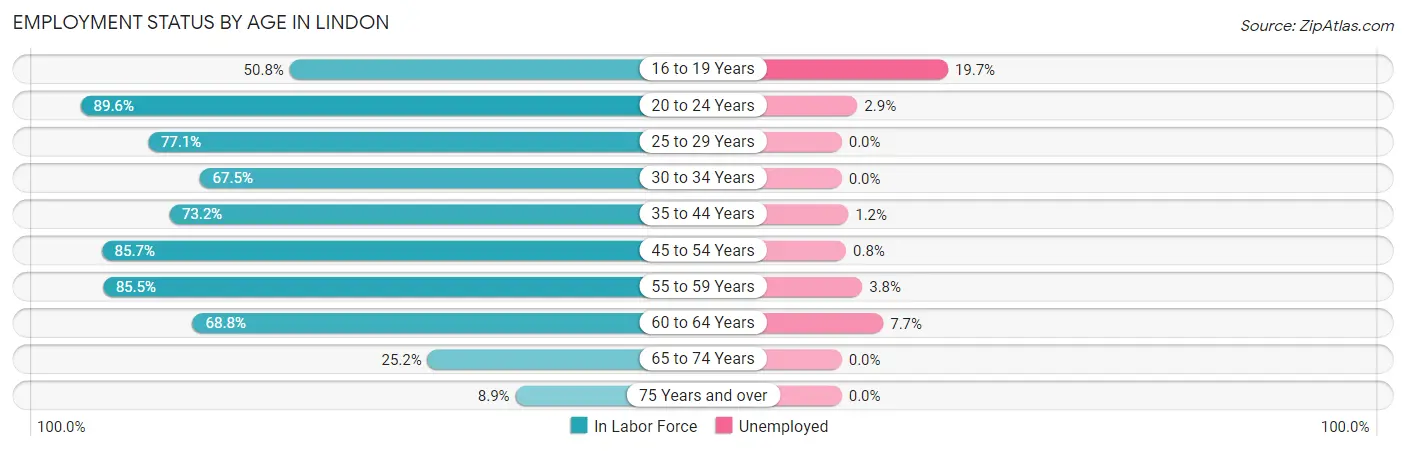
| Age Bracket | In Labor Force | Unemployed |
| 16 to 19 Years | 523 (50.8%) | 103 (19.7%) |
| 20 to 24 Years | 926 (89.6%) | 27 (2.9%) |
| 25 to 29 Years | 354 (77.1%) | 0 (0.0%) |
| 30 to 34 Years | 235 (67.5%) | 0 (0.0%) |
| 35 to 44 Years | 916 (73.2%) | 11 (1.2%) |
| 45 to 54 Years | 1,274 (85.7%) | 10 (0.8%) |
| 55 to 59 Years | 579 (85.5%) | 22 (3.8%) |
| 60 to 64 Years | 375 (68.8%) | 29 (7.7%) |
| 65 to 74 Years | 260 (25.2%) | 0 (0.0%) |
| 75 Years and over | 36 (8.9%) | 0 (0.0%) |
| Total | 5,480 (66.3%) | 203 (3.7%) |
Employment Status by Educational Attainment in Lindon
According to labor force statistics for Lindon, 78.3% of individuals (3,733) out of the total population between 25 and 64 years of age (4,768) are in the labor force, with 1.9% or 71 of them being unemployed. The group with the highest labor force participation rate are those with the educational attainment of bachelor's degree or higher, with 83.1% or 1,870 individuals in the labor force. Within the labor force, individuals with bachelor's degree or higher education have the highest percentage of unemployment, with 2.1% or 39 of them being unemployed.
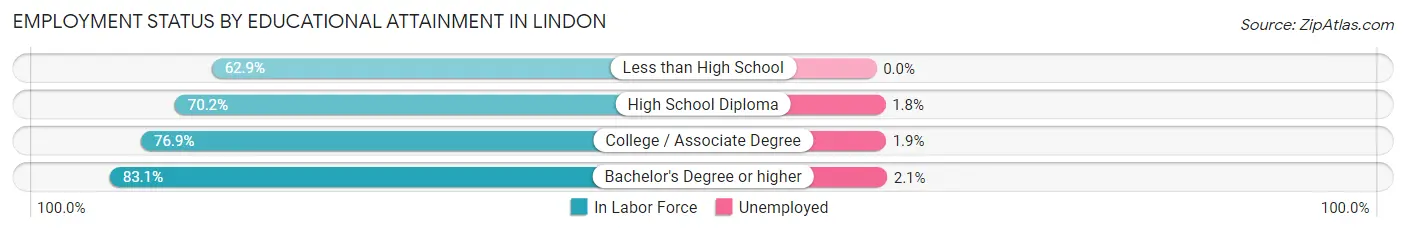
| Educational Attainment | In Labor Force | Unemployed |
| Less than High School | 78 (62.9%) | 0 (0.0%) |
| High School Diploma | 553 (70.2%) | 14 (1.8%) |
| College / Associate Degree | 1,235 (76.9%) | 31 (1.9%) |
| Bachelor's Degree or higher | 1,870 (83.1%) | 47 (2.1%) |
| Total | 3,733 (78.3%) | 91 (1.9%) |
Employment Occupations by Sex in Lindon
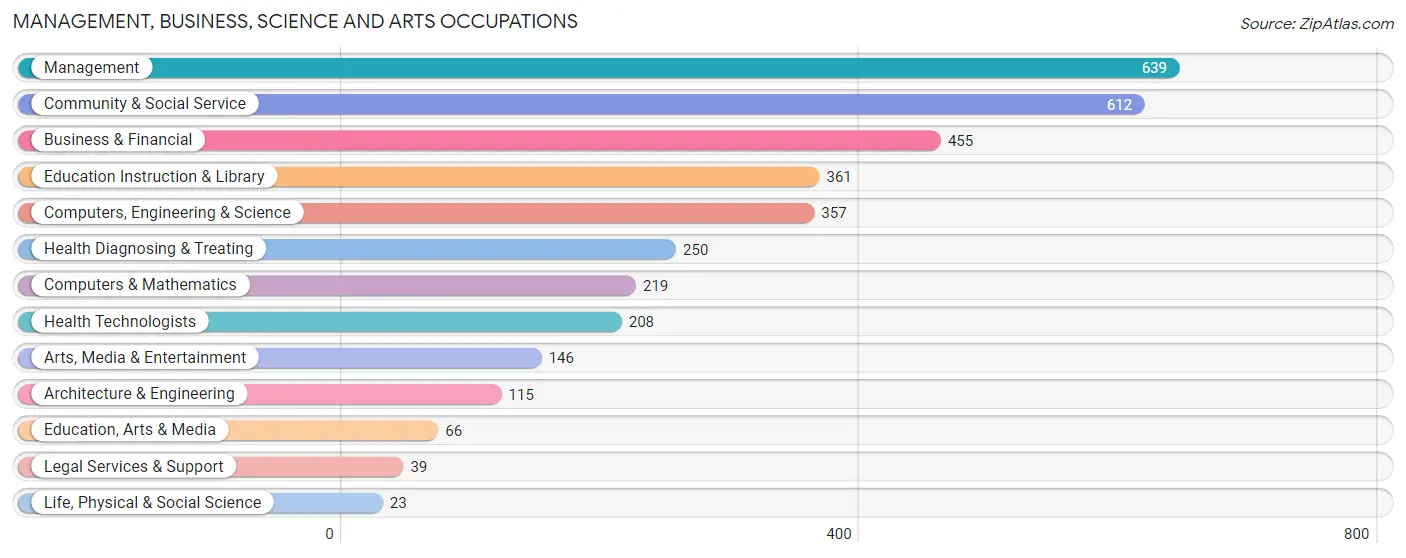
Management, Business, Science and Arts Occupations
The most common Management, Business, Science and Arts occupations in Lindon are Management (639 | 12.1%), Community & Social Service (612 | 11.6%), Business & Financial (455 | 8.6%), Education Instruction & Library (361 | 6.8%), and Computers, Engineering & Science (357 | 6.8%).
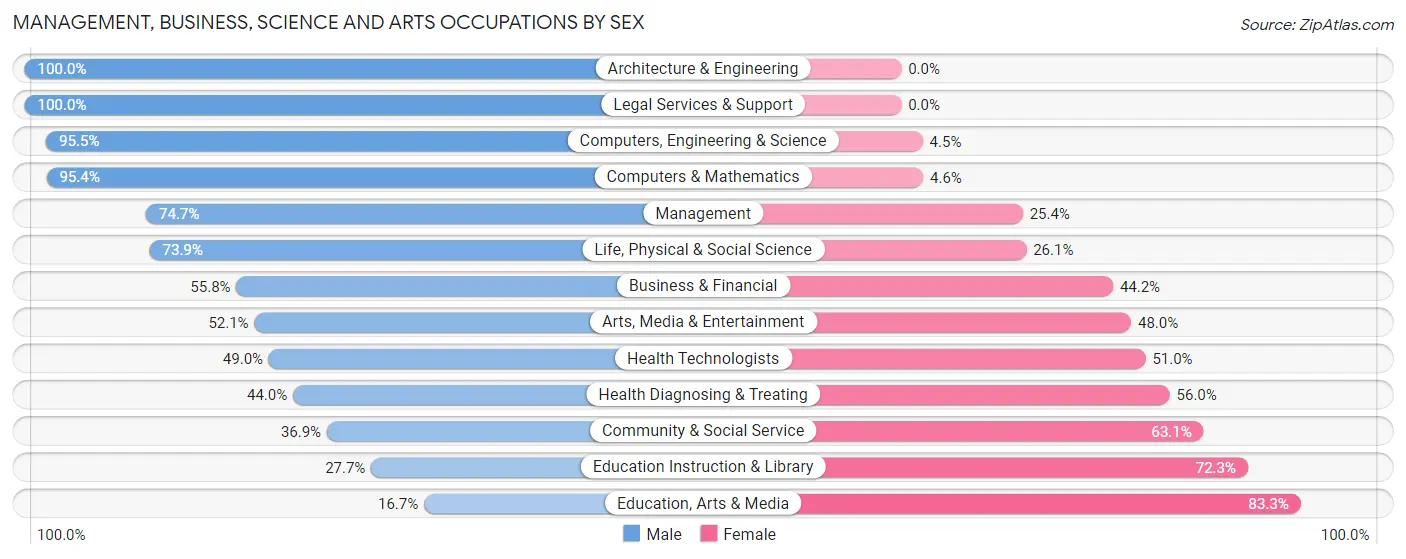
Management, Business, Science and Arts Occupations by Sex
Within the Management, Business, Science and Arts occupations in Lindon, the most male-oriented occupations are Architecture & Engineering (100.0%), Legal Services & Support (100.0%), and Computers, Engineering & Science (95.5%), while the most female-oriented occupations are Education, Arts & Media (83.3%), Education Instruction & Library (72.3%), and Community & Social Service (63.1%).
| Occupation | Male | Female |
| Management | 477 (74.7%) | 162 (25.4%) |
| Business & Financial | 254 (55.8%) | 201 (44.2%) |
| Computers, Engineering & Science | 341 (95.5%) | 16 (4.5%) |
| Computers & Mathematics | 209 (95.4%) | 10 (4.6%) |
| Architecture & Engineering | 115 (100.0%) | 0 (0.0%) |
| Life, Physical & Social Science | 17 (73.9%) | 6 (26.1%) |
| Community & Social Service | 226 (36.9%) | 386 (63.1%) |
| Education, Arts & Media | 11 (16.7%) | 55 (83.3%) |
| Legal Services & Support | 39 (100.0%) | 0 (0.0%) |
| Education Instruction & Library | 100 (27.7%) | 261 (72.3%) |
| Arts, Media & Entertainment | 76 (52.0%) | 70 (47.9%) |
| Health Diagnosing & Treating | 110 (44.0%) | 140 (56.0%) |
| Health Technologists | 102 (49.0%) | 106 (51.0%) |
| Total (Category) | 1,408 (60.9%) | 905 (39.1%) |
| Total (Overall) | 3,184 (60.3%) | 2,094 (39.7%) |
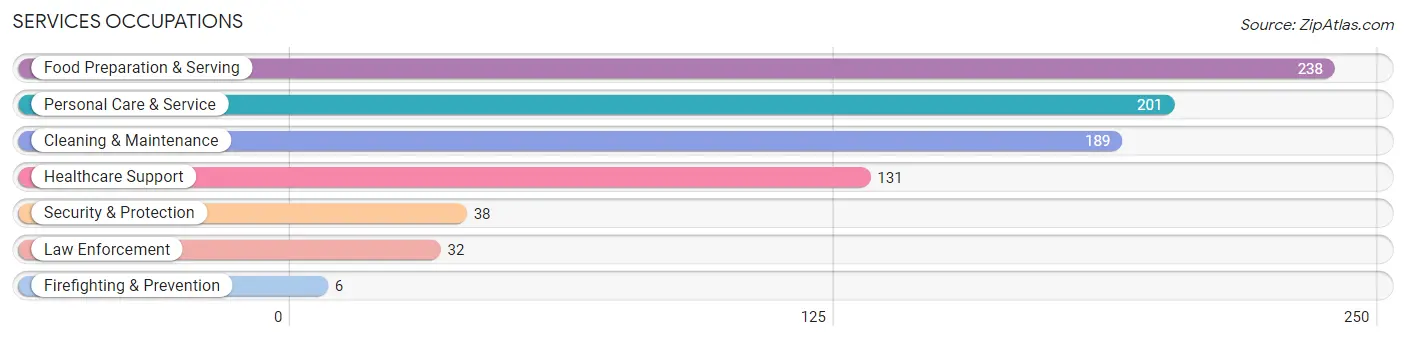
Services Occupations
The most common Services occupations in Lindon are Food Preparation & Serving (238 | 4.5%), Personal Care & Service (201 | 3.8%), Cleaning & Maintenance (189 | 3.6%), Healthcare Support (131 | 2.5%), and Security & Protection (38 | 0.7%).
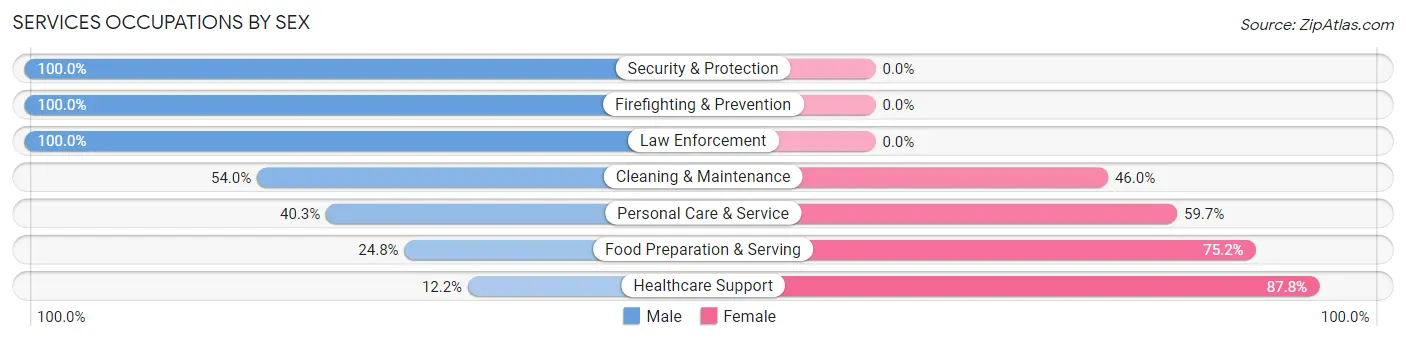
Services Occupations by Sex
Within the Services occupations in Lindon, the most male-oriented occupations are Security & Protection (100.0%), Firefighting & Prevention (100.0%), and Law Enforcement (100.0%), while the most female-oriented occupations are Healthcare Support (87.8%), Food Preparation & Serving (75.2%), and Personal Care & Service (59.7%).
| Occupation | Male | Female |
| Healthcare Support | 16 (12.2%) | 115 (87.8%) |
| Security & Protection | 38 (100.0%) | 0 (0.0%) |
| Firefighting & Prevention | 6 (100.0%) | 0 (0.0%) |
| Law Enforcement | 32 (100.0%) | 0 (0.0%) |
| Food Preparation & Serving | 59 (24.8%) | 179 (75.2%) |
| Cleaning & Maintenance | 102 (54.0%) | 87 (46.0%) |
| Personal Care & Service | 81 (40.3%) | 120 (59.7%) |
| Total (Category) | 296 (37.1%) | 501 (62.9%) |
| Total (Overall) | 3,184 (60.3%) | 2,094 (39.7%) |
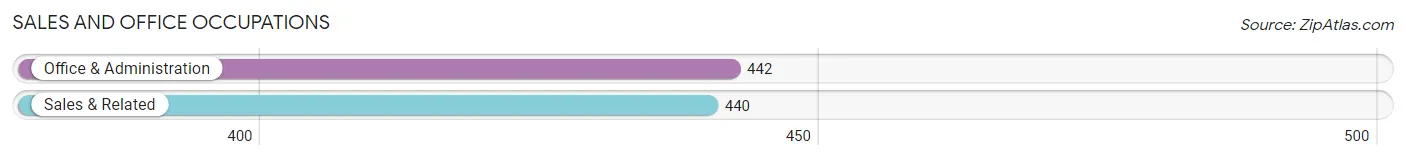
Sales and Office Occupations
The most common Sales and Office occupations in Lindon are Office & Administration (442 | 8.4%), and Sales & Related (440 | 8.3%).
Sales and Office Occupations by Sex
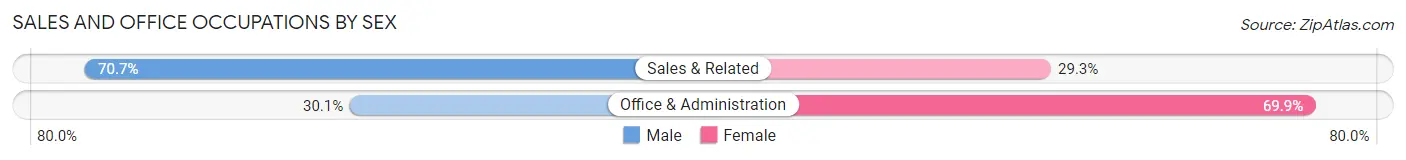
| Occupation | Male | Female |
| Sales & Related | 311 (70.7%) | 129 (29.3%) |
| Office & Administration | 133 (30.1%) | 309 (69.9%) |
| Total (Category) | 444 (50.3%) | 438 (49.7%) |
| Total (Overall) | 3,184 (60.3%) | 2,094 (39.7%) |
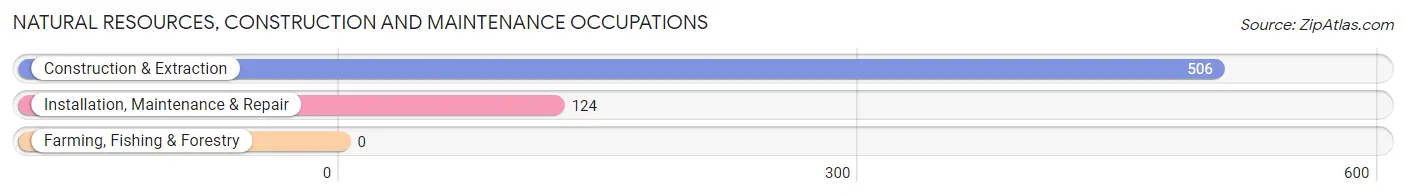
Natural Resources, Construction and Maintenance Occupations
The most common Natural Resources, Construction and Maintenance occupations in Lindon are Construction & Extraction (506 | 9.6%), and Installation, Maintenance & Repair (124 | 2.4%).
Natural Resources, Construction and Maintenance Occupations by Sex
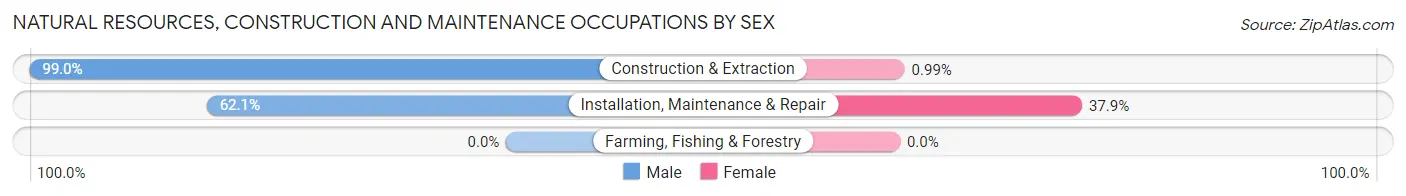
| Occupation | Male | Female |
| Farming, Fishing & Forestry | 0 (0.0%) | 0 (0.0%) |
| Construction & Extraction | 501 (99.0%) | 5 (1.0%) |
| Installation, Maintenance & Repair | 77 (62.1%) | 47 (37.9%) |
| Total (Category) | 578 (91.7%) | 52 (8.3%) |
| Total (Overall) | 3,184 (60.3%) | 2,094 (39.7%) |
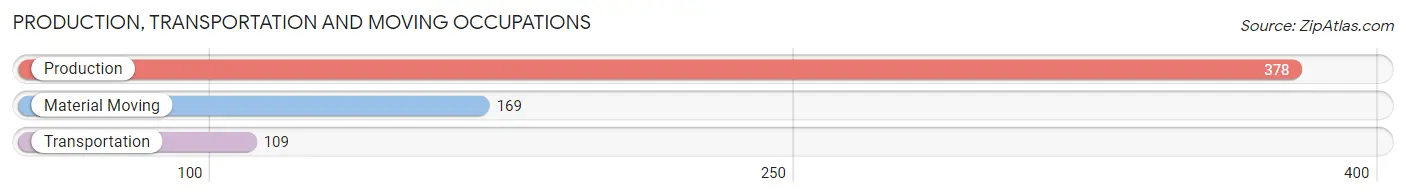
Production, Transportation and Moving Occupations
The most common Production, Transportation and Moving occupations in Lindon are Production (378 | 7.2%), Material Moving (169 | 3.2%), and Transportation (109 | 2.1%).
Production, Transportation and Moving Occupations by Sex
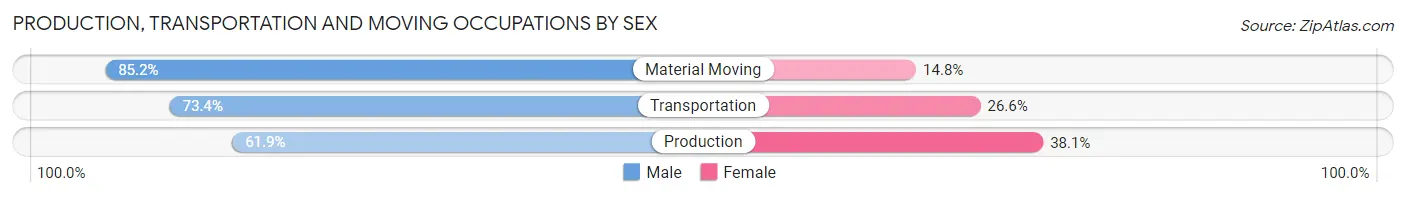
| Occupation | Male | Female |
| Production | 234 (61.9%) | 144 (38.1%) |
| Transportation | 80 (73.4%) | 29 (26.6%) |
| Material Moving | 144 (85.2%) | 25 (14.8%) |
| Total (Category) | 458 (69.8%) | 198 (30.2%) |
| Total (Overall) | 3,184 (60.3%) | 2,094 (39.7%) |
Employment Industries by Sex in Lindon
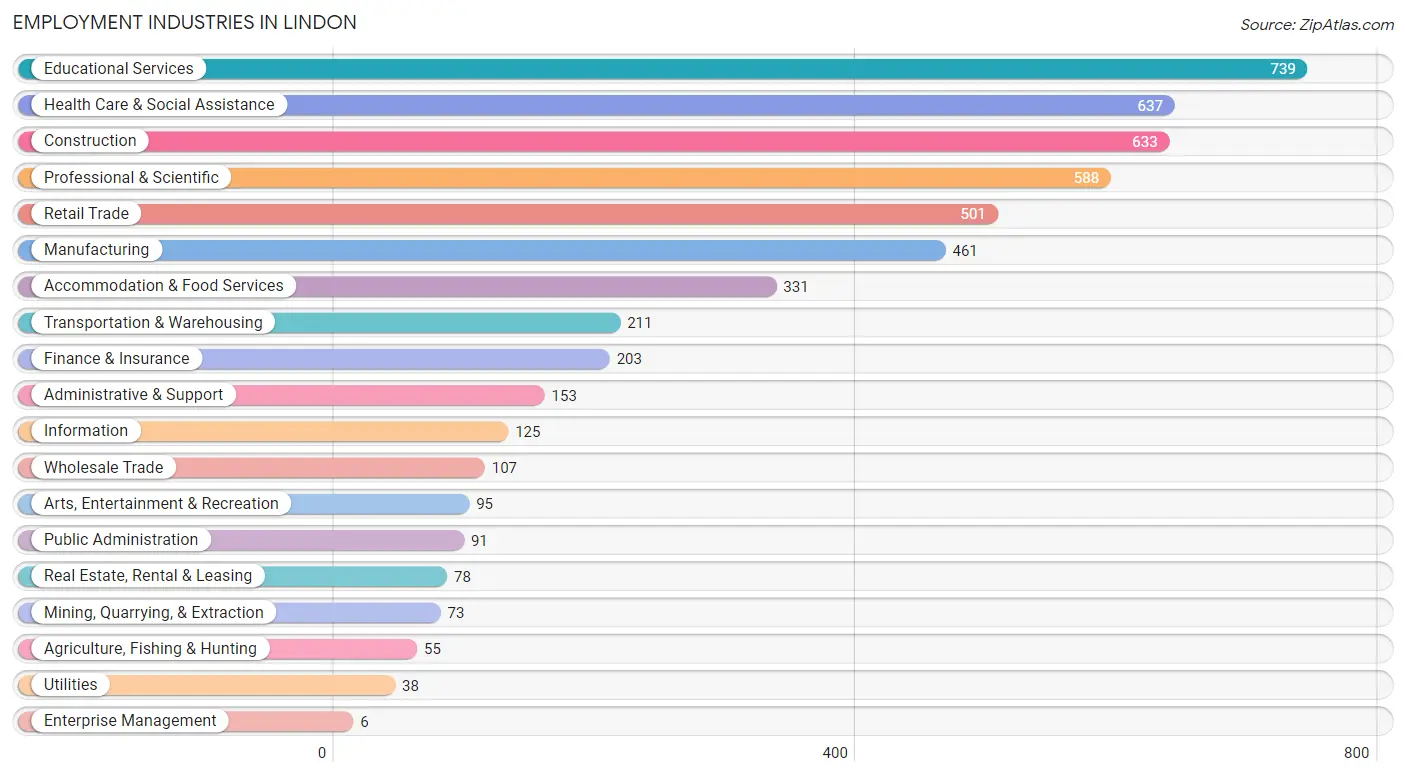
Employment Industries in Lindon
The major employment industries in Lindon include Educational Services (739 | 14.0%), Health Care & Social Assistance (637 | 12.1%), Construction (633 | 12.0%), Professional & Scientific (588 | 11.1%), and Retail Trade (501 | 9.5%).
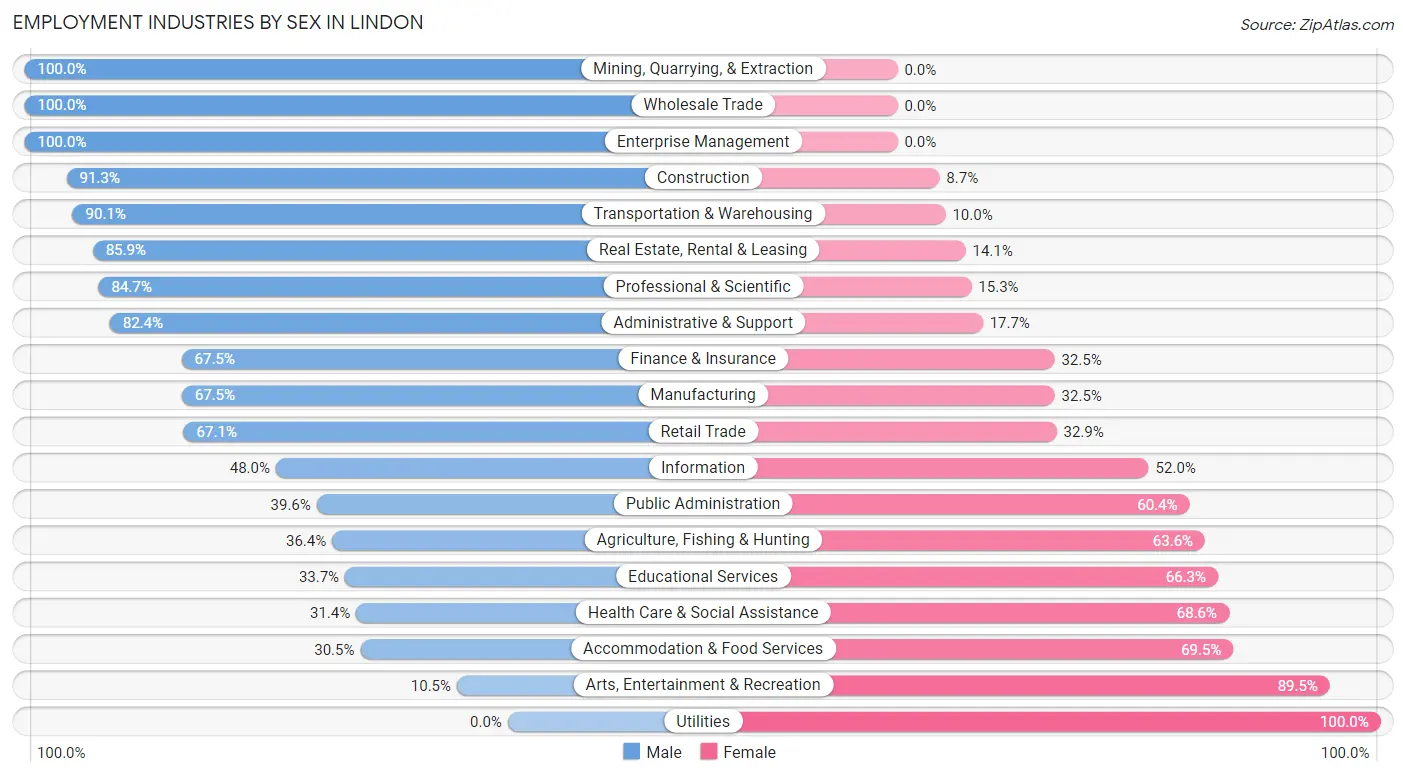
Employment Industries by Sex in Lindon
The Lindon industries that see more men than women are Mining, Quarrying, & Extraction (100.0%), Wholesale Trade (100.0%), and Enterprise Management (100.0%), whereas the industries that tend to have a higher number of women are Utilities (100.0%), Arts, Entertainment & Recreation (89.5%), and Accommodation & Food Services (69.5%).
| Industry | Male | Female |
| Agriculture, Fishing & Hunting | 20 (36.4%) | 35 (63.6%) |
| Mining, Quarrying, & Extraction | 73 (100.0%) | 0 (0.0%) |
| Construction | 578 (91.3%) | 55 (8.7%) |
| Manufacturing | 311 (67.5%) | 150 (32.5%) |
| Wholesale Trade | 107 (100.0%) | 0 (0.0%) |
| Retail Trade | 336 (67.1%) | 165 (32.9%) |
| Transportation & Warehousing | 190 (90.0%) | 21 (10.0%) |
| Utilities | 0 (0.0%) | 38 (100.0%) |
| Information | 60 (48.0%) | 65 (52.0%) |
| Finance & Insurance | 137 (67.5%) | 66 (32.5%) |
| Real Estate, Rental & Leasing | 67 (85.9%) | 11 (14.1%) |
| Professional & Scientific | 498 (84.7%) | 90 (15.3%) |
| Enterprise Management | 6 (100.0%) | 0 (0.0%) |
| Administrative & Support | 126 (82.4%) | 27 (17.6%) |
| Educational Services | 249 (33.7%) | 490 (66.3%) |
| Health Care & Social Assistance | 200 (31.4%) | 437 (68.6%) |
| Arts, Entertainment & Recreation | 10 (10.5%) | 85 (89.5%) |
| Accommodation & Food Services | 101 (30.5%) | 230 (69.5%) |
| Public Administration | 36 (39.6%) | 55 (60.4%) |
| Total | 3,184 (60.3%) | 2,094 (39.7%) |
Education in Lindon
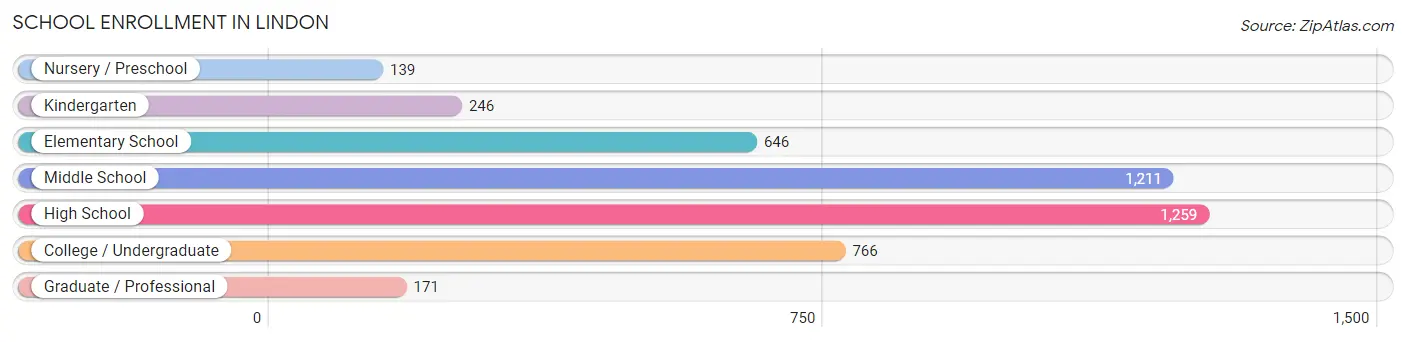
School Enrollment in Lindon
The most common levels of schooling among the 4,438 students in Lindon are high school (1,259 | 28.4%), middle school (1,211 | 27.3%), and college / undergraduate (766 | 17.3%).
| School Level | # Students | % Students |
| Nursery / Preschool | 139 | 3.1% |
| Kindergarten | 246 | 5.5% |
| Elementary School | 646 | 14.6% |
| Middle School | 1,211 | 27.3% |
| High School | 1,259 | 28.4% |
| College / Undergraduate | 766 | 17.3% |
| Graduate / Professional | 171 | 3.8% |
| Total | 4,438 | 100.0% |
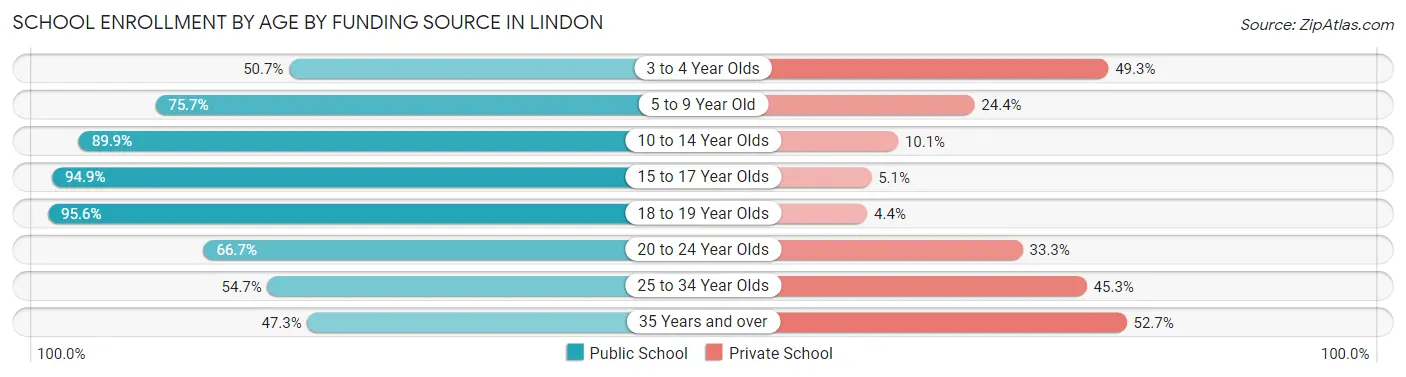
School Enrollment by Age by Funding Source in Lindon
Out of a total of 4,438 students who are enrolled in schools in Lindon, 834 (18.8%) attend a private institution, while the remaining 3,604 (81.2%) are enrolled in public schools. The age group of 35 years and over has the highest likelihood of being enrolled in private schools, with 186 (52.7% in the age bracket) enrolled. Conversely, the age group of 18 to 19 year olds has the lowest likelihood of being enrolled in a private school, with 284 (95.6% in the age bracket) attending a public institution.
| Age Bracket | Public School | Private School |
| 3 to 4 Year Olds | 35 (50.7%) | 34 (49.3%) |
| 5 to 9 Year Old | 665 (75.6%) | 214 (24.3%) |
| 10 to 14 Year Olds | 1,333 (89.9%) | 150 (10.1%) |
| 15 to 17 Year Olds | 776 (94.9%) | 42 (5.1%) |
| 18 to 19 Year Olds | 284 (95.6%) | 13 (4.4%) |
| 20 to 24 Year Olds | 268 (66.7%) | 134 (33.3%) |
| 25 to 34 Year Olds | 75 (54.7%) | 62 (45.3%) |
| 35 Years and over | 167 (47.3%) | 186 (52.7%) |
| Total | 3,604 (81.2%) | 834 (18.8%) |
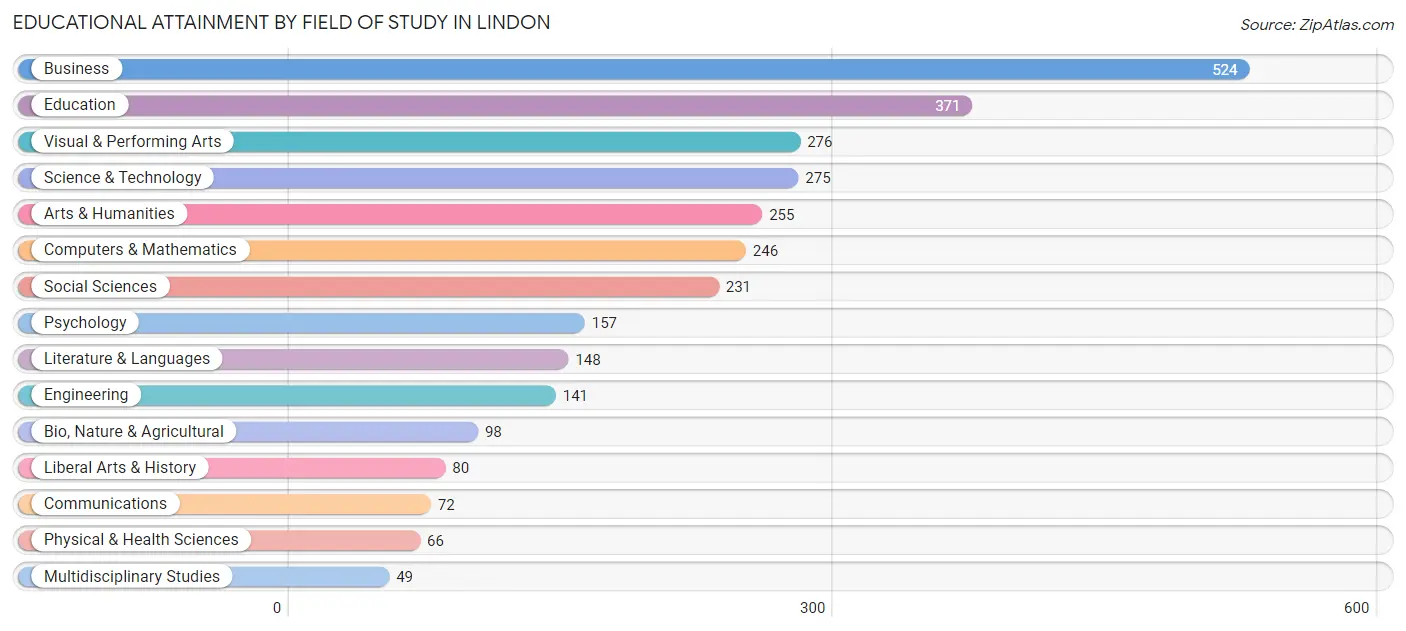
Educational Attainment by Field of Study in Lindon
Business (524 | 17.5%), education (371 | 12.4%), visual & performing arts (276 | 9.2%), science & technology (275 | 9.2%), and arts & humanities (255 | 8.5%) are the most common fields of study among 2,989 individuals in Lindon who have obtained a bachelor's degree or higher.
| Field of Study | # Graduates | % Graduates |
| Computers & Mathematics | 246 | 8.2% |
| Bio, Nature & Agricultural | 98 | 3.3% |
| Physical & Health Sciences | 66 | 2.2% |
| Psychology | 157 | 5.2% |
| Social Sciences | 231 | 7.7% |
| Engineering | 141 | 4.7% |
| Multidisciplinary Studies | 49 | 1.6% |
| Science & Technology | 275 | 9.2% |
| Business | 524 | 17.5% |
| Education | 371 | 12.4% |
| Literature & Languages | 148 | 5.0% |
| Liberal Arts & History | 80 | 2.7% |
| Visual & Performing Arts | 276 | 9.2% |
| Communications | 72 | 2.4% |
| Arts & Humanities | 255 | 8.5% |
| Total | 2,989 | 100.0% |
Transportation & Commute in Lindon
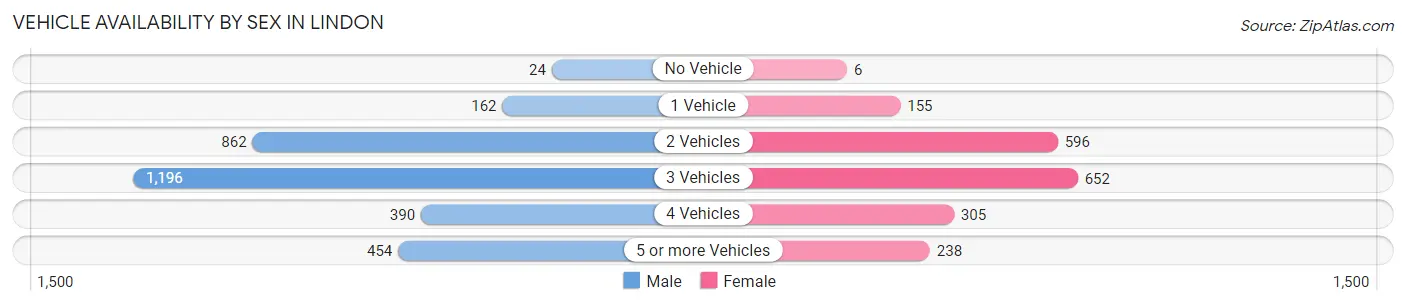
Vehicle Availability by Sex in Lindon
The most prevalent vehicle ownership categories in Lindon are males with 3 vehicles (1,196, accounting for 38.7%) and females with 3 vehicles (652, making up 61.3%).
| Vehicles Available | Male | Female |
| No Vehicle | 24 (0.8%) | 6 (0.3%) |
| 1 Vehicle | 162 (5.2%) | 155 (7.9%) |
| 2 Vehicles | 862 (27.9%) | 596 (30.5%) |
| 3 Vehicles | 1,196 (38.7%) | 652 (33.4%) |
| 4 Vehicles | 390 (12.6%) | 305 (15.6%) |
| 5 or more Vehicles | 454 (14.7%) | 238 (12.2%) |
| Total | 3,088 (100.0%) | 1,952 (100.0%) |
Commute Time in Lindon
The most frequently occuring commute durations in Lindon are 10 to 14 minutes (799 commuters, 19.2%), 20 to 24 minutes (756 commuters, 18.1%), and 15 to 19 minutes (689 commuters, 16.5%).
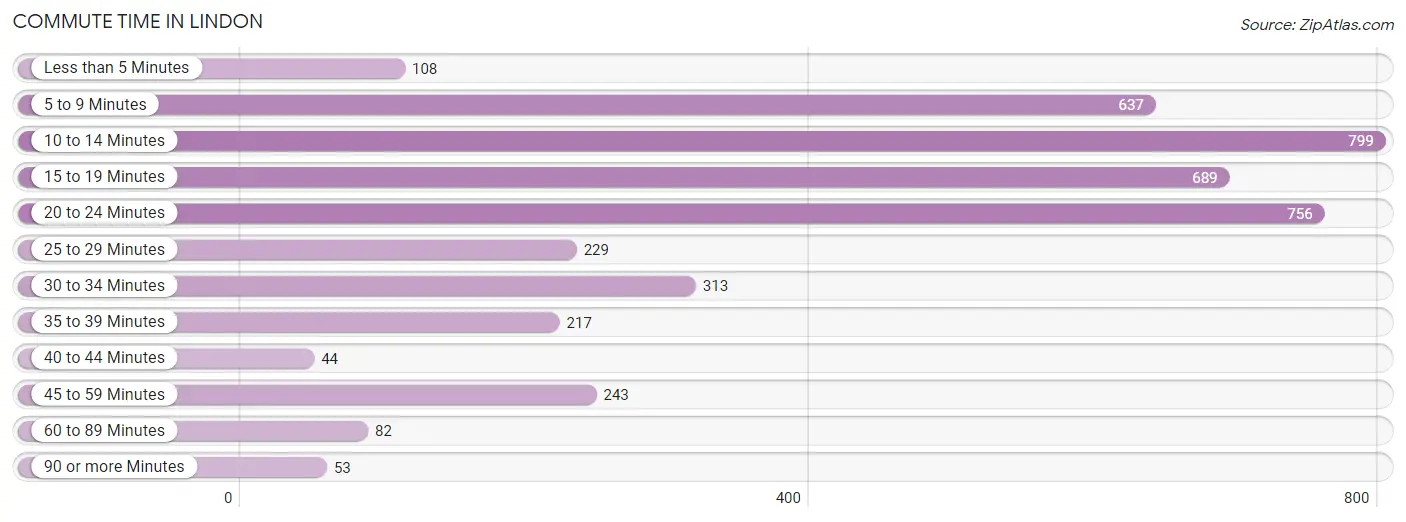
| Commute Time | # Commuters | % Commuters |
| Less than 5 Minutes | 108 | 2.6% |
| 5 to 9 Minutes | 637 | 15.3% |
| 10 to 14 Minutes | 799 | 19.2% |
| 15 to 19 Minutes | 689 | 16.5% |
| 20 to 24 Minutes | 756 | 18.1% |
| 25 to 29 Minutes | 229 | 5.5% |
| 30 to 34 Minutes | 313 | 7.5% |
| 35 to 39 Minutes | 217 | 5.2% |
| 40 to 44 Minutes | 44 | 1.1% |
| 45 to 59 Minutes | 243 | 5.8% |
| 60 to 89 Minutes | 82 | 2.0% |
| 90 or more Minutes | 53 | 1.3% |
Commute Time by Sex in Lindon
The most common commute times in Lindon are 20 to 24 minutes (500 commuters, 19.9%) for males and 10 to 14 minutes (398 commuters, 23.9%) for females.
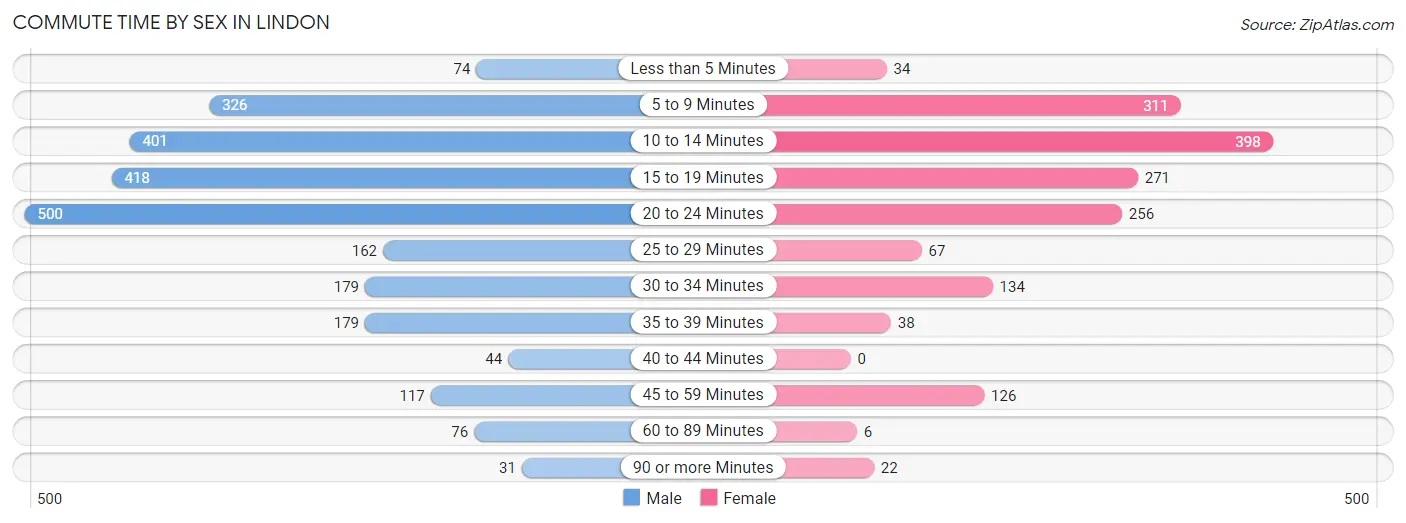
| Commute Time | Male | Female |
| Less than 5 Minutes | 74 (2.9%) | 34 (2.0%) |
| 5 to 9 Minutes | 326 (13.0%) | 311 (18.7%) |
| 10 to 14 Minutes | 401 (16.0%) | 398 (23.9%) |
| 15 to 19 Minutes | 418 (16.7%) | 271 (16.3%) |
| 20 to 24 Minutes | 500 (19.9%) | 256 (15.4%) |
| 25 to 29 Minutes | 162 (6.5%) | 67 (4.0%) |
| 30 to 34 Minutes | 179 (7.1%) | 134 (8.1%) |
| 35 to 39 Minutes | 179 (7.1%) | 38 (2.3%) |
| 40 to 44 Minutes | 44 (1.8%) | 0 (0.0%) |
| 45 to 59 Minutes | 117 (4.7%) | 126 (7.6%) |
| 60 to 89 Minutes | 76 (3.0%) | 6 (0.4%) |
| 90 or more Minutes | 31 (1.2%) | 22 (1.3%) |
Time of Departure to Work by Sex in Lindon
The most frequent times of departure to work in Lindon are 8:00 AM to 8:29 AM (444, 17.7%) for males and 7:30 AM to 7:59 AM (254, 15.3%) for females.
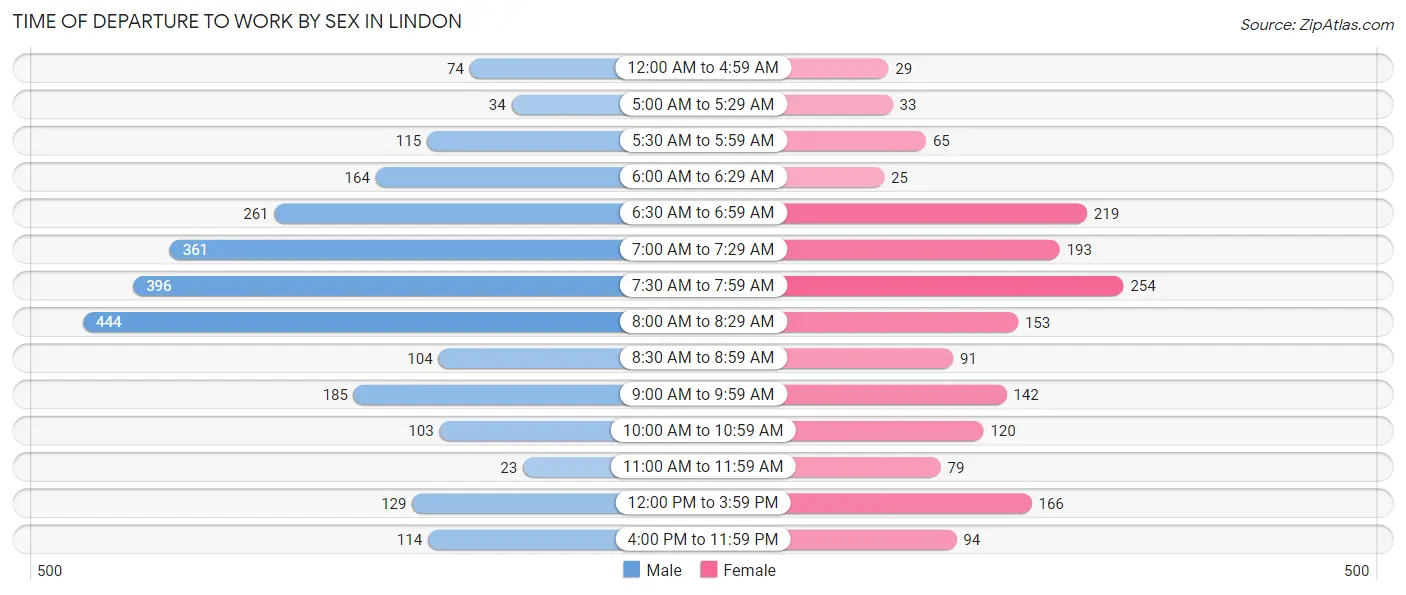
| Time of Departure | Male | Female |
| 12:00 AM to 4:59 AM | 74 (2.9%) | 29 (1.7%) |
| 5:00 AM to 5:29 AM | 34 (1.4%) | 33 (2.0%) |
| 5:30 AM to 5:59 AM | 115 (4.6%) | 65 (3.9%) |
| 6:00 AM to 6:29 AM | 164 (6.5%) | 25 (1.5%) |
| 6:30 AM to 6:59 AM | 261 (10.4%) | 219 (13.2%) |
| 7:00 AM to 7:29 AM | 361 (14.4%) | 193 (11.6%) |
| 7:30 AM to 7:59 AM | 396 (15.8%) | 254 (15.3%) |
| 8:00 AM to 8:29 AM | 444 (17.7%) | 153 (9.2%) |
| 8:30 AM to 8:59 AM | 104 (4.2%) | 91 (5.5%) |
| 9:00 AM to 9:59 AM | 185 (7.4%) | 142 (8.5%) |
| 10:00 AM to 10:59 AM | 103 (4.1%) | 120 (7.2%) |
| 11:00 AM to 11:59 AM | 23 (0.9%) | 79 (4.8%) |
| 12:00 PM to 3:59 PM | 129 (5.1%) | 166 (10.0%) |
| 4:00 PM to 11:59 PM | 114 (4.5%) | 94 (5.7%) |
| Total | 2,507 (100.0%) | 1,663 (100.0%) |
Housing Occupancy in Lindon
Occupancy by Ownership in Lindon
Of the total 3,125 dwellings in Lindon, owner-occupied units account for 2,471 (79.1%), while renter-occupied units make up 654 (20.9%).
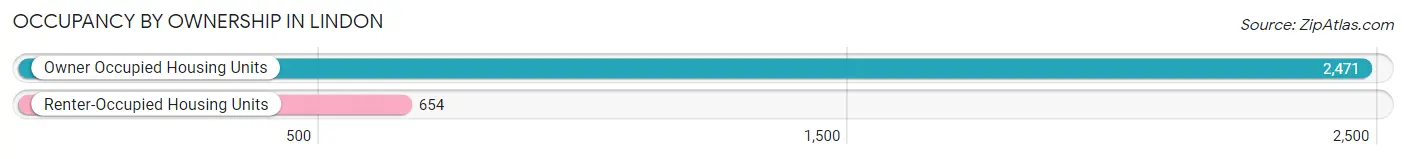
| Occupancy | # Housing Units | % Housing Units |
| Owner Occupied Housing Units | 2,471 | 79.1% |
| Renter-Occupied Housing Units | 654 | 20.9% |
| Total Occupied Housing Units | 3,125 | 100.0% |
Occupancy by Household Size in Lindon
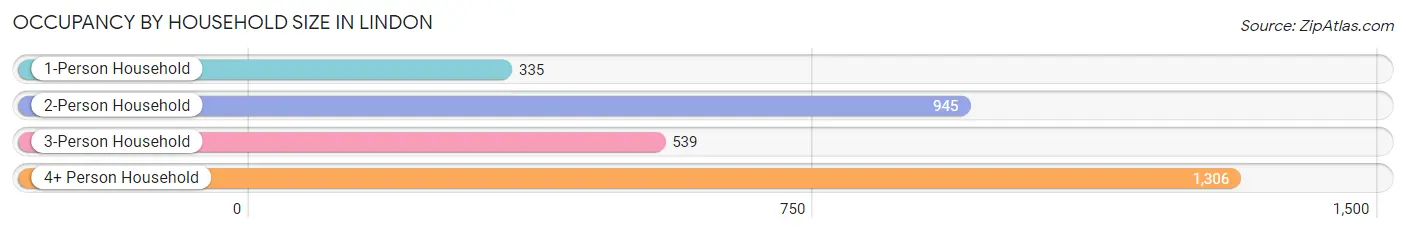
| Household Size | # Housing Units | % Housing Units |
| 1-Person Household | 335 | 10.7% |
| 2-Person Household | 945 | 30.2% |
| 3-Person Household | 539 | 17.2% |
| 4+ Person Household | 1,306 | 41.8% |
| Total Housing Units | 3,125 | 100.0% |
Occupancy by Ownership by Household Size in Lindon
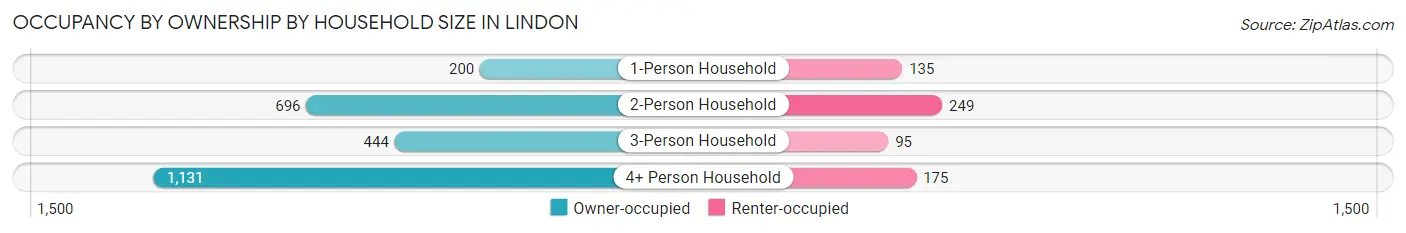
| Household Size | Owner-occupied | Renter-occupied |
| 1-Person Household | 200 (59.7%) | 135 (40.3%) |
| 2-Person Household | 696 (73.7%) | 249 (26.4%) |
| 3-Person Household | 444 (82.4%) | 95 (17.6%) |
| 4+ Person Household | 1,131 (86.6%) | 175 (13.4%) |
| Total Housing Units | 2,471 (79.1%) | 654 (20.9%) |
Occupancy by Educational Attainment in Lindon
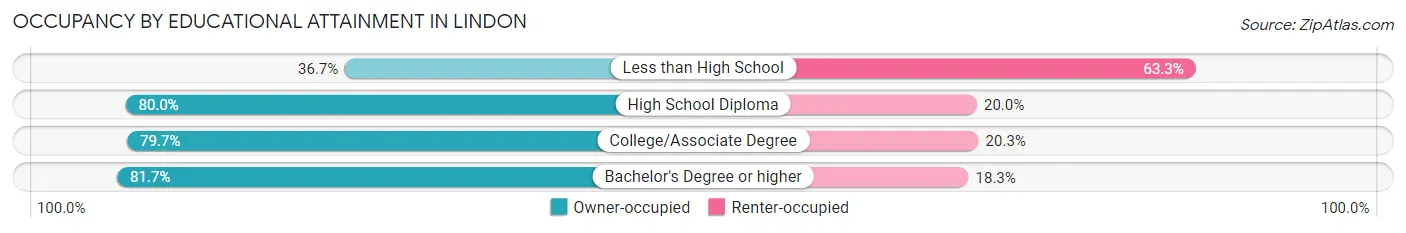
| Household Size | Owner-occupied | Renter-occupied |
| Less than High School | 44 (36.7%) | 76 (63.3%) |
| High School Diploma | 296 (80.0%) | 74 (20.0%) |
| College/Associate Degree | 839 (79.7%) | 214 (20.3%) |
| Bachelor's Degree or higher | 1,292 (81.7%) | 290 (18.3%) |
Occupancy by Age of Householder in Lindon
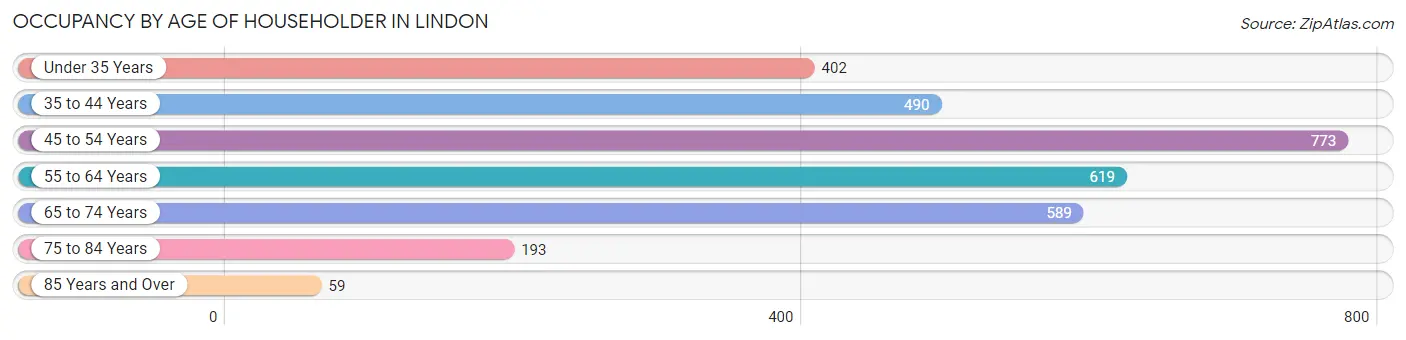
| Age Bracket | # Households | % Households |
| Under 35 Years | 402 | 12.9% |
| 35 to 44 Years | 490 | 15.7% |
| 45 to 54 Years | 773 | 24.7% |
| 55 to 64 Years | 619 | 19.8% |
| 65 to 74 Years | 589 | 18.9% |
| 75 to 84 Years | 193 | 6.2% |
| 85 Years and Over | 59 | 1.9% |
| Total | 3,125 | 100.0% |
Housing Finances in Lindon
Median Income by Occupancy in Lindon
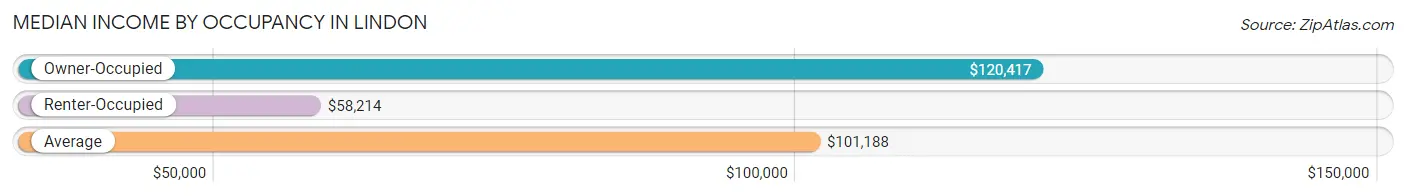
| Occupancy Type | # Households | Median Income |
| Owner-Occupied | 2,471 (79.1%) | $120,417 |
| Renter-Occupied | 654 (20.9%) | $58,214 |
| Average | 3,125 (100.0%) | $101,188 |
Occupancy by Householder Income Bracket in Lindon
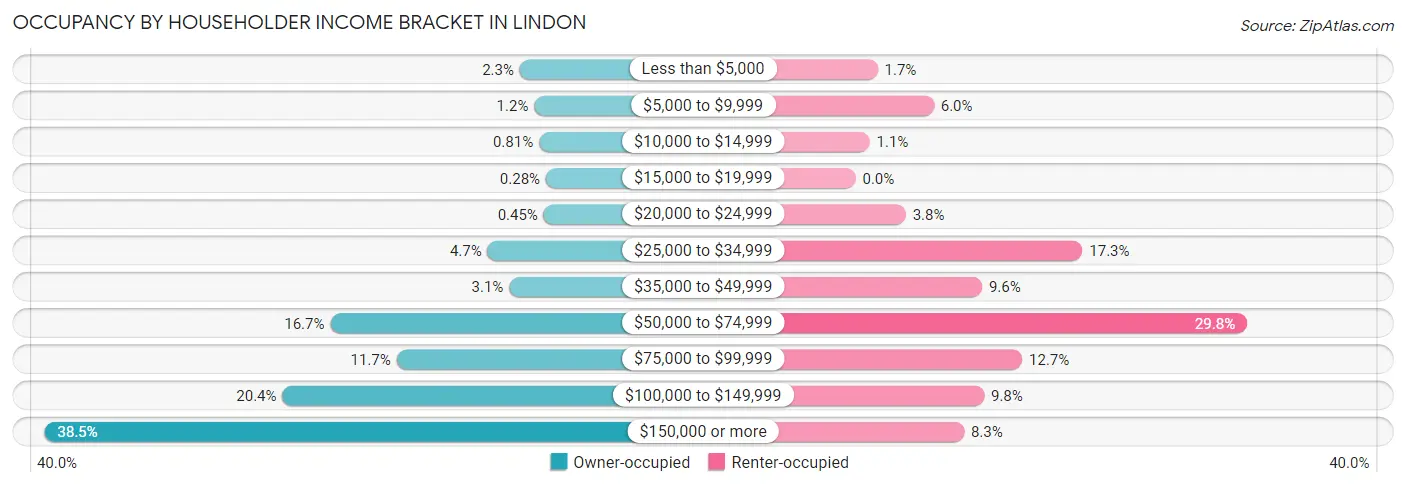
| Income Bracket | Owner-occupied | Renter-occupied |
| Less than $5,000 | 56 (2.3%) | 11 (1.7%) |
| $5,000 to $9,999 | 29 (1.2%) | 39 (6.0%) |
| $10,000 to $14,999 | 20 (0.8%) | 7 (1.1%) |
| $15,000 to $19,999 | 7 (0.3%) | 0 (0.0%) |
| $20,000 to $24,999 | 11 (0.4%) | 25 (3.8%) |
| $25,000 to $34,999 | 117 (4.7%) | 113 (17.3%) |
| $35,000 to $49,999 | 76 (3.1%) | 63 (9.6%) |
| $50,000 to $74,999 | 413 (16.7%) | 195 (29.8%) |
| $75,000 to $99,999 | 288 (11.7%) | 83 (12.7%) |
| $100,000 to $149,999 | 503 (20.4%) | 64 (9.8%) |
| $150,000 or more | 951 (38.5%) | 54 (8.3%) |
| Total | 2,471 (100.0%) | 654 (100.0%) |
Monthly Housing Cost Tiers in Lindon
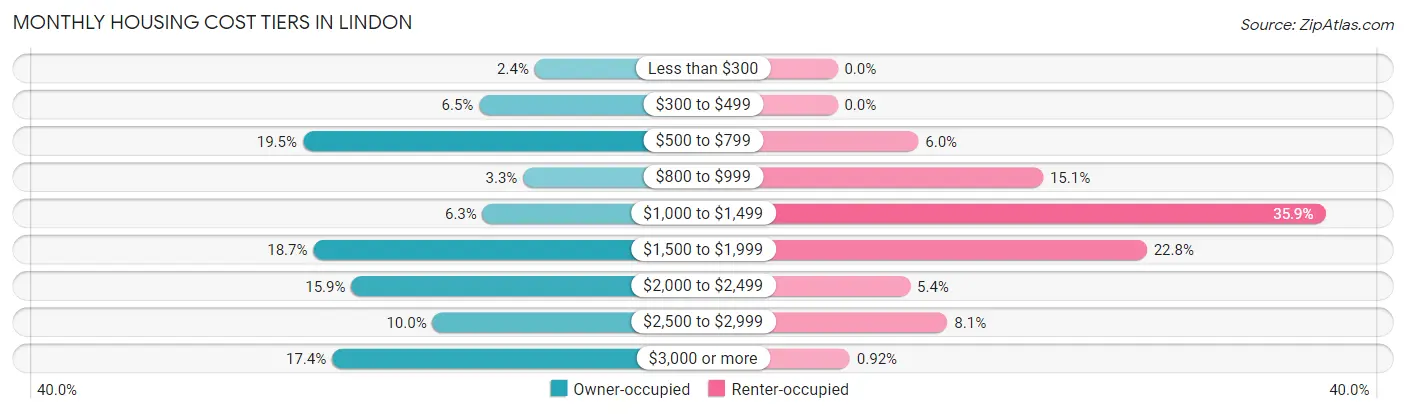
| Monthly Cost | Owner-occupied | Renter-occupied |
| Less than $300 | 60 (2.4%) | 0 (0.0%) |
| $300 to $499 | 161 (6.5%) | 0 (0.0%) |
| $500 to $799 | 482 (19.5%) | 39 (6.0%) |
| $800 to $999 | 81 (3.3%) | 99 (15.1%) |
| $1,000 to $1,499 | 155 (6.3%) | 235 (35.9%) |
| $1,500 to $1,999 | 463 (18.7%) | 149 (22.8%) |
| $2,000 to $2,499 | 394 (15.9%) | 35 (5.3%) |
| $2,500 to $2,999 | 246 (10.0%) | 53 (8.1%) |
| $3,000 or more | 429 (17.4%) | 6 (0.9%) |
| Total | 2,471 (100.0%) | 654 (100.0%) |
Physical Housing Characteristics in Lindon
Housing Structures in Lindon
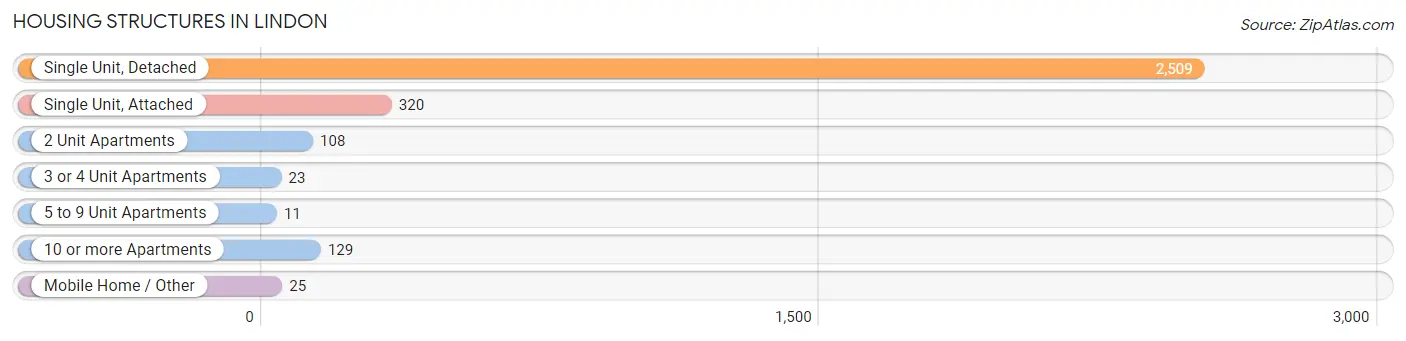
| Structure Type | # Housing Units | % Housing Units |
| Single Unit, Detached | 2,509 | 80.3% |
| Single Unit, Attached | 320 | 10.2% |
| 2 Unit Apartments | 108 | 3.5% |
| 3 or 4 Unit Apartments | 23 | 0.7% |
| 5 to 9 Unit Apartments | 11 | 0.4% |
| 10 or more Apartments | 129 | 4.1% |
| Mobile Home / Other | 25 | 0.8% |
| Total | 3,125 | 100.0% |
Housing Structures by Occupancy in Lindon
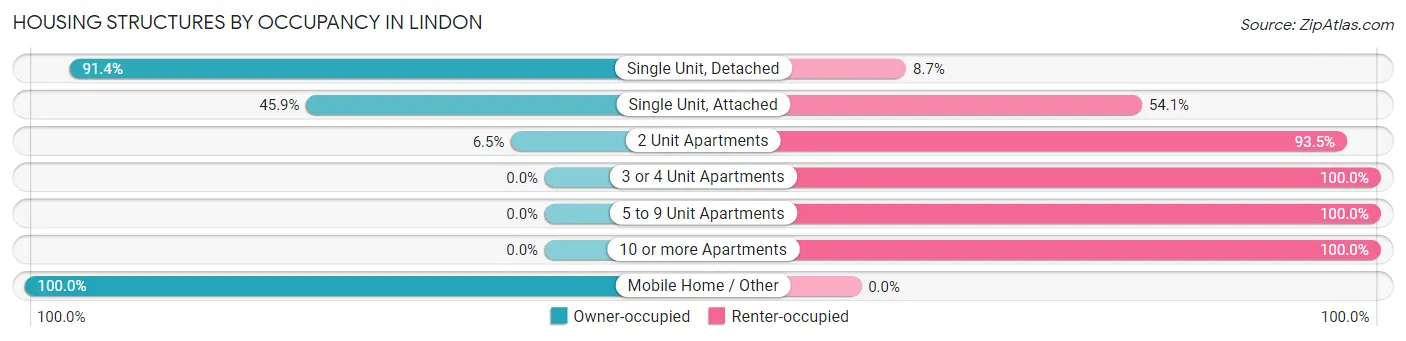
| Structure Type | Owner-occupied | Renter-occupied |
| Single Unit, Detached | 2,292 (91.3%) | 217 (8.6%) |
| Single Unit, Attached | 147 (45.9%) | 173 (54.1%) |
| 2 Unit Apartments | 7 (6.5%) | 101 (93.5%) |
| 3 or 4 Unit Apartments | 0 (0.0%) | 23 (100.0%) |
| 5 to 9 Unit Apartments | 0 (0.0%) | 11 (100.0%) |
| 10 or more Apartments | 0 (0.0%) | 129 (100.0%) |
| Mobile Home / Other | 25 (100.0%) | 0 (0.0%) |
| Total | 2,471 (79.1%) | 654 (20.9%) |
Housing Structures by Number of Rooms in Lindon
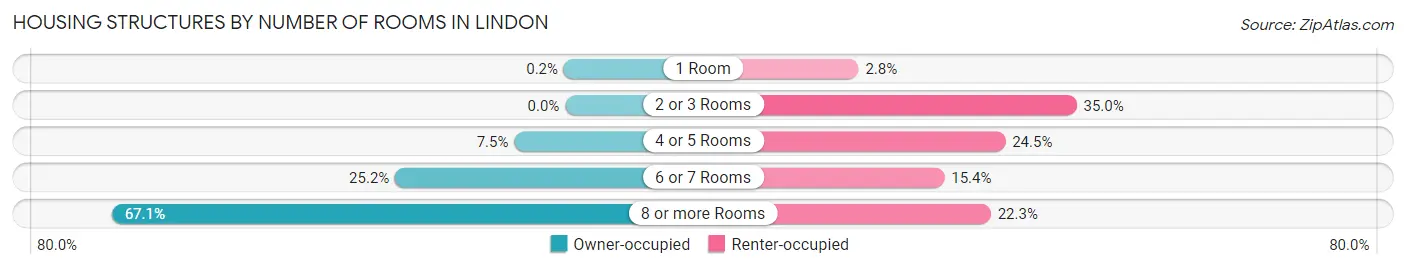
| Number of Rooms | Owner-occupied | Renter-occupied |
| 1 Room | 5 (0.2%) | 18 (2.8%) |
| 2 or 3 Rooms | 0 (0.0%) | 229 (35.0%) |
| 4 or 5 Rooms | 186 (7.5%) | 160 (24.5%) |
| 6 or 7 Rooms | 622 (25.2%) | 101 (15.4%) |
| 8 or more Rooms | 1,658 (67.1%) | 146 (22.3%) |
| Total | 2,471 (100.0%) | 654 (100.0%) |
Housing Structure by Heating Type in Lindon
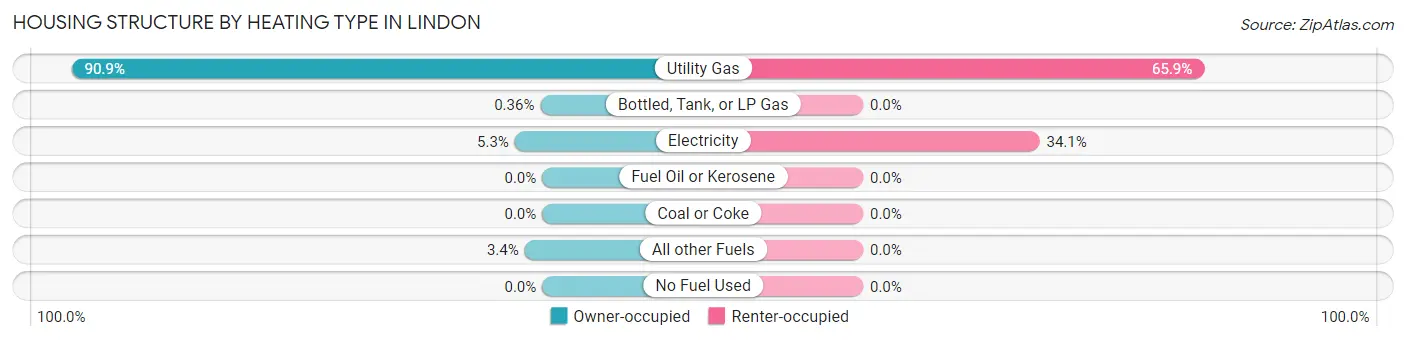
| Heating Type | Owner-occupied | Renter-occupied |
| Utility Gas | 2,247 (90.9%) | 431 (65.9%) |
| Bottled, Tank, or LP Gas | 9 (0.4%) | 0 (0.0%) |
| Electricity | 131 (5.3%) | 223 (34.1%) |
| Fuel Oil or Kerosene | 0 (0.0%) | 0 (0.0%) |
| Coal or Coke | 0 (0.0%) | 0 (0.0%) |
| All other Fuels | 84 (3.4%) | 0 (0.0%) |
| No Fuel Used | 0 (0.0%) | 0 (0.0%) |
| Total | 2,471 (100.0%) | 654 (100.0%) |
Household Vehicle Usage in Lindon
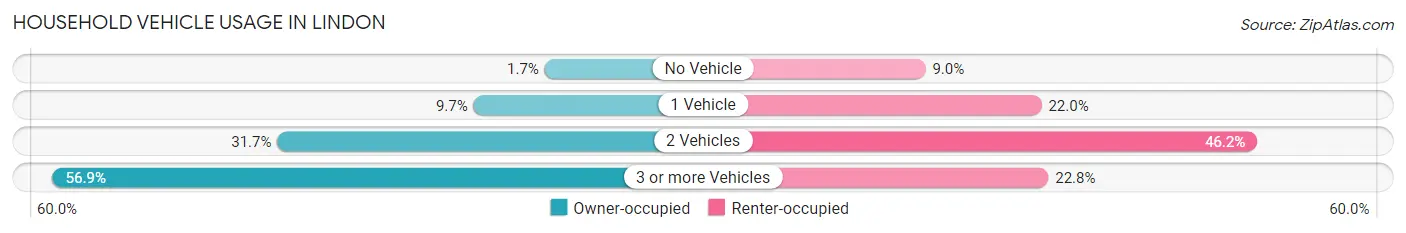
| Vehicles per Household | Owner-occupied | Renter-occupied |
| No Vehicle | 43 (1.7%) | 59 (9.0%) |
| 1 Vehicle | 240 (9.7%) | 144 (22.0%) |
| 2 Vehicles | 783 (31.7%) | 302 (46.2%) |
| 3 or more Vehicles | 1,405 (56.9%) | 149 (22.8%) |
| Total | 2,471 (100.0%) | 654 (100.0%) |
Real Estate & Mortgages in Lindon
Real Estate and Mortgage Overview in Lindon
| Characteristic | Without Mortgage | With Mortgage |
| Housing Units | 758 | 1,713 |
| Median Property Value | $608,200 | $594,700 |
| Median Household Income | $98,750 | $716 |
| Monthly Housing Costs | $604 | $429 |
| Real Estate Taxes | $2,527 | $4 |
Property Value by Mortgage Status in Lindon
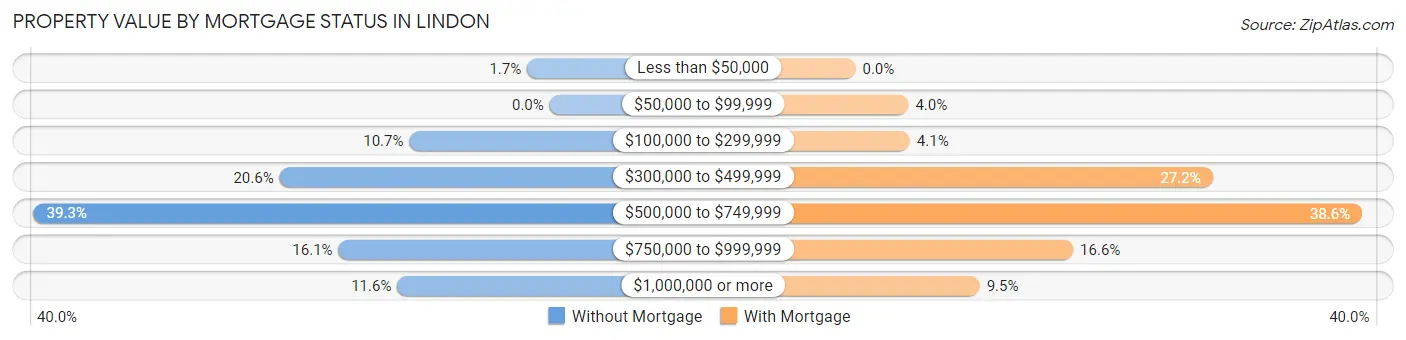
| Property Value | Without Mortgage | With Mortgage |
| Less than $50,000 | 13 (1.7%) | 0 (0.0%) |
| $50,000 to $99,999 | 0 (0.0%) | 69 (4.0%) |
| $100,000 to $299,999 | 81 (10.7%) | 71 (4.1%) |
| $300,000 to $499,999 | 156 (20.6%) | 466 (27.2%) |
| $500,000 to $749,999 | 298 (39.3%) | 661 (38.6%) |
| $750,000 to $999,999 | 122 (16.1%) | 284 (16.6%) |
| $1,000,000 or more | 88 (11.6%) | 162 (9.5%) |
| Total | 758 (100.0%) | 1,713 (100.0%) |
Household Income by Mortgage Status in Lindon
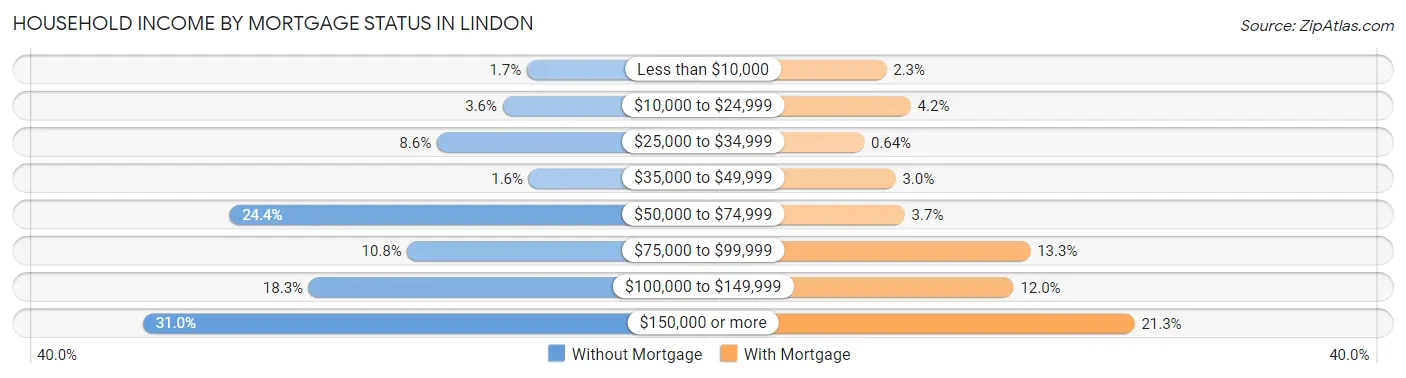
| Household Income | Without Mortgage | With Mortgage |
| Less than $10,000 | 13 (1.7%) | 40 (2.3%) |
| $10,000 to $24,999 | 27 (3.6%) | 72 (4.2%) |
| $25,000 to $34,999 | 65 (8.6%) | 11 (0.6%) |
| $35,000 to $49,999 | 12 (1.6%) | 52 (3.0%) |
| $50,000 to $74,999 | 185 (24.4%) | 64 (3.7%) |
| $75,000 to $99,999 | 82 (10.8%) | 228 (13.3%) |
| $100,000 to $149,999 | 139 (18.3%) | 206 (12.0%) |
| $150,000 or more | 235 (31.0%) | 364 (21.2%) |
| Total | 758 (100.0%) | 1,713 (100.0%) |
Property Value to Household Income Ratio in Lindon
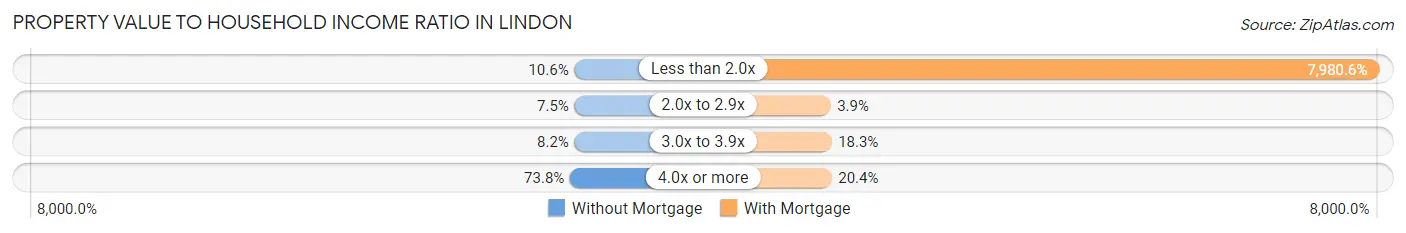
| Value-to-Income Ratio | Without Mortgage | With Mortgage |
| Less than 2.0x | 80 (10.5%) | 136,708 (7,980.6%) |
| 2.0x to 2.9x | 57 (7.5%) | 67 (3.9%) |
| 3.0x to 3.9x | 62 (8.2%) | 313 (18.3%) |
| 4.0x or more | 559 (73.8%) | 350 (20.4%) |
| Total | 758 (100.0%) | 1,713 (100.0%) |
Real Estate Taxes by Mortgage Status in Lindon
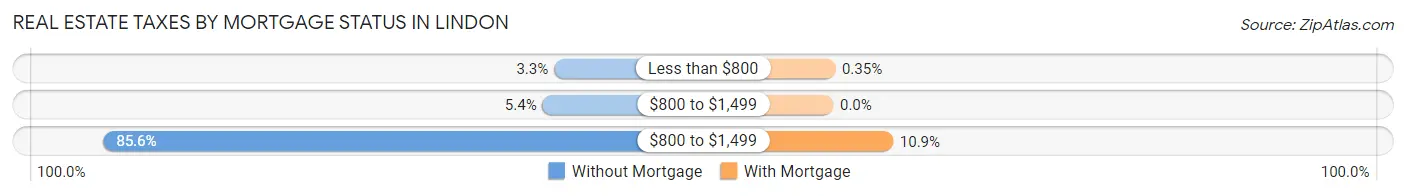
| Property Taxes | Without Mortgage | With Mortgage |
| Less than $800 | 25 (3.3%) | 6 (0.4%) |
| $800 to $1,499 | 41 (5.4%) | 0 (0.0%) |
| $800 to $1,499 | 649 (85.6%) | 187 (10.9%) |
| Total | 758 (100.0%) | 1,713 (100.0%) |
Health & Disability in Lindon
Health Insurance Coverage by Age in Lindon
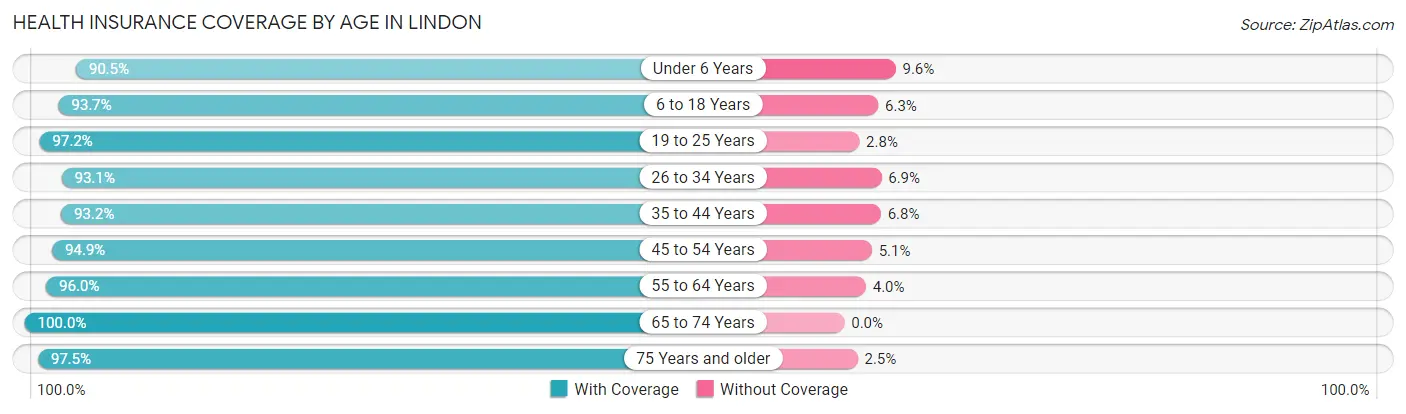
| Age Bracket | With Coverage | Without Coverage |
| Under 6 Years | 701 (90.4%) | 74 (9.6%) |
| 6 to 18 Years | 3,124 (93.7%) | 210 (6.3%) |
| 19 to 25 Years | 1,298 (97.2%) | 37 (2.8%) |
| 26 to 34 Years | 594 (93.1%) | 44 (6.9%) |
| 35 to 44 Years | 1,167 (93.2%) | 85 (6.8%) |
| 45 to 54 Years | 1,411 (94.9%) | 76 (5.1%) |
| 55 to 64 Years | 1,173 (96.0%) | 49 (4.0%) |
| 65 to 74 Years | 1,030 (100.0%) | 0 (0.0%) |
| 75 Years and older | 395 (97.5%) | 10 (2.5%) |
| Total | 10,893 (94.9%) | 585 (5.1%) |
Health Insurance Coverage by Citizenship Status in Lindon

| Citizenship Status | With Coverage | Without Coverage |
| Native Born | 701 (90.4%) | 74 (9.6%) |
| Foreign Born, Citizen | 3,124 (93.7%) | 210 (6.3%) |
| Foreign Born, not a Citizen | 1,298 (97.2%) | 37 (2.8%) |
Health Insurance Coverage by Household Income in Lindon
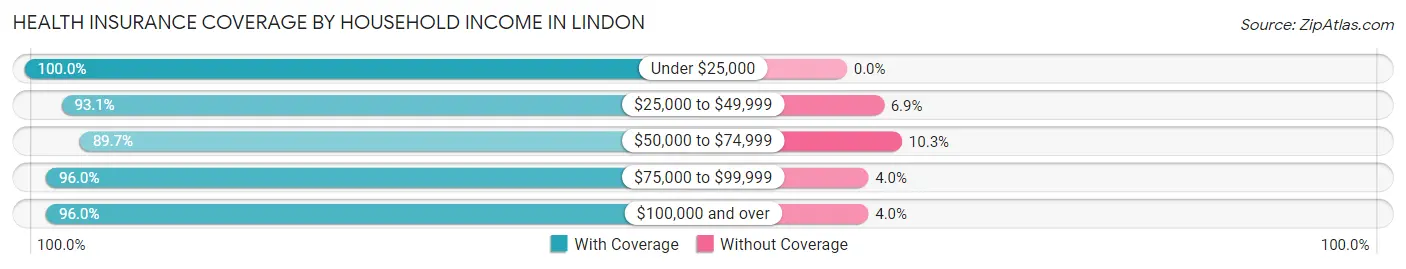
| Household Income | With Coverage | Without Coverage |
| Under $25,000 | 348 (100.0%) | 0 (0.0%) |
| $25,000 to $49,999 | 930 (93.1%) | 69 (6.9%) |
| $50,000 to $74,999 | 1,624 (89.7%) | 187 (10.3%) |
| $75,000 to $99,999 | 1,121 (96.0%) | 47 (4.0%) |
| $100,000 and over | 6,722 (96.0%) | 282 (4.0%) |
Public vs Private Health Insurance Coverage by Age in Lindon
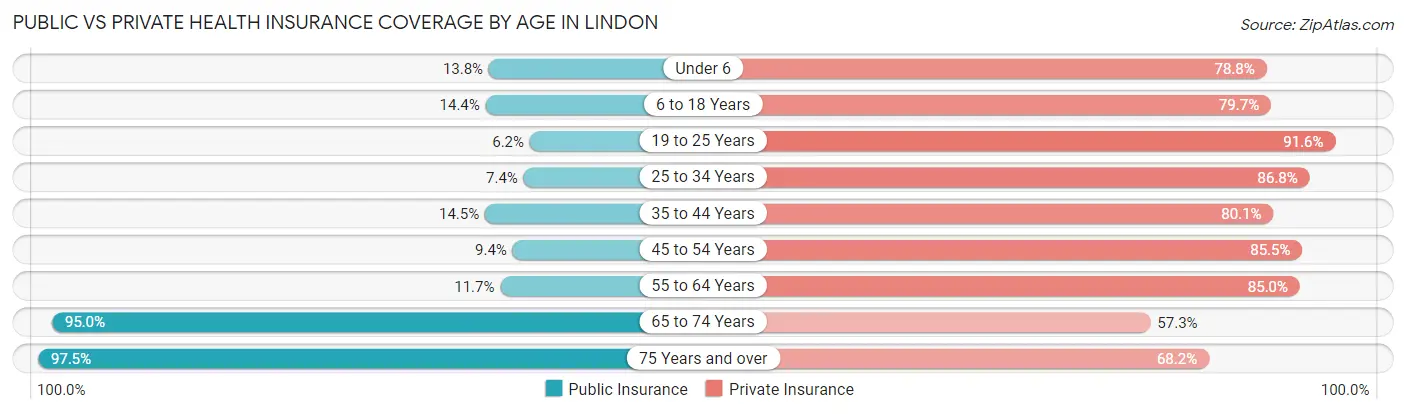
| Age Bracket | Public Insurance | Private Insurance |
| Under 6 | 107 (13.8%) | 611 (78.8%) |
| 6 to 18 Years | 481 (14.4%) | 2,656 (79.7%) |
| 19 to 25 Years | 83 (6.2%) | 1,223 (91.6%) |
| 25 to 34 Years | 47 (7.4%) | 554 (86.8%) |
| 35 to 44 Years | 182 (14.5%) | 1,003 (80.1%) |
| 45 to 54 Years | 140 (9.4%) | 1,271 (85.5%) |
| 55 to 64 Years | 143 (11.7%) | 1,039 (85.0%) |
| 65 to 74 Years | 978 (95.0%) | 590 (57.3%) |
| 75 Years and over | 395 (97.5%) | 276 (68.1%) |
| Total | 2,556 (22.3%) | 9,223 (80.3%) |
Disability Status by Sex by Age in Lindon
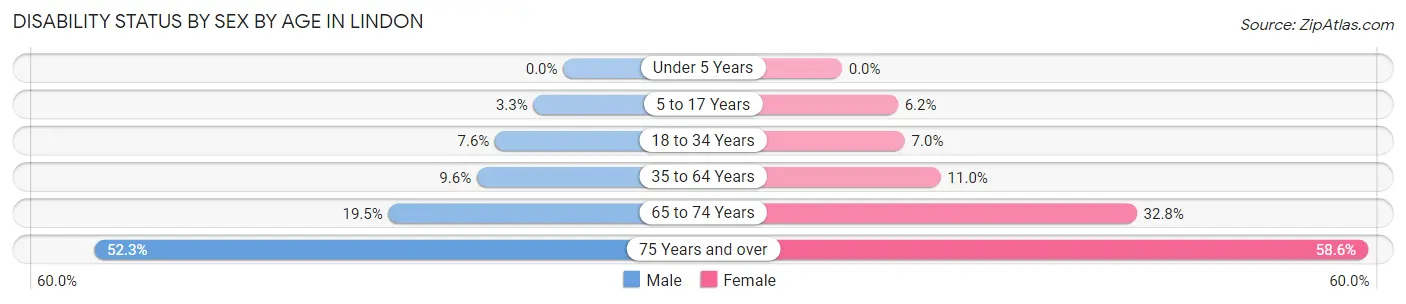
| Age Bracket | Male | Female |
| Under 5 Years | 0 (0.0%) | 0 (0.0%) |
| 5 to 17 Years | 61 (3.3%) | 92 (6.2%) |
| 18 to 34 Years | 102 (7.6%) | 61 (7.0%) |
| 35 to 64 Years | 187 (9.6%) | 222 (11.0%) |
| 65 to 74 Years | 111 (19.5%) | 151 (32.8%) |
| 75 Years and over | 93 (52.2%) | 133 (58.6%) |
Disability Class by Sex by Age in Lindon
Disability Class: Hearing Difficulty
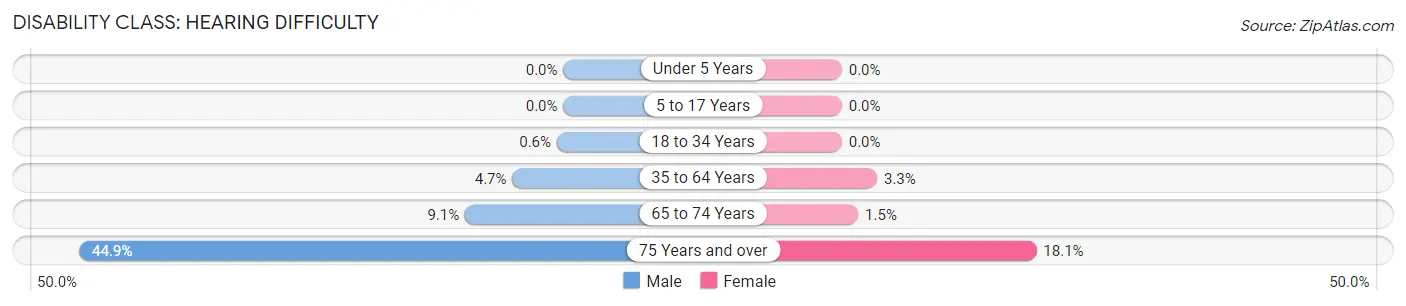
| Age Bracket | Male | Female |
| Under 5 Years | 0 (0.0%) | 0 (0.0%) |
| 5 to 17 Years | 0 (0.0%) | 0 (0.0%) |
| 18 to 34 Years | 8 (0.6%) | 0 (0.0%) |
| 35 to 64 Years | 92 (4.7%) | 66 (3.3%) |
| 65 to 74 Years | 52 (9.1%) | 7 (1.5%) |
| 75 Years and over | 80 (44.9%) | 41 (18.1%) |
Disability Class: Vision Difficulty
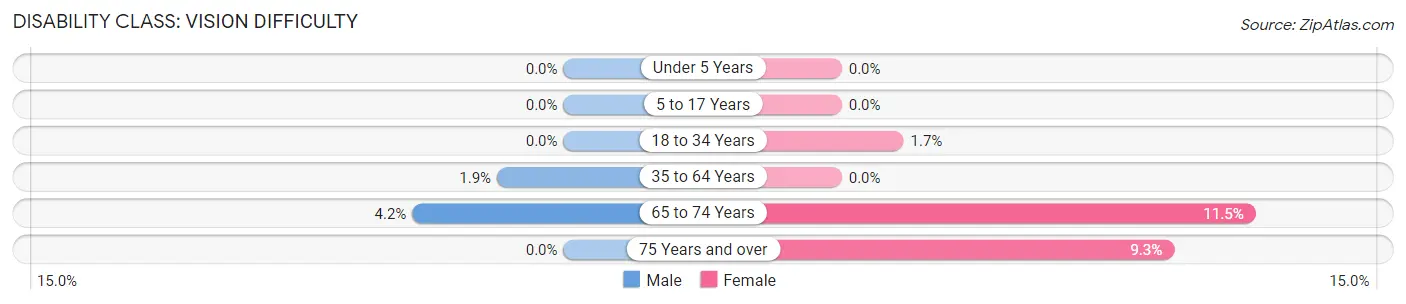
| Age Bracket | Male | Female |
| Under 5 Years | 0 (0.0%) | 0 (0.0%) |
| 5 to 17 Years | 0 (0.0%) | 0 (0.0%) |
| 18 to 34 Years | 0 (0.0%) | 15 (1.7%) |
| 35 to 64 Years | 36 (1.8%) | 0 (0.0%) |
| 65 to 74 Years | 24 (4.2%) | 53 (11.5%) |
| 75 Years and over | 0 (0.0%) | 21 (9.2%) |
Disability Class: Cognitive Difficulty
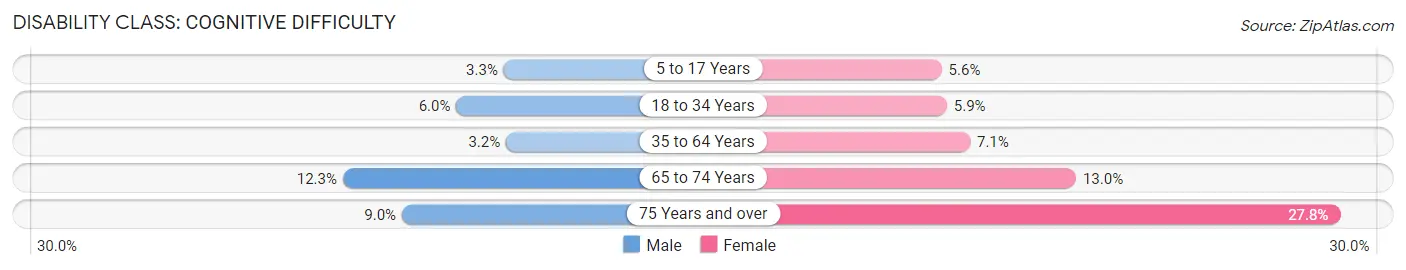
| Age Bracket | Male | Female |
| 5 to 17 Years | 61 (3.3%) | 82 (5.6%) |
| 18 to 34 Years | 80 (6.0%) | 51 (5.9%) |
| 35 to 64 Years | 62 (3.2%) | 144 (7.1%) |
| 65 to 74 Years | 70 (12.3%) | 60 (13.0%) |
| 75 Years and over | 16 (9.0%) | 63 (27.8%) |
Disability Class: Ambulatory Difficulty
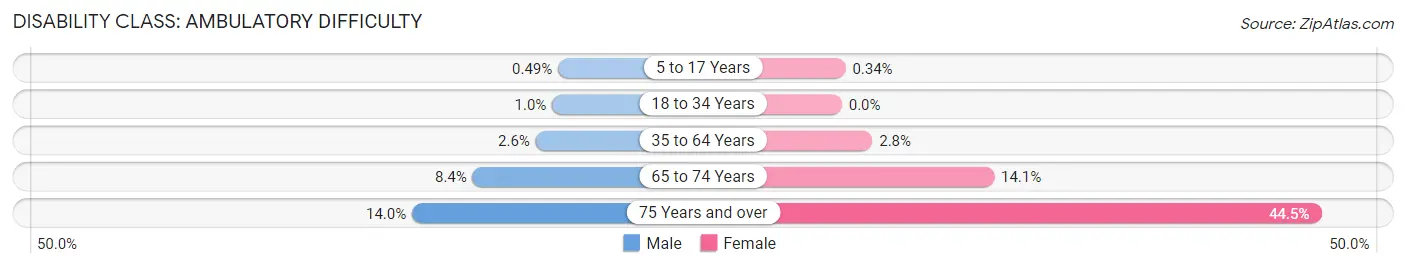
| Age Bracket | Male | Female |
| 5 to 17 Years | 9 (0.5%) | 5 (0.3%) |
| 18 to 34 Years | 14 (1.0%) | 0 (0.0%) |
| 35 to 64 Years | 50 (2.6%) | 57 (2.8%) |
| 65 to 74 Years | 48 (8.4%) | 65 (14.1%) |
| 75 Years and over | 25 (14.0%) | 101 (44.5%) |
Disability Class: Self-Care Difficulty
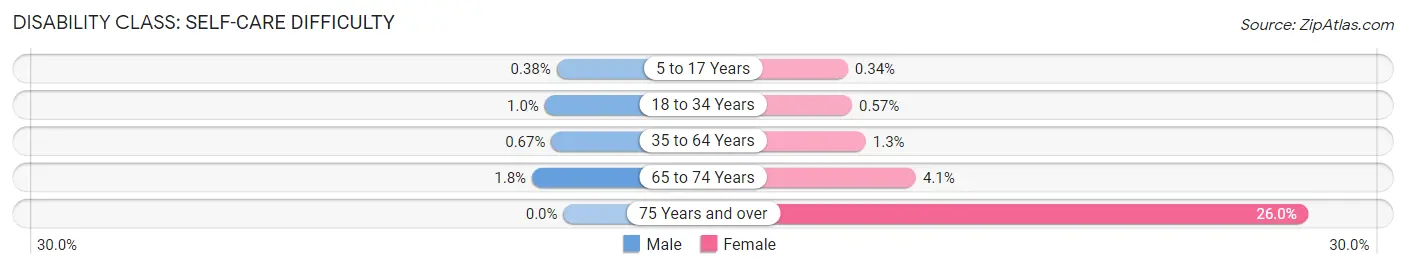
| Age Bracket | Male | Female |
| 5 to 17 Years | 7 (0.4%) | 5 (0.3%) |
| 18 to 34 Years | 14 (1.0%) | 5 (0.6%) |
| 35 to 64 Years | 13 (0.7%) | 27 (1.3%) |
| 65 to 74 Years | 10 (1.8%) | 19 (4.1%) |
| 75 Years and over | 0 (0.0%) | 59 (26.0%) |
Technology Access in Lindon
Computing Device Access in Lindon
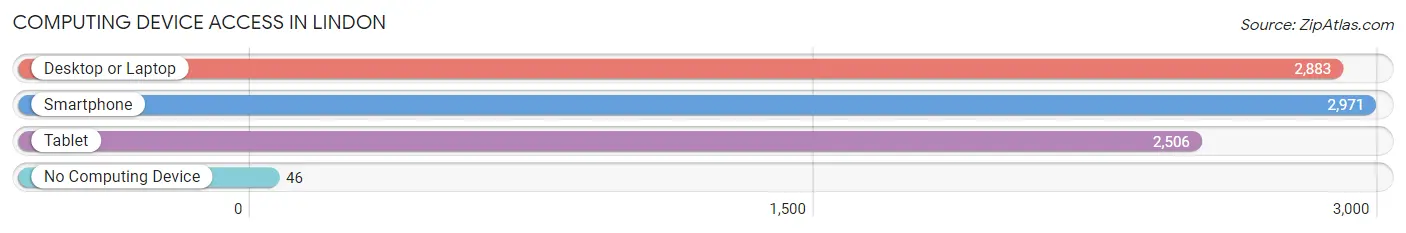
| Device Type | # Households | % Households |
| Desktop or Laptop | 2,883 | 92.3% |
| Smartphone | 2,971 | 95.1% |
| Tablet | 2,506 | 80.2% |
| No Computing Device | 46 | 1.5% |
| Total | 3,125 | 100.0% |
Internet Access in Lindon
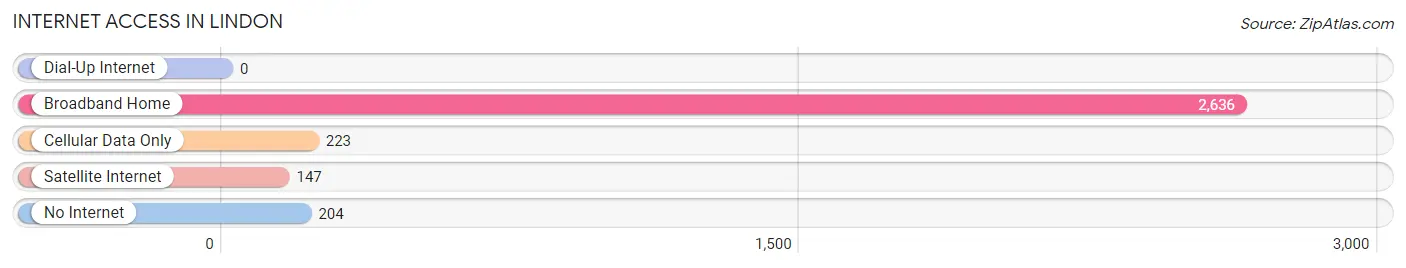
| Internet Type | # Households | % Households |
| Dial-Up Internet | 0 | 0.0% |
| Broadband Home | 2,636 | 84.4% |
| Cellular Data Only | 223 | 7.1% |
| Satellite Internet | 147 | 4.7% |
| No Internet | 204 | 6.5% |
| Total | 3,125 | 100.0% |
Lindon Summary
Lindon, Utah is a small city located in Utah County, Utah, United States. It is part of the Provo-Orem Metropolitan Statistical Area. The city was incorporated in 1920 and has a population of approximately 10,000 people.
Geography
Lindon is located in the northern part of Utah County, Utah, at the base of the Wasatch Mountains. It is bordered by Orem to the south, Pleasant Grove to the east, and American Fork to the north. The city is situated at an elevation of 4,521 feet above sea level. The city covers an area of 4.2 square miles and is located approximately 40 miles south of Salt Lake City.
Climate
Lindon has a semi-arid climate with hot summers and cold winters. The average high temperature in July is 90°F and the average low temperature in January is 22°F. The city receives an average of 17 inches of precipitation per year, with most of it falling in the spring and summer months.
Demographics
As of the 2010 census, there were 9,819 people, 2,945 households, and 2,541 families residing in the city. The population density was 2,346.3 people per square mile. The racial makeup of the city was 94.2% White, 0.7% African American, 0.3% Native American, 1.2% Asian, 0.1% Pacific Islander, 1.7% from other races, and 1.8% from two or more races. Hispanic or Latino of any race were 4.3% of the population.
Economy
Lindon is home to several businesses and industries, including manufacturing, retail, and technology. The city is home to several large companies, including Nu Skin Enterprises, a multi-level marketing company, and Vivint, a home automation and security company. The city is also home to several small businesses, including restaurants, shops, and service providers.
The median household income in Lindon was $71,818 in 2018, and the median family income was $80,945. The unemployment rate in the city was 3.2% in 2018.
History
Lindon was first settled in 1859 by a group of Mormon pioneers led by William H. Seeley. The city was originally named Stringtown, but was later renamed Lindon after a city in the Book of Mormon. The city was incorporated in 1920 and has since grown to become a thriving community.
Lindon is home to several historical sites, including the Lindon Tabernacle, which was built in 1883, and the Lindon City Hall, which was built in 1921. The city is also home to several parks, including the Lindon City Park, which features a playground, picnic areas, and a walking path.
Conclusion
Lindon, Utah is a small city located in Utah County, Utah, United States. It is part of the Provo-Orem Metropolitan Statistical Area and has a population of approximately 10,000 people. The city has a semi-arid climate with hot summers and cold winters. The racial makeup of the city is 94.2% White, 0.7% African American, 0.3% Native American, 1.2% Asian, 0.1% Pacific Islander, 1.7% from other races, and 1.8% from two or more races. The city is home to several businesses and industries, including manufacturing, retail, and technology. The median household income in Lindon was $71,818 in 2018, and the median family income was $80,945. Lindon is home to several historical sites, including the Lindon Tabernacle and the Lindon City Hall. The city is also home to several parks, including the Lindon City Park.
Common Questions
What is Per Capita Income in Lindon?
Per Capita income in Lindon is $35,855.
What is the Median Family Income in Lindon?
Median Family Income in Lindon is $114,741.
What is the Median Household income in Lindon?
Median Household Income in Lindon is $101,188.
What is Income or Wage Gap in Lindon?
Income or Wage Gap in Lindon is 51.0%.
Women in Lindon earn 49.0 cents for every dollar earned by a man.
What is Inequality or Gini Index in Lindon?
Inequality or Gini Index in Lindon is 0.41.
What is the Total Population of Lindon?
Total Population of Lindon is 11,478.
What is the Total Male Population of Lindon?
Total Male Population of Lindon is 6,168.
What is the Total Female Population of Lindon?
Total Female Population of Lindon is 5,310.
What is the Ratio of Males per 100 Females in Lindon?
There are 116.16 Males per 100 Females in Lindon.
What is the Ratio of Females per 100 Males in Lindon?
There are 86.09 Females per 100 Males in Lindon.
What is the Median Population Age in Lindon?
Median Population Age in Lindon is 30.1 Years.
What is the Average Family Size in Lindon
Average Family Size in Lindon is 3.9 People.
What is the Average Household Size in Lindon
Average Household Size in Lindon is 3.6 People.
How Large is the Labor Force in Lindon?
There are 5,480 People in the Labor Forcein in Lindon.
What is the Percentage of People in the Labor Force in Lindon?
66.3% of People are in the Labor Force in Lindon.
What is the Unemployment Rate in Lindon?
Unemployment Rate in Lindon is 3.7%.