Monroe, UT Map & Demographics
Monroe Map
Monroe Overview
$30,793
PER CAPITA INCOME
$74,531
AVG FAMILY INCOME
$62,361
AVG HOUSEHOLD INCOME
60.7%
WAGE / INCOME GAP [ % ]
39.3¢/ $1
WAGE / INCOME GAP [ $ ]
$6,271
FAMILY INCOME DEFICIT
0.41
INEQUALITY / GINI INDEX
2,530
TOTAL POPULATION
1,265
MALE POPULATION
1,265
FEMALE POPULATION
100.00
MALES / 100 FEMALES
100.00
FEMALES / 100 MALES
45.8
MEDIAN AGE
3.2
AVG FAMILY SIZE
2.6
AVG HOUSEHOLD SIZE
1,135
LABOR FORCE [ PEOPLE ]
54.8%
PERCENT IN LABOR FORCE
3.0%
UNEMPLOYMENT RATE
Monroe Zip Codes
Monroe Area Codes
Income in Monroe
Income Overview in Monroe
Per Capita Income in Monroe is $30,793, while median incomes of families and households are $74,531 and $62,361 respectively.
| Characteristic | Number | Measure |
| Per Capita Income | 2,530 | $30,793 |
| Median Family Income | 675 | $74,531 |
| Mean Family Income | 675 | $97,362 |
| Median Household Income | 967 | $62,361 |
| Mean Household Income | 967 | $79,090 |
| Income Deficit | 675 | $6,271 |
| Wage / Income Gap (%) | 2,530 | 60.67% |
| Wage / Income Gap ($) | 2,530 | 39.33¢ per $1 |
| Gini / Inequality Index | 2,530 | 0.41 |
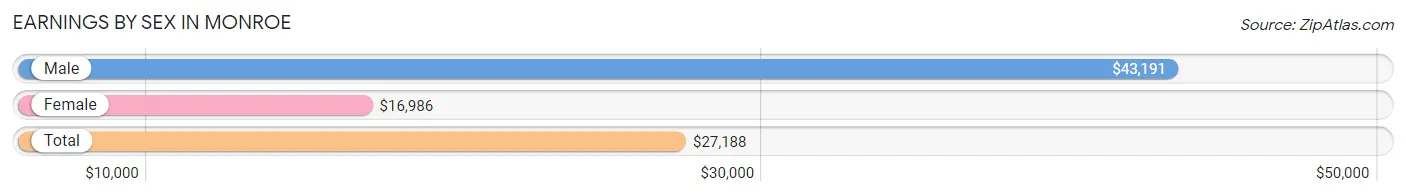
Earnings by Sex in Monroe
Average Earnings in Monroe are $27,188, $43,191 for men and $16,986 for women, a difference of 60.7%.
| Sex | Number | Average Earnings |
| Male | 684 (54.3%) | $43,191 |
| Female | 576 (45.7%) | $16,986 |
| Total | 1,260 (100.0%) | $27,188 |
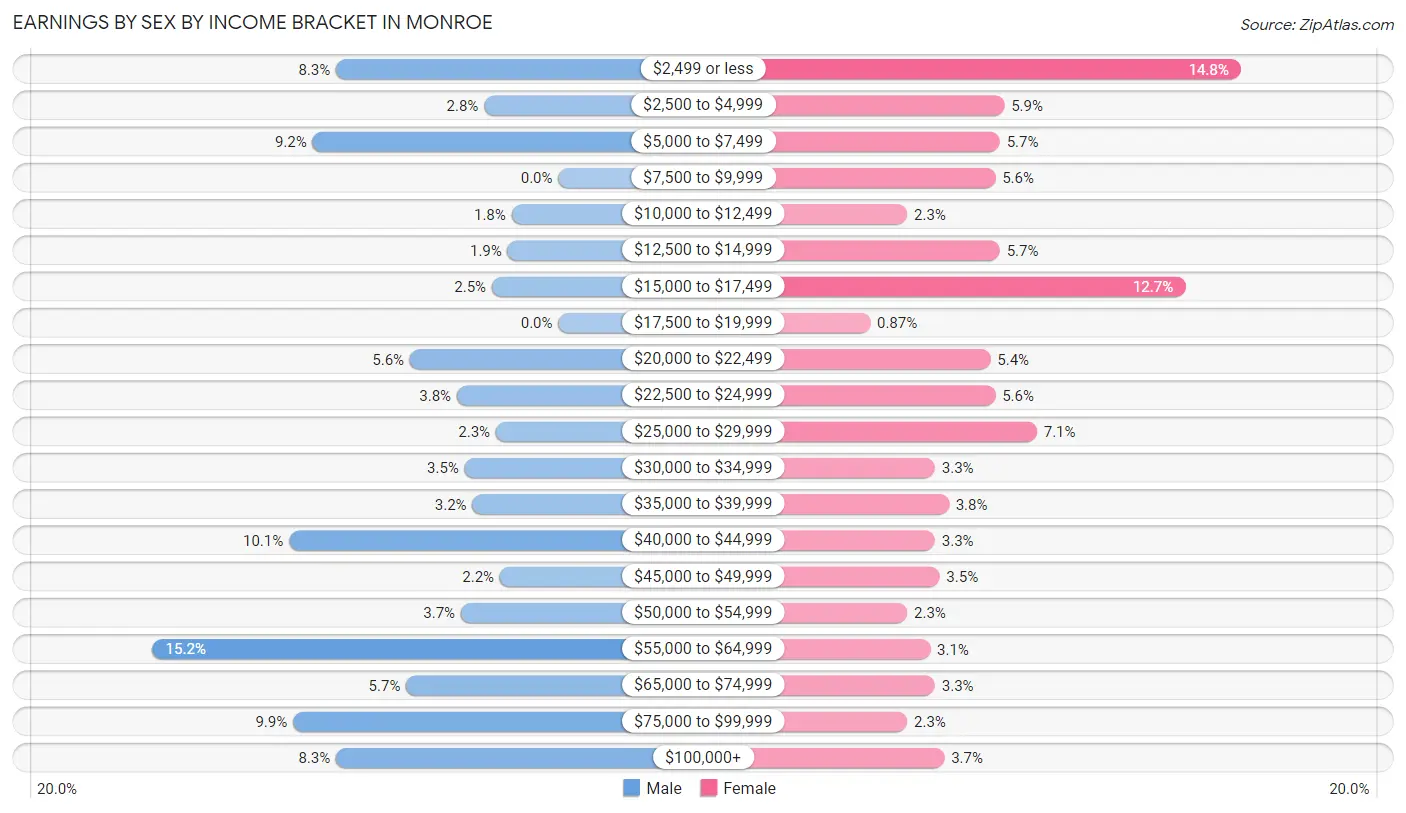
Earnings by Sex by Income Bracket in Monroe
The most common earnings brackets in Monroe are $55,000 to $64,999 for men (104 | 15.2%) and $2,499 or less for women (85 | 14.8%).
| Income | Male | Female |
| $2,499 or less | 57 (8.3%) | 85 (14.8%) |
| $2,500 to $4,999 | 19 (2.8%) | 34 (5.9%) |
| $5,000 to $7,499 | 63 (9.2%) | 33 (5.7%) |
| $7,500 to $9,999 | 0 (0.0%) | 32 (5.6%) |
| $10,000 to $12,499 | 12 (1.8%) | 13 (2.3%) |
| $12,500 to $14,999 | 13 (1.9%) | 33 (5.7%) |
| $15,000 to $17,499 | 17 (2.5%) | 73 (12.7%) |
| $17,500 to $19,999 | 0 (0.0%) | 5 (0.9%) |
| $20,000 to $22,499 | 38 (5.6%) | 31 (5.4%) |
| $22,500 to $24,999 | 26 (3.8%) | 32 (5.6%) |
| $25,000 to $29,999 | 16 (2.3%) | 41 (7.1%) |
| $30,000 to $34,999 | 24 (3.5%) | 19 (3.3%) |
| $35,000 to $39,999 | 22 (3.2%) | 22 (3.8%) |
| $40,000 to $44,999 | 69 (10.1%) | 19 (3.3%) |
| $45,000 to $49,999 | 15 (2.2%) | 20 (3.5%) |
| $50,000 to $54,999 | 25 (3.6%) | 13 (2.3%) |
| $55,000 to $64,999 | 104 (15.2%) | 18 (3.1%) |
| $65,000 to $74,999 | 39 (5.7%) | 19 (3.3%) |
| $75,000 to $99,999 | 68 (9.9%) | 13 (2.3%) |
| $100,000+ | 57 (8.3%) | 21 (3.6%) |
| Total | 684 (100.0%) | 576 (100.0%) |
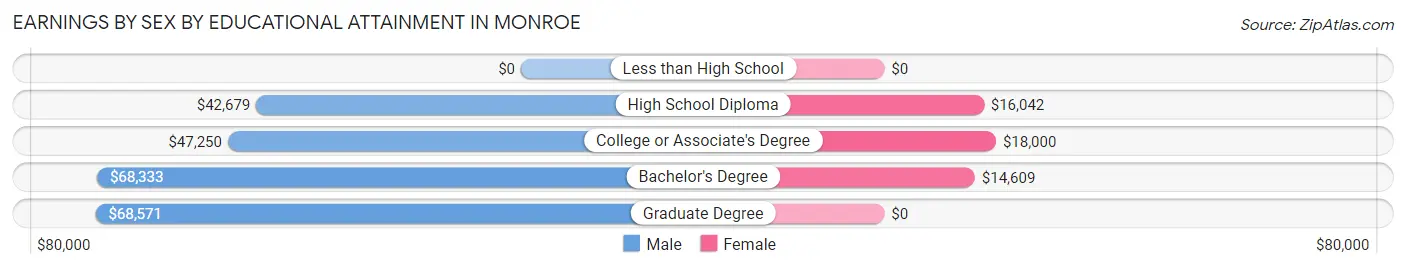
Earnings by Sex by Educational Attainment in Monroe
Average earnings in Monroe are $56,369 for men and $21,089 for women, a difference of 62.6%. Men with an educational attainment of graduate degree enjoy the highest average annual earnings of $68,571, while those with high school diploma education earn the least with $42,679. Women with an educational attainment of college or associate's degree earn the most with the average annual earnings of $18,000, while those with bachelor's degree education have the smallest earnings of $14,609.
| Educational Attainment | Male Income | Female Income |
| Less than High School | - | - |
| High School Diploma | $42,679 | $16,042 |
| College or Associate's Degree | $47,250 | $18,000 |
| Bachelor's Degree | $68,333 | $14,609 |
| Graduate Degree | $68,571 | $0 |
| Total | $56,369 | $21,089 |
Family Income in Monroe
Family Income Brackets in Monroe
According to the Monroe family income data, there are 201 families falling into the $50,000 to $74,999 income range, which is the most common income bracket and makes up 29.8% of all families.
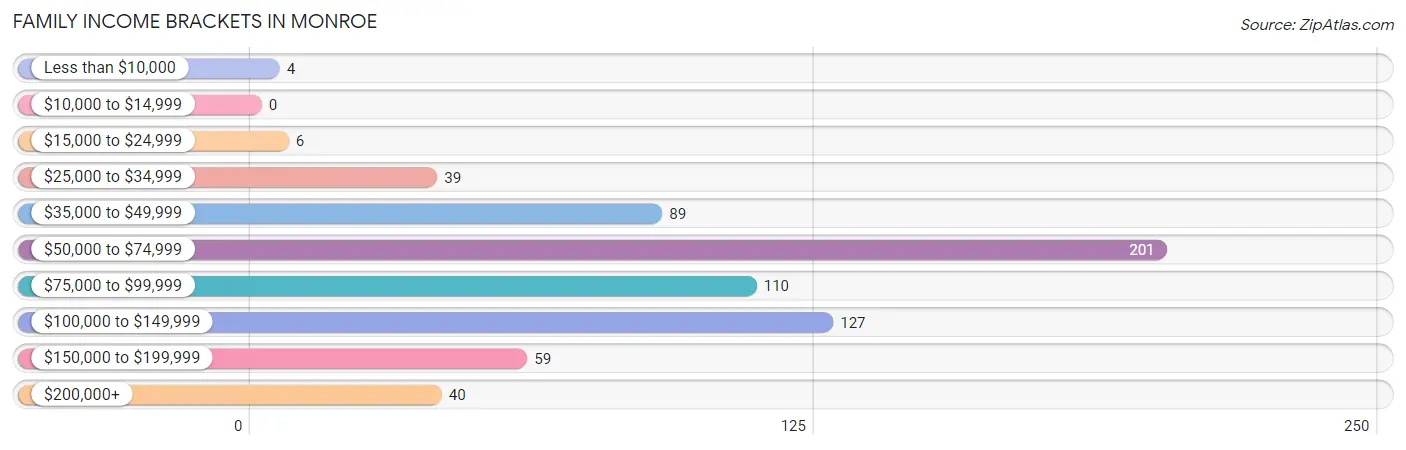
| Income Bracket | # Families | % Families |
| Less than $10,000 | 4 | 0.6% |
| $10,000 to $14,999 | 0 | 0.0% |
| $15,000 to $24,999 | 6 | 0.9% |
| $25,000 to $34,999 | 39 | 5.8% |
| $35,000 to $49,999 | 89 | 13.2% |
| $50,000 to $74,999 | 201 | 29.8% |
| $75,000 to $99,999 | 110 | 16.3% |
| $100,000 to $149,999 | 127 | 18.8% |
| $150,000 to $199,999 | 59 | 8.7% |
| $200,000+ | 40 | 5.9% |
Family Income by Famaliy Size in Monroe
3-person families (115 | 17.0%) account for the highest median family income in Monroe with $123,221 per family, while 3-person families (115 | 17.0%) have the highest median income of $41,074 per family member.
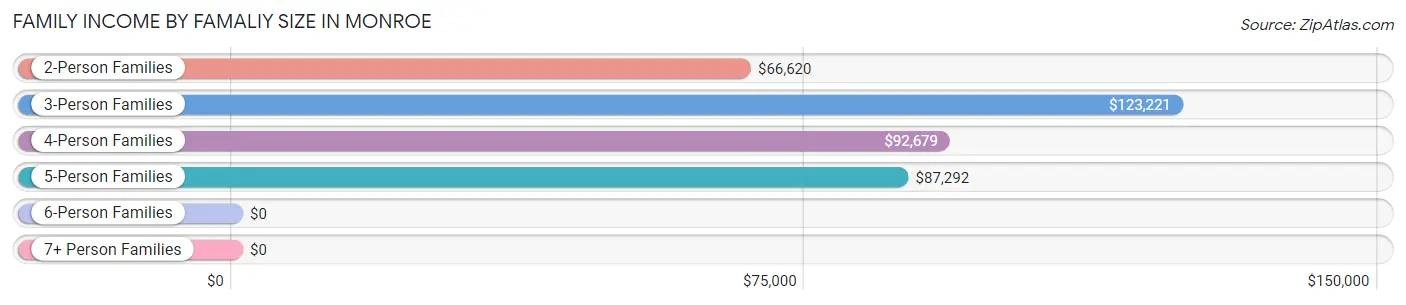
| Income Bracket | # Families | Median Income |
| 2-Person Families | 353 (52.3%) | $66,620 |
| 3-Person Families | 115 (17.0%) | $123,221 |
| 4-Person Families | 75 (11.1%) | $92,679 |
| 5-Person Families | 65 (9.6%) | $87,292 |
| 6-Person Families | 44 (6.5%) | $0 |
| 7+ Person Families | 23 (3.4%) | $0 |
| Total | 675 (100.0%) | $74,531 |
Family Income by Number of Earners in Monroe
The median family income in Monroe is $74,531, with families comprising 3+ earners (78) having the highest median family income of $116,250, while families with no earners (140) have the lowest median family income of $65,455, accounting for 11.6% and 20.7% of families, respectively.
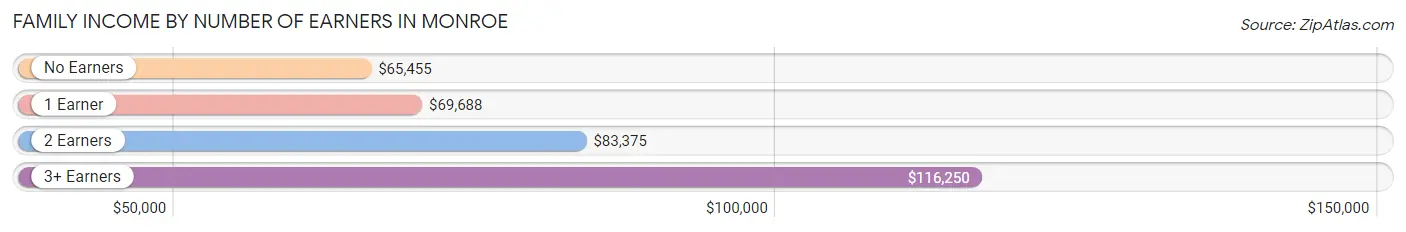
| Number of Earners | # Families | Median Income |
| No Earners | 140 (20.7%) | $65,455 |
| 1 Earner | 174 (25.8%) | $69,688 |
| 2 Earners | 283 (41.9%) | $83,375 |
| 3+ Earners | 78 (11.6%) | $116,250 |
| Total | 675 (100.0%) | $74,531 |
Household Income in Monroe
Household Income Brackets in Monroe
With 283 households falling in the category, the $50,000 to $74,999 income range is the most frequent in Monroe, accounting for 29.3% of all households. In contrast, only 33 households (3.4%) fall into the $10,000 to $14,999 income bracket, making it the least populous group.
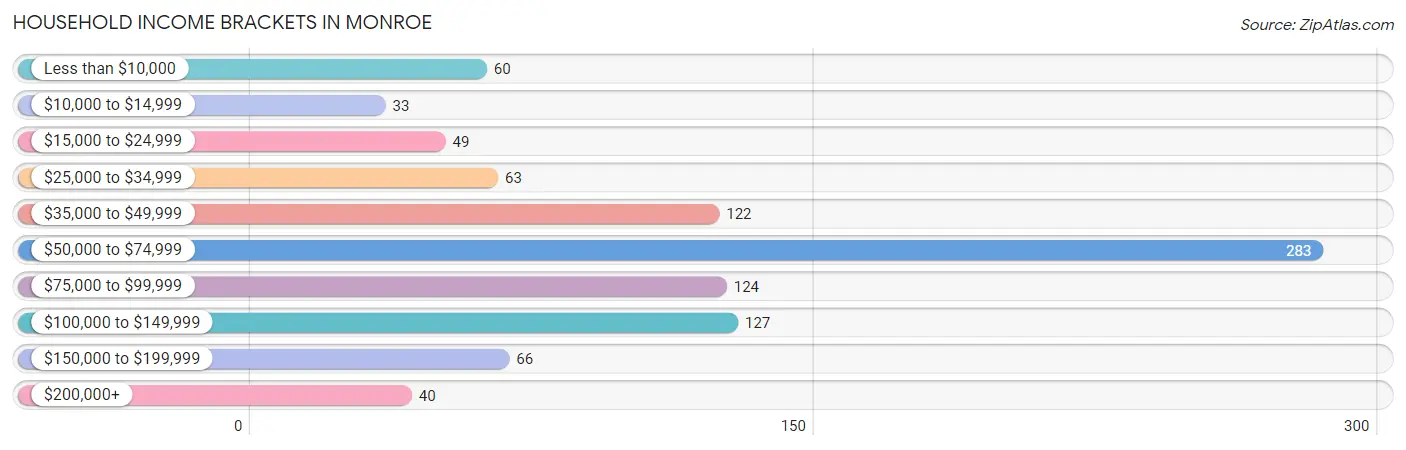
| Income Bracket | # Households | % Households |
| Less than $10,000 | 60 | 6.2% |
| $10,000 to $14,999 | 33 | 3.4% |
| $15,000 to $24,999 | 49 | 5.1% |
| $25,000 to $34,999 | 63 | 6.5% |
| $35,000 to $49,999 | 122 | 12.6% |
| $50,000 to $74,999 | 283 | 29.3% |
| $75,000 to $99,999 | 124 | 12.8% |
| $100,000 to $149,999 | 127 | 13.1% |
| $150,000 to $199,999 | 66 | 6.8% |
| $200,000+ | 40 | 4.1% |
Household Income by Householder Age in Monroe
The median household income in Monroe is $62,361, with the highest median household income of $91,339 found in the 25 to 44 years age bracket for the primary householder. A total of 183 households (18.9%) fall into this category. Meanwhile, the 15 to 24 years age bracket for the primary householder has the lowest median household income of $0, with 23 households (2.4%) in this group.
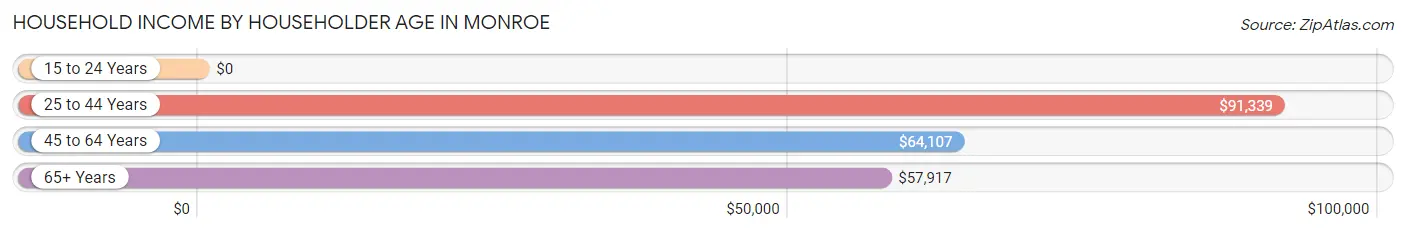
| Income Bracket | # Households | Median Income |
| 15 to 24 Years | 23 (2.4%) | $0 |
| 25 to 44 Years | 183 (18.9%) | $91,339 |
| 45 to 64 Years | 440 (45.5%) | $64,107 |
| 65+ Years | 321 (33.2%) | $57,917 |
| Total | 967 (100.0%) | $62,361 |
Poverty in Monroe
Income Below Poverty by Sex and Age in Monroe
With 4.4% poverty level for males and 14.2% for females among the residents of Monroe, 6 to 11 year old males and under 5 year old females are the most vulnerable to poverty, with 16 males (18.0%) and 19 females (45.2%) in their respective age groups living below the poverty level.
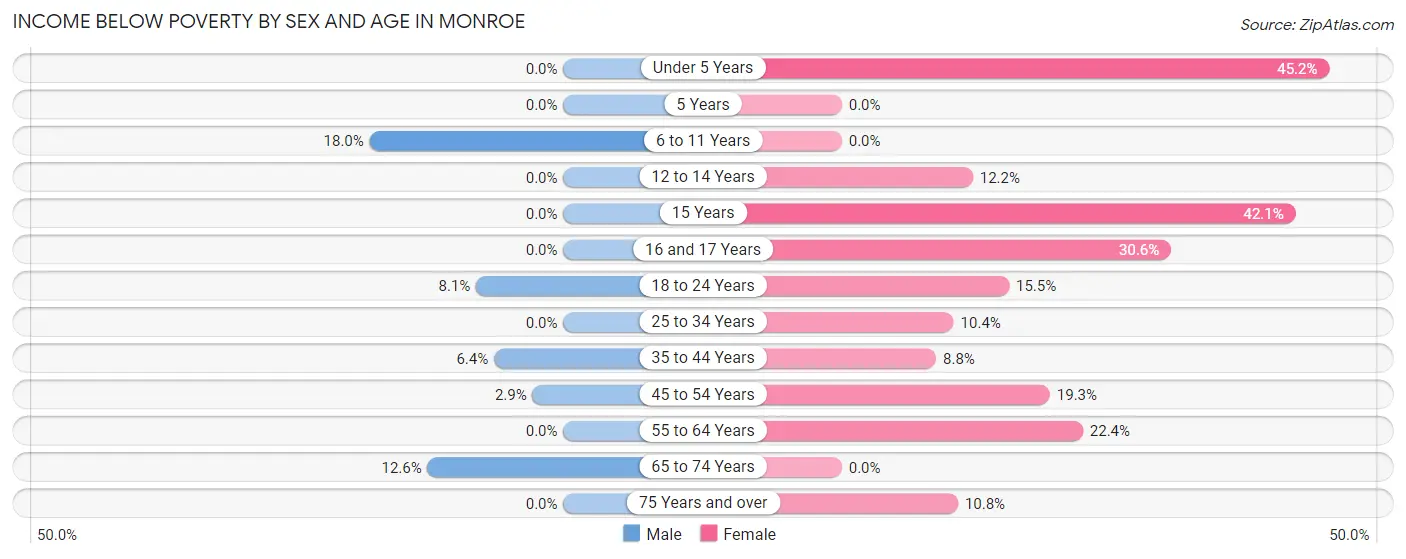
| Age Bracket | Male | Female |
| Under 5 Years | 0 (0.0%) | 19 (45.2%) |
| 5 Years | 0 (0.0%) | 0 (0.0%) |
| 6 to 11 Years | 16 (18.0%) | 0 (0.0%) |
| 12 to 14 Years | 0 (0.0%) | 9 (12.2%) |
| 15 Years | 0 (0.0%) | 8 (42.1%) |
| 16 and 17 Years | 0 (0.0%) | 11 (30.6%) |
| 18 to 24 Years | 11 (8.1%) | 9 (15.5%) |
| 25 to 34 Years | 0 (0.0%) | 11 (10.4%) |
| 35 to 44 Years | 9 (6.4%) | 14 (8.7%) |
| 45 to 54 Years | 4 (2.9%) | 28 (19.3%) |
| 55 to 64 Years | 0 (0.0%) | 51 (22.4%) |
| 65 to 74 Years | 16 (12.6%) | 0 (0.0%) |
| 75 Years and over | 0 (0.0%) | 18 (10.8%) |
| Total | 56 (4.4%) | 178 (14.2%) |
Income Above Poverty by Sex and Age in Monroe
According to the poverty statistics in Monroe, males aged under 5 years and females aged 5 years are the age groups that are most secure financially, with 100.0% of males and 100.0% of females in these age groups living above the poverty line.
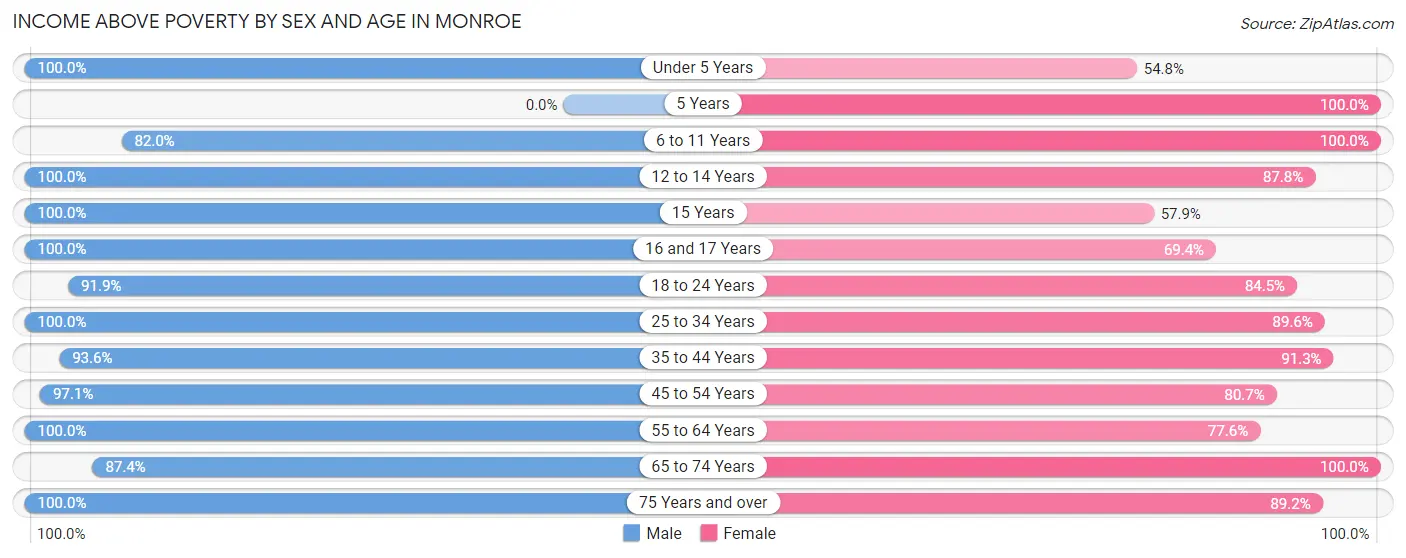
| Age Bracket | Male | Female |
| Under 5 Years | 52 (100.0%) | 23 (54.8%) |
| 5 Years | 0 (0.0%) | 13 (100.0%) |
| 6 to 11 Years | 73 (82.0%) | 71 (100.0%) |
| 12 to 14 Years | 78 (100.0%) | 65 (87.8%) |
| 15 Years | 21 (100.0%) | 11 (57.9%) |
| 16 and 17 Years | 44 (100.0%) | 25 (69.4%) |
| 18 to 24 Years | 125 (91.9%) | 49 (84.5%) |
| 25 to 34 Years | 83 (100.0%) | 95 (89.6%) |
| 35 to 44 Years | 131 (93.6%) | 146 (91.2%) |
| 45 to 54 Years | 136 (97.1%) | 117 (80.7%) |
| 55 to 64 Years | 207 (100.0%) | 177 (77.6%) |
| 65 to 74 Years | 111 (87.4%) | 133 (100.0%) |
| 75 Years and over | 146 (100.0%) | 149 (89.2%) |
| Total | 1,207 (95.6%) | 1,074 (85.8%) |
Income Below Poverty Among Married-Couple Families in Monroe
The poverty statistics for married-couple families in Monroe show that 4.0% or 24 of the total 603 families live below the poverty line. Families with 5 or more children have the highest poverty rate of 64.7%, comprising of 11 families. On the other hand, families with 3 or 4 children have the lowest poverty rate of 0.0%, which includes 0 families.
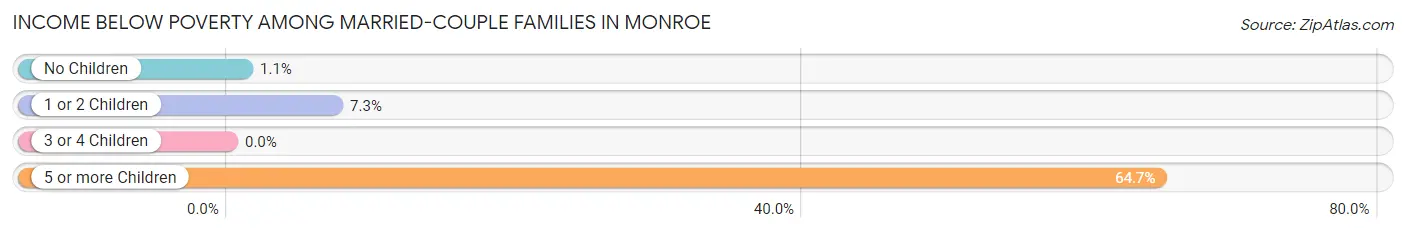
| Children | Above Poverty | Below Poverty |
| No Children | 377 (99.0%) | 4 (1.1%) |
| 1 or 2 Children | 114 (92.7%) | 9 (7.3%) |
| 3 or 4 Children | 82 (100.0%) | 0 (0.0%) |
| 5 or more Children | 6 (35.3%) | 11 (64.7%) |
| Total | 579 (96.0%) | 24 (4.0%) |
Income Below Poverty Among Single-Parent Households in Monroe
| Children | Single Father | Single Mother |
| No Children | 0 (0.0%) | 0 (0.0%) |
| 1 or 2 Children | 0 (0.0%) | 0 (0.0%) |
| 3 or 4 Children | 0 (0.0%) | 0 (0.0%) |
| 5 or more Children | 0 (0.0%) | 0 (0.0%) |
| Total | 0 (0.0%) | 0 (0.0%) |
Income Below Poverty Among Married-Couple vs Single-Parent Households in Monroe
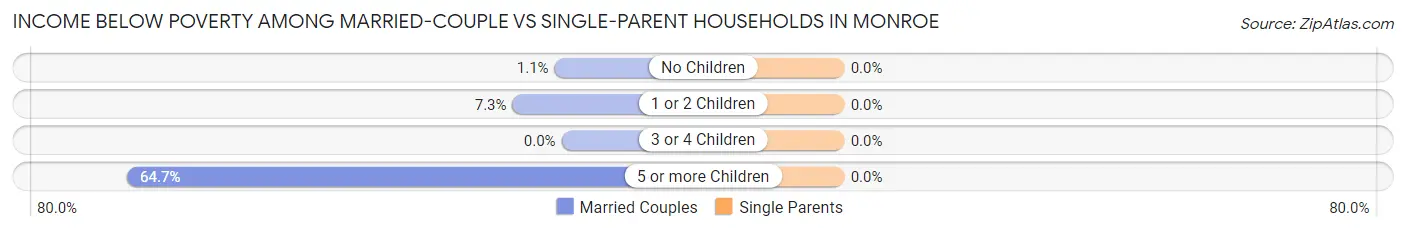
| Children | Married-Couple Families | Single-Parent Households |
| No Children | 4 (1.1%) | 0 (0.0%) |
| 1 or 2 Children | 9 (7.3%) | 0 (0.0%) |
| 3 or 4 Children | 0 (0.0%) | 0 (0.0%) |
| 5 or more Children | 11 (64.7%) | 0 (0.0%) |
| Total | 24 (4.0%) | 0 (0.0%) |
Race in Monroe
The most populous races in Monroe are White / Caucasian (2,397 | 94.7%), Two or more Races (57 | 2.2%), and Asian (38 | 1.5%).
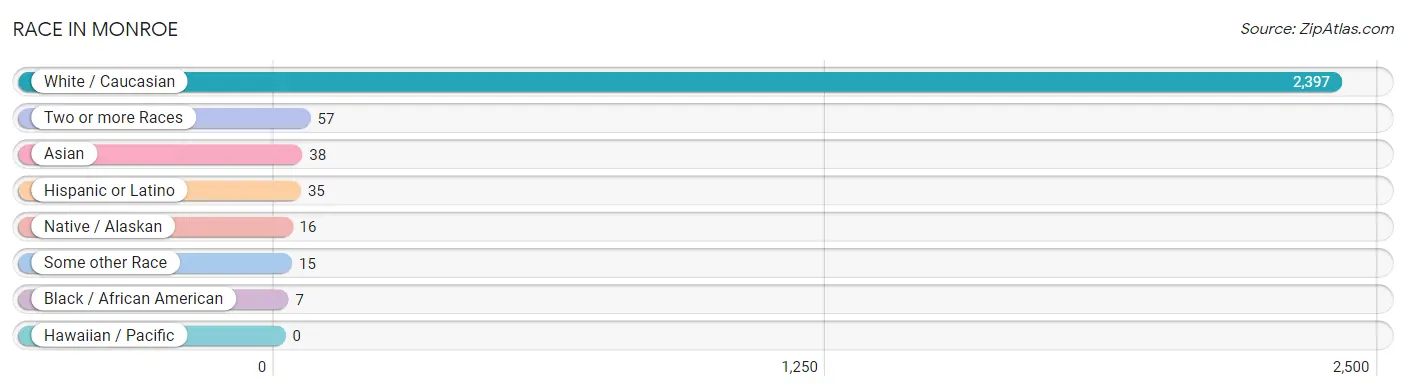
| Race | # Population | % Population |
| Asian | 38 | 1.5% |
| Black / African American | 7 | 0.3% |
| Hawaiian / Pacific | 0 | 0.0% |
| Hispanic or Latino | 35 | 1.4% |
| Native / Alaskan | 16 | 0.6% |
| White / Caucasian | 2,397 | 94.7% |
| Two or more Races | 57 | 2.2% |
| Some other Race | 15 | 0.6% |
| Total | 2,530 | 100.0% |
Ancestry in Monroe
The most populous ancestries reported in Monroe are English (807 | 31.9%), German (188 | 7.4%), Irish (167 | 6.6%), European (119 | 4.7%), and Danish (110 | 4.3%), together accounting for 55.0% of all Monroe residents.
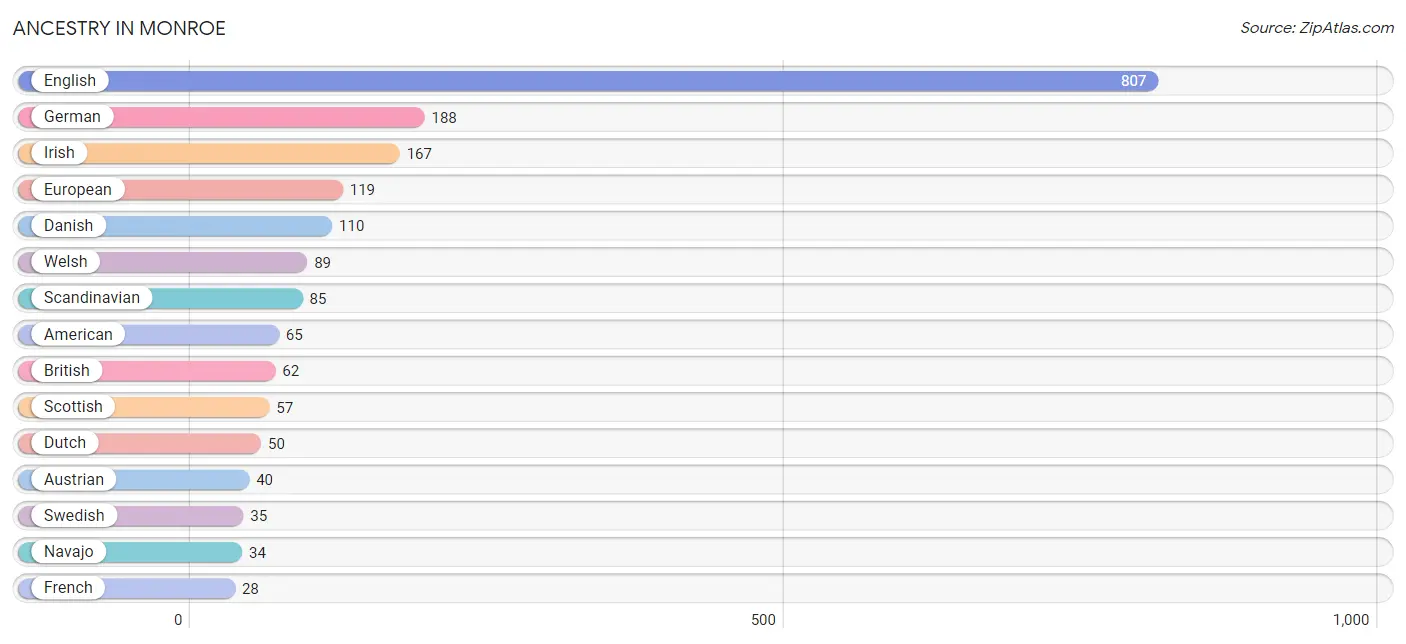
| Ancestry | # Population | % Population |
| American | 65 | 2.6% |
| Apache | 16 | 0.6% |
| Austrian | 40 | 1.6% |
| Bhutanese | 16 | 0.6% |
| British | 62 | 2.5% |
| Central American | 6 | 0.2% |
| Cherokee | 9 | 0.4% |
| Danish | 110 | 4.3% |
| Dutch | 50 | 2.0% |
| English | 807 | 31.9% |
| European | 119 | 4.7% |
| French | 28 | 1.1% |
| French Canadian | 5 | 0.2% |
| German | 188 | 7.4% |
| Haitian | 7 | 0.3% |
| Irish | 167 | 6.6% |
| Italian | 25 | 1.0% |
| Korean | 15 | 0.6% |
| Mexican | 22 | 0.9% |
| Navajo | 34 | 1.3% |
| Norwegian | 7 | 0.3% |
| Polish | 12 | 0.5% |
| Portuguese | 15 | 0.6% |
| Salvadoran | 6 | 0.2% |
| Scandinavian | 85 | 3.4% |
| Scotch-Irish | 4 | 0.2% |
| Scottish | 57 | 2.2% |
| Spanish | 7 | 0.3% |
| Sri Lankan | 7 | 0.3% |
| Swedish | 35 | 1.4% |
| Welsh | 89 | 3.5% | View All 31 Rows |
Immigrants in Monroe
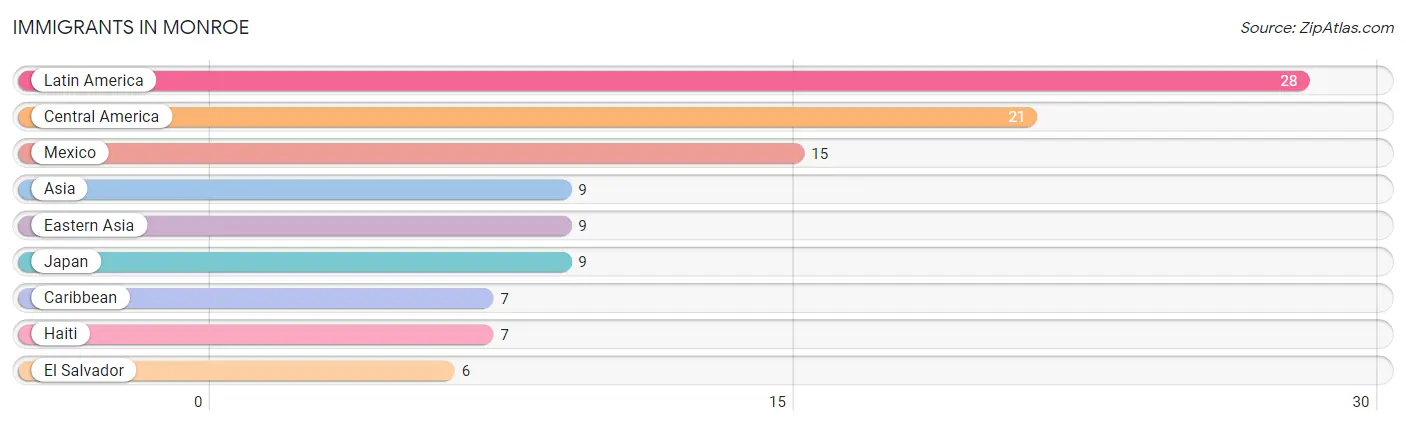
The most numerous immigrant groups reported in Monroe came from Latin America (28 | 1.1%), Central America (21 | 0.8%), Mexico (15 | 0.6%), Asia (9 | 0.4%), and Eastern Asia (9 | 0.4%), together accounting for 3.3% of all Monroe residents.
| Immigration Origin | # Population | % Population |
| Asia | 9 | 0.4% |
| Caribbean | 7 | 0.3% |
| Central America | 21 | 0.8% |
| Eastern Asia | 9 | 0.4% |
| El Salvador | 6 | 0.2% |
| Haiti | 7 | 0.3% |
| Japan | 9 | 0.4% |
| Latin America | 28 | 1.1% |
| Mexico | 15 | 0.6% | View All 9 Rows |
Sex and Age in Monroe
Sex and Age in Monroe
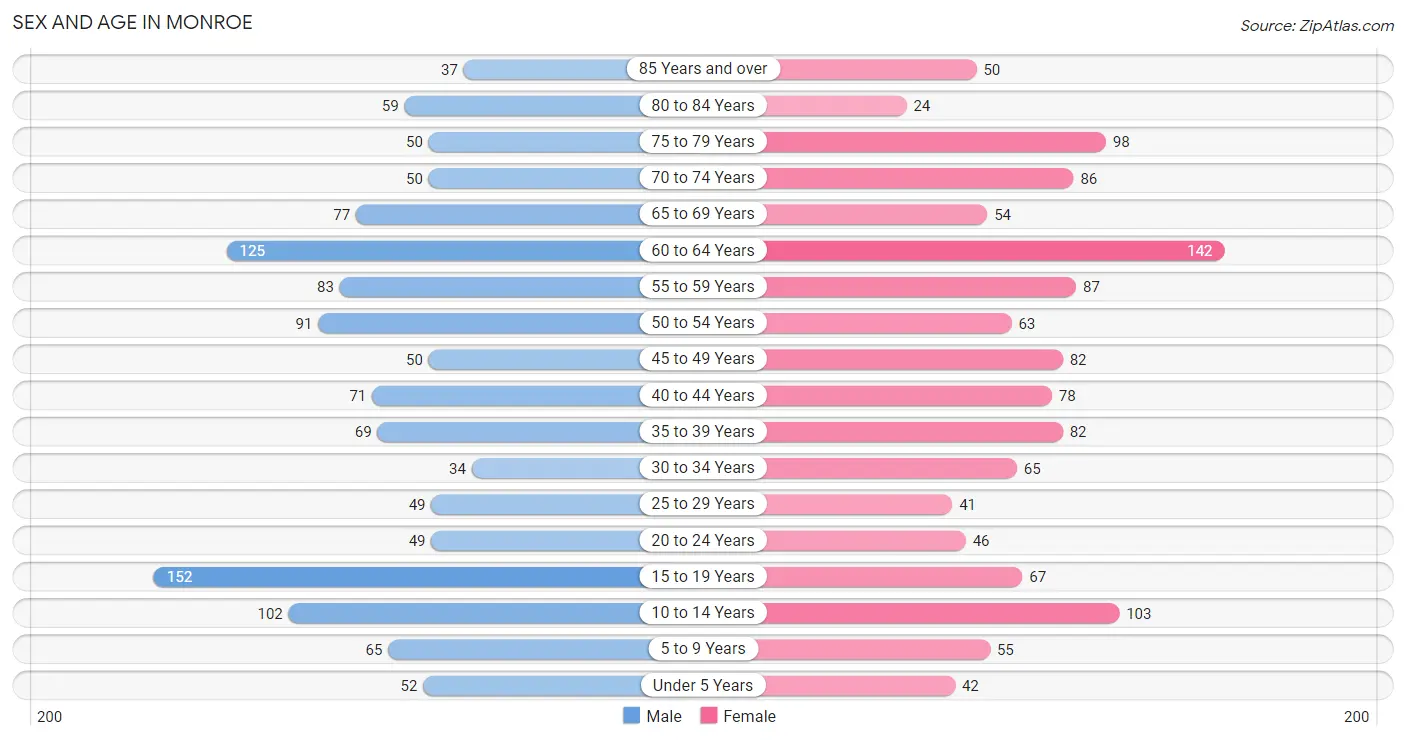
The most populous age groups in Monroe are 15 to 19 Years (152 | 12.0%) for men and 60 to 64 Years (142 | 11.2%) for women.
| Age Bracket | Male | Female |
| Under 5 Years | 52 (4.1%) | 42 (3.3%) |
| 5 to 9 Years | 65 (5.1%) | 55 (4.3%) |
| 10 to 14 Years | 102 (8.1%) | 103 (8.1%) |
| 15 to 19 Years | 152 (12.0%) | 67 (5.3%) |
| 20 to 24 Years | 49 (3.9%) | 46 (3.6%) |
| 25 to 29 Years | 49 (3.9%) | 41 (3.2%) |
| 30 to 34 Years | 34 (2.7%) | 65 (5.1%) |
| 35 to 39 Years | 69 (5.4%) | 82 (6.5%) |
| 40 to 44 Years | 71 (5.6%) | 78 (6.2%) |
| 45 to 49 Years | 50 (4.0%) | 82 (6.5%) |
| 50 to 54 Years | 91 (7.2%) | 63 (5.0%) |
| 55 to 59 Years | 83 (6.6%) | 87 (6.9%) |
| 60 to 64 Years | 125 (9.9%) | 142 (11.2%) |
| 65 to 69 Years | 77 (6.1%) | 54 (4.3%) |
| 70 to 74 Years | 50 (4.0%) | 86 (6.8%) |
| 75 to 79 Years | 50 (4.0%) | 98 (7.7%) |
| 80 to 84 Years | 59 (4.7%) | 24 (1.9%) |
| 85 Years and over | 37 (2.9%) | 50 (4.0%) |
| Total | 1,265 (100.0%) | 1,265 (100.0%) |
Families and Households in Monroe
Median Family Size in Monroe
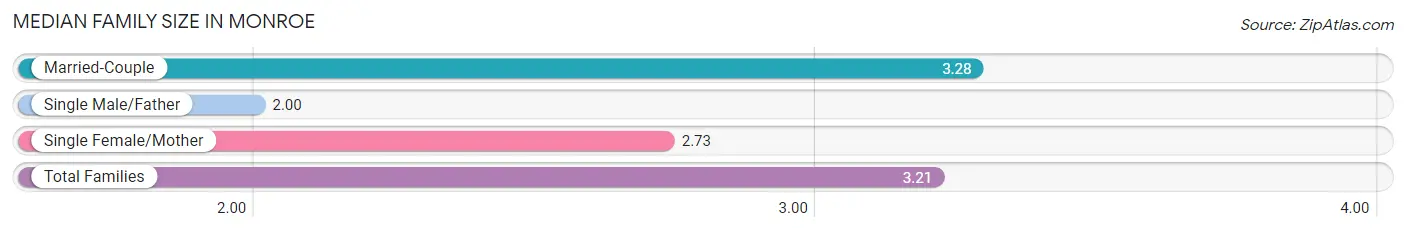
The median family size in Monroe is 3.21 persons per family, with married-couple families (603 | 89.3%) accounting for the largest median family size of 3.28 persons per family. On the other hand, single male/father families (10 | 1.5%) represent the smallest median family size with 2.00 persons per family.
| Family Type | # Families | Family Size |
| Married-Couple | 603 (89.3%) | 3.28 |
| Single Male/Father | 10 (1.5%) | 2.00 |
| Single Female/Mother | 62 (9.2%) | 2.73 |
| Total Families | 675 (100.0%) | 3.21 |
Median Household Size in Monroe
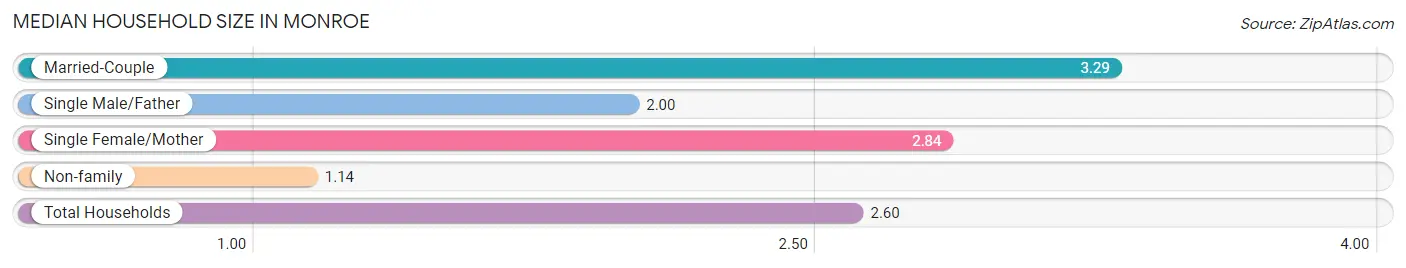
The median household size in Monroe is 2.60 persons per household, with married-couple households (603 | 62.4%) accounting for the largest median household size of 3.29 persons per household. non-family households (292 | 30.2%) represent the smallest median household size with 1.14 persons per household.
| Household Type | # Households | Household Size |
| Married-Couple | 603 (62.4%) | 3.29 |
| Single Male/Father | 10 (1.0%) | 2.00 |
| Single Female/Mother | 62 (6.4%) | 2.84 |
| Non-family | 292 (30.2%) | 1.14 |
| Total Households | 967 (100.0%) | 2.60 |
Household Size by Marriage Status in Monroe
Out of a total of 967 households in Monroe, 675 (69.8%) are family households, while 292 (30.2%) are nonfamily households. The most numerous type of family households are 2-person households, comprising 347, and the most common type of nonfamily households are 1-person households, comprising 257.
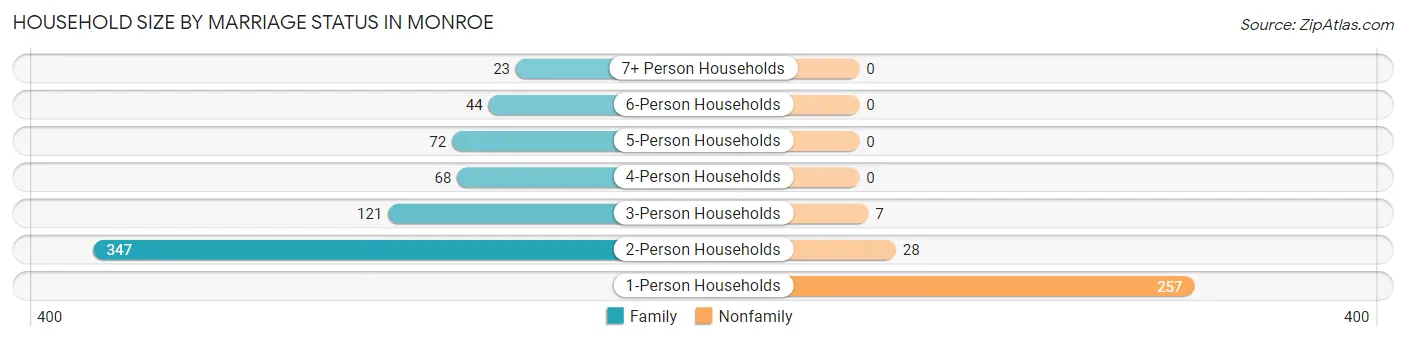
| Household Size | Family Households | Nonfamily Households |
| 1-Person Households | - | 257 (26.6%) |
| 2-Person Households | 347 (35.9%) | 28 (2.9%) |
| 3-Person Households | 121 (12.5%) | 7 (0.7%) |
| 4-Person Households | 68 (7.0%) | 0 (0.0%) |
| 5-Person Households | 72 (7.4%) | 0 (0.0%) |
| 6-Person Households | 44 (4.5%) | 0 (0.0%) |
| 7+ Person Households | 23 (2.4%) | 0 (0.0%) |
| Total | 675 (69.8%) | 292 (30.2%) |
Female Fertility in Monroe
Fertility by Age in Monroe
Average fertility rate in Monroe is 19.0 births per 1,000 women. Women in the age bracket of 20 to 34 years have the highest fertility rate with 59.0 births per 1,000 women. Women in the age bracket of 20 to 34 years acount for 100.0% of all women with births.
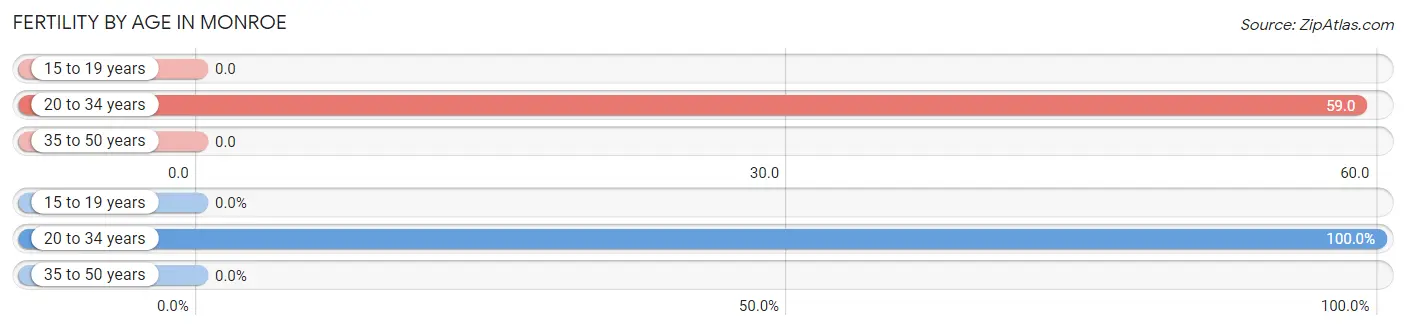
| Age Bracket | Women with Births | Births / 1,000 Women |
| 15 to 19 years | 0 (0.0%) | 0.0 |
| 20 to 34 years | 9 (100.0%) | 59.0 |
| 35 to 50 years | 0 (0.0%) | 0.0 |
| Total | 9 (100.0%) | 19.0 |
Fertility by Age by Marriage Status in Monroe
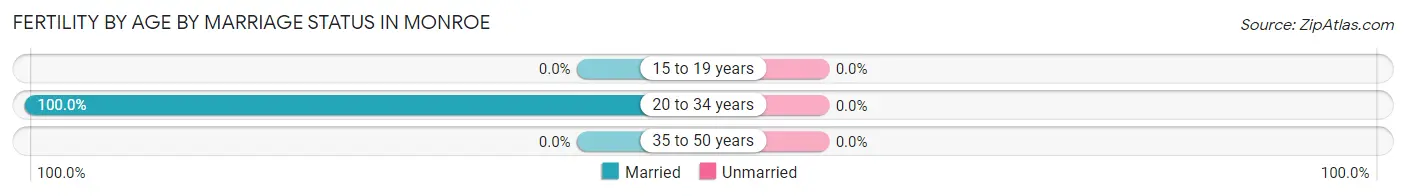
| Age Bracket | Married | Unmarried |
| 15 to 19 years | 0 (0.0%) | 0 (0.0%) |
| 20 to 34 years | 9 (100.0%) | 0 (0.0%) |
| 35 to 50 years | 0 (0.0%) | 0 (0.0%) |
| Total | 9 (100.0%) | 0 (0.0%) |
Fertility by Education in Monroe
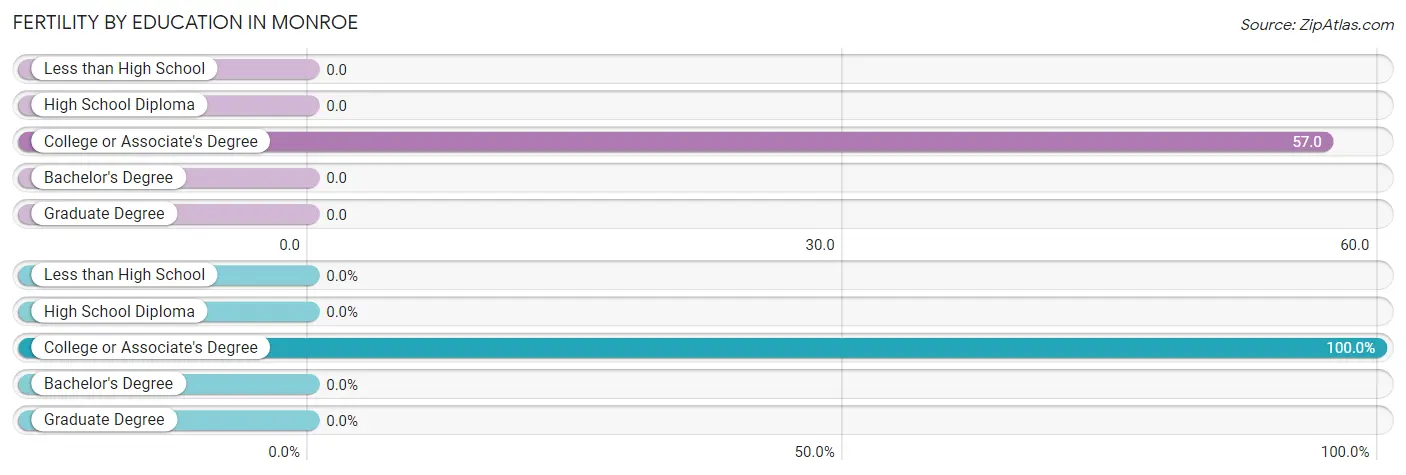
| Educational Attainment | Women with Births | Births / 1,000 Women |
| Less than High School | 0 (0.0%) | 0.0 |
| High School Diploma | 0 (0.0%) | 0.0 |
| College or Associate's Degree | 9 (100.0%) | 57.0 |
| Bachelor's Degree | 0 (0.0%) | 0.0 |
| Graduate Degree | 0 (0.0%) | 0.0 |
| Total | 9 (100.0%) | 19.0 |
Fertility by Education by Marriage Status in Monroe
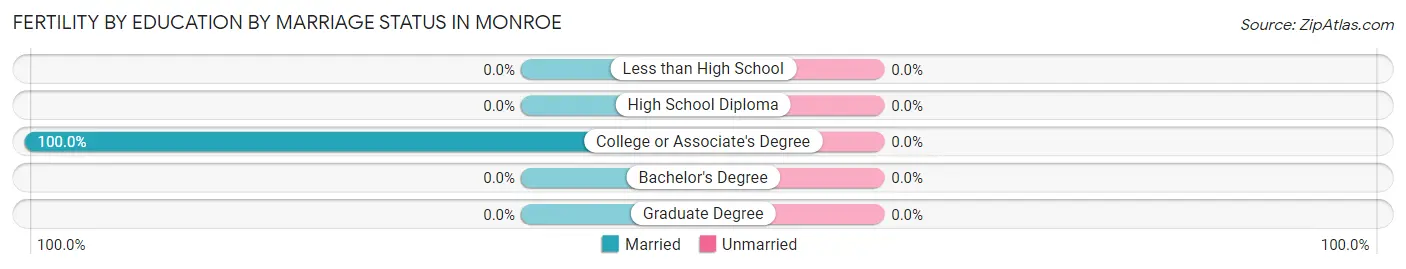
| Educational Attainment | Married | Unmarried |
| Less than High School | 0 (0.0%) | 0 (0.0%) |
| High School Diploma | 0 (0.0%) | 0 (0.0%) |
| College or Associate's Degree | 9 (100.0%) | 0 (0.0%) |
| Bachelor's Degree | 0 (0.0%) | 0 (0.0%) |
| Graduate Degree | 0 (0.0%) | 0 (0.0%) |
| Total | 9 (100.0%) | 0 (0.0%) |
Employment Characteristics in Monroe
Employment by Class of Employer in Monroe
Among the 1,089 employed individuals in Monroe, private company employees (593 | 54.4%), local government employees (164 | 15.1%), and self-employed (not incorporated) (118 | 10.8%) make up the most common classes of employment.
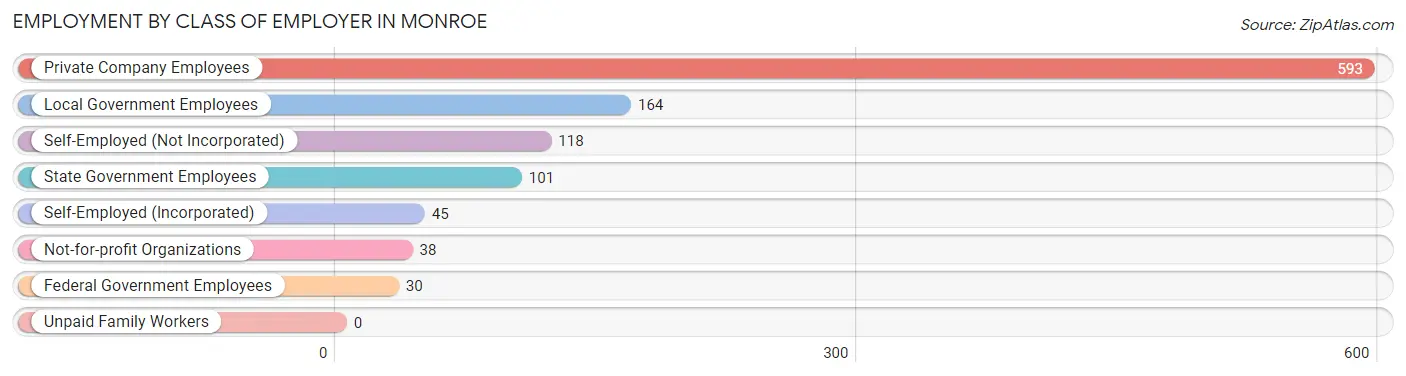
| Employer Class | # Employees | % Employees |
| Private Company Employees | 593 | 54.4% |
| Self-Employed (Incorporated) | 45 | 4.1% |
| Self-Employed (Not Incorporated) | 118 | 10.8% |
| Not-for-profit Organizations | 38 | 3.5% |
| Local Government Employees | 164 | 15.1% |
| State Government Employees | 101 | 9.3% |
| Federal Government Employees | 30 | 2.8% |
| Unpaid Family Workers | 0 | 0.0% |
| Total | 1,089 | 100.0% |
Employment Status by Age in Monroe
According to the labor force statistics for Monroe, out of the total population over 16 years of age (2,071), 54.8% or 1,135 individuals are in the labor force, with 3.0% or 34 of them unemployed. The age group with the highest labor force participation rate is 25 to 29 years, with 93.3% or 84 individuals in the labor force. Within the labor force, the 55 to 59 years age range has the highest percentage of unemployed individuals, with 12.4% or 12 of them being unemployed.
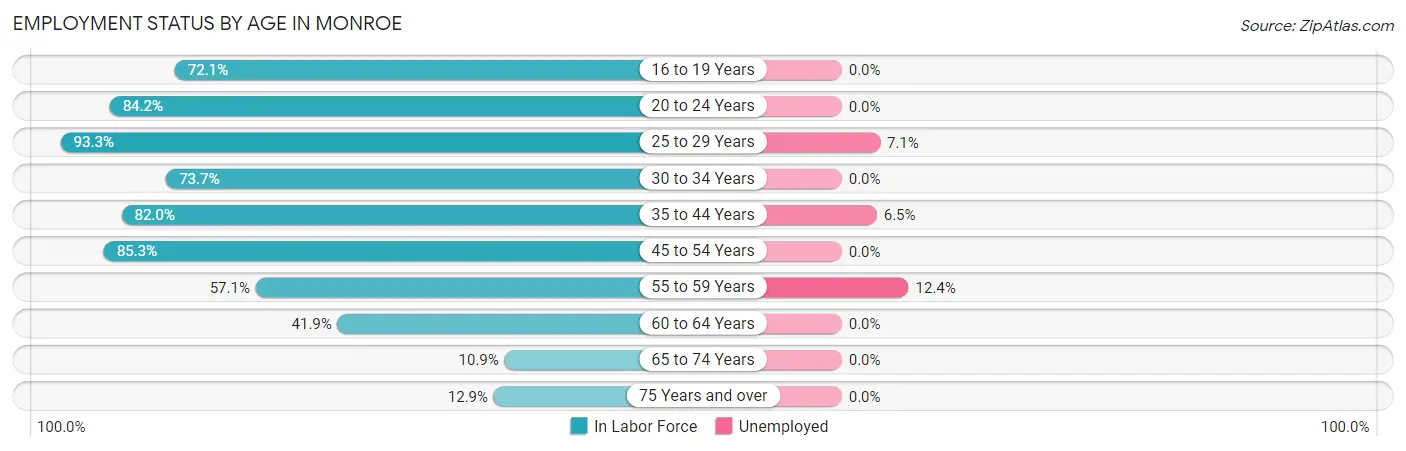
| Age Bracket | In Labor Force | Unemployed |
| 16 to 19 Years | 129 (72.1%) | 0 (0.0%) |
| 20 to 24 Years | 80 (84.2%) | 0 (0.0%) |
| 25 to 29 Years | 84 (93.3%) | 6 (7.1%) |
| 30 to 34 Years | 73 (73.7%) | 0 (0.0%) |
| 35 to 44 Years | 246 (82.0%) | 16 (6.5%) |
| 45 to 54 Years | 244 (85.3%) | 0 (0.0%) |
| 55 to 59 Years | 97 (57.1%) | 12 (12.4%) |
| 60 to 64 Years | 112 (41.9%) | 0 (0.0%) |
| 65 to 74 Years | 29 (10.9%) | 0 (0.0%) |
| 75 Years and over | 41 (12.9%) | 0 (0.0%) |
| Total | 1,135 (54.8%) | 34 (3.0%) |
Employment Status by Educational Attainment in Monroe
According to labor force statistics for Monroe, 70.6% of individuals (856) out of the total population between 25 and 64 years of age (1,212) are in the labor force, with 4.0% or 34 of them being unemployed. The group with the highest labor force participation rate are those with the educational attainment of bachelor's degree or higher, with 85.5% or 247 individuals in the labor force. Within the labor force, individuals with high school diploma education have the highest percentage of unemployment, with 14.3% or 34 of them being unemployed.
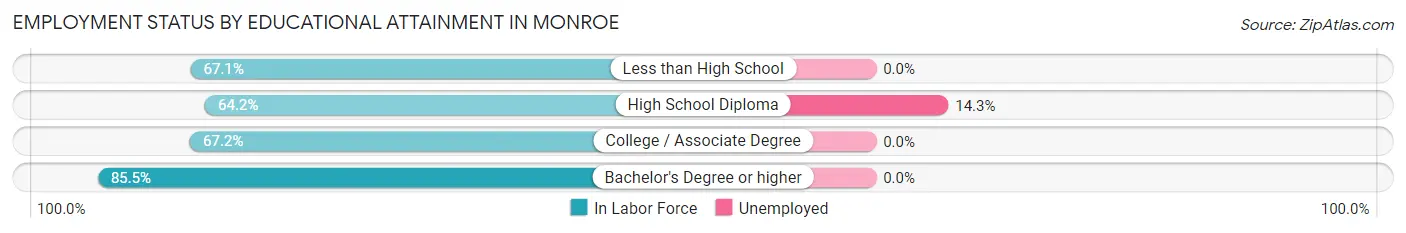
| Educational Attainment | In Labor Force | Unemployed |
| Less than High School | 49 (67.1%) | 0 (0.0%) |
| High School Diploma | 237 (64.2%) | 53 (14.3%) |
| College / Associate Degree | 323 (67.2%) | 0 (0.0%) |
| Bachelor's Degree or higher | 247 (85.5%) | 0 (0.0%) |
| Total | 856 (70.6%) | 48 (4.0%) |
Employment Occupations by Sex in Monroe
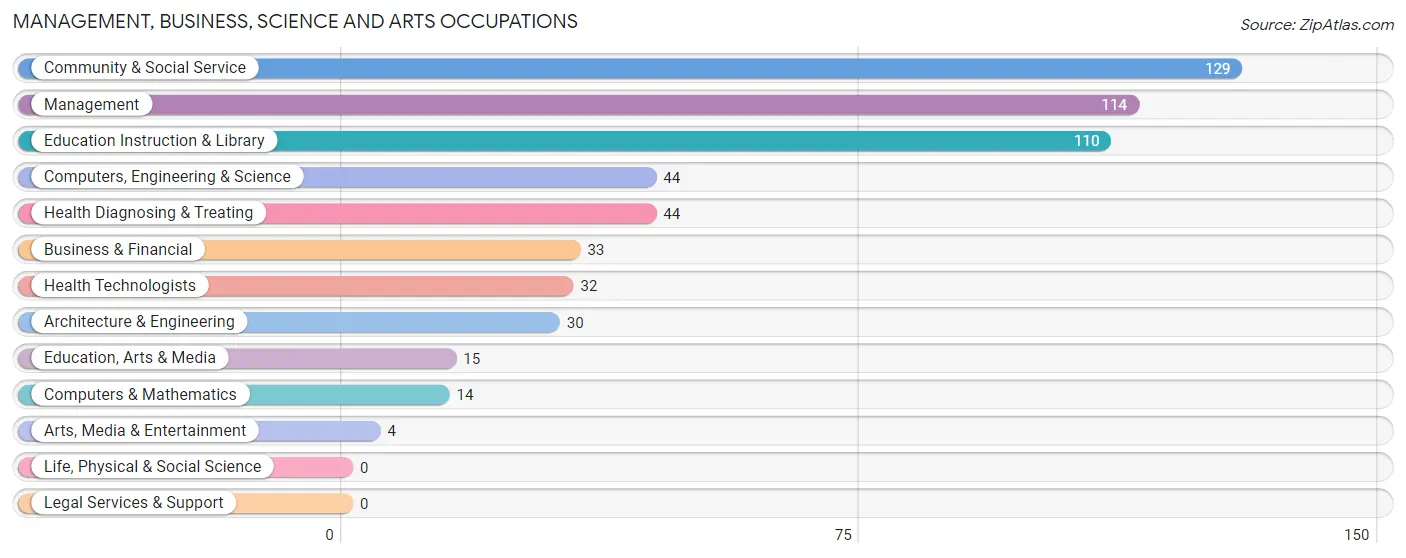
Management, Business, Science and Arts Occupations
The most common Management, Business, Science and Arts occupations in Monroe are Community & Social Service (129 | 11.7%), Management (114 | 10.3%), Education Instruction & Library (110 | 10.0%), Computers, Engineering & Science (44 | 4.0%), and Health Diagnosing & Treating (44 | 4.0%).
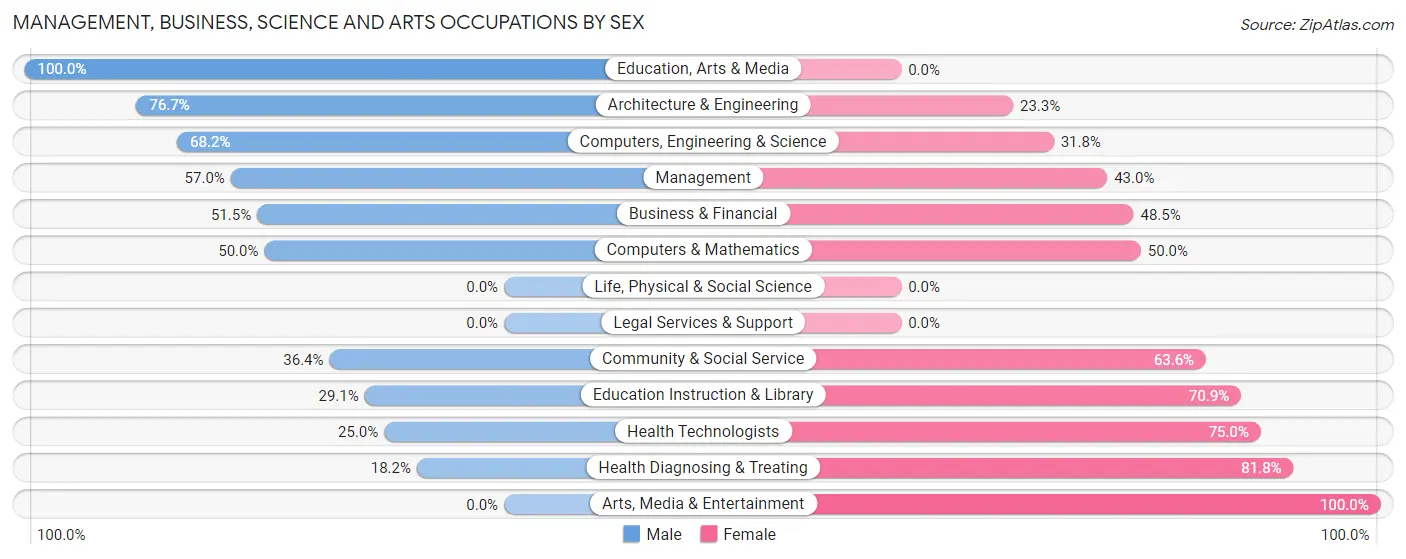
Management, Business, Science and Arts Occupations by Sex
Within the Management, Business, Science and Arts occupations in Monroe, the most male-oriented occupations are Education, Arts & Media (100.0%), Architecture & Engineering (76.7%), and Computers, Engineering & Science (68.2%), while the most female-oriented occupations are Arts, Media & Entertainment (100.0%), Health Diagnosing & Treating (81.8%), and Health Technologists (75.0%).
| Occupation | Male | Female |
| Management | 65 (57.0%) | 49 (43.0%) |
| Business & Financial | 17 (51.5%) | 16 (48.5%) |
| Computers, Engineering & Science | 30 (68.2%) | 14 (31.8%) |
| Computers & Mathematics | 7 (50.0%) | 7 (50.0%) |
| Architecture & Engineering | 23 (76.7%) | 7 (23.3%) |
| Life, Physical & Social Science | 0 (0.0%) | 0 (0.0%) |
| Community & Social Service | 47 (36.4%) | 82 (63.6%) |
| Education, Arts & Media | 15 (100.0%) | 0 (0.0%) |
| Legal Services & Support | 0 (0.0%) | 0 (0.0%) |
| Education Instruction & Library | 32 (29.1%) | 78 (70.9%) |
| Arts, Media & Entertainment | 0 (0.0%) | 4 (100.0%) |
| Health Diagnosing & Treating | 8 (18.2%) | 36 (81.8%) |
| Health Technologists | 8 (25.0%) | 24 (75.0%) |
| Total (Category) | 167 (45.9%) | 197 (54.1%) |
| Total (Overall) | 595 (54.0%) | 506 (46.0%) |
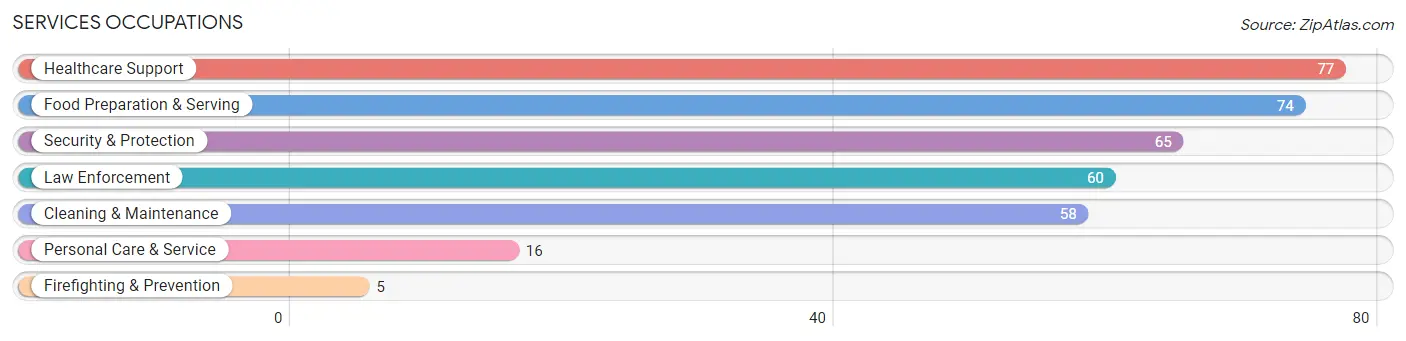
Services Occupations
The most common Services occupations in Monroe are Healthcare Support (77 | 7.0%), Food Preparation & Serving (74 | 6.7%), Security & Protection (65 | 5.9%), Law Enforcement (60 | 5.4%), and Cleaning & Maintenance (58 | 5.3%).
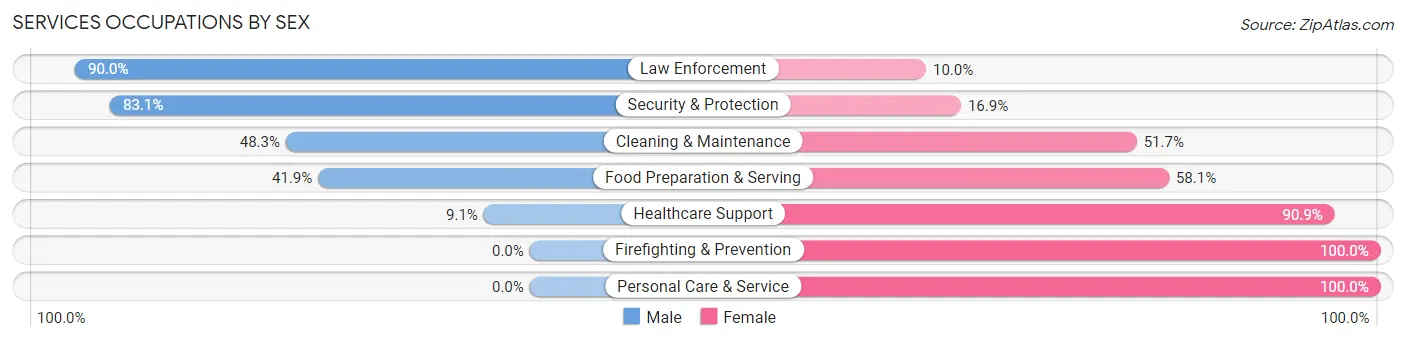
Services Occupations by Sex
Within the Services occupations in Monroe, the most male-oriented occupations are Law Enforcement (90.0%), Security & Protection (83.1%), and Cleaning & Maintenance (48.3%), while the most female-oriented occupations are Firefighting & Prevention (100.0%), Personal Care & Service (100.0%), and Healthcare Support (90.9%).
| Occupation | Male | Female |
| Healthcare Support | 7 (9.1%) | 70 (90.9%) |
| Security & Protection | 54 (83.1%) | 11 (16.9%) |
| Firefighting & Prevention | 0 (0.0%) | 5 (100.0%) |
| Law Enforcement | 54 (90.0%) | 6 (10.0%) |
| Food Preparation & Serving | 31 (41.9%) | 43 (58.1%) |
| Cleaning & Maintenance | 28 (48.3%) | 30 (51.7%) |
| Personal Care & Service | 0 (0.0%) | 16 (100.0%) |
| Total (Category) | 120 (41.4%) | 170 (58.6%) |
| Total (Overall) | 595 (54.0%) | 506 (46.0%) |
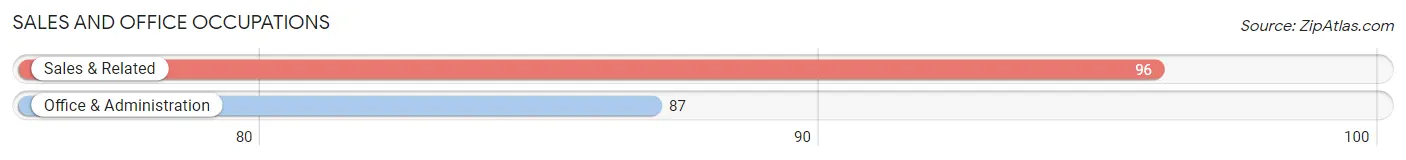
Sales and Office Occupations
The most common Sales and Office occupations in Monroe are Sales & Related (96 | 8.7%), and Office & Administration (87 | 7.9%).
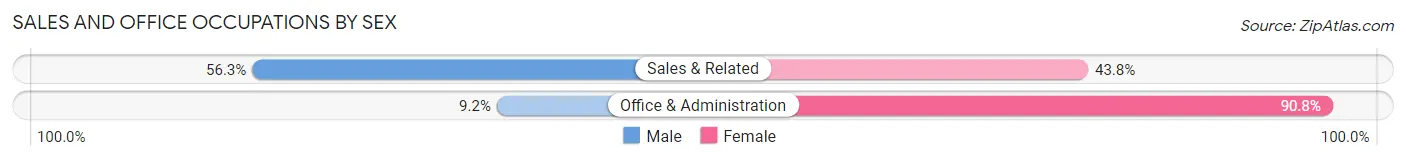
Sales and Office Occupations by Sex
| Occupation | Male | Female |
| Sales & Related | 54 (56.2%) | 42 (43.8%) |
| Office & Administration | 8 (9.2%) | 79 (90.8%) |
| Total (Category) | 62 (33.9%) | 121 (66.1%) |
| Total (Overall) | 595 (54.0%) | 506 (46.0%) |
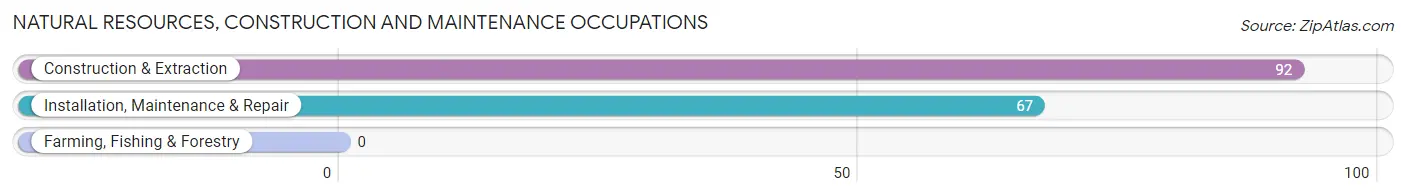
Natural Resources, Construction and Maintenance Occupations
The most common Natural Resources, Construction and Maintenance occupations in Monroe are Construction & Extraction (92 | 8.4%), and Installation, Maintenance & Repair (67 | 6.1%).
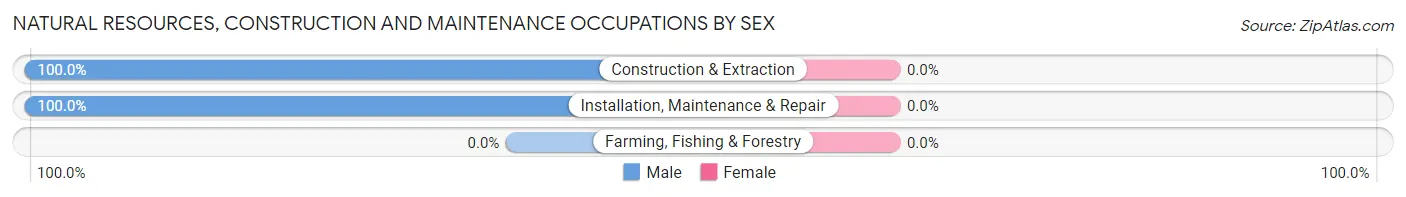
Natural Resources, Construction and Maintenance Occupations by Sex
| Occupation | Male | Female |
| Farming, Fishing & Forestry | 0 (0.0%) | 0 (0.0%) |
| Construction & Extraction | 92 (100.0%) | 0 (0.0%) |
| Installation, Maintenance & Repair | 67 (100.0%) | 0 (0.0%) |
| Total (Category) | 159 (100.0%) | 0 (0.0%) |
| Total (Overall) | 595 (54.0%) | 506 (46.0%) |
Production, Transportation and Moving Occupations
The most common Production, Transportation and Moving occupations in Monroe are Transportation (67 | 6.1%), Production (31 | 2.8%), and Material Moving (7 | 0.6%).
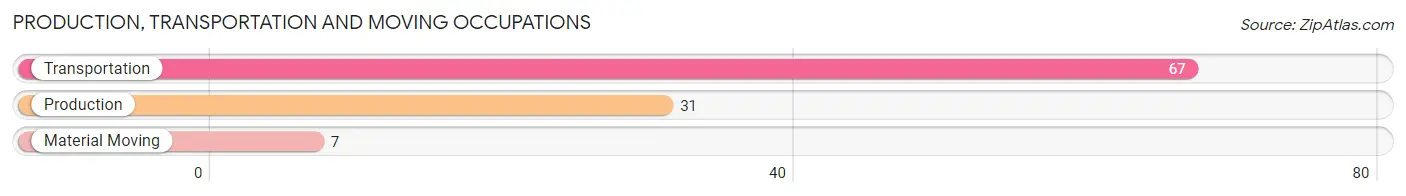
Production, Transportation and Moving Occupations by Sex
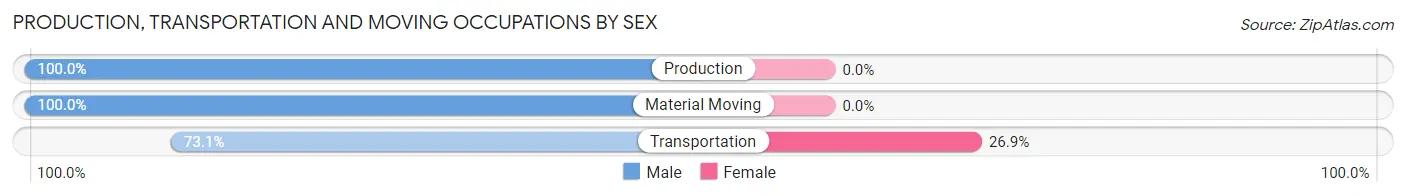
| Occupation | Male | Female |
| Production | 31 (100.0%) | 0 (0.0%) |
| Transportation | 49 (73.1%) | 18 (26.9%) |
| Material Moving | 7 (100.0%) | 0 (0.0%) |
| Total (Category) | 87 (82.9%) | 18 (17.1%) |
| Total (Overall) | 595 (54.0%) | 506 (46.0%) |
Employment Industries by Sex in Monroe
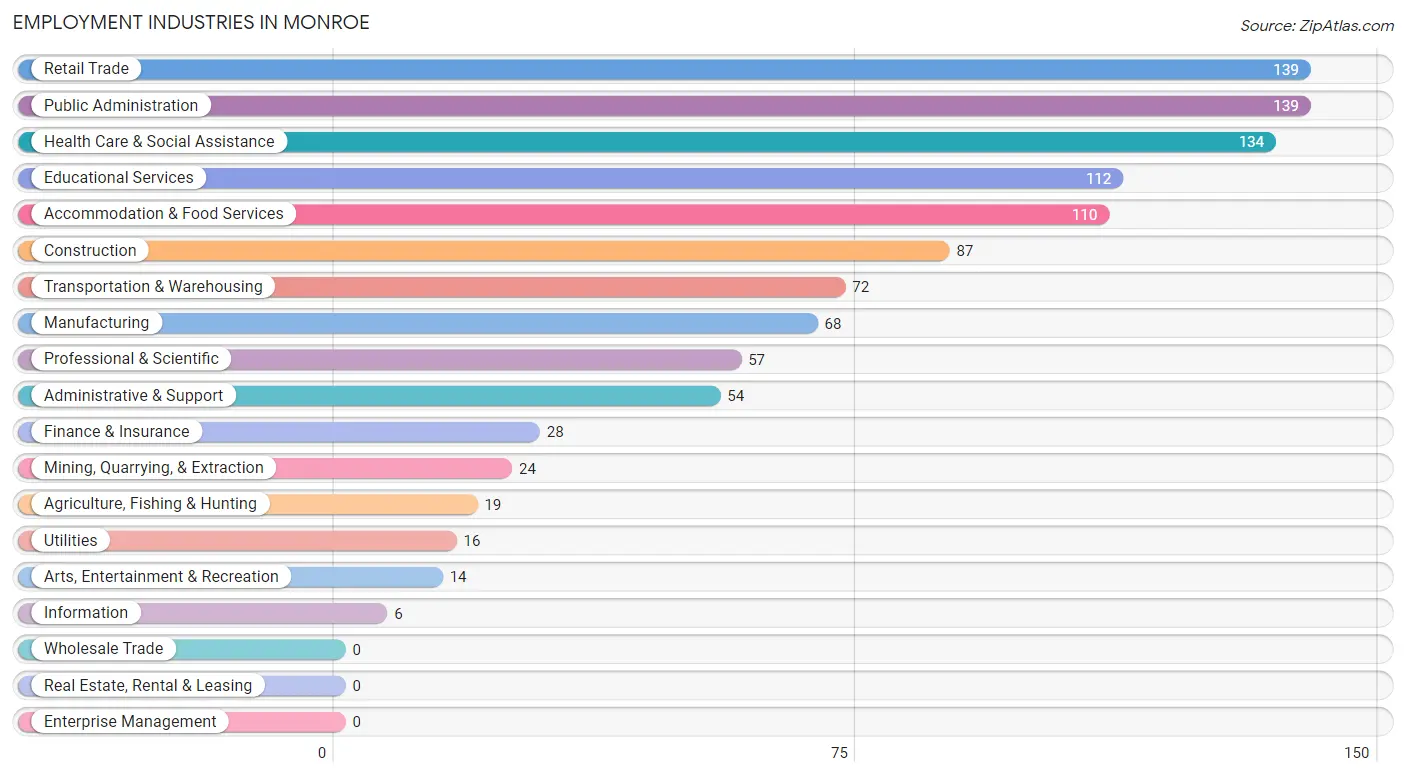
Employment Industries in Monroe
The major employment industries in Monroe include Retail Trade (139 | 12.6%), Public Administration (139 | 12.6%), Health Care & Social Assistance (134 | 12.2%), Educational Services (112 | 10.2%), and Accommodation & Food Services (110 | 10.0%).
Employment Industries by Sex in Monroe
The Monroe industries that see more men than women are Mining, Quarrying, & Extraction (100.0%), Construction (100.0%), and Utilities (100.0%), whereas the industries that tend to have a higher number of women are Information (100.0%), Health Care & Social Assistance (94.0%), and Finance & Insurance (71.4%).
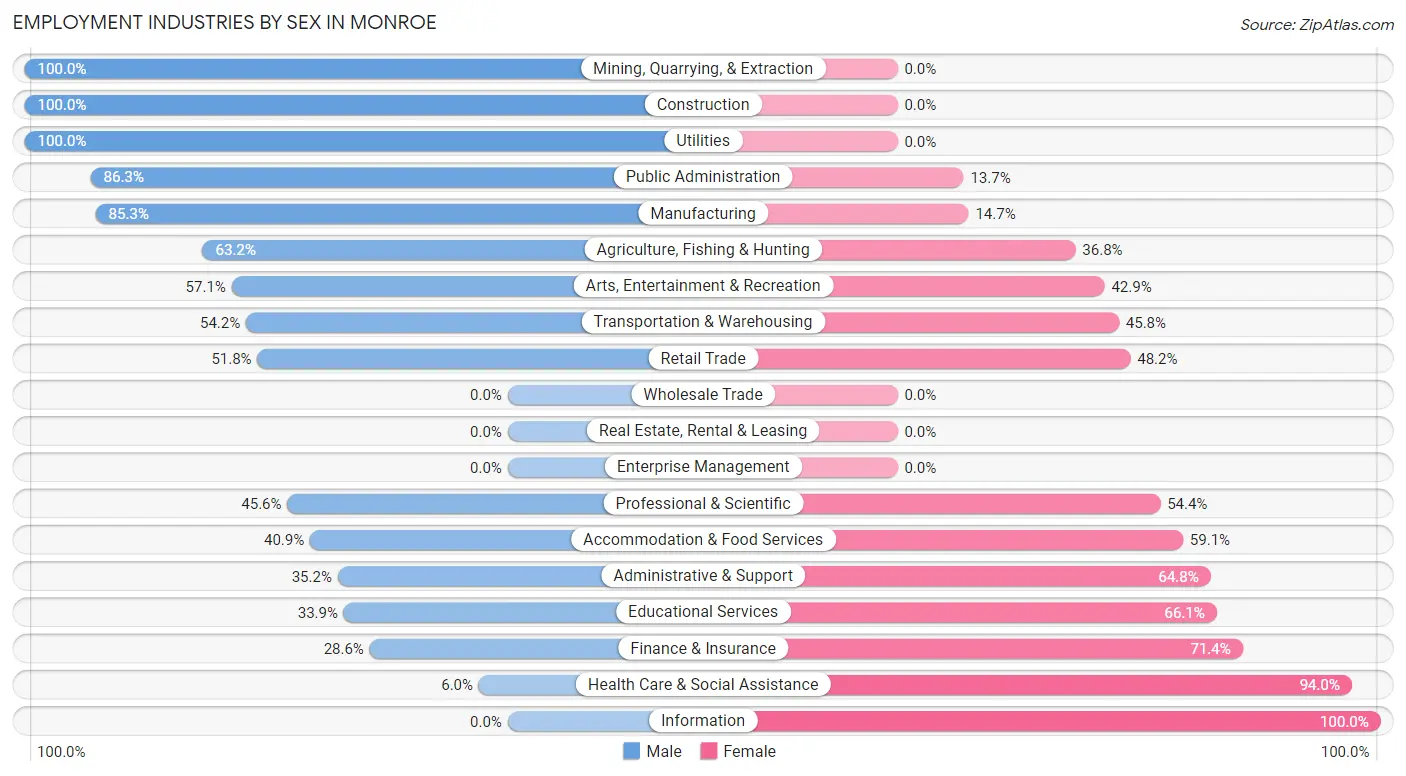
| Industry | Male | Female |
| Agriculture, Fishing & Hunting | 12 (63.2%) | 7 (36.8%) |
| Mining, Quarrying, & Extraction | 24 (100.0%) | 0 (0.0%) |
| Construction | 87 (100.0%) | 0 (0.0%) |
| Manufacturing | 58 (85.3%) | 10 (14.7%) |
| Wholesale Trade | 0 (0.0%) | 0 (0.0%) |
| Retail Trade | 72 (51.8%) | 67 (48.2%) |
| Transportation & Warehousing | 39 (54.2%) | 33 (45.8%) |
| Utilities | 16 (100.0%) | 0 (0.0%) |
| Information | 0 (0.0%) | 6 (100.0%) |
| Finance & Insurance | 8 (28.6%) | 20 (71.4%) |
| Real Estate, Rental & Leasing | 0 (0.0%) | 0 (0.0%) |
| Professional & Scientific | 26 (45.6%) | 31 (54.4%) |
| Enterprise Management | 0 (0.0%) | 0 (0.0%) |
| Administrative & Support | 19 (35.2%) | 35 (64.8%) |
| Educational Services | 38 (33.9%) | 74 (66.1%) |
| Health Care & Social Assistance | 8 (6.0%) | 126 (94.0%) |
| Arts, Entertainment & Recreation | 8 (57.1%) | 6 (42.9%) |
| Accommodation & Food Services | 45 (40.9%) | 65 (59.1%) |
| Public Administration | 120 (86.3%) | 19 (13.7%) |
| Total | 595 (54.0%) | 506 (46.0%) |
Education in Monroe
School Enrollment in Monroe
The most common levels of schooling among the 596 students in Monroe are middle school (181 | 30.4%), high school (180 | 30.2%), and elementary school (90 | 15.1%).
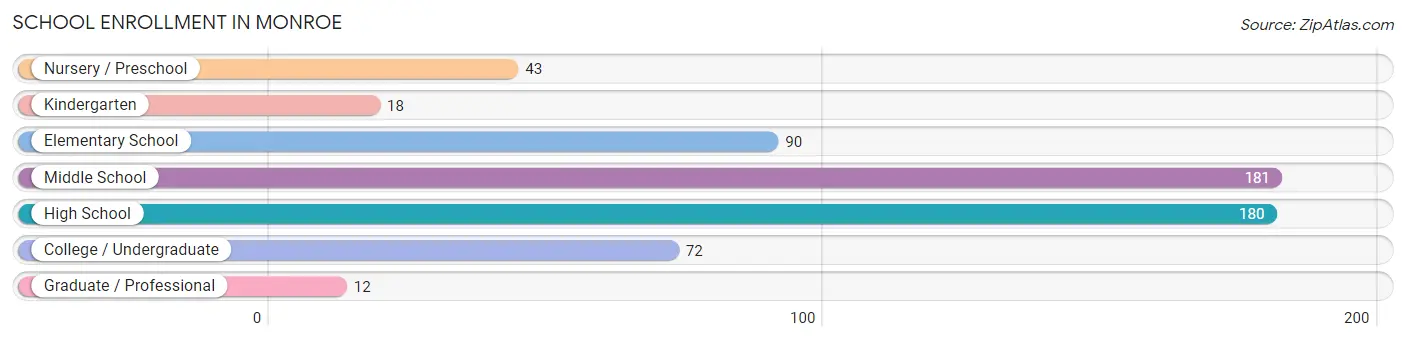
| School Level | # Students | % Students |
| Nursery / Preschool | 43 | 7.2% |
| Kindergarten | 18 | 3.0% |
| Elementary School | 90 | 15.1% |
| Middle School | 181 | 30.4% |
| High School | 180 | 30.2% |
| College / Undergraduate | 72 | 12.1% |
| Graduate / Professional | 12 | 2.0% |
| Total | 596 | 100.0% |
School Enrollment by Age by Funding Source in Monroe
Out of a total of 596 students who are enrolled in schools in Monroe, 57 (9.6%) attend a private institution, while the remaining 539 (90.4%) are enrolled in public schools. The age group of 3 to 4 year olds has the highest likelihood of being enrolled in private schools, with 15 (41.7% in the age bracket) enrolled. Conversely, the age group of 25 to 34 year olds has the lowest likelihood of being enrolled in a private school, with 12 (100.0% in the age bracket) attending a public institution.
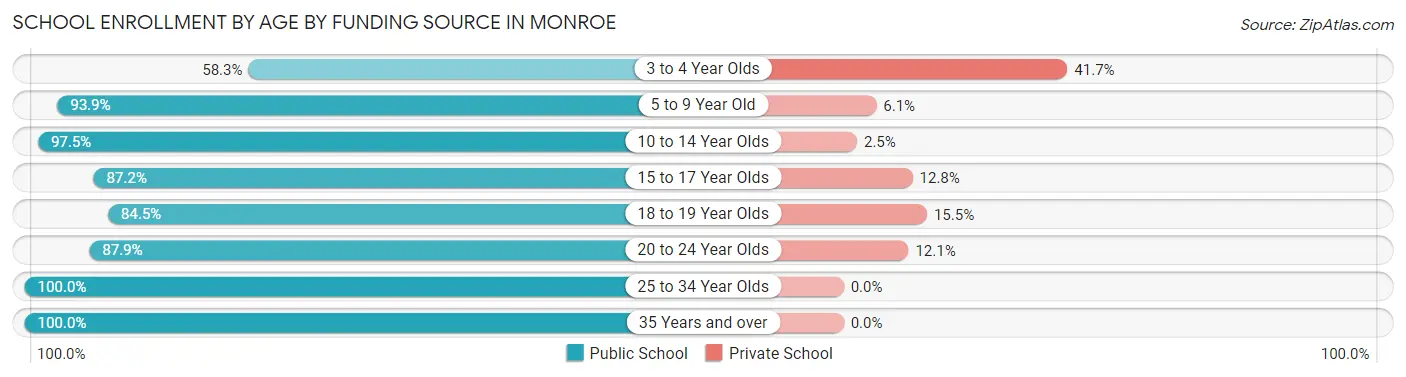
| Age Bracket | Public School | Private School |
| 3 to 4 Year Olds | 21 (58.3%) | 15 (41.7%) |
| 5 to 9 Year Old | 108 (93.9%) | 7 (6.1%) |
| 10 to 14 Year Olds | 196 (97.5%) | 5 (2.5%) |
| 15 to 17 Year Olds | 95 (87.2%) | 14 (12.8%) |
| 18 to 19 Year Olds | 49 (84.5%) | 9 (15.5%) |
| 20 to 24 Year Olds | 51 (87.9%) | 7 (12.1%) |
| 25 to 34 Year Olds | 12 (100.0%) | 0 (0.0%) |
| 35 Years and over | 7 (100.0%) | 0 (0.0%) |
| Total | 539 (90.4%) | 57 (9.6%) |
Educational Attainment by Field of Study in Monroe
Education (159 | 33.5%), business (92 | 19.4%), science & technology (63 | 13.3%), social sciences (44 | 9.3%), and bio, nature & agricultural (27 | 5.7%) are the most common fields of study among 475 individuals in Monroe who have obtained a bachelor's degree or higher.
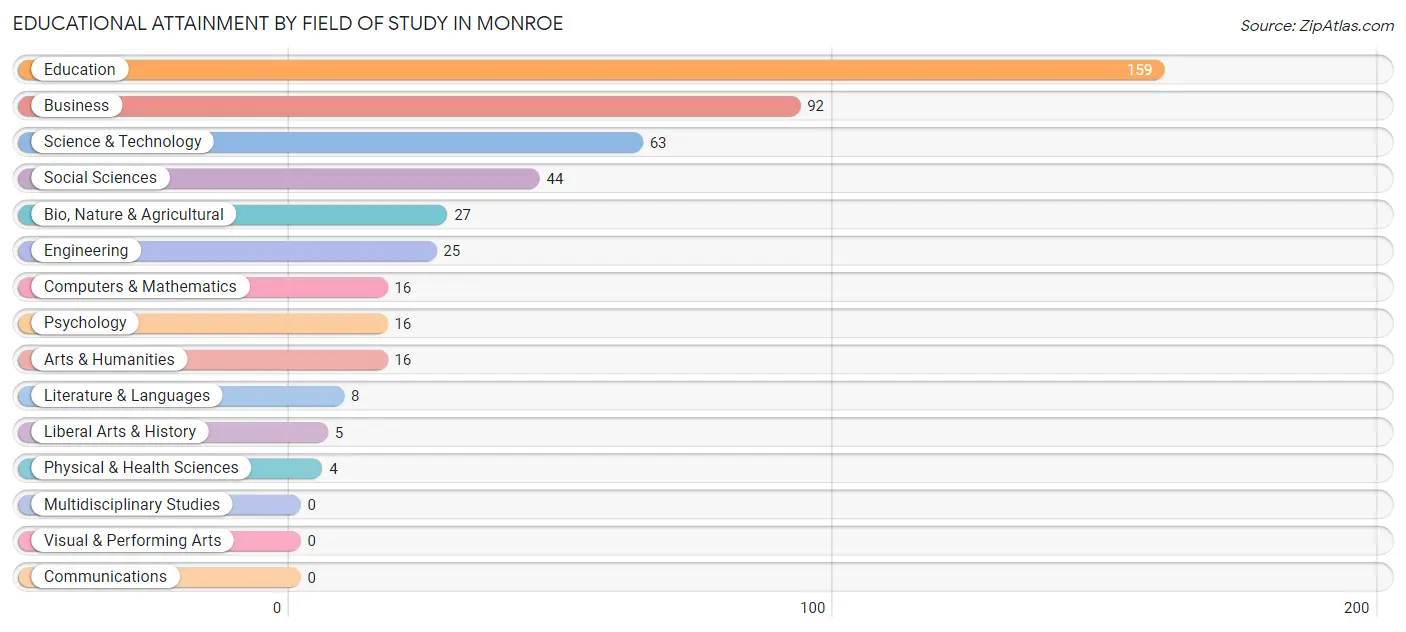
| Field of Study | # Graduates | % Graduates |
| Computers & Mathematics | 16 | 3.4% |
| Bio, Nature & Agricultural | 27 | 5.7% |
| Physical & Health Sciences | 4 | 0.8% |
| Psychology | 16 | 3.4% |
| Social Sciences | 44 | 9.3% |
| Engineering | 25 | 5.3% |
| Multidisciplinary Studies | 0 | 0.0% |
| Science & Technology | 63 | 13.3% |
| Business | 92 | 19.4% |
| Education | 159 | 33.5% |
| Literature & Languages | 8 | 1.7% |
| Liberal Arts & History | 5 | 1.1% |
| Visual & Performing Arts | 0 | 0.0% |
| Communications | 0 | 0.0% |
| Arts & Humanities | 16 | 3.4% |
| Total | 475 | 100.0% |
Transportation & Commute in Monroe
Vehicle Availability by Sex in Monroe
The most prevalent vehicle ownership categories in Monroe are males with 3 vehicles (210, accounting for 35.3%) and females with 3 vehicles (117, making up 42.5%).
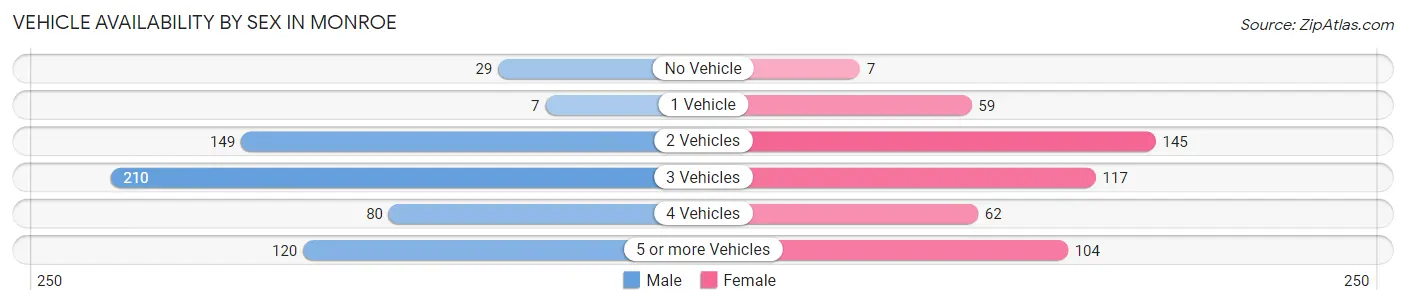
| Vehicles Available | Male | Female |
| No Vehicle | 29 (4.9%) | 7 (1.4%) |
| 1 Vehicle | 7 (1.2%) | 59 (11.9%) |
| 2 Vehicles | 149 (25.0%) | 145 (29.3%) |
| 3 Vehicles | 210 (35.3%) | 117 (23.7%) |
| 4 Vehicles | 80 (13.5%) | 62 (12.6%) |
| 5 or more Vehicles | 120 (20.2%) | 104 (21.0%) |
| Total | 595 (100.0%) | 494 (100.0%) |
Commute Time in Monroe
The most frequently occuring commute durations in Monroe are 15 to 19 minutes (321 commuters, 32.9%), less than 5 minutes (221 commuters, 22.7%), and 10 to 14 minutes (196 commuters, 20.1%).
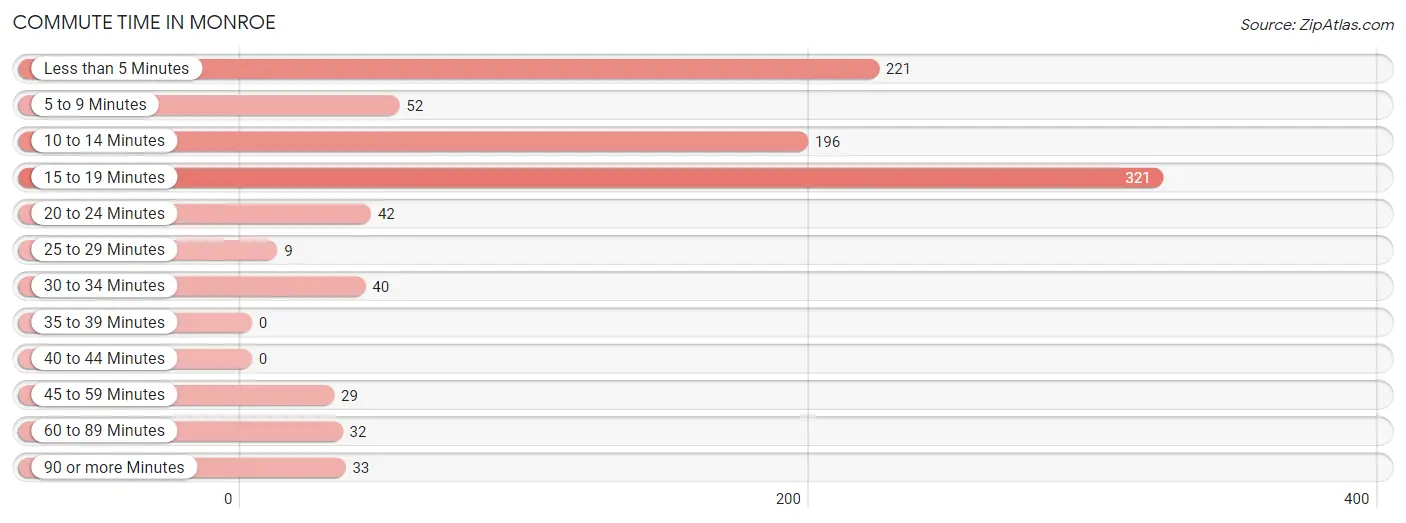
| Commute Time | # Commuters | % Commuters |
| Less than 5 Minutes | 221 | 22.7% |
| 5 to 9 Minutes | 52 | 5.3% |
| 10 to 14 Minutes | 196 | 20.1% |
| 15 to 19 Minutes | 321 | 32.9% |
| 20 to 24 Minutes | 42 | 4.3% |
| 25 to 29 Minutes | 9 | 0.9% |
| 30 to 34 Minutes | 40 | 4.1% |
| 35 to 39 Minutes | 0 | 0.0% |
| 40 to 44 Minutes | 0 | 0.0% |
| 45 to 59 Minutes | 29 | 3.0% |
| 60 to 89 Minutes | 32 | 3.3% |
| 90 or more Minutes | 33 | 3.4% |
Commute Time by Sex in Monroe
The most common commute times in Monroe are 15 to 19 minutes (209 commuters, 36.7%) for males and less than 5 minutes (133 commuters, 32.8%) for females.
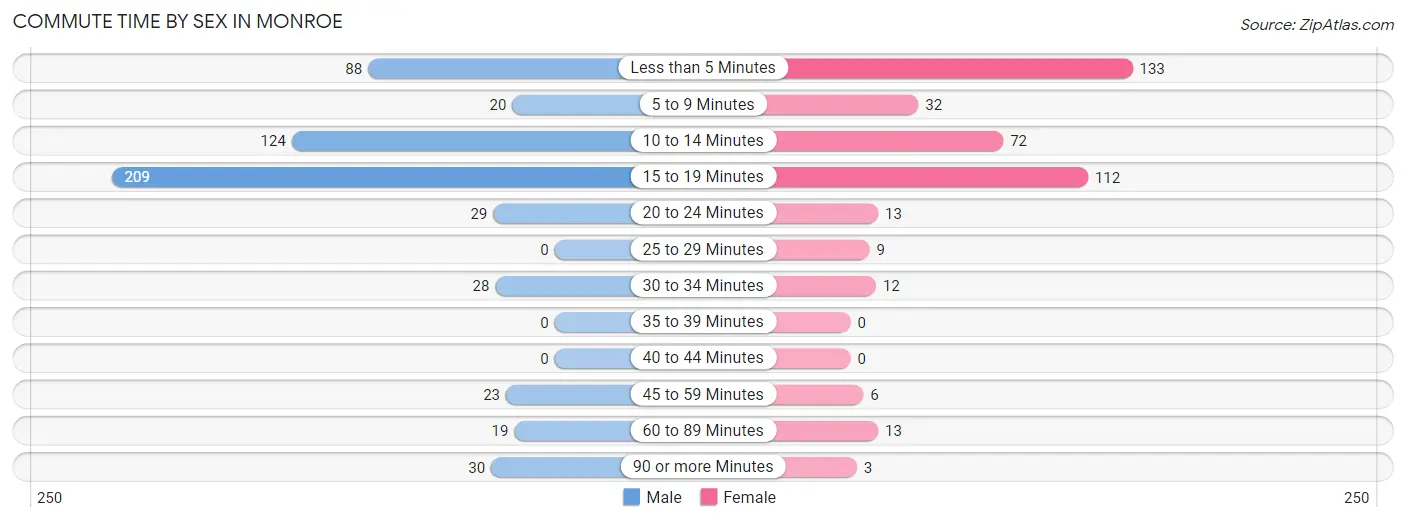
| Commute Time | Male | Female |
| Less than 5 Minutes | 88 (15.4%) | 133 (32.8%) |
| 5 to 9 Minutes | 20 (3.5%) | 32 (7.9%) |
| 10 to 14 Minutes | 124 (21.7%) | 72 (17.8%) |
| 15 to 19 Minutes | 209 (36.7%) | 112 (27.7%) |
| 20 to 24 Minutes | 29 (5.1%) | 13 (3.2%) |
| 25 to 29 Minutes | 0 (0.0%) | 9 (2.2%) |
| 30 to 34 Minutes | 28 (4.9%) | 12 (3.0%) |
| 35 to 39 Minutes | 0 (0.0%) | 0 (0.0%) |
| 40 to 44 Minutes | 0 (0.0%) | 0 (0.0%) |
| 45 to 59 Minutes | 23 (4.0%) | 6 (1.5%) |
| 60 to 89 Minutes | 19 (3.3%) | 13 (3.2%) |
| 90 or more Minutes | 30 (5.3%) | 3 (0.7%) |
Time of Departure to Work by Sex in Monroe
The most frequent times of departure to work in Monroe are 7:30 AM to 7:59 AM (107, 18.8%) for males and 7:30 AM to 7:59 AM (84, 20.7%) for females.
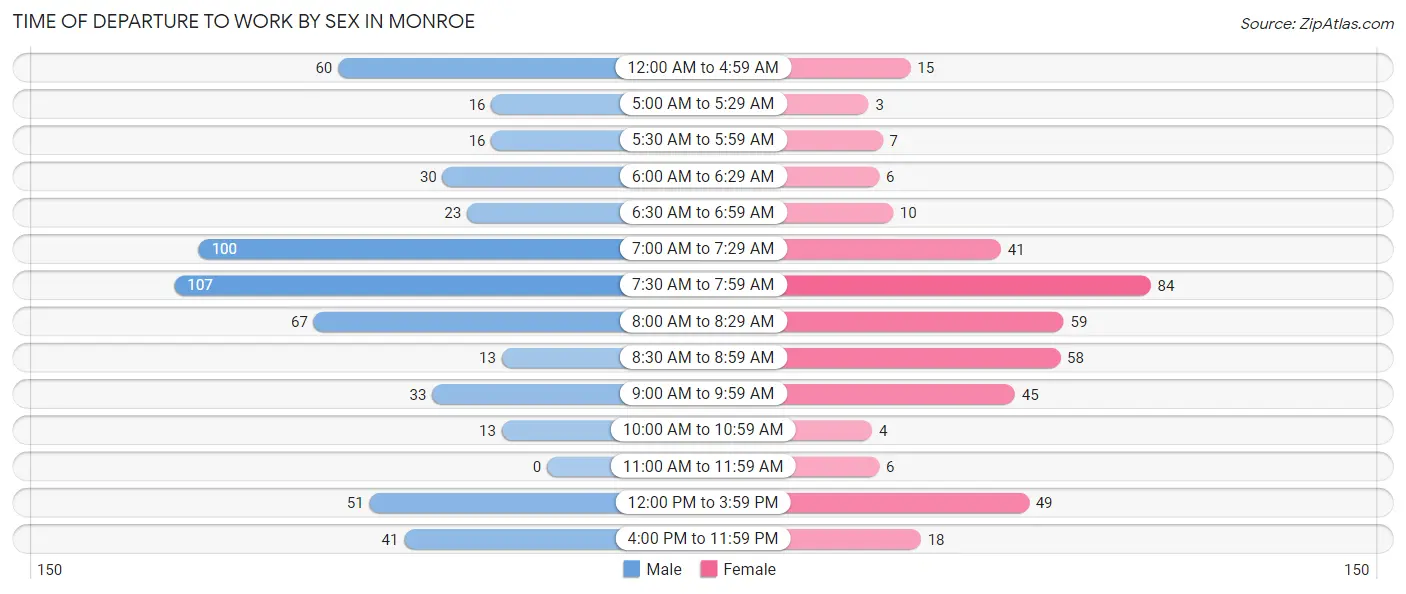
| Time of Departure | Male | Female |
| 12:00 AM to 4:59 AM | 60 (10.5%) | 15 (3.7%) |
| 5:00 AM to 5:29 AM | 16 (2.8%) | 3 (0.7%) |
| 5:30 AM to 5:59 AM | 16 (2.8%) | 7 (1.7%) |
| 6:00 AM to 6:29 AM | 30 (5.3%) | 6 (1.5%) |
| 6:30 AM to 6:59 AM | 23 (4.0%) | 10 (2.5%) |
| 7:00 AM to 7:29 AM | 100 (17.5%) | 41 (10.1%) |
| 7:30 AM to 7:59 AM | 107 (18.8%) | 84 (20.7%) |
| 8:00 AM to 8:29 AM | 67 (11.7%) | 59 (14.6%) |
| 8:30 AM to 8:59 AM | 13 (2.3%) | 58 (14.3%) |
| 9:00 AM to 9:59 AM | 33 (5.8%) | 45 (11.1%) |
| 10:00 AM to 10:59 AM | 13 (2.3%) | 4 (1.0%) |
| 11:00 AM to 11:59 AM | 0 (0.0%) | 6 (1.5%) |
| 12:00 PM to 3:59 PM | 51 (8.9%) | 49 (12.1%) |
| 4:00 PM to 11:59 PM | 41 (7.2%) | 18 (4.4%) |
| Total | 570 (100.0%) | 405 (100.0%) |
Housing Occupancy in Monroe
Occupancy by Ownership in Monroe
Of the total 967 dwellings in Monroe, owner-occupied units account for 845 (87.4%), while renter-occupied units make up 122 (12.6%).
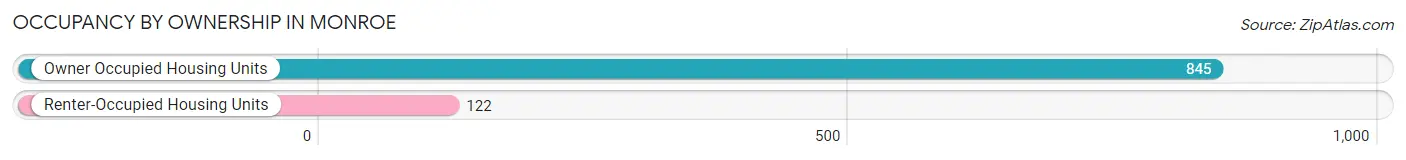
| Occupancy | # Housing Units | % Housing Units |
| Owner Occupied Housing Units | 845 | 87.4% |
| Renter-Occupied Housing Units | 122 | 12.6% |
| Total Occupied Housing Units | 967 | 100.0% |
Occupancy by Household Size in Monroe
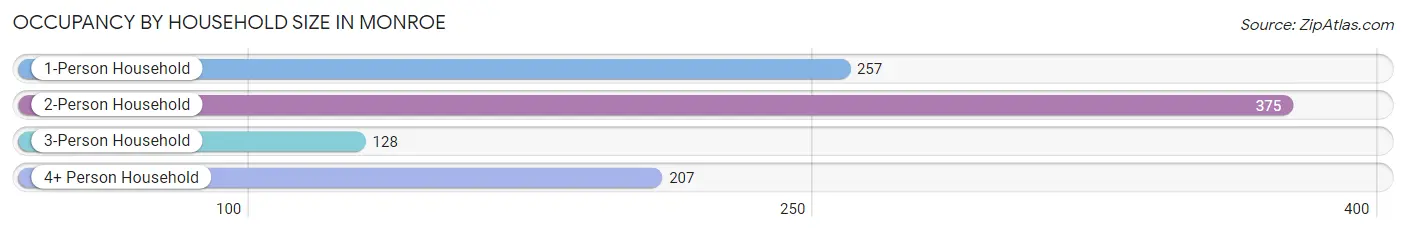
| Household Size | # Housing Units | % Housing Units |
| 1-Person Household | 257 | 26.6% |
| 2-Person Household | 375 | 38.8% |
| 3-Person Household | 128 | 13.2% |
| 4+ Person Household | 207 | 21.4% |
| Total Housing Units | 967 | 100.0% |
Occupancy by Ownership by Household Size in Monroe
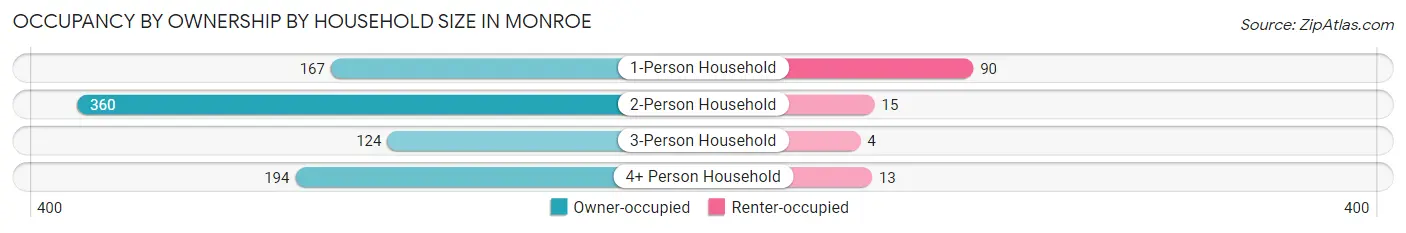
| Household Size | Owner-occupied | Renter-occupied |
| 1-Person Household | 167 (65.0%) | 90 (35.0%) |
| 2-Person Household | 360 (96.0%) | 15 (4.0%) |
| 3-Person Household | 124 (96.9%) | 4 (3.1%) |
| 4+ Person Household | 194 (93.7%) | 13 (6.3%) |
| Total Housing Units | 845 (87.4%) | 122 (12.6%) |
Occupancy by Educational Attainment in Monroe
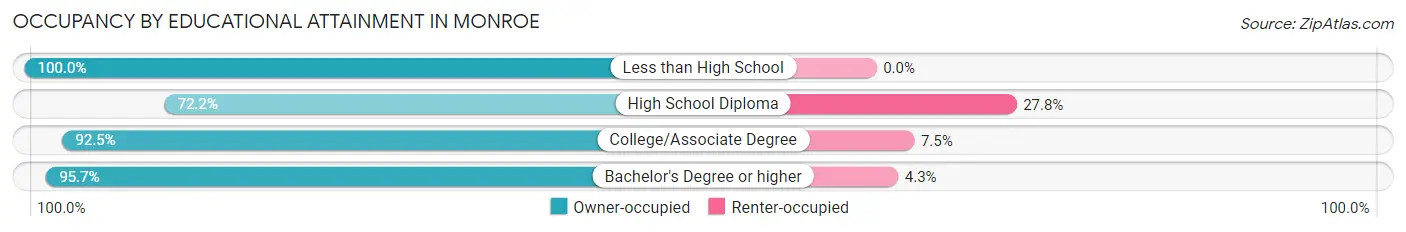
| Household Size | Owner-occupied | Renter-occupied |
| Less than High School | 38 (100.0%) | 0 (0.0%) |
| High School Diploma | 216 (72.2%) | 83 (27.8%) |
| College/Associate Degree | 346 (92.5%) | 28 (7.5%) |
| Bachelor's Degree or higher | 245 (95.7%) | 11 (4.3%) |
Occupancy by Age of Householder in Monroe
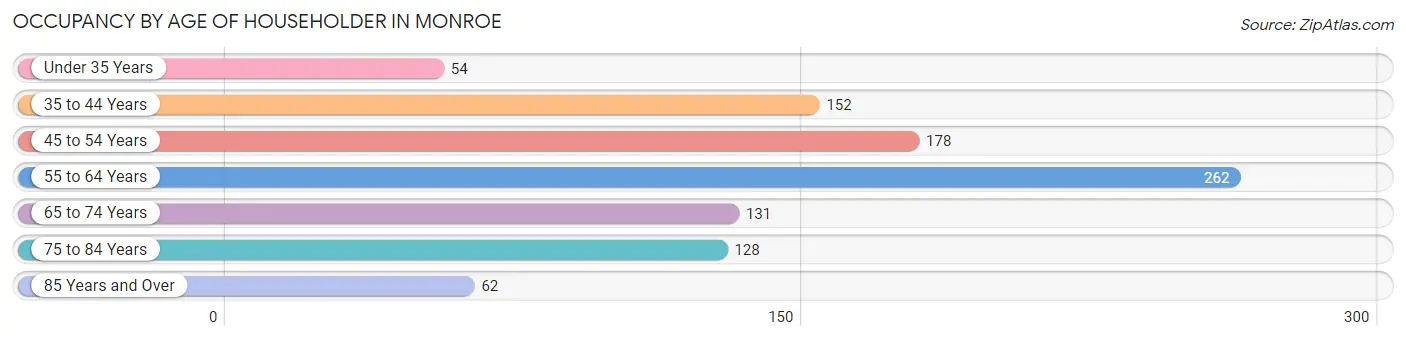
| Age Bracket | # Households | % Households |
| Under 35 Years | 54 | 5.6% |
| 35 to 44 Years | 152 | 15.7% |
| 45 to 54 Years | 178 | 18.4% |
| 55 to 64 Years | 262 | 27.1% |
| 65 to 74 Years | 131 | 13.6% |
| 75 to 84 Years | 128 | 13.2% |
| 85 Years and Over | 62 | 6.4% |
| Total | 967 | 100.0% |
Housing Finances in Monroe
Median Income by Occupancy in Monroe
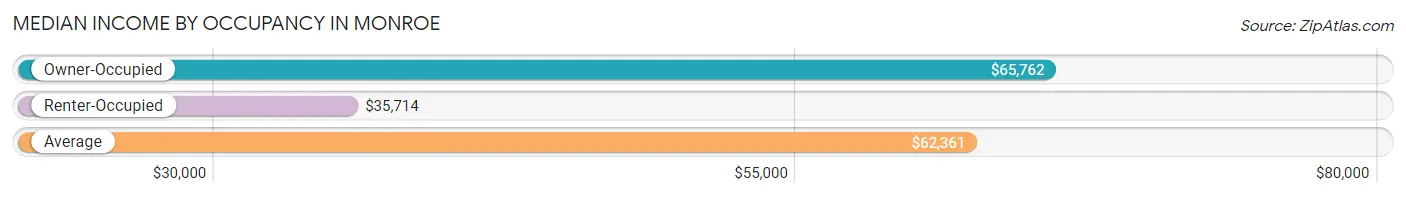
| Occupancy Type | # Households | Median Income |
| Owner-Occupied | 845 (87.4%) | $65,762 |
| Renter-Occupied | 122 (12.6%) | $35,714 |
| Average | 967 (100.0%) | $62,361 |
Occupancy by Householder Income Bracket in Monroe
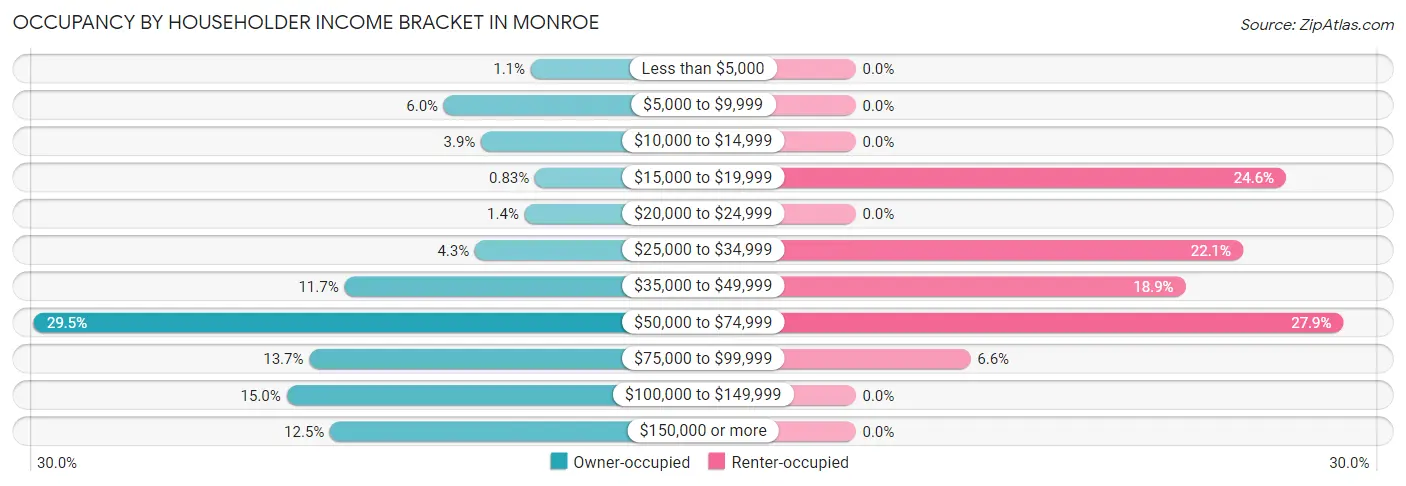
| Income Bracket | Owner-occupied | Renter-occupied |
| Less than $5,000 | 9 (1.1%) | 0 (0.0%) |
| $5,000 to $9,999 | 51 (6.0%) | 0 (0.0%) |
| $10,000 to $14,999 | 33 (3.9%) | 0 (0.0%) |
| $15,000 to $19,999 | 7 (0.8%) | 30 (24.6%) |
| $20,000 to $24,999 | 12 (1.4%) | 0 (0.0%) |
| $25,000 to $34,999 | 36 (4.3%) | 27 (22.1%) |
| $35,000 to $49,999 | 99 (11.7%) | 23 (18.9%) |
| $50,000 to $74,999 | 249 (29.5%) | 34 (27.9%) |
| $75,000 to $99,999 | 116 (13.7%) | 8 (6.6%) |
| $100,000 to $149,999 | 127 (15.0%) | 0 (0.0%) |
| $150,000 or more | 106 (12.5%) | 0 (0.0%) |
| Total | 845 (100.0%) | 122 (100.0%) |
Monthly Housing Cost Tiers in Monroe
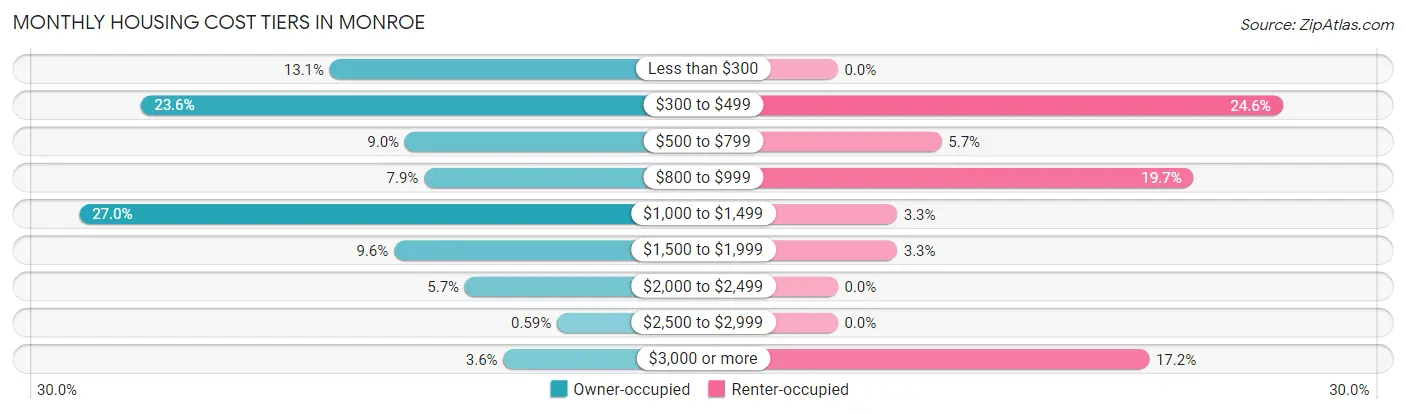
| Monthly Cost | Owner-occupied | Renter-occupied |
| Less than $300 | 111 (13.1%) | 0 (0.0%) |
| $300 to $499 | 199 (23.5%) | 30 (24.6%) |
| $500 to $799 | 76 (9.0%) | 7 (5.7%) |
| $800 to $999 | 67 (7.9%) | 24 (19.7%) |
| $1,000 to $1,499 | 228 (27.0%) | 4 (3.3%) |
| $1,500 to $1,999 | 81 (9.6%) | 4 (3.3%) |
| $2,000 to $2,499 | 48 (5.7%) | 0 (0.0%) |
| $2,500 to $2,999 | 5 (0.6%) | 0 (0.0%) |
| $3,000 or more | 30 (3.5%) | 21 (17.2%) |
| Total | 845 (100.0%) | 122 (100.0%) |
Physical Housing Characteristics in Monroe
Housing Structures in Monroe
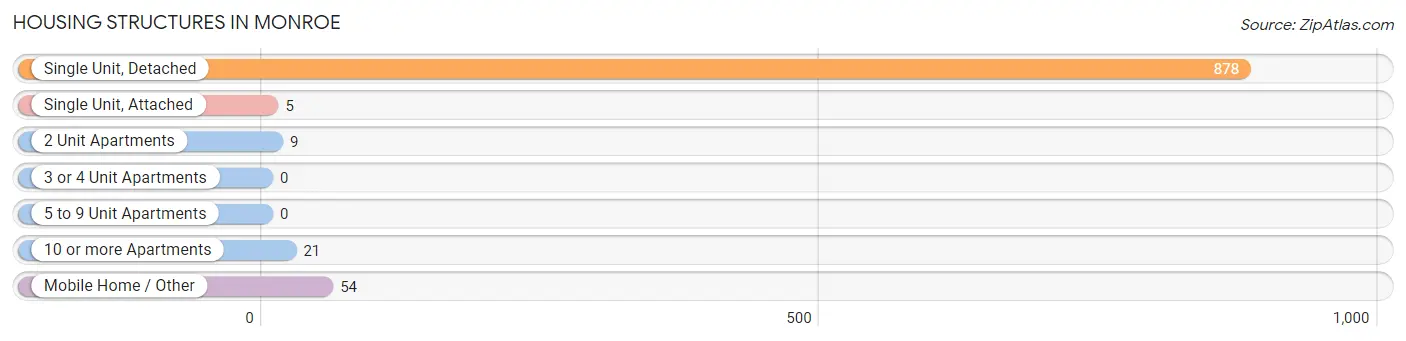
| Structure Type | # Housing Units | % Housing Units |
| Single Unit, Detached | 878 | 90.8% |
| Single Unit, Attached | 5 | 0.5% |
| 2 Unit Apartments | 9 | 0.9% |
| 3 or 4 Unit Apartments | 0 | 0.0% |
| 5 to 9 Unit Apartments | 0 | 0.0% |
| 10 or more Apartments | 21 | 2.2% |
| Mobile Home / Other | 54 | 5.6% |
| Total | 967 | 100.0% |
Housing Structures by Occupancy in Monroe
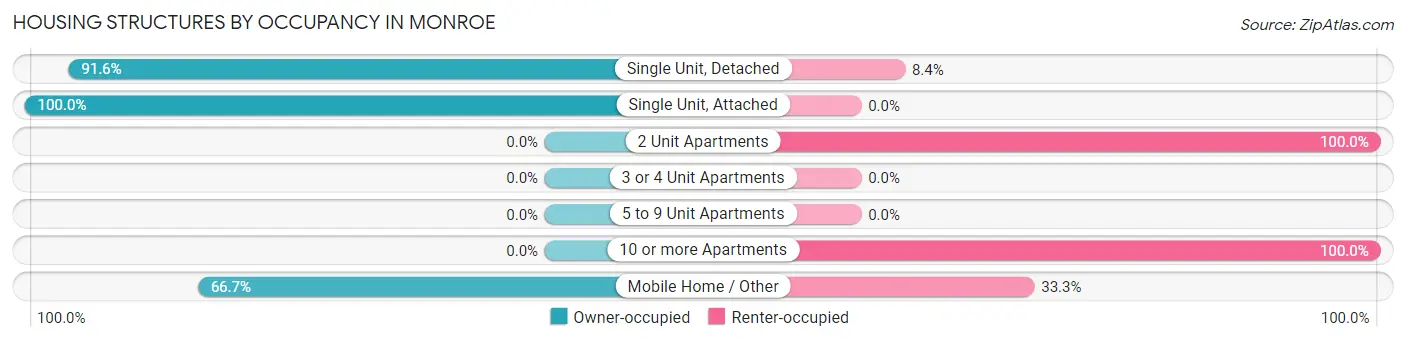
| Structure Type | Owner-occupied | Renter-occupied |
| Single Unit, Detached | 804 (91.6%) | 74 (8.4%) |
| Single Unit, Attached | 5 (100.0%) | 0 (0.0%) |
| 2 Unit Apartments | 0 (0.0%) | 9 (100.0%) |
| 3 or 4 Unit Apartments | 0 (0.0%) | 0 (0.0%) |
| 5 to 9 Unit Apartments | 0 (0.0%) | 0 (0.0%) |
| 10 or more Apartments | 0 (0.0%) | 21 (100.0%) |
| Mobile Home / Other | 36 (66.7%) | 18 (33.3%) |
| Total | 845 (87.4%) | 122 (12.6%) |
Housing Structures by Number of Rooms in Monroe
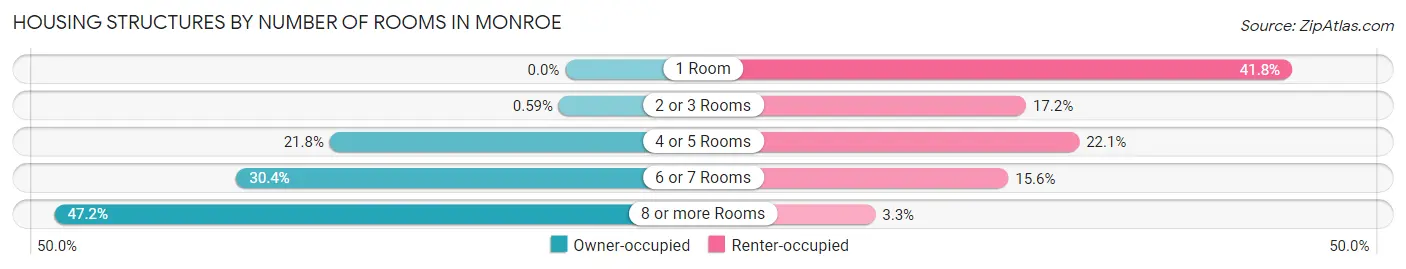
| Number of Rooms | Owner-occupied | Renter-occupied |
| 1 Room | 0 (0.0%) | 51 (41.8%) |
| 2 or 3 Rooms | 5 (0.6%) | 21 (17.2%) |
| 4 or 5 Rooms | 184 (21.8%) | 27 (22.1%) |
| 6 or 7 Rooms | 257 (30.4%) | 19 (15.6%) |
| 8 or more Rooms | 399 (47.2%) | 4 (3.3%) |
| Total | 845 (100.0%) | 122 (100.0%) |
Housing Structure by Heating Type in Monroe
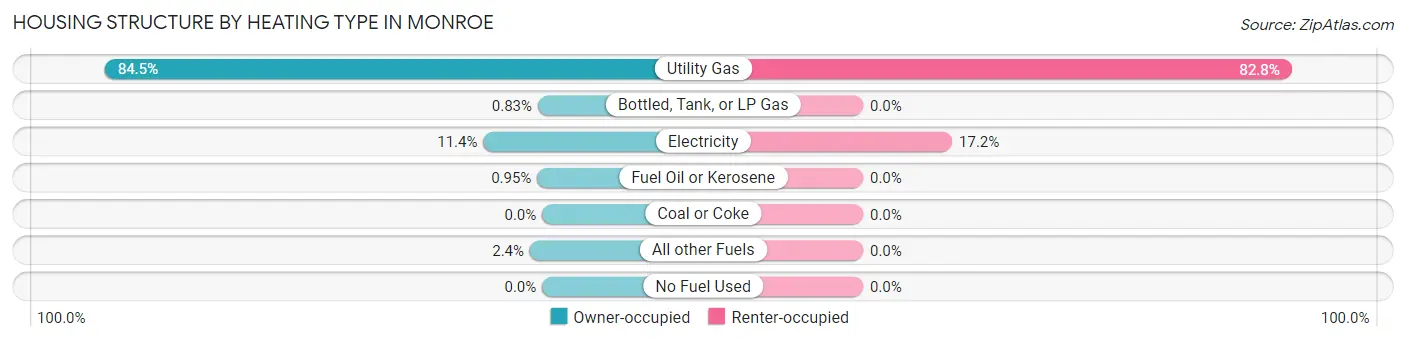
| Heating Type | Owner-occupied | Renter-occupied |
| Utility Gas | 714 (84.5%) | 101 (82.8%) |
| Bottled, Tank, or LP Gas | 7 (0.8%) | 0 (0.0%) |
| Electricity | 96 (11.4%) | 21 (17.2%) |
| Fuel Oil or Kerosene | 8 (0.9%) | 0 (0.0%) |
| Coal or Coke | 0 (0.0%) | 0 (0.0%) |
| All other Fuels | 20 (2.4%) | 0 (0.0%) |
| No Fuel Used | 0 (0.0%) | 0 (0.0%) |
| Total | 845 (100.0%) | 122 (100.0%) |
Household Vehicle Usage in Monroe
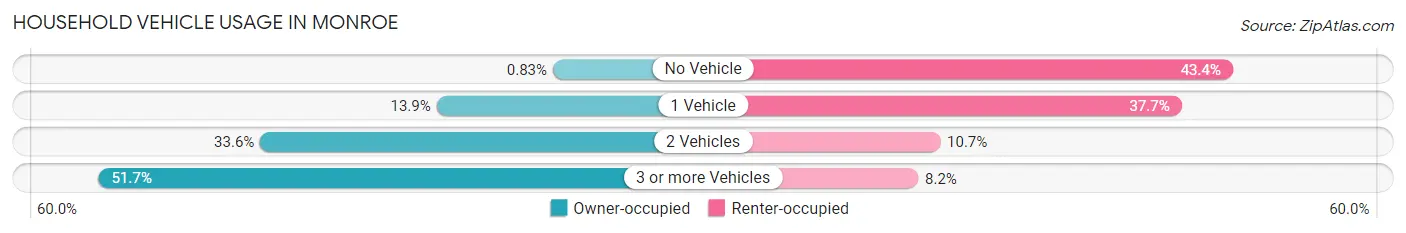
| Vehicles per Household | Owner-occupied | Renter-occupied |
| No Vehicle | 7 (0.8%) | 53 (43.4%) |
| 1 Vehicle | 117 (13.9%) | 46 (37.7%) |
| 2 Vehicles | 284 (33.6%) | 13 (10.7%) |
| 3 or more Vehicles | 437 (51.7%) | 10 (8.2%) |
| Total | 845 (100.0%) | 122 (100.0%) |
Real Estate & Mortgages in Monroe
Real Estate and Mortgage Overview in Monroe
| Characteristic | Without Mortgage | With Mortgage |
| Housing Units | 360 | 485 |
| Median Property Value | $186,600 | $274,300 |
| Median Household Income | $62,946 | $79 |
| Monthly Housing Costs | $340 | $30 |
| Real Estate Taxes | $1,214 | $0 |
Property Value by Mortgage Status in Monroe
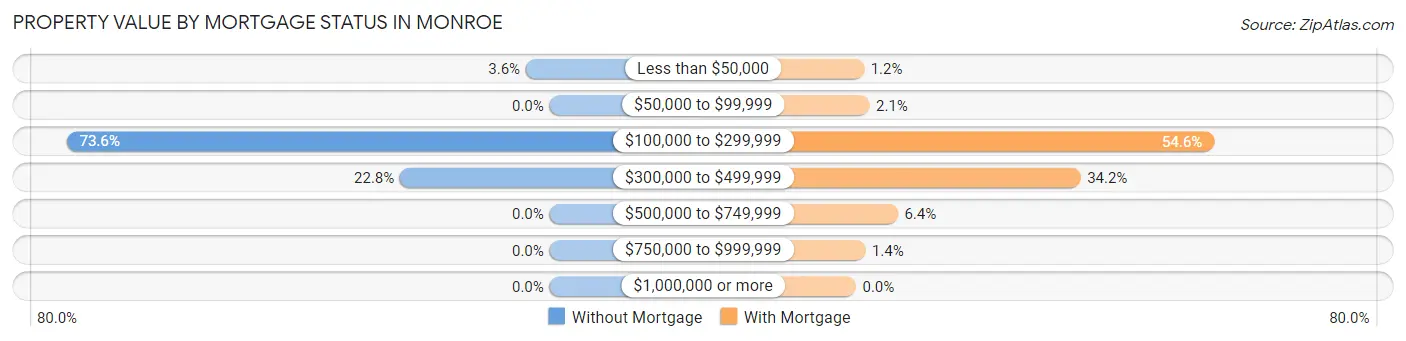
| Property Value | Without Mortgage | With Mortgage |
| Less than $50,000 | 13 (3.6%) | 6 (1.2%) |
| $50,000 to $99,999 | 0 (0.0%) | 10 (2.1%) |
| $100,000 to $299,999 | 265 (73.6%) | 265 (54.6%) |
| $300,000 to $499,999 | 82 (22.8%) | 166 (34.2%) |
| $500,000 to $749,999 | 0 (0.0%) | 31 (6.4%) |
| $750,000 to $999,999 | 0 (0.0%) | 7 (1.4%) |
| $1,000,000 or more | 0 (0.0%) | 0 (0.0%) |
| Total | 360 (100.0%) | 485 (100.0%) |
Household Income by Mortgage Status in Monroe
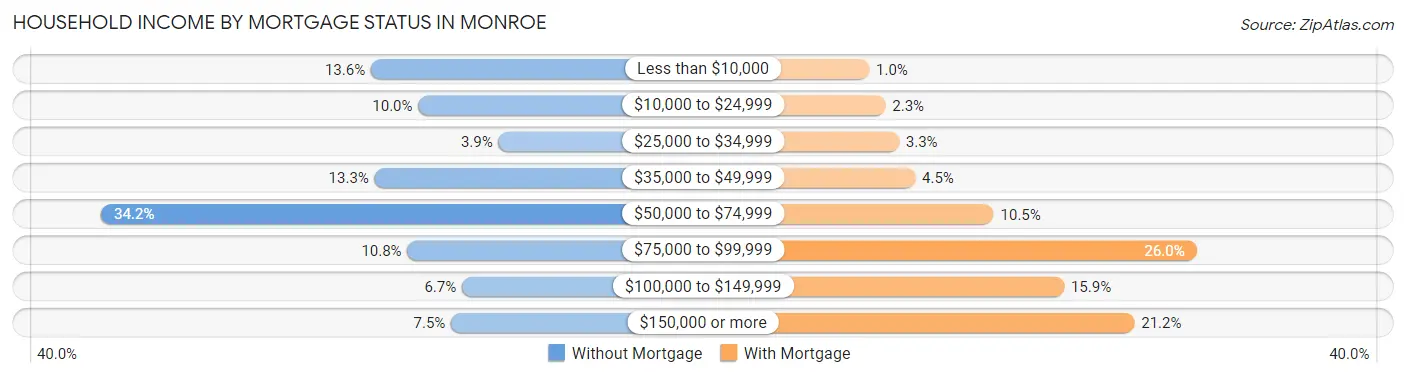
| Household Income | Without Mortgage | With Mortgage |
| Less than $10,000 | 49 (13.6%) | 5 (1.0%) |
| $10,000 to $24,999 | 36 (10.0%) | 11 (2.3%) |
| $25,000 to $34,999 | 14 (3.9%) | 16 (3.3%) |
| $35,000 to $49,999 | 48 (13.3%) | 22 (4.5%) |
| $50,000 to $74,999 | 123 (34.2%) | 51 (10.5%) |
| $75,000 to $99,999 | 39 (10.8%) | 126 (26.0%) |
| $100,000 to $149,999 | 24 (6.7%) | 77 (15.9%) |
| $150,000 or more | 27 (7.5%) | 103 (21.2%) |
| Total | 360 (100.0%) | 485 (100.0%) |
Property Value to Household Income Ratio in Monroe
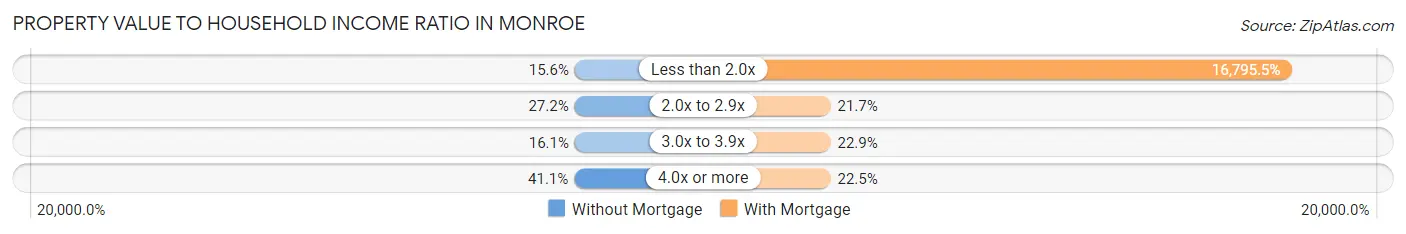
| Value-to-Income Ratio | Without Mortgage | With Mortgage |
| Less than 2.0x | 56 (15.6%) | 81,458 (16,795.5%) |
| 2.0x to 2.9x | 98 (27.2%) | 105 (21.6%) |
| 3.0x to 3.9x | 58 (16.1%) | 111 (22.9%) |
| 4.0x or more | 148 (41.1%) | 109 (22.5%) |
| Total | 360 (100.0%) | 485 (100.0%) |
Real Estate Taxes by Mortgage Status in Monroe
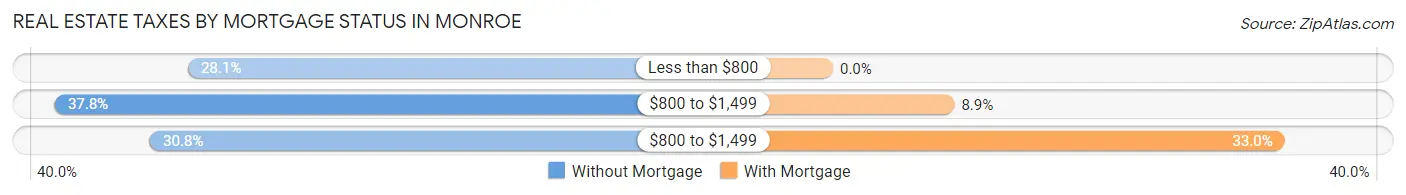
| Property Taxes | Without Mortgage | With Mortgage |
| Less than $800 | 101 (28.1%) | 0 (0.0%) |
| $800 to $1,499 | 136 (37.8%) | 43 (8.9%) |
| $800 to $1,499 | 111 (30.8%) | 160 (33.0%) |
| Total | 360 (100.0%) | 485 (100.0%) |
Health & Disability in Monroe
Health Insurance Coverage by Age in Monroe
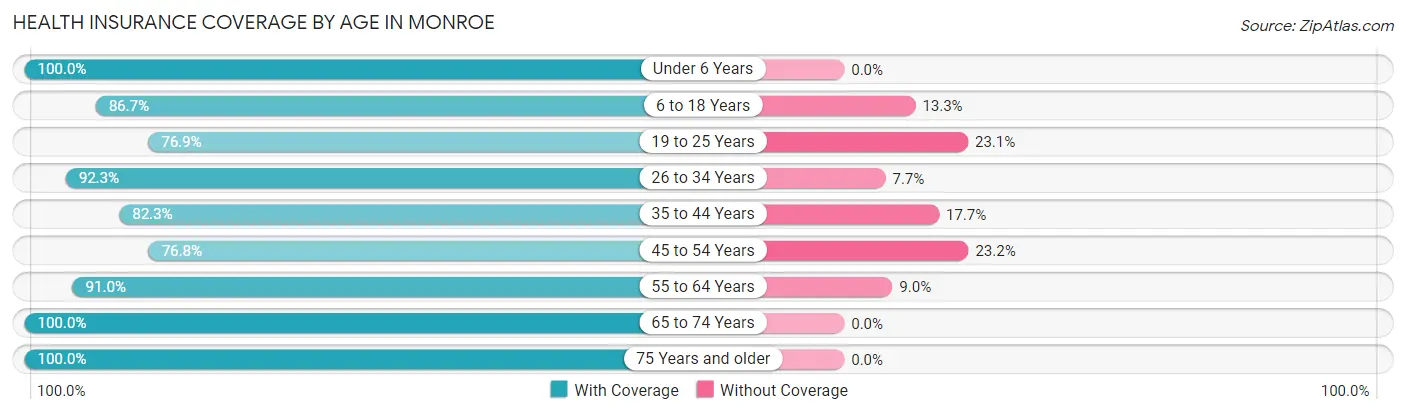
| Age Bracket | With Coverage | Without Coverage |
| Under 6 Years | 107 (100.0%) | 0 (0.0%) |
| 6 to 18 Years | 425 (86.7%) | 65 (13.3%) |
| 19 to 25 Years | 130 (76.9%) | 39 (23.1%) |
| 26 to 34 Years | 144 (92.3%) | 12 (7.7%) |
| 35 to 44 Years | 247 (82.3%) | 53 (17.7%) |
| 45 to 54 Years | 219 (76.8%) | 66 (23.2%) |
| 55 to 64 Years | 396 (91.0%) | 39 (9.0%) |
| 65 to 74 Years | 260 (100.0%) | 0 (0.0%) |
| 75 Years and older | 313 (100.0%) | 0 (0.0%) |
| Total | 2,241 (89.1%) | 274 (10.9%) |
Health Insurance Coverage by Citizenship Status in Monroe
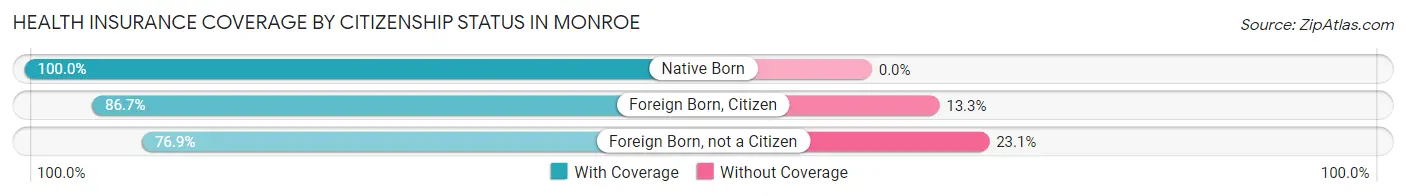
| Citizenship Status | With Coverage | Without Coverage |
| Native Born | 107 (100.0%) | 0 (0.0%) |
| Foreign Born, Citizen | 425 (86.7%) | 65 (13.3%) |
| Foreign Born, not a Citizen | 130 (76.9%) | 39 (23.1%) |
Health Insurance Coverage by Household Income in Monroe
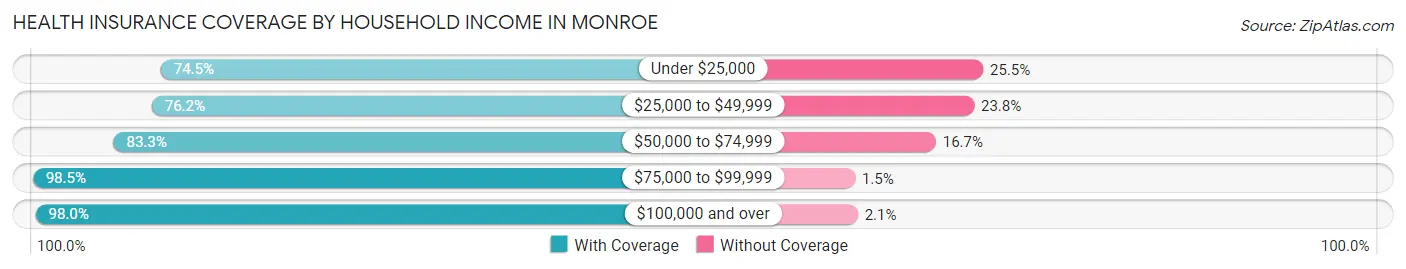
| Household Income | With Coverage | Without Coverage |
| Under $25,000 | 108 (74.5%) | 37 (25.5%) |
| $25,000 to $49,999 | 345 (76.2%) | 108 (23.8%) |
| $50,000 to $74,999 | 525 (83.3%) | 105 (16.7%) |
| $75,000 to $99,999 | 451 (98.5%) | 7 (1.5%) |
| $100,000 and over | 812 (98.0%) | 17 (2.1%) |
Public vs Private Health Insurance Coverage by Age in Monroe
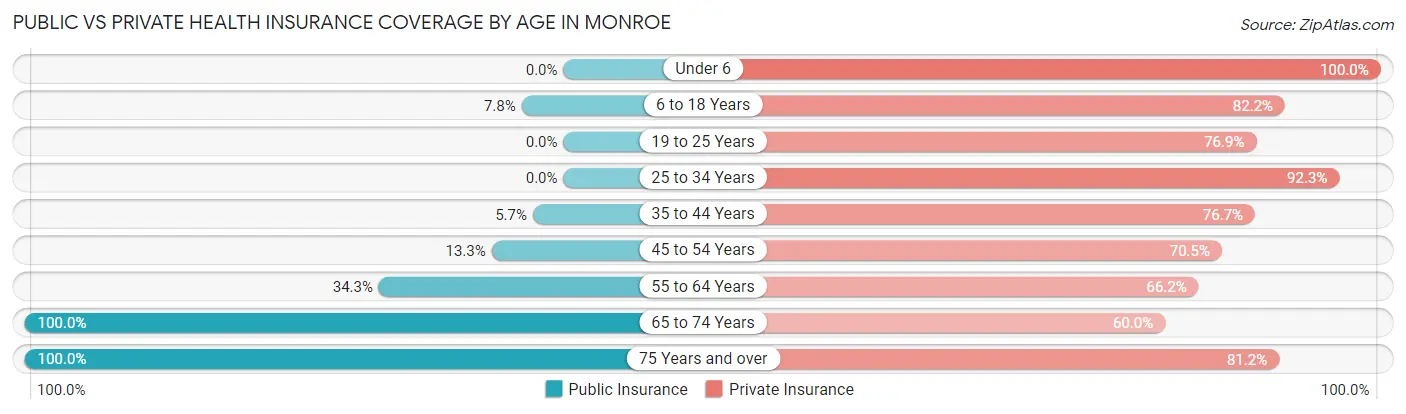
| Age Bracket | Public Insurance | Private Insurance |
| Under 6 | 0 (0.0%) | 107 (100.0%) |
| 6 to 18 Years | 38 (7.8%) | 403 (82.2%) |
| 19 to 25 Years | 0 (0.0%) | 130 (76.9%) |
| 25 to 34 Years | 0 (0.0%) | 144 (92.3%) |
| 35 to 44 Years | 17 (5.7%) | 230 (76.7%) |
| 45 to 54 Years | 38 (13.3%) | 201 (70.5%) |
| 55 to 64 Years | 149 (34.3%) | 288 (66.2%) |
| 65 to 74 Years | 260 (100.0%) | 156 (60.0%) |
| 75 Years and over | 313 (100.0%) | 254 (81.1%) |
| Total | 815 (32.4%) | 1,913 (76.1%) |
Disability Status by Sex by Age in Monroe
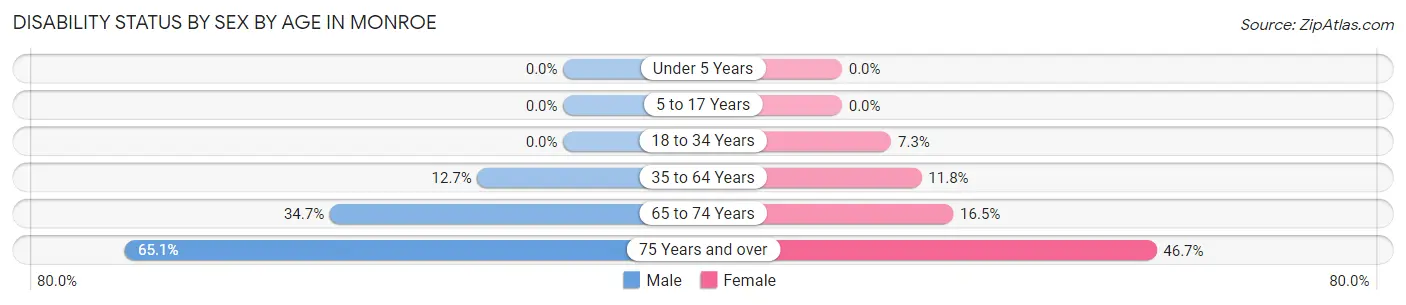
| Age Bracket | Male | Female |
| Under 5 Years | 0 (0.0%) | 0 (0.0%) |
| 5 to 17 Years | 0 (0.0%) | 0 (0.0%) |
| 18 to 34 Years | 0 (0.0%) | 12 (7.3%) |
| 35 to 64 Years | 62 (12.7%) | 63 (11.8%) |
| 65 to 74 Years | 44 (34.6%) | 22 (16.5%) |
| 75 Years and over | 95 (65.1%) | 78 (46.7%) |
Disability Class by Sex by Age in Monroe
Disability Class: Hearing Difficulty
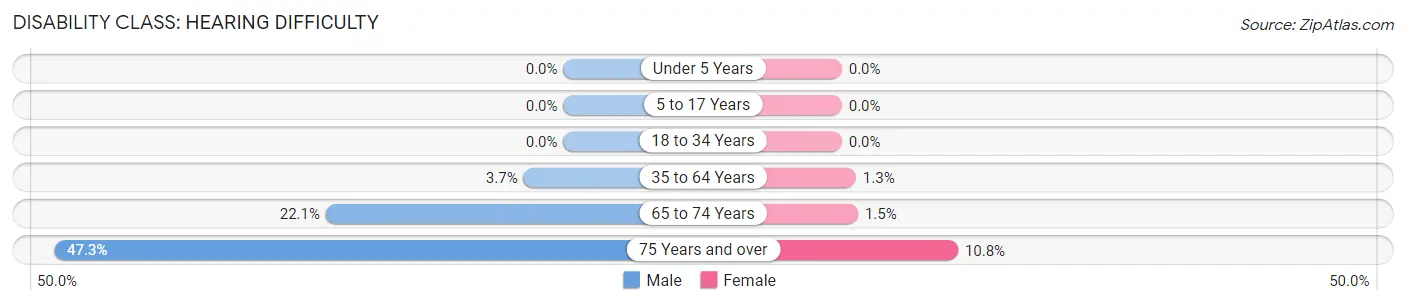
| Age Bracket | Male | Female |
| Under 5 Years | 0 (0.0%) | 0 (0.0%) |
| 5 to 17 Years | 0 (0.0%) | 0 (0.0%) |
| 18 to 34 Years | 0 (0.0%) | 0 (0.0%) |
| 35 to 64 Years | 18 (3.7%) | 7 (1.3%) |
| 65 to 74 Years | 28 (22.1%) | 2 (1.5%) |
| 75 Years and over | 69 (47.3%) | 18 (10.8%) |
Disability Class: Vision Difficulty
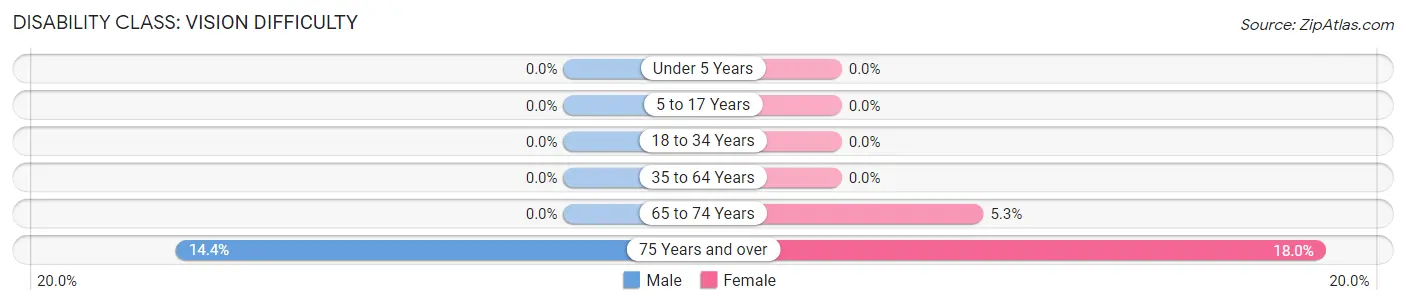
| Age Bracket | Male | Female |
| Under 5 Years | 0 (0.0%) | 0 (0.0%) |
| 5 to 17 Years | 0 (0.0%) | 0 (0.0%) |
| 18 to 34 Years | 0 (0.0%) | 0 (0.0%) |
| 35 to 64 Years | 0 (0.0%) | 0 (0.0%) |
| 65 to 74 Years | 0 (0.0%) | 7 (5.3%) |
| 75 Years and over | 21 (14.4%) | 30 (18.0%) |
Disability Class: Cognitive Difficulty
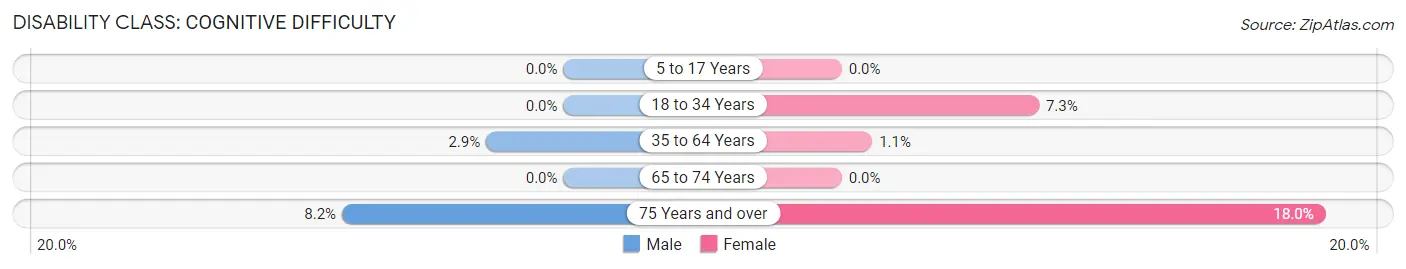
| Age Bracket | Male | Female |
| 5 to 17 Years | 0 (0.0%) | 0 (0.0%) |
| 18 to 34 Years | 0 (0.0%) | 12 (7.3%) |
| 35 to 64 Years | 14 (2.9%) | 6 (1.1%) |
| 65 to 74 Years | 0 (0.0%) | 0 (0.0%) |
| 75 Years and over | 12 (8.2%) | 30 (18.0%) |
Disability Class: Ambulatory Difficulty
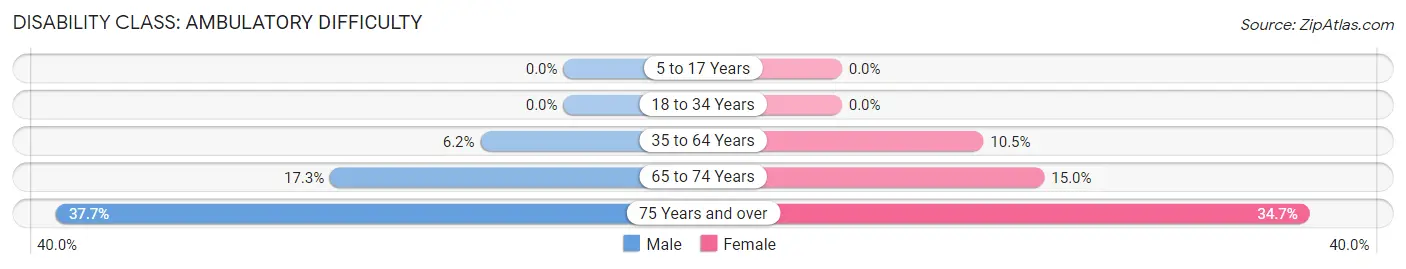
| Age Bracket | Male | Female |
| 5 to 17 Years | 0 (0.0%) | 0 (0.0%) |
| 18 to 34 Years | 0 (0.0%) | 0 (0.0%) |
| 35 to 64 Years | 30 (6.2%) | 56 (10.5%) |
| 65 to 74 Years | 22 (17.3%) | 20 (15.0%) |
| 75 Years and over | 55 (37.7%) | 58 (34.7%) |
Disability Class: Self-Care Difficulty
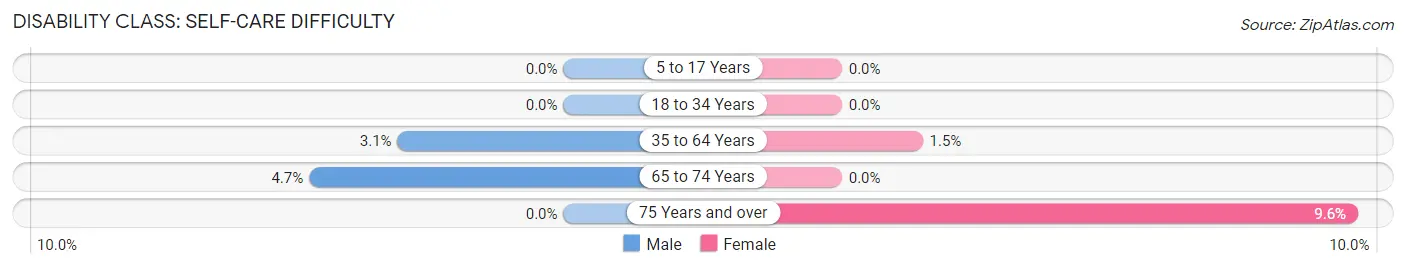
| Age Bracket | Male | Female |
| 5 to 17 Years | 0 (0.0%) | 0 (0.0%) |
| 18 to 34 Years | 0 (0.0%) | 0 (0.0%) |
| 35 to 64 Years | 15 (3.1%) | 8 (1.5%) |
| 65 to 74 Years | 6 (4.7%) | 0 (0.0%) |
| 75 Years and over | 0 (0.0%) | 16 (9.6%) |
Technology Access in Monroe
Computing Device Access in Monroe
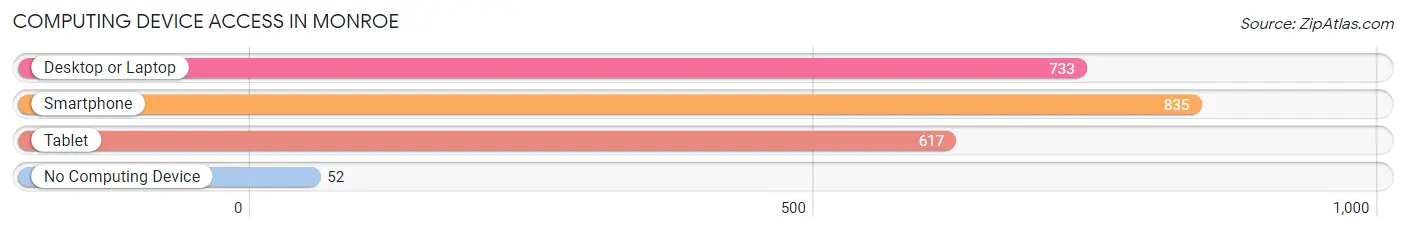
| Device Type | # Households | % Households |
| Desktop or Laptop | 733 | 75.8% |
| Smartphone | 835 | 86.4% |
| Tablet | 617 | 63.8% |
| No Computing Device | 52 | 5.4% |
| Total | 967 | 100.0% |
Internet Access in Monroe
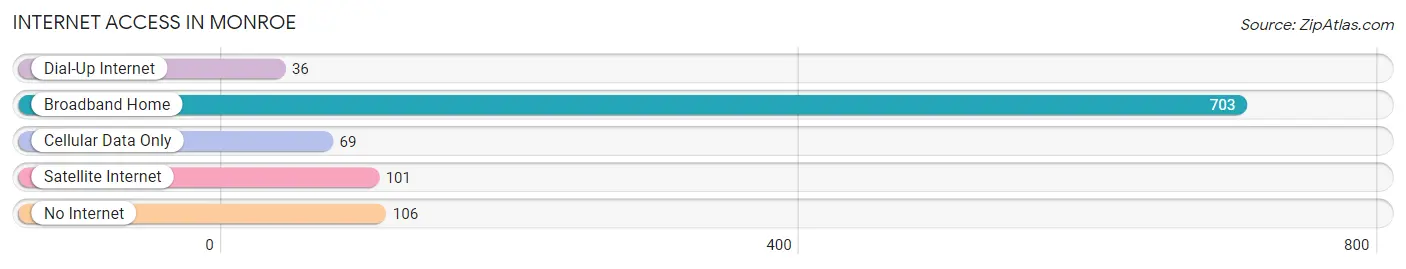
| Internet Type | # Households | % Households |
| Dial-Up Internet | 36 | 3.7% |
| Broadband Home | 703 | 72.7% |
| Cellular Data Only | 69 | 7.1% |
| Satellite Internet | 101 | 10.4% |
| No Internet | 106 | 11.0% |
| Total | 967 | 100.0% |
Monroe Summary
Monroe, Utah is a small city located in Sevier County, Utah. It is situated in the central part of the state, about 40 miles south of Salt Lake City. The city is located in the foothills of the Wasatch Mountains, and is surrounded by the beautiful scenery of the Sevier Valley.
History
Monroe was first settled in 1864 by a group of Mormon pioneers led by John Monroe. The settlers named the town after their leader, and it was incorporated in 1891. The city was originally a farming community, and the main crops grown were wheat, oats, and hay. In the early 1900s, the city began to grow and develop, and by the 1920s, it had become a thriving commercial center.
In the 1950s, the city began to experience a population boom, and by the 1970s, it had become a popular tourist destination. The city is home to several attractions, including the Monroe City Park, the Monroe Museum, and the Monroe Aquatic Center.
Geography
Monroe is located in the central part of Utah, in the foothills of the Wasatch Mountains. The city is situated in the Sevier Valley, and is surrounded by the beautiful scenery of the mountains and the valley. The city is located at an elevation of 4,890 feet, and has a total area of 4.2 square miles.
The climate in Monroe is semi-arid, with hot summers and cold winters. The average annual temperature is around 50 degrees Fahrenheit, and the average annual precipitation is around 12 inches.
Economy
The economy of Monroe is largely based on tourism and agriculture. The city is home to several tourist attractions, including the Monroe City Park, the Monroe Museum, and the Monroe Aquatic Center. The city also has several agricultural businesses, including farms, ranches, and dairies.
The city is also home to several manufacturing businesses, including a furniture factory, a plastics factory, and a metal fabrication plant. The city also has several retail stores, restaurants, and other businesses.
Demographics
As of the 2010 census, Monroe had a population of 2,845 people. The racial makeup of the city was 95.3% White, 0.7% African American, 0.3% Native American, 0.3% Asian, 0.1% Pacific Islander, 1.2% from other races, and 2.3% from two or more races. Hispanic or Latino of any race were 3.2% of the population.
The median income for a household in Monroe was $41,944, and the median income for a family was $48,958. The per capita income for the city was $19,945. About 8.3% of families and 10.2% of the population were below the poverty line, including 13.2% of those under age 18 and 8.2% of those age 65 or over.
Common Questions
What is Per Capita Income in Monroe?
Per Capita income in Monroe is $30,793.
What is the Median Family Income in Monroe?
Median Family Income in Monroe is $74,531.
What is the Median Household income in Monroe?
Median Household Income in Monroe is $62,361.
What is Income or Wage Gap in Monroe?
Income or Wage Gap in Monroe is 60.7%.
Women in Monroe earn 39.3 cents for every dollar earned by a man.
What is Family Income Deficit in Monroe?
Family Income Deficit in Monroe is $6,271.
Families that are below poverty line in Monroe earn $6,271 less on average than the poverty threshold level.
What is Inequality or Gini Index in Monroe?
Inequality or Gini Index in Monroe is 0.41.
What is the Total Population of Monroe?
Total Population of Monroe is 2,530.
What is the Total Male Population of Monroe?
Total Male Population of Monroe is 1,265.
What is the Total Female Population of Monroe?
Total Female Population of Monroe is 1,265.
What is the Ratio of Males per 100 Females in Monroe?
There are 100.00 Males per 100 Females in Monroe.
What is the Ratio of Females per 100 Males in Monroe?
There are 100.00 Females per 100 Males in Monroe.
What is the Median Population Age in Monroe?
Median Population Age in Monroe is 45.8 Years.
What is the Average Family Size in Monroe
Average Family Size in Monroe is 3.2 People.
What is the Average Household Size in Monroe
Average Household Size in Monroe is 2.6 People.
How Large is the Labor Force in Monroe?
There are 1,135 People in the Labor Forcein in Monroe.
What is the Percentage of People in the Labor Force in Monroe?
54.8% of People are in the Labor Force in Monroe.
What is the Unemployment Rate in Monroe?
Unemployment Rate in Monroe is 3.0%.