Cities with the Highest Poverty Level Among Seniors Over the Age of 75 in Utah
RELATED REPORTS & OPTIONS
Highest Poverty | Seniors 75+
Utah
Compare Cities
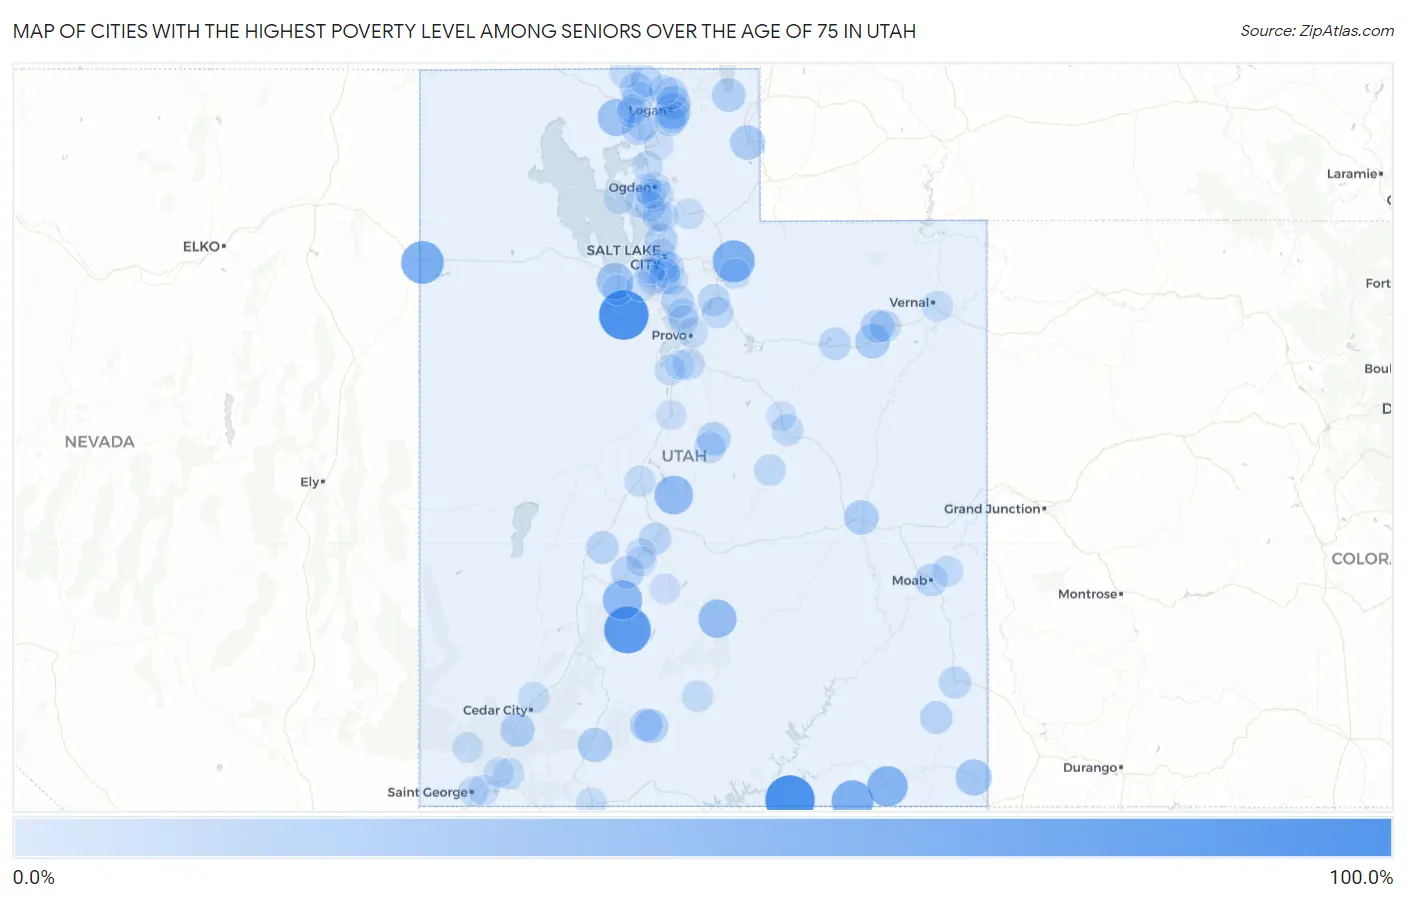
Map of Cities with the Highest Poverty Level Among Seniors Over the Age of 75 in Utah
0.0%
100.0%
Cities with the Highest Poverty Level Among Seniors Over the Age of 75 in Utah
| City | Senior Poverty | vs State | vs National | |
| 1. | Navajo Mountain | 100.0% | 7.5%(+92.5)#1 | 11.1%(+88.9)#56 |
| 2. | Ophir | 100.0% | 7.5%(+92.5)#2 | 11.1%(+88.9)#343 |
| 3. | Junction | 86.7% | 7.5%(+79.2)#3 | 11.1%(+75.6)#439 |
| 4. | East Basin | 82.9% | 7.5%(+75.4)#4 | 11.1%(+71.8)#469 |
| 5. | Wendover | 66.7% | 7.5%(+59.2)#5 | 11.1%(+55.6)#666 |
| 6. | Oakley | 63.1% | 7.5%(+55.6)#6 | 11.1%(+52.0)#755 |
| 7. | Oljato Monument Valley | 62.3% | 7.5%(+54.8)#7 | 11.1%(+51.2)#785 |
| 8. | Halchita | 56.0% | 7.5%(+48.5)#8 | 11.1%(+44.9)#987 |
| 9. | Marysvale | 50.9% | 7.5%(+43.4)#9 | 11.1%(+39.9)#1,158 |
| 10. | Gunnison | 47.8% | 7.5%(+40.3)#10 | 11.1%(+36.8)#1,387 |
| 11. | Torrey | 44.7% | 7.5%(+37.2)#11 | 11.1%(+33.7)#1,571 |
| 12. | Thatcher | 40.0% | 7.5%(+32.5)#12 | 11.1%(+28.9)#1,899 |
| 13. | Erda | 38.2% | 7.5%(+30.7)#13 | 11.1%(+27.2)#2,101 |
| 14. | Aneth | 35.7% | 7.5%(+28.2)#14 | 11.1%(+24.6)#2,338 |
| 15. | River Heights | 33.9% | 7.5%(+26.4)#15 | 11.1%(+22.8)#2,526 |
| 16. | Myton | 28.6% | 7.5%(+21.1)#16 | 11.1%(+17.5)#3,343 |
| 17. | Woodruff | 28.6% | 7.5%(+21.1)#17 | 11.1%(+17.5)#3,361 |
| 18. | Green River | 27.8% | 7.5%(+20.3)#18 | 11.1%(+16.7)#3,499 |
| 19. | Alton | 27.8% | 7.5%(+20.3)#19 | 11.1%(+16.7)#3,504 |
| 20. | Kanarraville | 25.9% | 7.5%(+18.4)#20 | 11.1%(+14.9)#3,896 |
| 21. | Henrieville | 25.0% | 7.5%(+17.5)#21 | 11.1%(+13.9)#4,125 |
| 22. | Laketown | 24.2% | 7.5%(+16.7)#22 | 11.1%(+13.2)#4,319 |
| 23. | North Logan | 23.8% | 7.5%(+16.3)#23 | 11.1%(+12.8)#4,405 |
| 24. | Mount Pleasant | 23.5% | 7.5%(+16.0)#24 | 11.1%(+12.4)#4,523 |
| 25. | Roosevelt | 21.8% | 7.5%(+14.3)#25 | 11.1%(+10.8)#5,019 |
| 26. | White | 21.5% | 7.5%(+14.0)#26 | 11.1%(+10.5)#5,111 |
| 27. | Joseph | 20.0% | 7.5%(+12.5)#27 | 11.1%(+8.93)#5,606 |
| 28. | Alpine | 20.0% | 7.5%(+12.5)#28 | 11.1%(+8.90)#5,719 |
| 29. | Woods Cross | 19.8% | 7.5%(+12.3)#29 | 11.1%(+8.74)#5,758 |
| 30. | Cannonville | 19.2% | 7.5%(+11.7)#30 | 11.1%(+8.16)#5,980 |
| 31. | Blanding | 19.2% | 7.5%(+11.7)#31 | 11.1%(+8.12)#5,993 |
| 32. | Kanosh | 19.0% | 7.5%(+11.5)#32 | 11.1%(+7.98)#6,039 |
| 33. | Plymouth | 19.0% | 7.5%(+11.5)#33 | 11.1%(+7.98)#6,044 |
| 34. | Moab | 18.9% | 7.5%(+11.4)#34 | 11.1%(+7.83)#6,106 |
| 35. | Millville | 18.2% | 7.5%(+10.7)#35 | 11.1%(+7.11)#6,394 |
| 36. | Sigurd | 18.2% | 7.5%(+10.7)#36 | 11.1%(+7.11)#6,417 |
| 37. | Duchesne | 17.6% | 7.5%(+10.1)#37 | 11.1%(+6.53)#6,713 |
| 38. | Nibley | 17.3% | 7.5%(+9.84)#38 | 11.1%(+6.27)#6,815 |
| 39. | Smithfield | 17.3% | 7.5%(+9.82)#39 | 11.1%(+6.25)#6,820 |
| 40. | Monticello | 17.0% | 7.5%(+9.55)#40 | 11.1%(+5.98)#6,950 |
| 41. | Midvale | 16.8% | 7.5%(+9.27)#41 | 11.1%(+5.70)#7,054 |
| 42. | Bear River City | 16.7% | 7.5%(+9.17)#42 | 11.1%(+5.60)#7,122 |
| 43. | Fielding | 16.7% | 7.5%(+9.17)#43 | 11.1%(+5.60)#7,131 |
| 44. | Charleston | 16.0% | 7.5%(+8.50)#44 | 11.1%(+4.93)#7,523 |
| 45. | Salem | 15.5% | 7.5%(+8.03)#45 | 11.1%(+4.46)#7,762 |
| 46. | Price | 15.5% | 7.5%(+7.96)#46 | 11.1%(+4.40)#7,801 |
| 47. | Wallsburg | 15.4% | 7.5%(+7.89)#47 | 11.1%(+4.32)#7,862 |
| 48. | Ballard | 15.1% | 7.5%(+7.60)#48 | 11.1%(+4.03)#8,003 |
| 49. | Spring City | 14.7% | 7.5%(+7.24)#49 | 11.1%(+3.68)#8,212 |
| 50. | Clarkston | 14.6% | 7.5%(+7.13)#50 | 11.1%(+3.57)#8,288 |
| 51. | South Ogden | 14.6% | 7.5%(+7.13)#51 | 11.1%(+3.56)#8,300 |
| 52. | Honeyville | 14.5% | 7.5%(+6.99)#52 | 11.1%(+3.43)#8,372 |
| 53. | Huntington | 14.4% | 7.5%(+6.89)#53 | 11.1%(+3.32)#8,423 |
| 54. | Portage | 14.3% | 7.5%(+6.79)#54 | 11.1%(+3.22)#8,560 |
| 55. | Escalante | 14.1% | 7.5%(+6.62)#55 | 11.1%(+3.05)#8,667 |
| 56. | Fruit Heights | 13.8% | 7.5%(+6.28)#56 | 11.1%(+2.72)#8,860 |
| 57. | Millcreek | 13.5% | 7.5%(+5.99)#57 | 11.1%(+2.42)#9,060 |
| 58. | La Verkin | 13.5% | 7.5%(+5.96)#58 | 11.1%(+2.39)#9,089 |
| 59. | Scipio | 13.0% | 7.5%(+5.54)#59 | 11.1%(+1.98)#9,414 |
| 60. | South Salt Lake | 12.9% | 7.5%(+5.43)#60 | 11.1%(+1.86)#9,483 |
| 61. | West Point | 12.7% | 7.5%(+5.15)#61 | 11.1%(+1.59)#9,707 |
| 62. | Enoch | 12.6% | 7.5%(+5.09)#62 | 11.1%(+1.53)#9,748 |
| 63. | Castle Valley | 12.4% | 7.5%(+4.86)#63 | 11.1%(+1.29)#9,997 |
| 64. | Pleasant Grove | 12.1% | 7.5%(+4.60)#64 | 11.1%(+1.03)#10,186 |
| 65. | Naples | 11.9% | 7.5%(+4.38)#65 | 11.1%(+0.808)#10,340 |
| 66. | Washington | 11.5% | 7.5%(+3.97)#66 | 11.1%(+0.406)#10,666 |
| 67. | Genola | 11.4% | 7.5%(+3.86)#67 | 11.1%(+0.297)#10,745 |
| 68. | Cottonwood Heights | 11.0% | 7.5%(+3.54)#68 | 11.1%(-0.031)#11,074 |
| 69. | Hooper | 10.9% | 7.5%(+3.44)#69 | 11.1%(-0.125)#11,144 |
| 70. | Clearfield | 10.9% | 7.5%(+3.35)#70 | 11.1%(-0.216)#11,210 |
| 71. | Provo | 10.8% | 7.5%(+3.31)#71 | 11.1%(-0.258)#11,264 |
| 72. | Amalga | 10.7% | 7.5%(+3.21)#72 | 11.1%(-0.353)#11,336 |
| 73. | Ogden | 10.6% | 7.5%(+3.06)#73 | 11.1%(-0.506)#11,454 |
| 74. | Morgan | 10.4% | 7.5%(+2.90)#74 | 11.1%(-0.667)#11,627 |
| 75. | Kanab | 10.3% | 7.5%(+2.84)#75 | 11.1%(-0.730)#11,698 |
| 76. | Richfield | 10.3% | 7.5%(+2.84)#76 | 11.1%(-0.731)#11,701 |
| 77. | Central | 10.3% | 7.5%(+2.78)#77 | 11.1%(-0.787)#11,733 |
| 78. | Kamas | 10.3% | 7.5%(+2.76)#78 | 11.1%(-0.811)#11,752 |
| 79. | Salt Lake City | 9.7% | 7.5%(+2.23)#79 | 11.1%(-1.34)#12,243 |
| 80. | South Willard | 9.7% | 7.5%(+2.18)#80 | 11.1%(-1.39)#12,294 |
| 81. | Leeds | 9.5% | 7.5%(+2.02)#81 | 11.1%(-1.54)#12,438 |
| 82. | West Haven | 9.4% | 7.5%(+1.89)#82 | 11.1%(-1.67)#12,561 |
| 83. | Koosharem | 9.4% | 7.5%(+1.88)#83 | 11.1%(-1.69)#12,589 |
| 84. | Kaysville | 9.3% | 7.5%(+1.80)#84 | 11.1%(-1.77)#12,656 |
| 85. | Tooele | 9.1% | 7.5%(+1.62)#85 | 11.1%(-1.94)#12,784 |
| 86. | Nephi | 9.0% | 7.5%(+1.52)#86 | 11.1%(-2.04)#12,946 |
| 87. | St George | 8.9% | 7.5%(+1.38)#87 | 11.1%(-2.19)#13,059 |
| 88. | Tremonton | 8.9% | 7.5%(+1.36)#88 | 11.1%(-2.20)#13,074 |
| 89. | Riverdale | 8.8% | 7.5%(+1.35)#89 | 11.1%(-2.22)#13,091 |
| 90. | Murray | 8.8% | 7.5%(+1.29)#90 | 11.1%(-2.28)#13,147 |
| 91. | Kearns | 8.7% | 7.5%(+1.16)#91 | 11.1%(-2.41)#13,277 |
| 92. | Central Valley | 8.3% | 7.5%(+0.834)#92 | 11.1%(-2.73)#13,576 |
| 93. | Lindon | 8.1% | 7.5%(+0.649)#93 | 11.1%(-2.92)#13,782 |
| 94. | West Jordan | 8.1% | 7.5%(+0.574)#94 | 11.1%(-2.99)#13,852 |
| 95. | Payson | 7.9% | 7.5%(+0.360)#95 | 11.1%(-3.21)#14,054 |
| 96. | Helper | 7.8% | 7.5%(+0.273)#96 | 11.1%(-3.29)#14,122 |
| 97. | Mantua | 7.7% | 7.5%(+0.193)#97 | 11.1%(-3.37)#14,184 |
| 98. | Copperton | 7.7% | 7.5%(+0.193)#98 | 11.1%(-3.37)#14,195 |
| 99. | West Valley City | 7.6% | 7.5%(+0.077)#99 | 11.1%(-3.49)#14,320 |
| 100. | Garland | 7.4% | 7.5%(-0.146)#100 | 11.1%(-3.71)#14,534 |
Common Questions
What are the Top 10 Cities with the Highest Poverty Level Among Seniors Over the Age of 75 in Utah?
Top 10 Cities with the Highest Poverty Level Among Seniors Over the Age of 75 in Utah are:
#1
100.0%
#2
100.0%
#3
86.7%
#4
66.7%
#5
63.1%
#6
62.3%
#7
56.0%
#8
50.9%
#9
47.8%
#10
44.7%
What city has the Highest Poverty Level Among Seniors Over the Age of 75 in Utah?
Navajo Mountain has the Highest Poverty Level Among Seniors Over the Age of 75 in Utah with 100.0%.
What is the Poverty Level Among Seniors Over the Age of 75 in the State of Utah?
Poverty Level Among Seniors Over the Age of 75 in Utah is 7.5%.
What is the Poverty Level Among Seniors Over the Age of 75 in the United States?
Poverty Level Among Seniors Over the Age of 75 in the United States is 11.1%.