Randolph, UT Map & Demographics
Randolph Map
Randolph Overview
$21,570
PER CAPITA INCOME
$95,000
AVG FAMILY INCOME
$90,417
AVG HOUSEHOLD INCOME
44.2%
WAGE / INCOME GAP [ % ]
55.8¢/ $1
WAGE / INCOME GAP [ $ ]
0.33
INEQUALITY / GINI INDEX
966
TOTAL POPULATION
470
MALE POPULATION
496
FEMALE POPULATION
94.76
MALES / 100 FEMALES
105.53
FEMALES / 100 MALES
27.1
MEDIAN AGE
5.7
AVG FAMILY SIZE
5.3
AVG HOUSEHOLD SIZE
288
LABOR FORCE [ PEOPLE ]
45.6%
PERCENT IN LABOR FORCE
Randolph Zip Codes
Randolph Area Codes
Income in Randolph
Income Overview in Randolph
Per Capita Income in Randolph is $21,570, while median incomes of families and households are $95,000 and $90,417 respectively.
| Characteristic | Number | Measure |
| Per Capita Income | 966 | $21,570 |
| Median Family Income | 158 | $95,000 |
| Mean Family Income | 158 | $92,924 |
| Median Household Income | 179 | $90,417 |
| Mean Household Income | 179 | $86,792 |
| Income Deficit | 158 | $0 |
| Wage / Income Gap (%) | 966 | 44.16% |
| Wage / Income Gap ($) | 966 | 55.84¢ per $1 |
| Gini / Inequality Index | 966 | 0.33 |
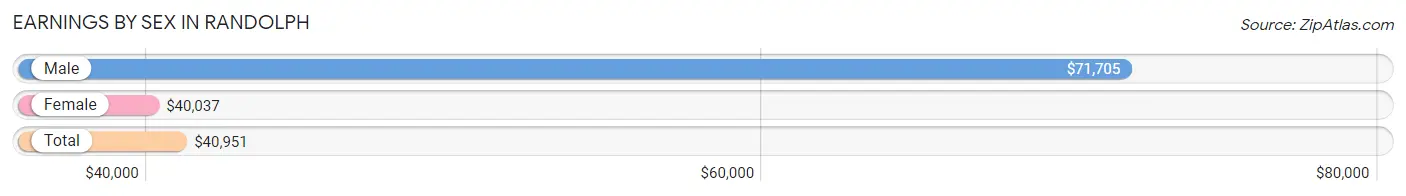
Earnings by Sex in Randolph
Average Earnings in Randolph are $40,951, $71,705 for men and $40,037 for women, a difference of 44.2%.
| Sex | Number | Average Earnings |
| Male | 139 (43.9%) | $71,705 |
| Female | 178 (56.1%) | $40,037 |
| Total | 317 (100.0%) | $40,951 |
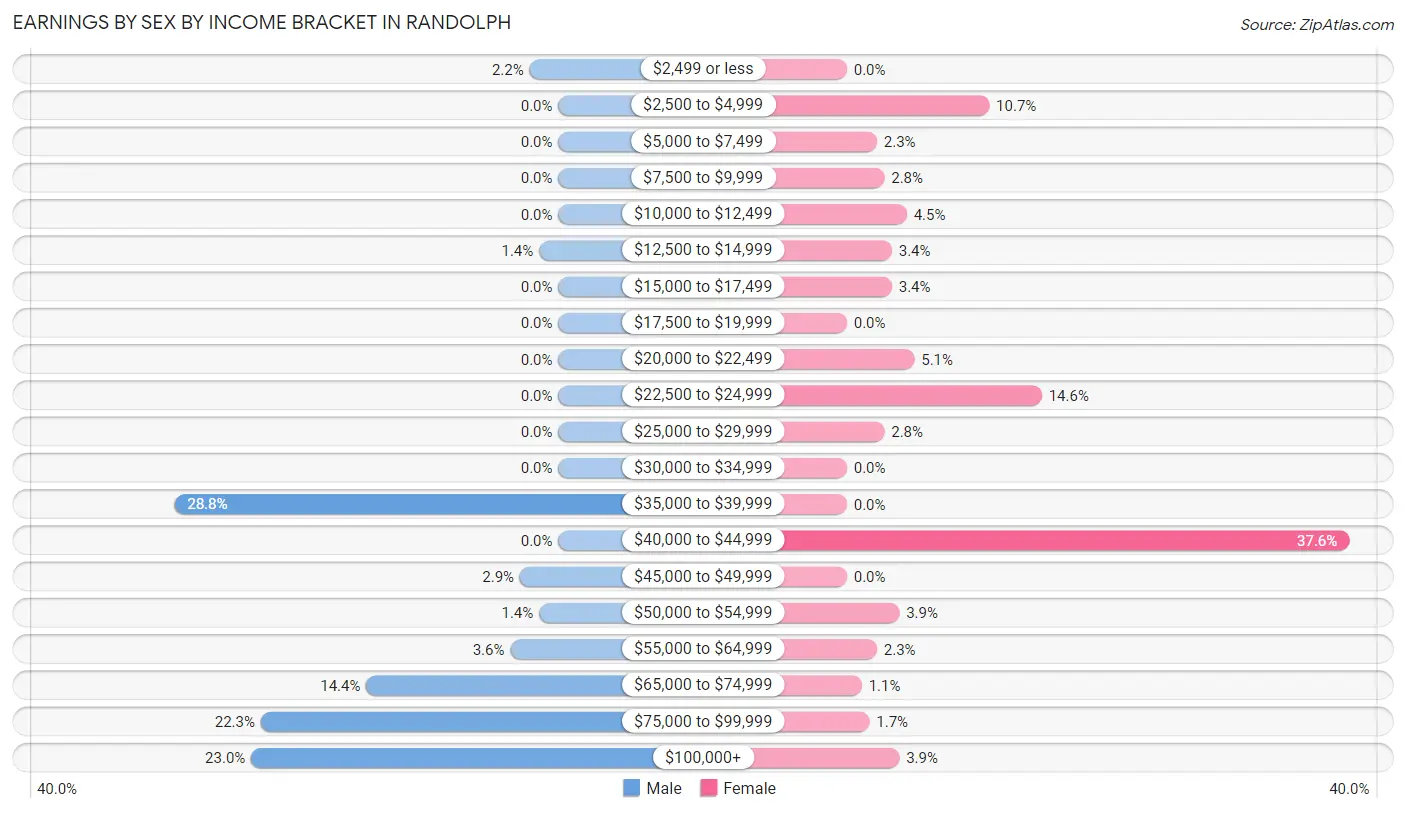
Earnings by Sex by Income Bracket in Randolph
The most common earnings brackets in Randolph are $35,000 to $39,999 for men (40 | 28.8%) and $40,000 to $44,999 for women (67 | 37.6%).
| Income | Male | Female |
| $2,499 or less | 3 (2.2%) | 0 (0.0%) |
| $2,500 to $4,999 | 0 (0.0%) | 19 (10.7%) |
| $5,000 to $7,499 | 0 (0.0%) | 4 (2.2%) |
| $7,500 to $9,999 | 0 (0.0%) | 5 (2.8%) |
| $10,000 to $12,499 | 0 (0.0%) | 8 (4.5%) |
| $12,500 to $14,999 | 2 (1.4%) | 6 (3.4%) |
| $15,000 to $17,499 | 0 (0.0%) | 6 (3.4%) |
| $17,500 to $19,999 | 0 (0.0%) | 0 (0.0%) |
| $20,000 to $22,499 | 0 (0.0%) | 9 (5.1%) |
| $22,500 to $24,999 | 0 (0.0%) | 26 (14.6%) |
| $25,000 to $29,999 | 0 (0.0%) | 5 (2.8%) |
| $30,000 to $34,999 | 0 (0.0%) | 0 (0.0%) |
| $35,000 to $39,999 | 40 (28.8%) | 0 (0.0%) |
| $40,000 to $44,999 | 0 (0.0%) | 67 (37.6%) |
| $45,000 to $49,999 | 4 (2.9%) | 0 (0.0%) |
| $50,000 to $54,999 | 2 (1.4%) | 7 (3.9%) |
| $55,000 to $64,999 | 5 (3.6%) | 4 (2.2%) |
| $65,000 to $74,999 | 20 (14.4%) | 2 (1.1%) |
| $75,000 to $99,999 | 31 (22.3%) | 3 (1.7%) |
| $100,000+ | 32 (23.0%) | 7 (3.9%) |
| Total | 139 (100.0%) | 178 (100.0%) |
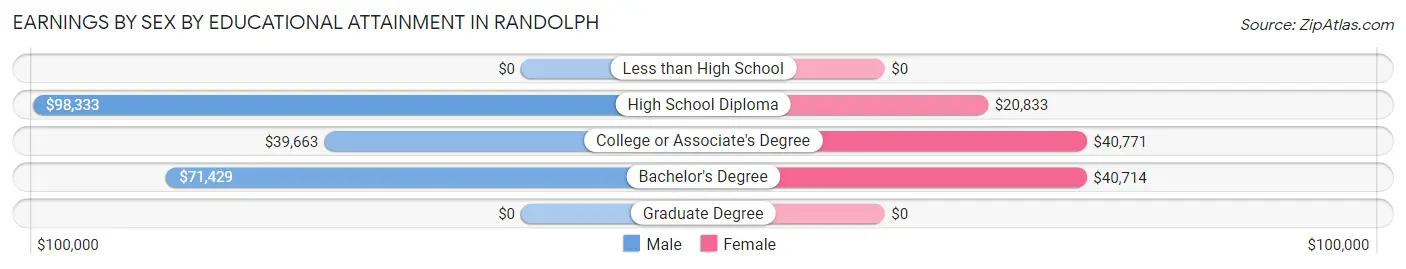
Earnings by Sex by Educational Attainment in Randolph
Average earnings in Randolph are $72,159 for men and $40,392 for women, a difference of 44.0%. Men with an educational attainment of high school diploma enjoy the highest average annual earnings of $98,333, while those with college or associate's degree education earn the least with $39,663. Women with an educational attainment of college or associate's degree earn the most with the average annual earnings of $40,771, while those with high school diploma education have the smallest earnings of $20,833.
| Educational Attainment | Male Income | Female Income |
| Less than High School | - | - |
| High School Diploma | $98,333 | $20,833 |
| College or Associate's Degree | $39,663 | $40,771 |
| Bachelor's Degree | $71,429 | $40,714 |
| Graduate Degree | - | - |
| Total | $72,159 | $40,392 |
Family Income in Randolph
Family Income Brackets in Randolph
According to the Randolph family income data, there are 45 families falling into the $75,000 to $99,999 income range, which is the most common income bracket and makes up 28.5% of all families.
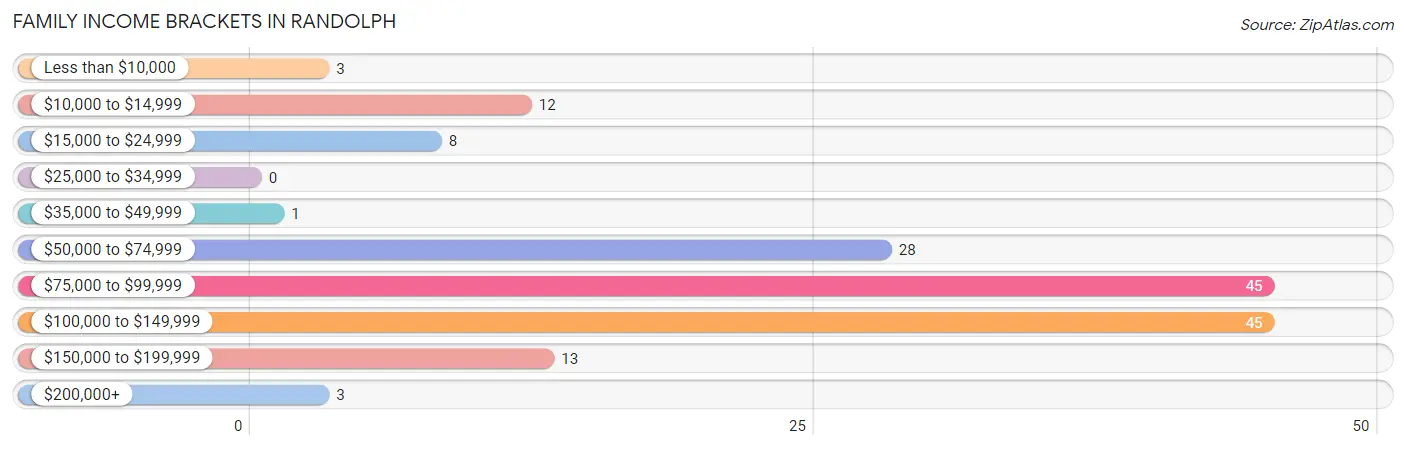
| Income Bracket | # Families | % Families |
| Less than $10,000 | 3 | 1.9% |
| $10,000 to $14,999 | 12 | 7.6% |
| $15,000 to $24,999 | 8 | 5.1% |
| $25,000 to $34,999 | 0 | 0.0% |
| $35,000 to $49,999 | 1 | 0.6% |
| $50,000 to $74,999 | 28 | 17.7% |
| $75,000 to $99,999 | 45 | 28.5% |
| $100,000 to $149,999 | 45 | 28.5% |
| $150,000 to $199,999 | 13 | 8.2% |
| $200,000+ | 3 | 1.9% |
Family Income by Famaliy Size in Randolph
7+ person families (13 | 8.2%) account for the highest median family income in Randolph with $133,438 per family, while 2-person families (54 | 34.2%) have the highest median income of $44,688 per family member.
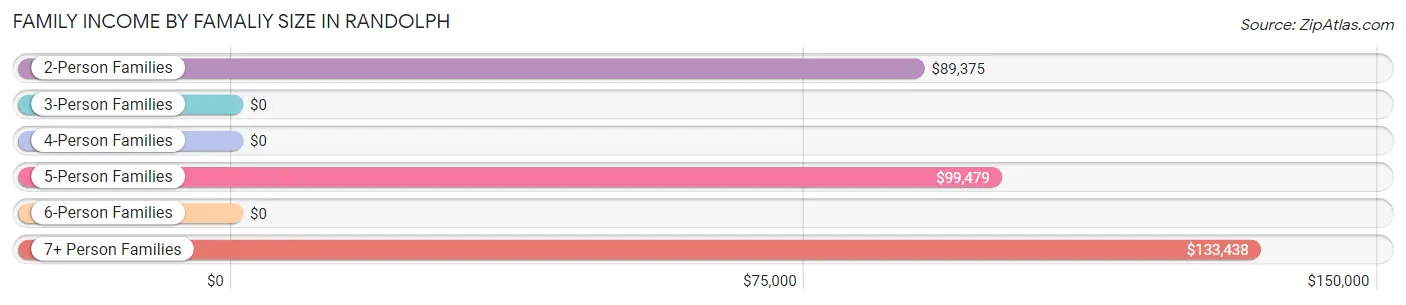
| Income Bracket | # Families | Median Income |
| 2-Person Families | 54 (34.2%) | $89,375 |
| 3-Person Families | 14 (8.9%) | $0 |
| 4-Person Families | 34 (21.5%) | $0 |
| 5-Person Families | 39 (24.7%) | $99,479 |
| 6-Person Families | 4 (2.5%) | $0 |
| 7+ Person Families | 13 (8.2%) | $133,438 |
| Total | 158 (100.0%) | $95,000 |
Family Income by Number of Earners in Randolph
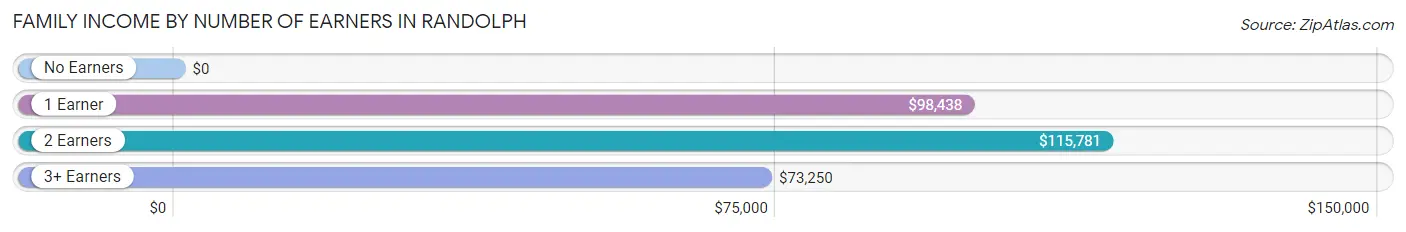
| Number of Earners | # Families | Median Income |
| No Earners | 39 (24.7%) | $0 |
| 1 Earner | 55 (34.8%) | $98,438 |
| 2 Earners | 53 (33.5%) | $115,781 |
| 3+ Earners | 11 (7.0%) | $73,250 |
| Total | 158 (100.0%) | $95,000 |
Household Income in Randolph
Household Income Brackets in Randolph
With 47 households falling in the category, the $100,000 to $149,999 income range is the most frequent in Randolph, accounting for 26.3% of all households.
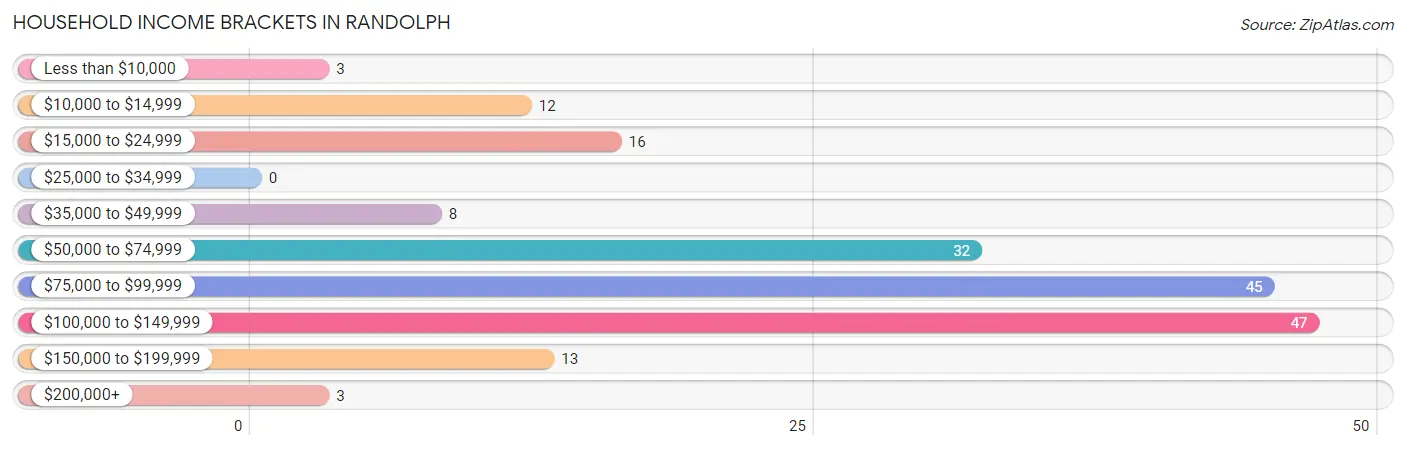
| Income Bracket | # Households | % Households |
| Less than $10,000 | 3 | 1.7% |
| $10,000 to $14,999 | 12 | 6.7% |
| $15,000 to $24,999 | 16 | 8.9% |
| $25,000 to $34,999 | 0 | 0.0% |
| $35,000 to $49,999 | 8 | 4.5% |
| $50,000 to $74,999 | 32 | 17.9% |
| $75,000 to $99,999 | 45 | 25.1% |
| $100,000 to $149,999 | 47 | 26.3% |
| $150,000 to $199,999 | 13 | 7.3% |
| $200,000+ | 3 | 1.7% |
Household Income by Householder Age in Randolph
The median household income in Randolph is $90,417, with the highest median household income of $98,125 found in the 25 to 44 years age bracket for the primary householder. A total of 88 households (49.2%) fall into this category. Meanwhile, the 15 to 24 years age bracket for the primary householder has the lowest median household income of $0, with 6 households (3.4%) in this group.
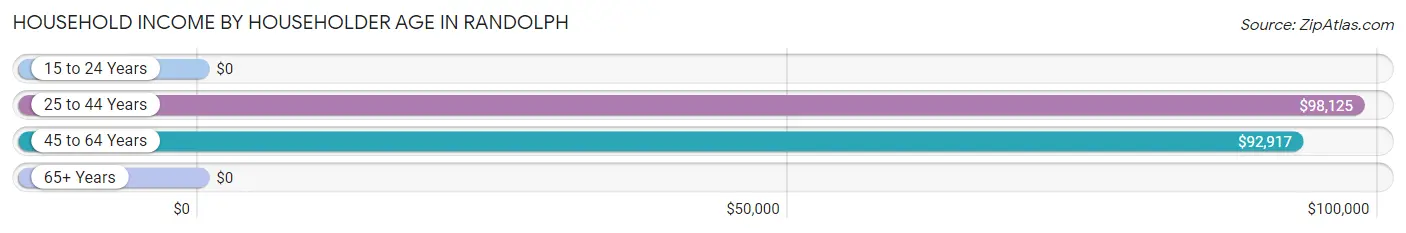
| Income Bracket | # Households | Median Income |
| 15 to 24 Years | 6 (3.4%) | $0 |
| 25 to 44 Years | 88 (49.2%) | $98,125 |
| 45 to 64 Years | 50 (27.9%) | $92,917 |
| 65+ Years | 35 (19.6%) | $0 |
| Total | 179 (100.0%) | $90,417 |
Poverty in Randolph
Income Below Poverty by Sex and Age in Randolph
With 2.6% poverty level for males and 13.3% for females among the residents of Randolph, 5 year old males and 16 and 17 year old females are the most vulnerable to poverty, with 9 males (60.0%) and 20 females (87.0%) in their respective age groups living below the poverty level.
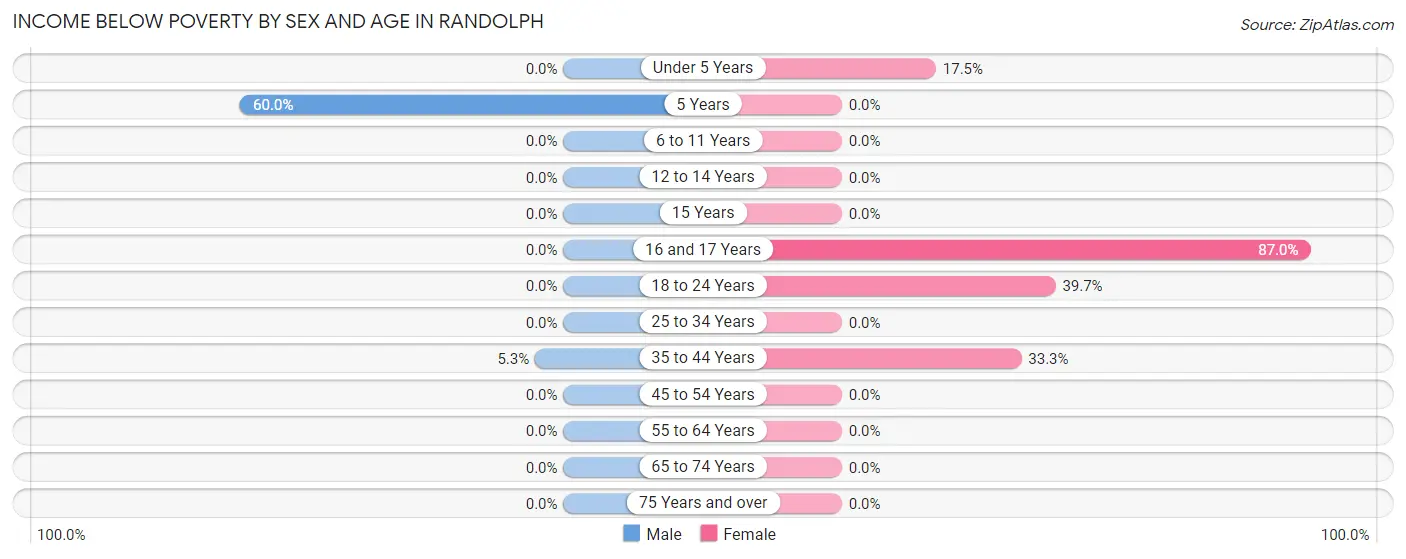
| Age Bracket | Male | Female |
| Under 5 Years | 0 (0.0%) | 11 (17.5%) |
| 5 Years | 9 (60.0%) | 0 (0.0%) |
| 6 to 11 Years | 0 (0.0%) | 0 (0.0%) |
| 12 to 14 Years | 0 (0.0%) | 0 (0.0%) |
| 15 Years | 0 (0.0%) | 0 (0.0%) |
| 16 and 17 Years | 0 (0.0%) | 20 (87.0%) |
| 18 to 24 Years | 0 (0.0%) | 23 (39.7%) |
| 25 to 34 Years | 0 (0.0%) | 0 (0.0%) |
| 35 to 44 Years | 3 (5.3%) | 12 (33.3%) |
| 45 to 54 Years | 0 (0.0%) | 0 (0.0%) |
| 55 to 64 Years | 0 (0.0%) | 0 (0.0%) |
| 65 to 74 Years | 0 (0.0%) | 0 (0.0%) |
| 75 Years and over | 0 (0.0%) | 0 (0.0%) |
| Total | 12 (2.6%) | 66 (13.3%) |
Income Above Poverty by Sex and Age in Randolph
According to the poverty statistics in Randolph, males aged under 5 years and females aged 6 to 11 years are the age groups that are most secure financially, with 100.0% of males and 100.0% of females in these age groups living above the poverty line.
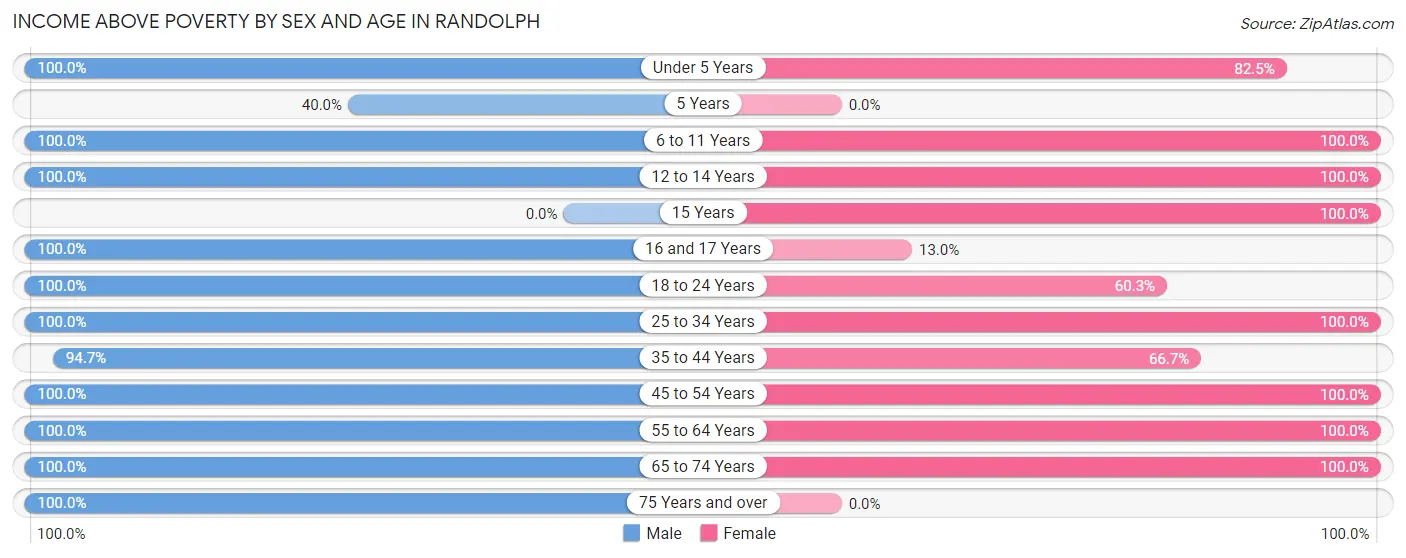
| Age Bracket | Male | Female |
| Under 5 Years | 62 (100.0%) | 52 (82.5%) |
| 5 Years | 6 (40.0%) | 0 (0.0%) |
| 6 to 11 Years | 98 (100.0%) | 44 (100.0%) |
| 12 to 14 Years | 33 (100.0%) | 17 (100.0%) |
| 15 Years | 0 (0.0%) | 2 (100.0%) |
| 16 and 17 Years | 7 (100.0%) | 3 (13.0%) |
| 18 to 24 Years | 45 (100.0%) | 35 (60.3%) |
| 25 to 34 Years | 17 (100.0%) | 133 (100.0%) |
| 35 to 44 Years | 54 (94.7%) | 24 (66.7%) |
| 45 to 54 Years | 44 (100.0%) | 27 (100.0%) |
| 55 to 64 Years | 29 (100.0%) | 35 (100.0%) |
| 65 to 74 Years | 22 (100.0%) | 58 (100.0%) |
| 75 Years and over | 33 (100.0%) | 0 (0.0%) |
| Total | 450 (97.4%) | 430 (86.7%) |
Income Below Poverty Among Married-Couple Families in Randolph
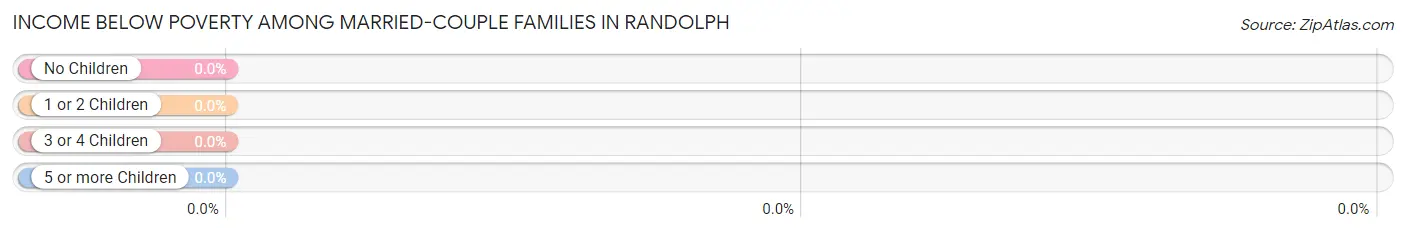
| Children | Above Poverty | Below Poverty |
| No Children | 66 (100.0%) | 0 (0.0%) |
| 1 or 2 Children | 38 (100.0%) | 0 (0.0%) |
| 3 or 4 Children | 35 (100.0%) | 0 (0.0%) |
| 5 or more Children | 4 (100.0%) | 0 (0.0%) |
| Total | 143 (100.0%) | 0 (0.0%) |
Income Below Poverty Among Single-Parent Households in Randolph
According to the poverty data in Randolph, 100.0% or 3 single-father households and 100.0% or 12 single-mother households are living below the poverty line. Among single-father households, those with 1 or 2 children have the highest poverty rate, with 3 households (100.0%) experiencing poverty. Likewise, among single-mother households, those with 3 or 4 children have the highest poverty rate, with 12 households (100.0%) falling below the poverty line.
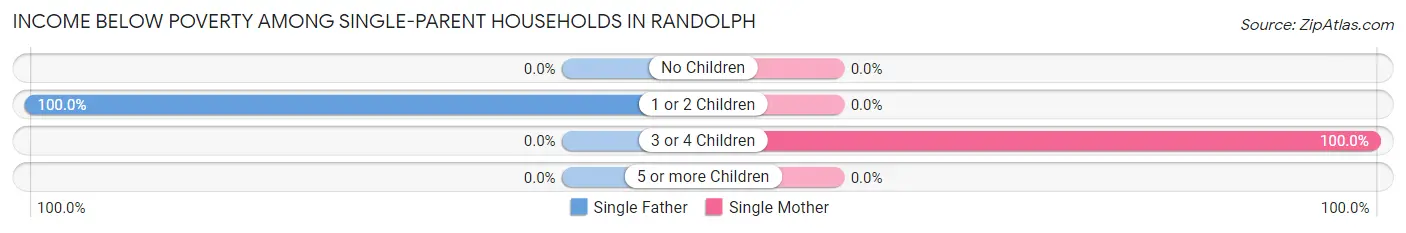
| Children | Single Father | Single Mother |
| No Children | 0 (0.0%) | 0 (0.0%) |
| 1 or 2 Children | 3 (100.0%) | 0 (0.0%) |
| 3 or 4 Children | 0 (0.0%) | 12 (100.0%) |
| 5 or more Children | 0 (0.0%) | 0 (0.0%) |
| Total | 3 (100.0%) | 12 (100.0%) |
Income Below Poverty Among Married-Couple vs Single-Parent Households in Randolph
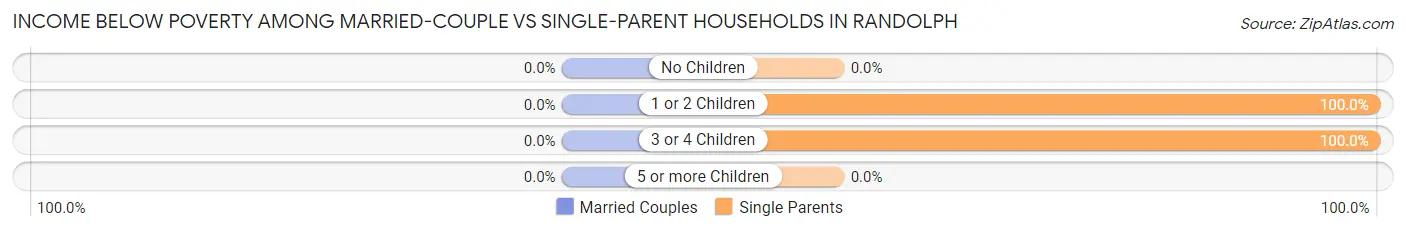
| Children | Married-Couple Families | Single-Parent Households |
| No Children | 0 (0.0%) | 0 (0.0%) |
| 1 or 2 Children | 0 (0.0%) | 3 (100.0%) |
| 3 or 4 Children | 0 (0.0%) | 12 (100.0%) |
| 5 or more Children | 0 (0.0%) | 0 (0.0%) |
| Total | 0 (0.0%) | 15 (100.0%) |
Race in Randolph
The most populous races in Randolph are White / Caucasian (880 | 91.1%), Hispanic or Latino (92 | 9.5%), and Two or more Races (70 | 7.2%).
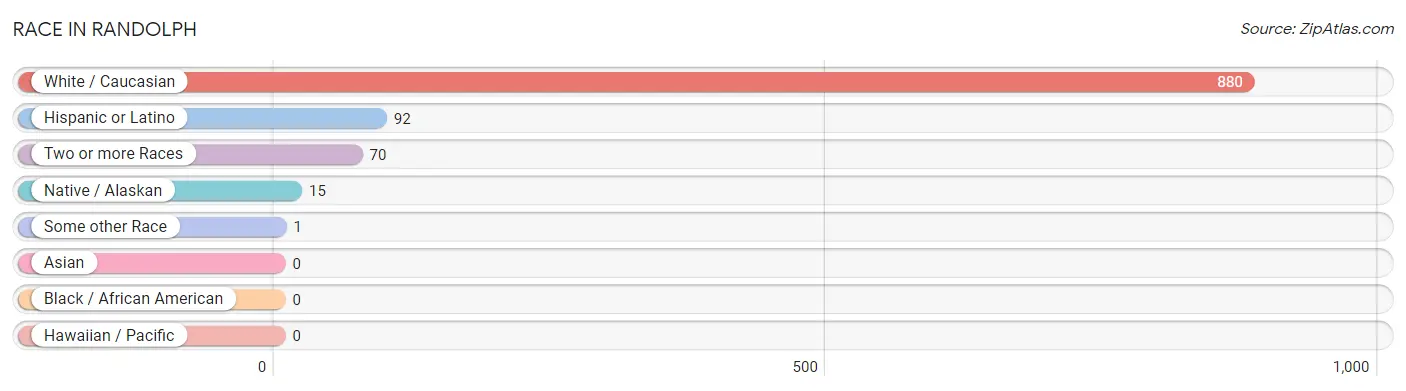
| Race | # Population | % Population |
| Asian | 0 | 0.0% |
| Black / African American | 0 | 0.0% |
| Hawaiian / Pacific | 0 | 0.0% |
| Hispanic or Latino | 92 | 9.5% |
| Native / Alaskan | 15 | 1.5% |
| White / Caucasian | 880 | 91.1% |
| Two or more Races | 70 | 7.2% |
| Some other Race | 1 | 0.1% |
| Total | 966 | 100.0% |
Ancestry in Randolph
The most populous ancestries reported in Randolph are English (545 | 56.4%), Scottish (192 | 19.9%), Scotch-Irish (103 | 10.7%), Mexican (92 | 9.5%), and Irish (83 | 8.6%), together accounting for 105.1% of all Randolph residents.
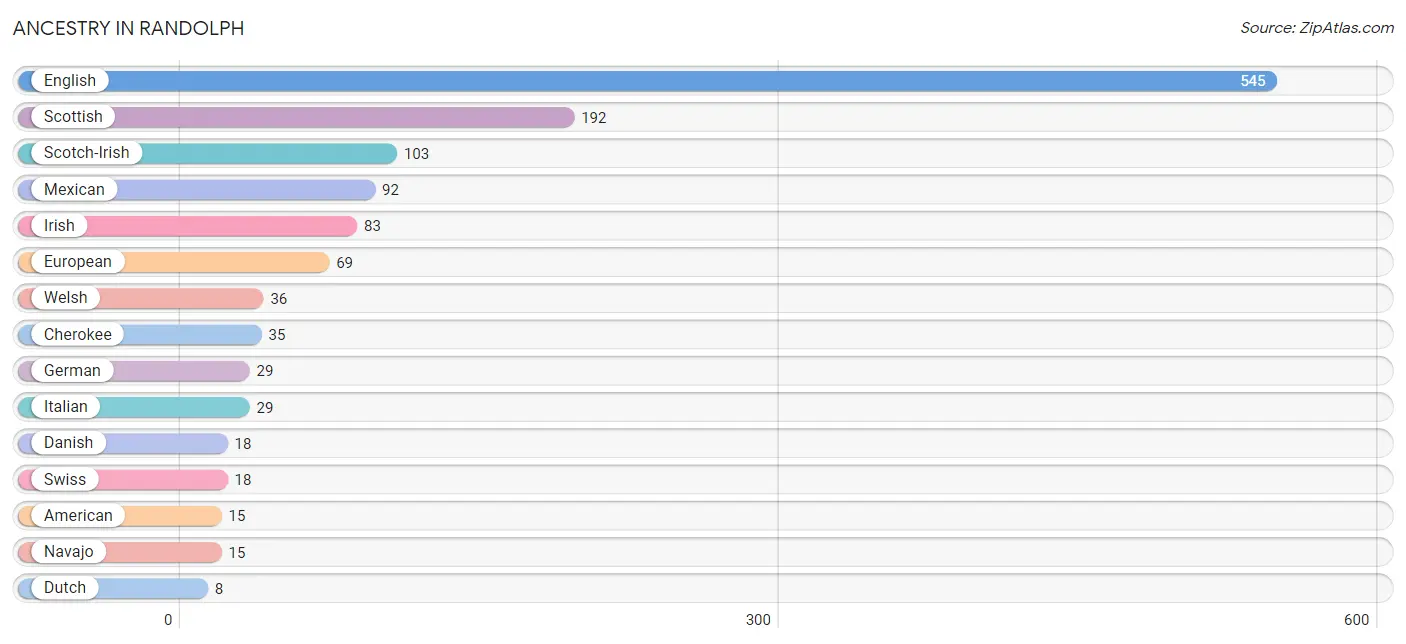
| Ancestry | # Population | % Population |
| American | 15 | 1.5% |
| Brazilian | 1 | 0.1% |
| Cherokee | 35 | 3.6% |
| Danish | 18 | 1.9% |
| Dutch | 8 | 0.8% |
| English | 545 | 56.4% |
| European | 69 | 7.1% |
| German | 29 | 3.0% |
| Irish | 83 | 8.6% |
| Italian | 29 | 3.0% |
| Mexican | 92 | 9.5% |
| Navajo | 15 | 1.5% |
| Polish | 6 | 0.6% |
| Russian | 4 | 0.4% |
| Scotch-Irish | 103 | 10.7% |
| Scottish | 192 | 19.9% |
| Swiss | 18 | 1.9% |
| Welsh | 36 | 3.7% | View All 18 Rows |
Immigrants in Randolph

| Immigration Origin | # Population | % Population | View All 0 Rows |
Sex and Age in Randolph
Sex and Age in Randolph
The most populous age groups in Randolph are 5 to 9 Years (104 | 22.1%) for men and 15 to 19 Years (74 | 14.9%) for women.
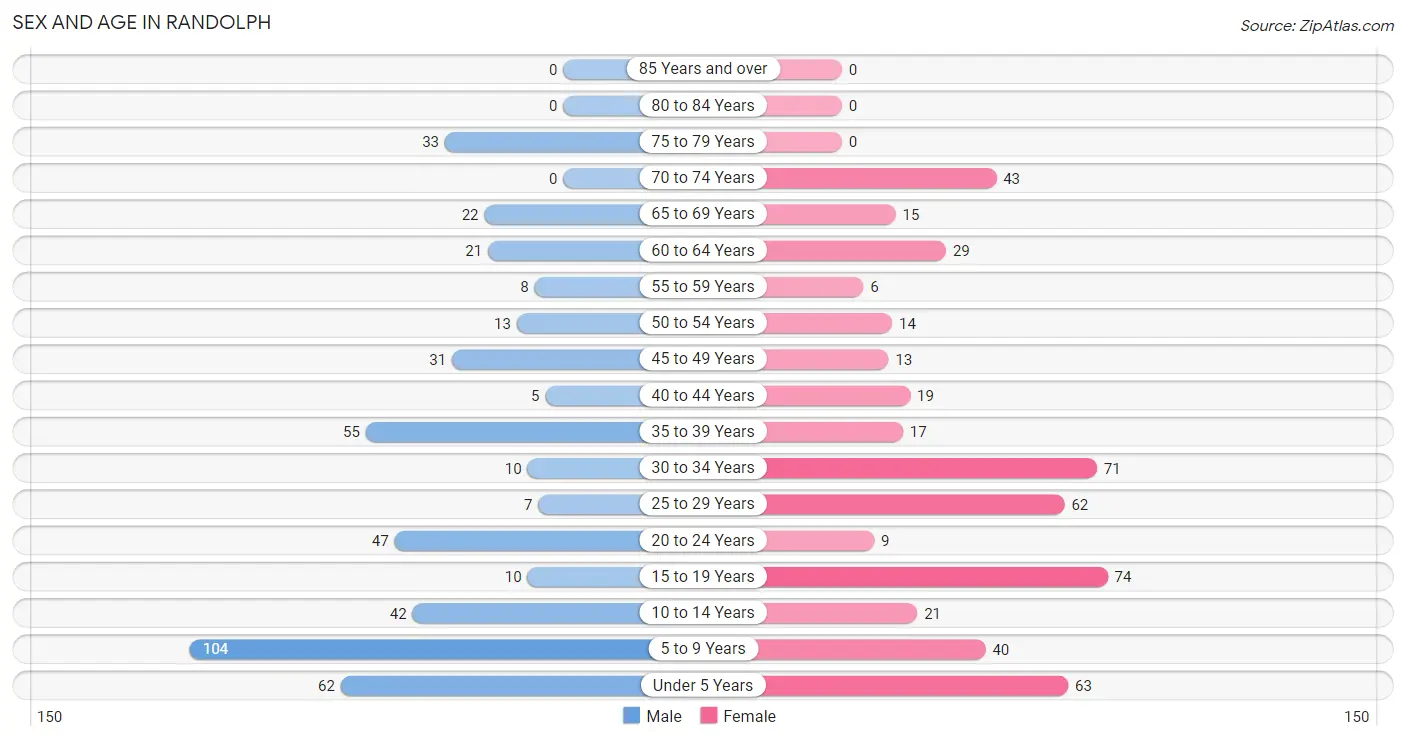
| Age Bracket | Male | Female |
| Under 5 Years | 62 (13.2%) | 63 (12.7%) |
| 5 to 9 Years | 104 (22.1%) | 40 (8.1%) |
| 10 to 14 Years | 42 (8.9%) | 21 (4.2%) |
| 15 to 19 Years | 10 (2.1%) | 74 (14.9%) |
| 20 to 24 Years | 47 (10.0%) | 9 (1.8%) |
| 25 to 29 Years | 7 (1.5%) | 62 (12.5%) |
| 30 to 34 Years | 10 (2.1%) | 71 (14.3%) |
| 35 to 39 Years | 55 (11.7%) | 17 (3.4%) |
| 40 to 44 Years | 5 (1.1%) | 19 (3.8%) |
| 45 to 49 Years | 31 (6.6%) | 13 (2.6%) |
| 50 to 54 Years | 13 (2.8%) | 14 (2.8%) |
| 55 to 59 Years | 8 (1.7%) | 6 (1.2%) |
| 60 to 64 Years | 21 (4.5%) | 29 (5.9%) |
| 65 to 69 Years | 22 (4.7%) | 15 (3.0%) |
| 70 to 74 Years | 0 (0.0%) | 43 (8.7%) |
| 75 to 79 Years | 33 (7.0%) | 0 (0.0%) |
| 80 to 84 Years | 0 (0.0%) | 0 (0.0%) |
| 85 Years and over | 0 (0.0%) | 0 (0.0%) |
| Total | 470 (100.0%) | 496 (100.0%) |
Families and Households in Randolph
Median Family Size in Randolph
The median family size in Randolph is 5.74 persons per family, with married-couple families (143 | 90.5%) accounting for the largest median family size of 5.96 persons per family. On the other hand, single female/mother families (12 | 7.6%) represent the smallest median family size with 3.33 persons per family.
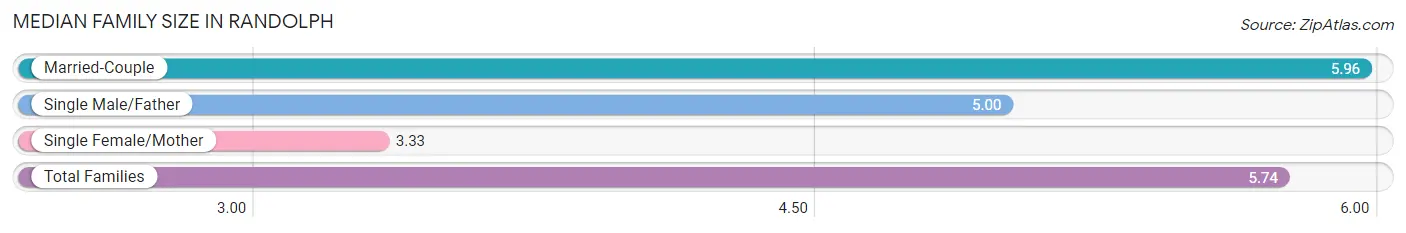
| Family Type | # Families | Family Size |
| Married-Couple | 143 (90.5%) | 5.96 |
| Single Male/Father | 3 (1.9%) | 5.00 |
| Single Female/Mother | 12 (7.6%) | 3.33 |
| Total Families | 158 (100.0%) | 5.74 |
Median Household Size in Randolph
The median household size in Randolph is 5.35 persons per household, with married-couple households (143 | 79.9%) accounting for the largest median household size of 6.12 persons per household. non-family households (21 | 11.7%) represent the smallest median household size with 1.33 persons per household.
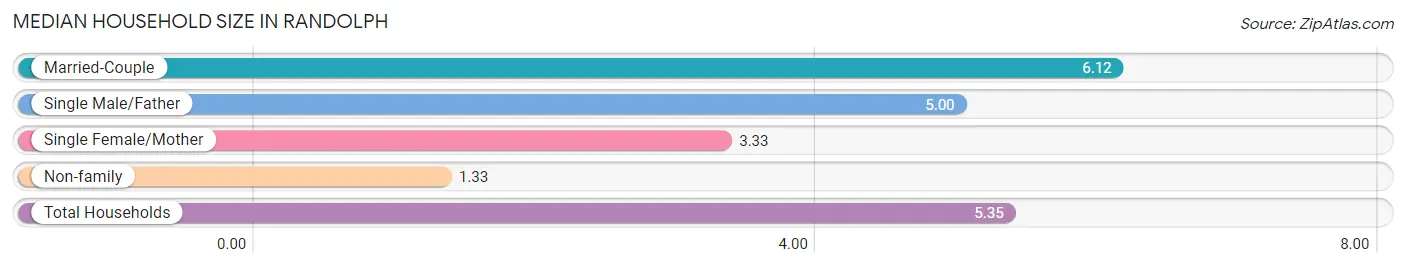
| Household Type | # Households | Household Size |
| Married-Couple | 143 (79.9%) | 6.12 |
| Single Male/Father | 3 (1.7%) | 5.00 |
| Single Female/Mother | 12 (6.7%) | 3.33 |
| Non-family | 21 (11.7%) | 1.33 |
| Total Households | 179 (100.0%) | 5.35 |
Household Size by Marriage Status in Randolph
Out of a total of 179 households in Randolph, 158 (88.3%) are family households, while 21 (11.7%) are nonfamily households. The most numerous type of family households are 2-person households, comprising 54, and the most common type of nonfamily households are 1-person households, comprising 13.
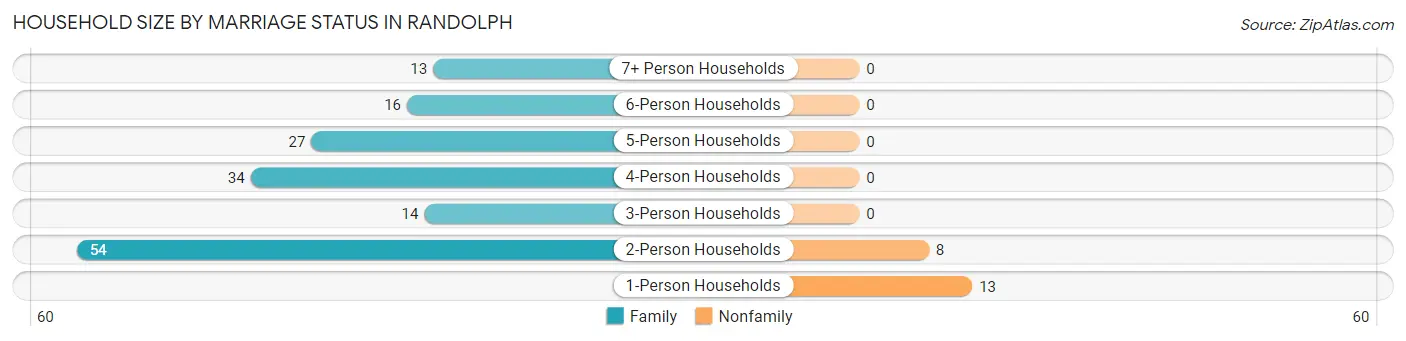
| Household Size | Family Households | Nonfamily Households |
| 1-Person Households | - | 13 (7.3%) |
| 2-Person Households | 54 (30.2%) | 8 (4.5%) |
| 3-Person Households | 14 (7.8%) | 0 (0.0%) |
| 4-Person Households | 34 (19.0%) | 0 (0.0%) |
| 5-Person Households | 27 (15.1%) | 0 (0.0%) |
| 6-Person Households | 16 (8.9%) | 0 (0.0%) |
| 7+ Person Households | 13 (7.3%) | 0 (0.0%) |
| Total | 158 (88.3%) | 21 (11.7%) |
Female Fertility in Randolph
Fertility by Age in Randolph
Average fertility rate in Randolph is 41.0 births per 1,000 women. Women in the age bracket of 20 to 34 years have the highest fertility rate with 77.0 births per 1,000 women. Women in the age bracket of 20 to 34 years acount for 100.0% of all women with births.
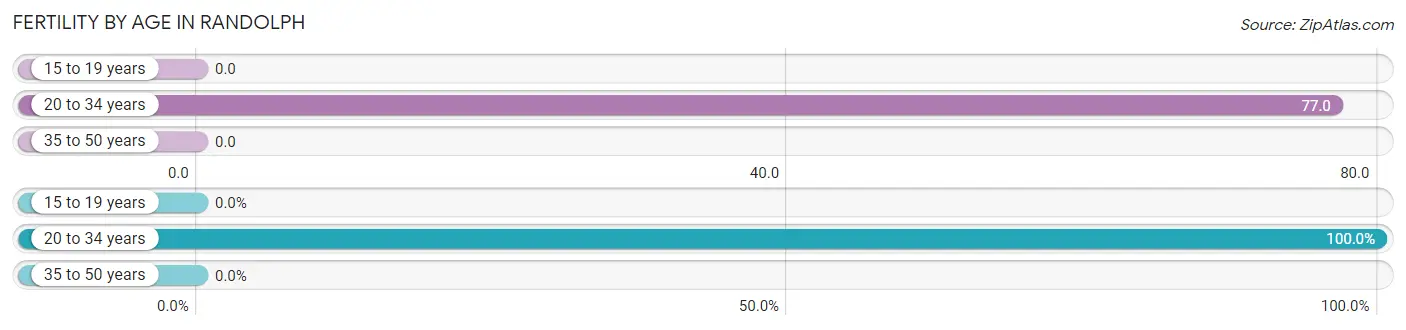
| Age Bracket | Women with Births | Births / 1,000 Women |
| 15 to 19 years | 0 (0.0%) | 0.0 |
| 20 to 34 years | 11 (100.0%) | 77.0 |
| 35 to 50 years | 0 (0.0%) | 0.0 |
| Total | 11 (100.0%) | 41.0 |
Fertility by Age by Marriage Status in Randolph
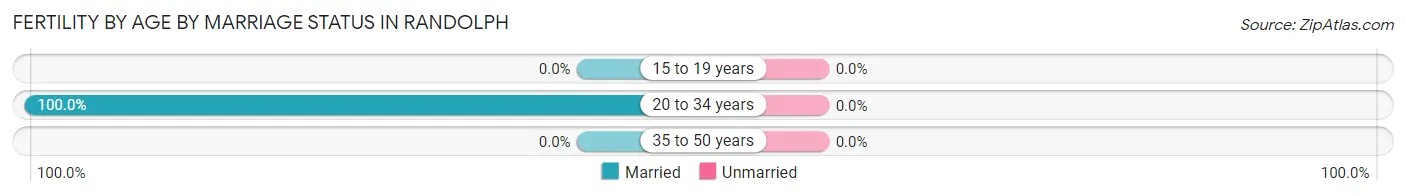
| Age Bracket | Married | Unmarried |
| 15 to 19 years | 0 (0.0%) | 0 (0.0%) |
| 20 to 34 years | 11 (100.0%) | 0 (0.0%) |
| 35 to 50 years | 0 (0.0%) | 0 (0.0%) |
| Total | 11 (100.0%) | 0 (0.0%) |
Fertility by Education in Randolph
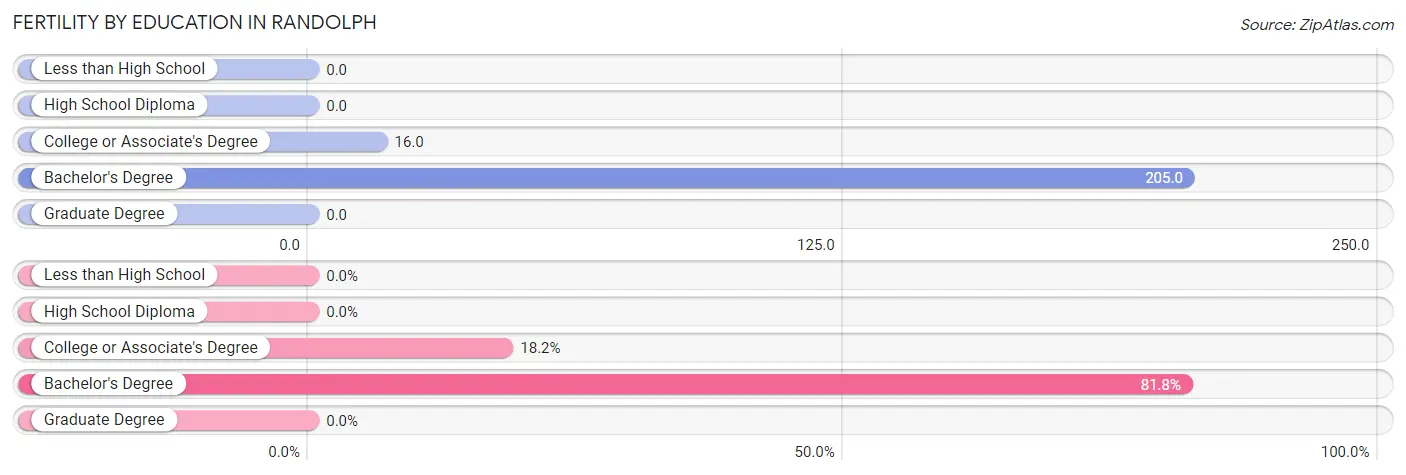
| Educational Attainment | Women with Births | Births / 1,000 Women |
| Less than High School | 0 (0.0%) | 0.0 |
| High School Diploma | 0 (0.0%) | 0.0 |
| College or Associate's Degree | 2 (18.2%) | 16.0 |
| Bachelor's Degree | 9 (81.8%) | 205.0 |
| Graduate Degree | 0 (0.0%) | 0.0 |
| Total | 11 (100.0%) | 41.0 |
Fertility by Education by Marriage Status in Randolph
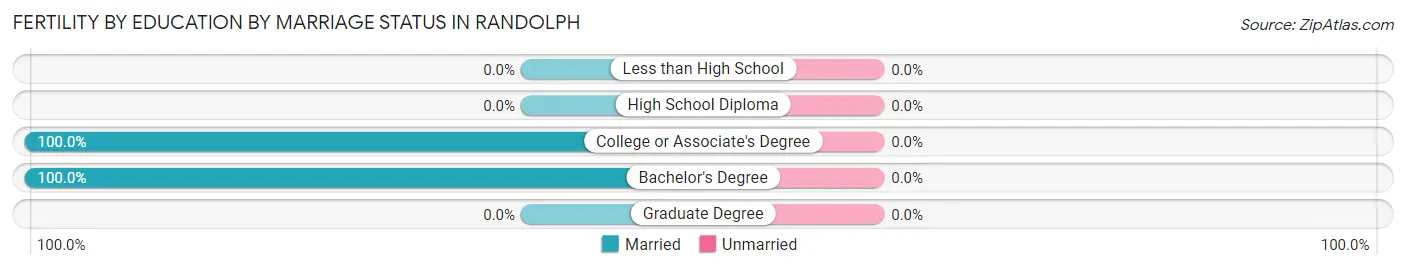
| Educational Attainment | Married | Unmarried |
| Less than High School | 0 (0.0%) | 0 (0.0%) |
| High School Diploma | 0 (0.0%) | 0 (0.0%) |
| College or Associate's Degree | 2 (100.0%) | 0 (0.0%) |
| Bachelor's Degree | 9 (100.0%) | 0 (0.0%) |
| Graduate Degree | 0 (0.0%) | 0 (0.0%) |
| Total | 11 (100.0%) | 0 (0.0%) |
Employment Characteristics in Randolph
Employment by Class of Employer in Randolph
Among the 285 employed individuals in Randolph, private company employees (219 | 76.8%), local government employees (39 | 13.7%), and state government employees (13 | 4.6%) make up the most common classes of employment.
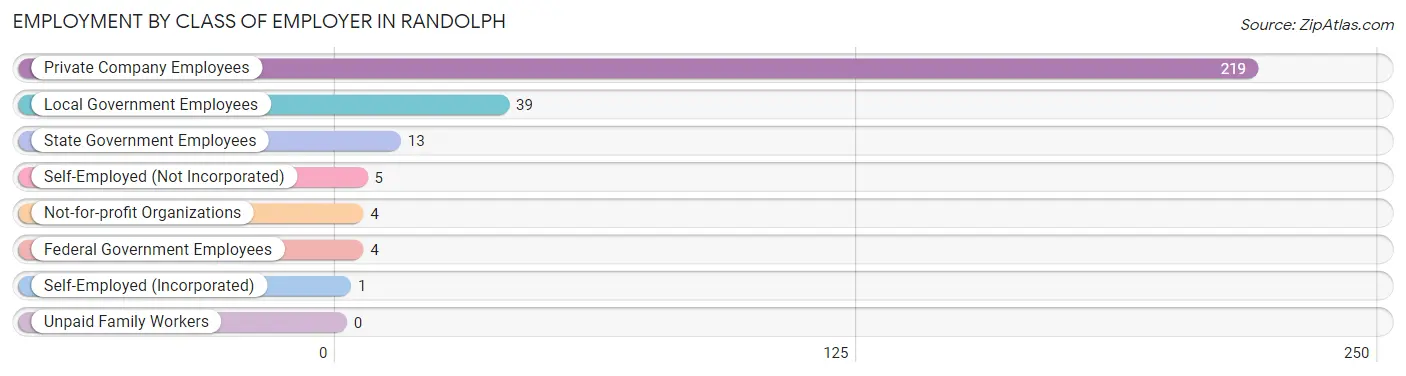
| Employer Class | # Employees | % Employees |
| Private Company Employees | 219 | 76.8% |
| Self-Employed (Incorporated) | 1 | 0.4% |
| Self-Employed (Not Incorporated) | 5 | 1.8% |
| Not-for-profit Organizations | 4 | 1.4% |
| Local Government Employees | 39 | 13.7% |
| State Government Employees | 13 | 4.6% |
| Federal Government Employees | 4 | 1.4% |
| Unpaid Family Workers | 0 | 0.0% |
| Total | 285 | 100.0% |
Employment Status by Age in Randolph
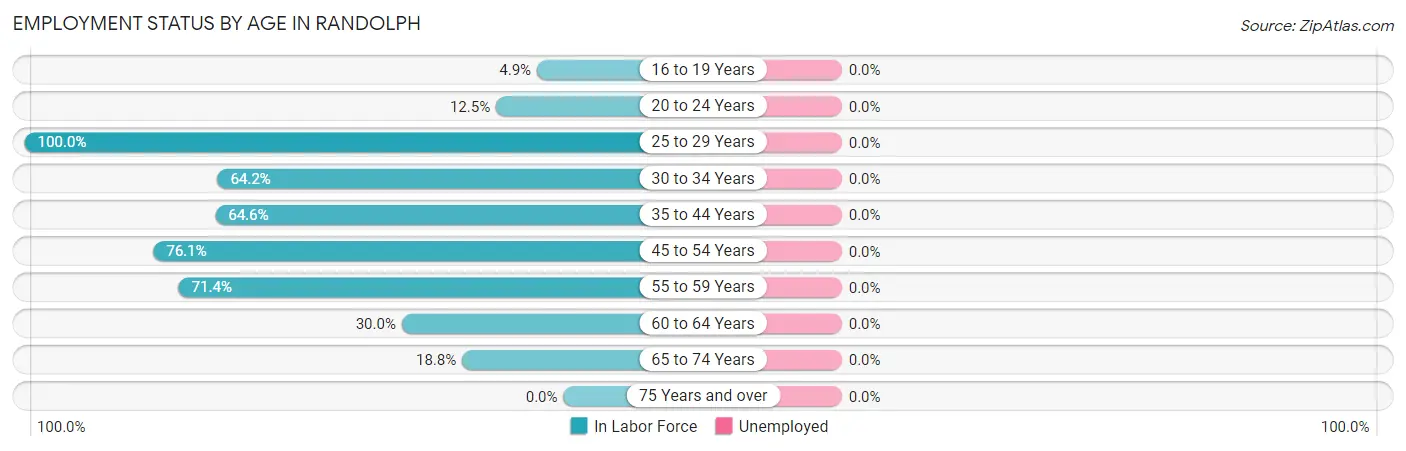
| Age Bracket | In Labor Force | Unemployed |
| 16 to 19 Years | 4 (4.9%) | 0 (0.0%) |
| 20 to 24 Years | 7 (12.5%) | 0 (0.0%) |
| 25 to 29 Years | 69 (100.0%) | 0 (0.0%) |
| 30 to 34 Years | 52 (64.2%) | 0 (0.0%) |
| 35 to 44 Years | 62 (64.6%) | 0 (0.0%) |
| 45 to 54 Years | 54 (76.1%) | 0 (0.0%) |
| 55 to 59 Years | 10 (71.4%) | 0 (0.0%) |
| 60 to 64 Years | 15 (30.0%) | 0 (0.0%) |
| 65 to 74 Years | 15 (18.8%) | 0 (0.0%) |
| 75 Years and over | 0 (0.0%) | 0 (0.0%) |
| Total | 288 (45.6%) | 0 (0.0%) |
Employment Status by Educational Attainment in Randolph
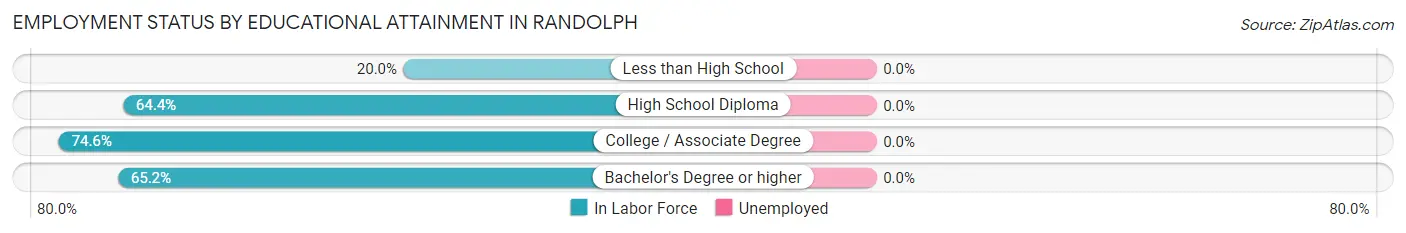
| Educational Attainment | In Labor Force | Unemployed |
| Less than High School | 3 (20.0%) | 0 (0.0%) |
| High School Diploma | 47 (64.4%) | 0 (0.0%) |
| College / Associate Degree | 167 (74.6%) | 0 (0.0%) |
| Bachelor's Degree or higher | 45 (65.2%) | 0 (0.0%) |
| Total | 262 (68.8%) | 0 (0.0%) |
Employment Occupations by Sex in Randolph
Management, Business, Science and Arts Occupations
The most common Management, Business, Science and Arts occupations in Randolph are Computers, Engineering & Science (30 | 10.4%), Community & Social Service (29 | 10.1%), Education Instruction & Library (27 | 9.4%), Computers & Mathematics (26 | 9.0%), and Management (14 | 4.9%).
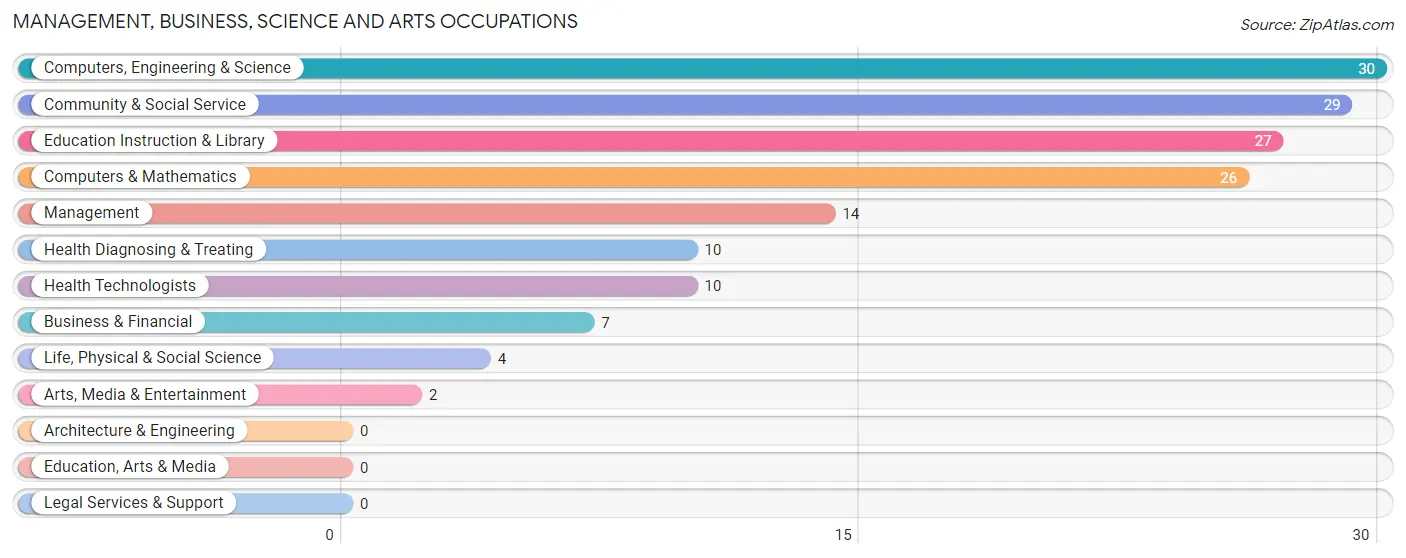
Management, Business, Science and Arts Occupations by Sex
Within the Management, Business, Science and Arts occupations in Randolph, the most male-oriented occupations are Business & Financial (100.0%), Computers & Mathematics (100.0%), and Computers, Engineering & Science (86.7%), while the most female-oriented occupations are Life, Physical & Social Science (100.0%), Arts, Media & Entertainment (100.0%), and Management (85.7%).
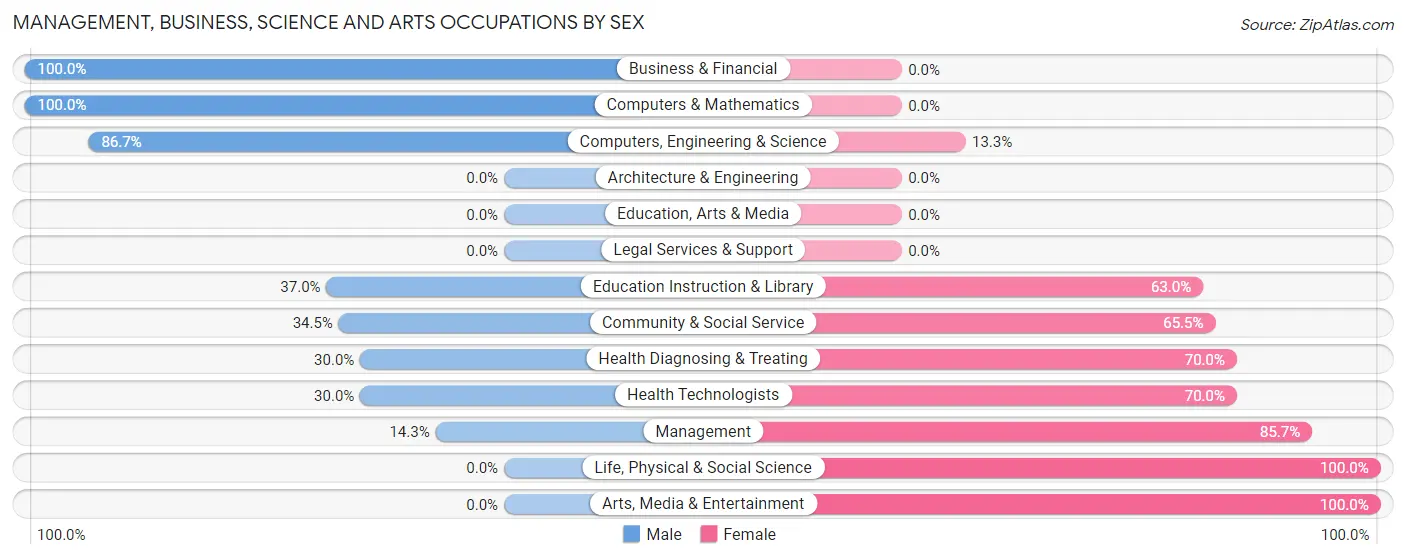
| Occupation | Male | Female |
| Management | 2 (14.3%) | 12 (85.7%) |
| Business & Financial | 7 (100.0%) | 0 (0.0%) |
| Computers, Engineering & Science | 26 (86.7%) | 4 (13.3%) |
| Computers & Mathematics | 26 (100.0%) | 0 (0.0%) |
| Architecture & Engineering | 0 (0.0%) | 0 (0.0%) |
| Life, Physical & Social Science | 0 (0.0%) | 4 (100.0%) |
| Community & Social Service | 10 (34.5%) | 19 (65.5%) |
| Education, Arts & Media | 0 (0.0%) | 0 (0.0%) |
| Legal Services & Support | 0 (0.0%) | 0 (0.0%) |
| Education Instruction & Library | 10 (37.0%) | 17 (63.0%) |
| Arts, Media & Entertainment | 0 (0.0%) | 2 (100.0%) |
| Health Diagnosing & Treating | 3 (30.0%) | 7 (70.0%) |
| Health Technologists | 3 (30.0%) | 7 (70.0%) |
| Total (Category) | 48 (53.3%) | 42 (46.7%) |
| Total (Overall) | 126 (43.8%) | 162 (56.2%) |
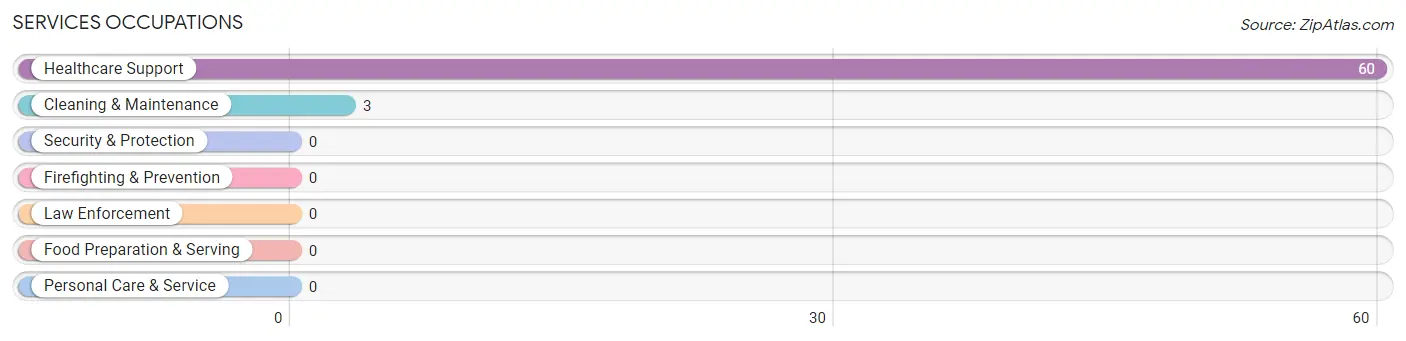
Services Occupations
The most common Services occupations in Randolph are Healthcare Support (60 | 20.8%), and Cleaning & Maintenance (3 | 1.0%).
Services Occupations by Sex
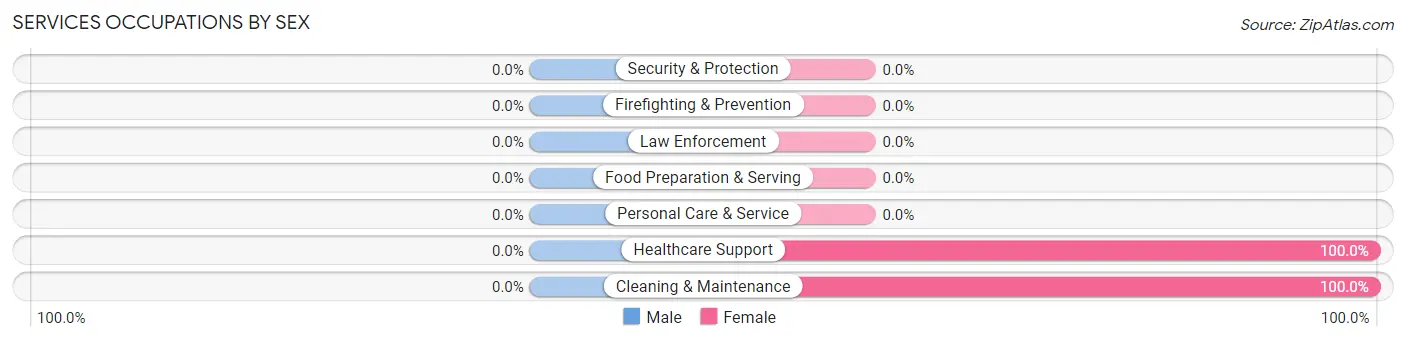
| Occupation | Male | Female |
| Healthcare Support | 0 (0.0%) | 60 (100.0%) |
| Security & Protection | 0 (0.0%) | 0 (0.0%) |
| Firefighting & Prevention | 0 (0.0%) | 0 (0.0%) |
| Law Enforcement | 0 (0.0%) | 0 (0.0%) |
| Food Preparation & Serving | 0 (0.0%) | 0 (0.0%) |
| Cleaning & Maintenance | 0 (0.0%) | 3 (100.0%) |
| Personal Care & Service | 0 (0.0%) | 0 (0.0%) |
| Total (Category) | 0 (0.0%) | 63 (100.0%) |
| Total (Overall) | 126 (43.8%) | 162 (56.2%) |
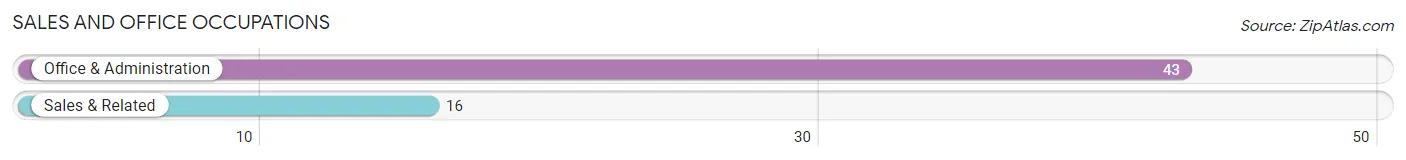
Sales and Office Occupations
The most common Sales and Office occupations in Randolph are Office & Administration (43 | 14.9%), and Sales & Related (16 | 5.6%).
Sales and Office Occupations by Sex
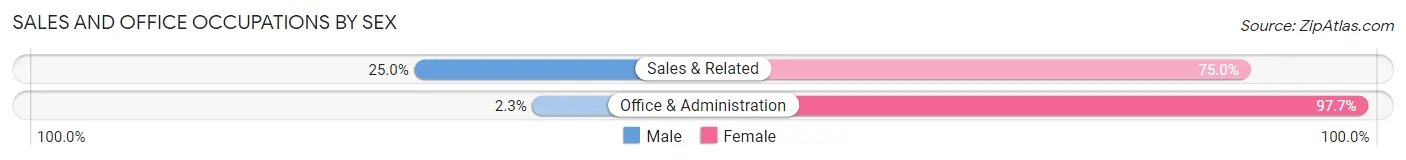
| Occupation | Male | Female |
| Sales & Related | 4 (25.0%) | 12 (75.0%) |
| Office & Administration | 1 (2.3%) | 42 (97.7%) |
| Total (Category) | 5 (8.5%) | 54 (91.5%) |
| Total (Overall) | 126 (43.8%) | 162 (56.2%) |
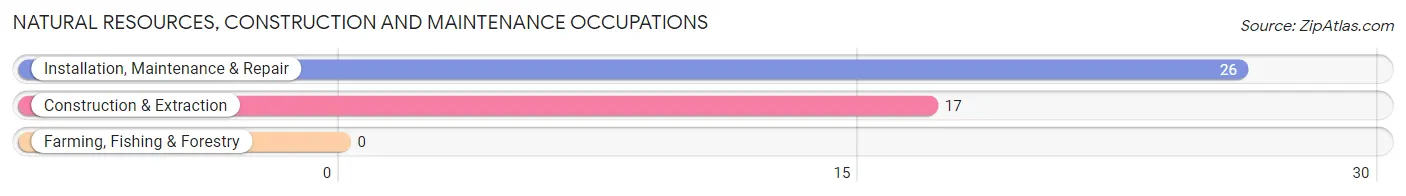
Natural Resources, Construction and Maintenance Occupations
The most common Natural Resources, Construction and Maintenance occupations in Randolph are Installation, Maintenance & Repair (26 | 9.0%), and Construction & Extraction (17 | 5.9%).
Natural Resources, Construction and Maintenance Occupations by Sex
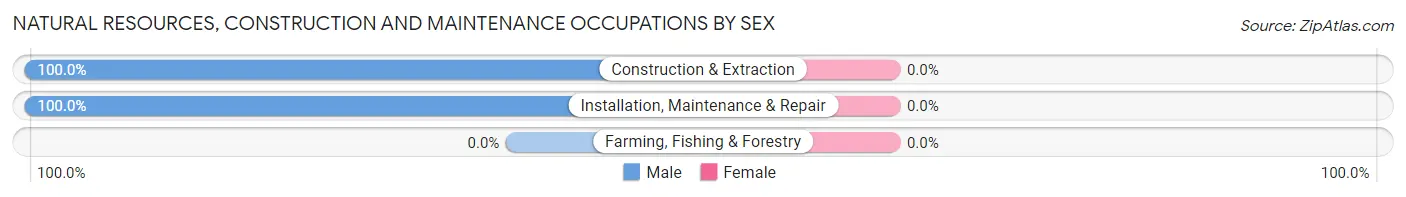
| Occupation | Male | Female |
| Farming, Fishing & Forestry | 0 (0.0%) | 0 (0.0%) |
| Construction & Extraction | 17 (100.0%) | 0 (0.0%) |
| Installation, Maintenance & Repair | 26 (100.0%) | 0 (0.0%) |
| Total (Category) | 43 (100.0%) | 0 (0.0%) |
| Total (Overall) | 126 (43.8%) | 162 (56.2%) |
Production, Transportation and Moving Occupations
The most common Production, Transportation and Moving occupations in Randolph are Transportation (19 | 6.6%), Production (11 | 3.8%), and Material Moving (3 | 1.0%).
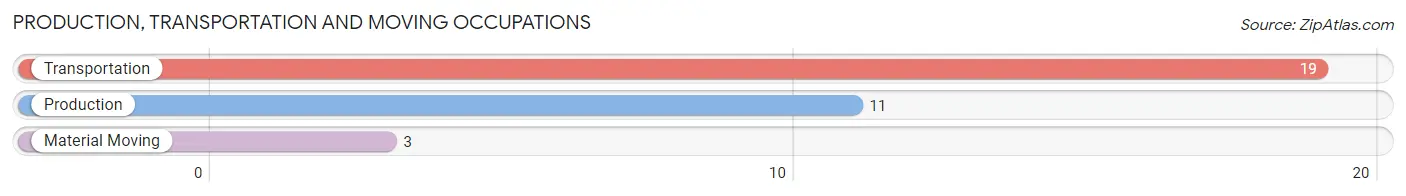
Production, Transportation and Moving Occupations by Sex
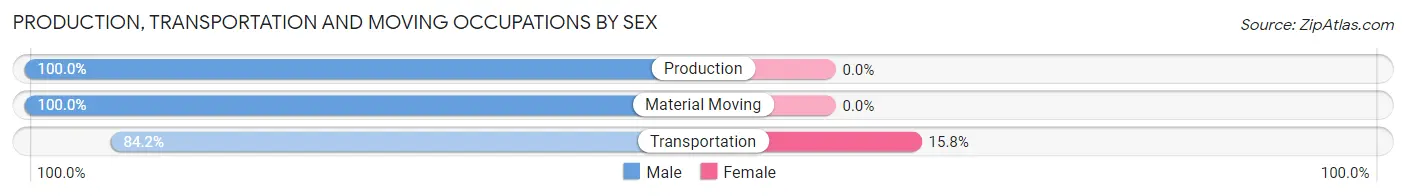
| Occupation | Male | Female |
| Production | 11 (100.0%) | 0 (0.0%) |
| Transportation | 16 (84.2%) | 3 (15.8%) |
| Material Moving | 3 (100.0%) | 0 (0.0%) |
| Total (Category) | 30 (90.9%) | 3 (9.1%) |
| Total (Overall) | 126 (43.8%) | 162 (56.2%) |
Employment Industries by Sex in Randolph
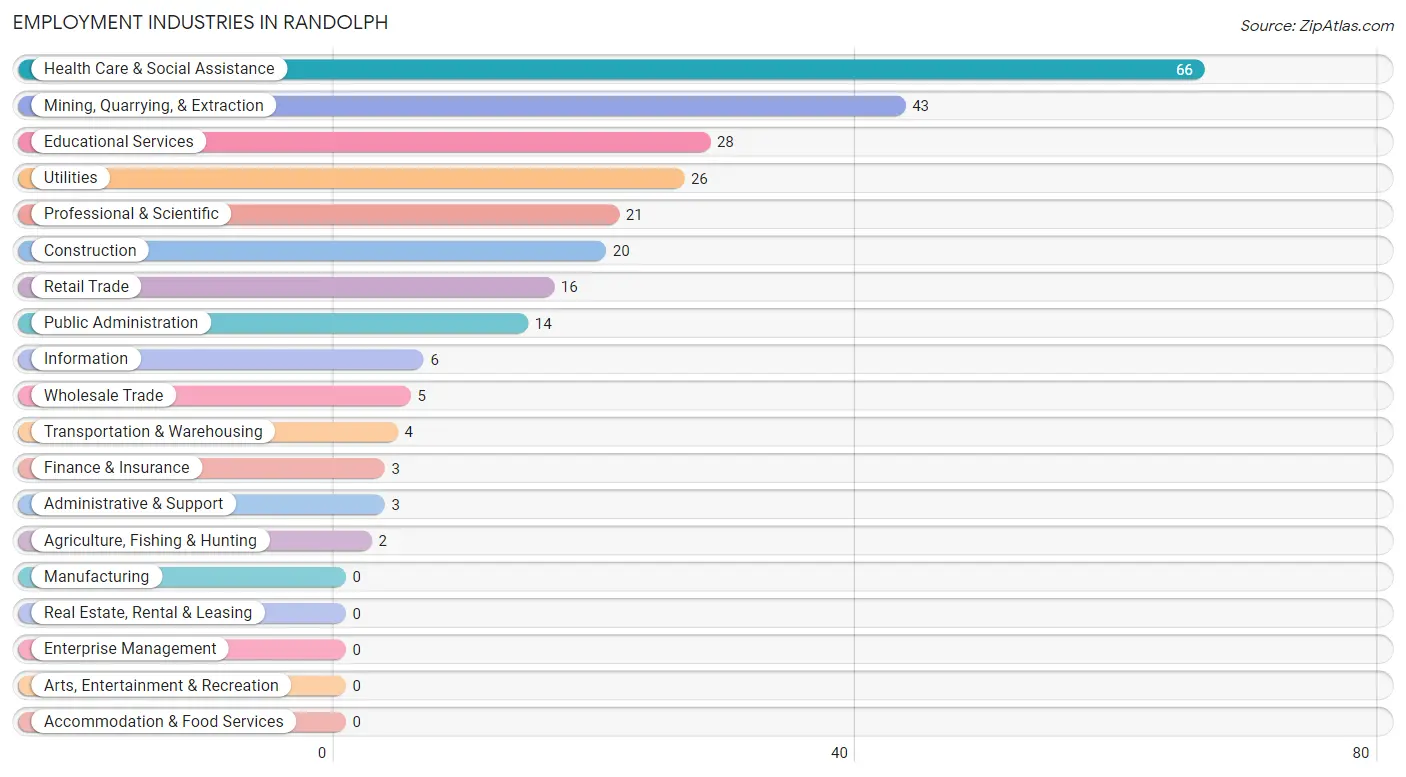
Employment Industries in Randolph
The major employment industries in Randolph include Health Care & Social Assistance (66 | 22.9%), Mining, Quarrying, & Extraction (43 | 14.9%), Educational Services (28 | 9.7%), Utilities (26 | 9.0%), and Professional & Scientific (21 | 7.3%).
Employment Industries by Sex in Randolph
The Randolph industries that see more men than women are Agriculture, Fishing & Hunting (100.0%), Mining, Quarrying, & Extraction (100.0%), and Construction (100.0%), whereas the industries that tend to have a higher number of women are Information (100.0%), Finance & Insurance (100.0%), and Professional & Scientific (100.0%).
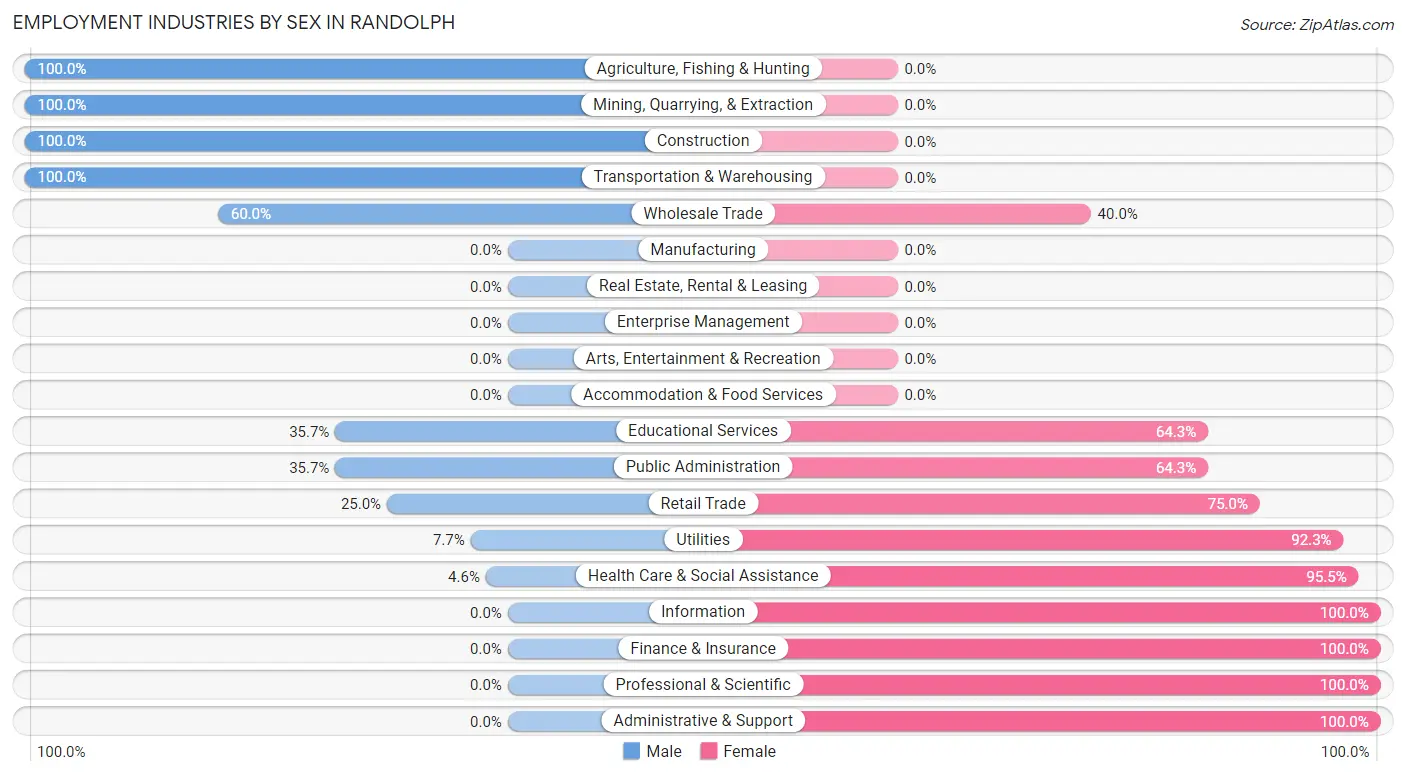
| Industry | Male | Female |
| Agriculture, Fishing & Hunting | 2 (100.0%) | 0 (0.0%) |
| Mining, Quarrying, & Extraction | 43 (100.0%) | 0 (0.0%) |
| Construction | 20 (100.0%) | 0 (0.0%) |
| Manufacturing | 0 (0.0%) | 0 (0.0%) |
| Wholesale Trade | 3 (60.0%) | 2 (40.0%) |
| Retail Trade | 4 (25.0%) | 12 (75.0%) |
| Transportation & Warehousing | 4 (100.0%) | 0 (0.0%) |
| Utilities | 2 (7.7%) | 24 (92.3%) |
| Information | 0 (0.0%) | 6 (100.0%) |
| Finance & Insurance | 0 (0.0%) | 3 (100.0%) |
| Real Estate, Rental & Leasing | 0 (0.0%) | 0 (0.0%) |
| Professional & Scientific | 0 (0.0%) | 21 (100.0%) |
| Enterprise Management | 0 (0.0%) | 0 (0.0%) |
| Administrative & Support | 0 (0.0%) | 3 (100.0%) |
| Educational Services | 10 (35.7%) | 18 (64.3%) |
| Health Care & Social Assistance | 3 (4.5%) | 63 (95.5%) |
| Arts, Entertainment & Recreation | 0 (0.0%) | 0 (0.0%) |
| Accommodation & Food Services | 0 (0.0%) | 0 (0.0%) |
| Public Administration | 5 (35.7%) | 9 (64.3%) |
| Total | 126 (43.8%) | 162 (56.2%) |
Education in Randolph
School Enrollment in Randolph
The most common levels of schooling among the 317 students in Randolph are elementary school (98 | 30.9%), college / undergraduate (65 | 20.5%), and high school (62 | 19.6%).
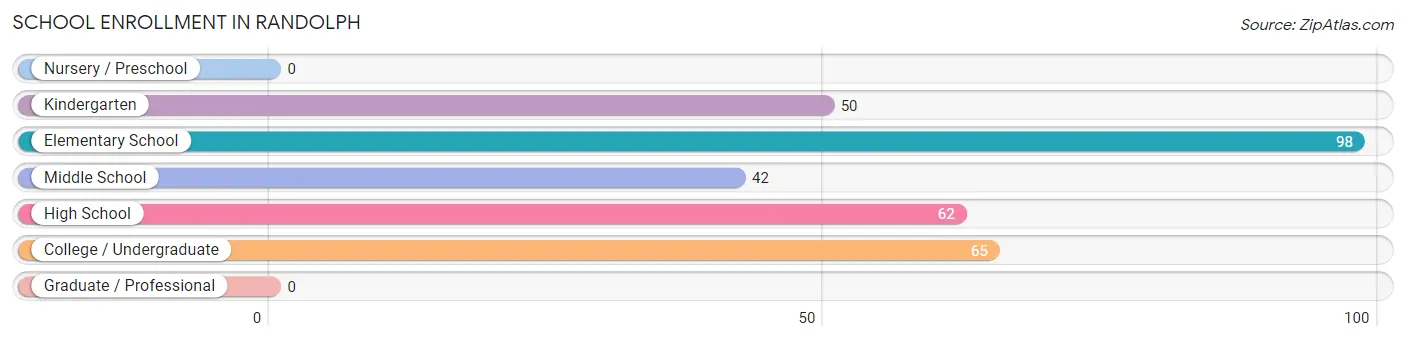
| School Level | # Students | % Students |
| Nursery / Preschool | 0 | 0.0% |
| Kindergarten | 50 | 15.8% |
| Elementary School | 98 | 30.9% |
| Middle School | 42 | 13.3% |
| High School | 62 | 19.6% |
| College / Undergraduate | 65 | 20.5% |
| Graduate / Professional | 0 | 0.0% |
| Total | 317 | 100.0% |
School Enrollment by Age by Funding Source in Randolph
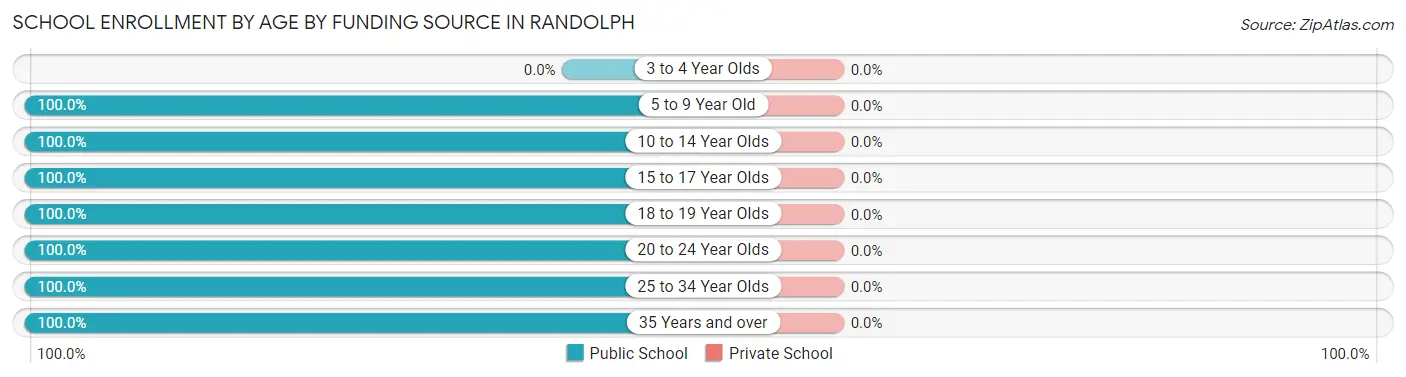
| Age Bracket | Public School | Private School |
| 3 to 4 Year Olds | 0 (0.0%) | 0 (0.0%) |
| 5 to 9 Year Old | 144 (100.0%) | 0 (0.0%) |
| 10 to 14 Year Olds | 63 (100.0%) | 0 (0.0%) |
| 15 to 17 Year Olds | 20 (100.0%) | 0 (0.0%) |
| 18 to 19 Year Olds | 25 (100.0%) | 0 (0.0%) |
| 20 to 24 Year Olds | 3 (100.0%) | 0 (0.0%) |
| 25 to 34 Year Olds | 36 (100.0%) | 0 (0.0%) |
| 35 Years and over | 26 (100.0%) | 0 (0.0%) |
| Total | 317 (100.0%) | 0 (0.0%) |
Educational Attainment by Field of Study in Randolph
Bio, nature & agricultural (22 | 25.6%), education (18 | 20.9%), science & technology (16 | 18.6%), business (15 | 17.4%), and psychology (6 | 7.0%) are the most common fields of study among 86 individuals in Randolph who have obtained a bachelor's degree or higher.
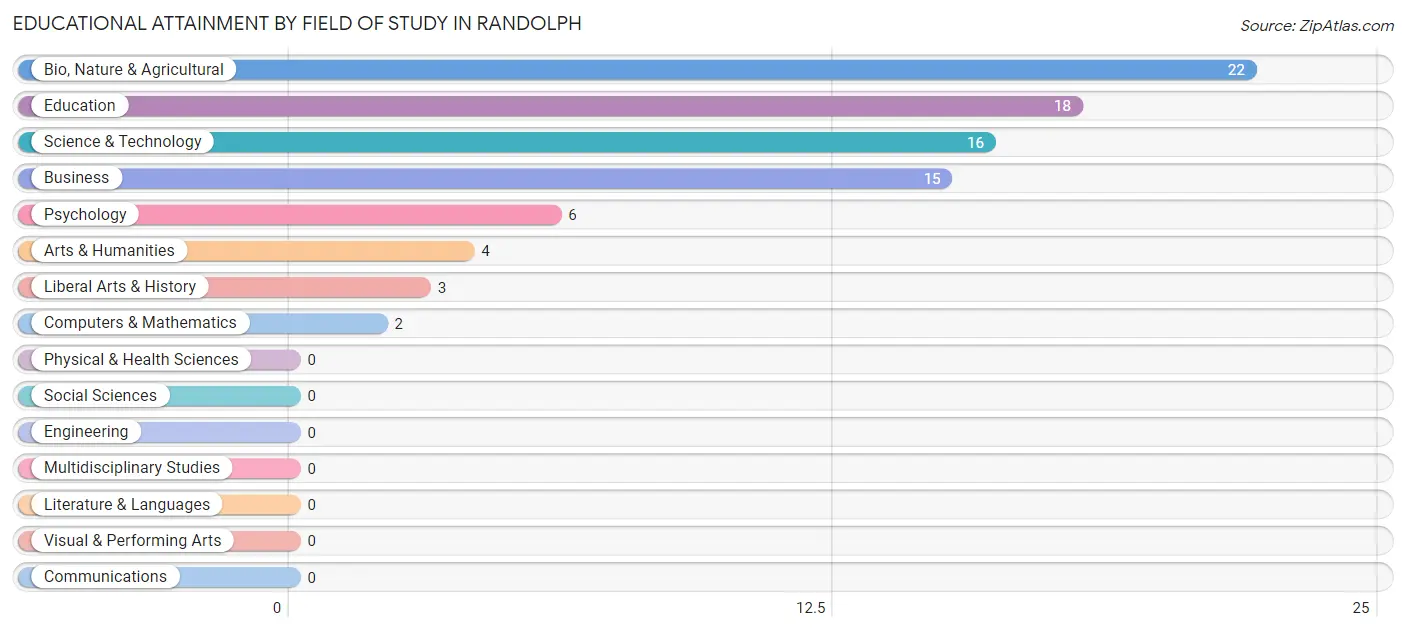
| Field of Study | # Graduates | % Graduates |
| Computers & Mathematics | 2 | 2.3% |
| Bio, Nature & Agricultural | 22 | 25.6% |
| Physical & Health Sciences | 0 | 0.0% |
| Psychology | 6 | 7.0% |
| Social Sciences | 0 | 0.0% |
| Engineering | 0 | 0.0% |
| Multidisciplinary Studies | 0 | 0.0% |
| Science & Technology | 16 | 18.6% |
| Business | 15 | 17.4% |
| Education | 18 | 20.9% |
| Literature & Languages | 0 | 0.0% |
| Liberal Arts & History | 3 | 3.5% |
| Visual & Performing Arts | 0 | 0.0% |
| Communications | 0 | 0.0% |
| Arts & Humanities | 4 | 4.6% |
| Total | 86 | 100.0% |
Transportation & Commute in Randolph
Vehicle Availability by Sex in Randolph
The most prevalent vehicle ownership categories in Randolph are males with 3 vehicles (50, accounting for 39.7%) and females with 3 vehicles (32, making up 31.5%).
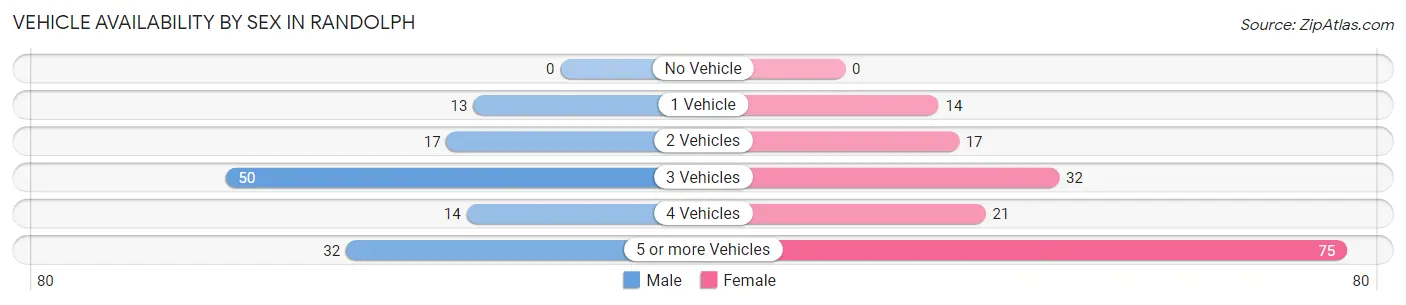
| Vehicles Available | Male | Female |
| No Vehicle | 0 (0.0%) | 0 (0.0%) |
| 1 Vehicle | 13 (10.3%) | 14 (8.8%) |
| 2 Vehicles | 17 (13.5%) | 17 (10.7%) |
| 3 Vehicles | 50 (39.7%) | 32 (20.1%) |
| 4 Vehicles | 14 (11.1%) | 21 (13.2%) |
| 5 or more Vehicles | 32 (25.4%) | 75 (47.2%) |
| Total | 126 (100.0%) | 159 (100.0%) |
Commute Time in Randolph
The most frequently occuring commute durations in Randolph are 35 to 39 minutes (83 commuters, 30.4%), less than 5 minutes (57 commuters, 20.9%), and 45 to 59 minutes (38 commuters, 13.9%).
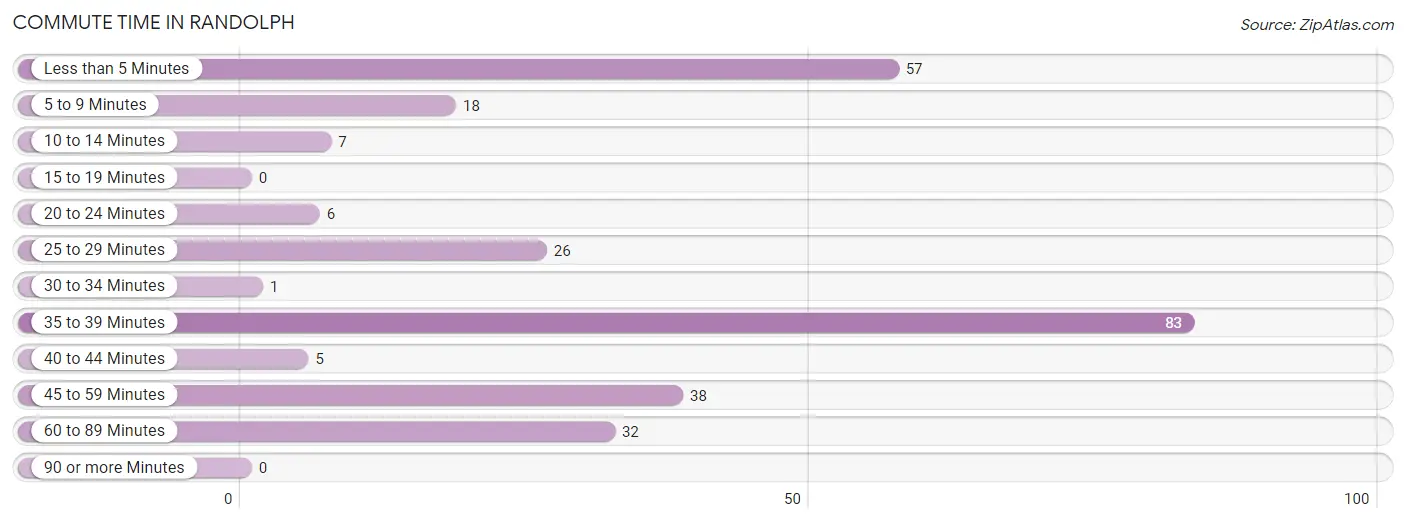
| Commute Time | # Commuters | % Commuters |
| Less than 5 Minutes | 57 | 20.9% |
| 5 to 9 Minutes | 18 | 6.6% |
| 10 to 14 Minutes | 7 | 2.6% |
| 15 to 19 Minutes | 0 | 0.0% |
| 20 to 24 Minutes | 6 | 2.2% |
| 25 to 29 Minutes | 26 | 9.5% |
| 30 to 34 Minutes | 1 | 0.4% |
| 35 to 39 Minutes | 83 | 30.4% |
| 40 to 44 Minutes | 5 | 1.8% |
| 45 to 59 Minutes | 38 | 13.9% |
| 60 to 89 Minutes | 32 | 11.7% |
| 90 or more Minutes | 0 | 0.0% |
Commute Time by Sex in Randolph
The most common commute times in Randolph are 45 to 59 minutes (32 commuters, 26.0%) for males and 35 to 39 minutes (80 commuters, 53.3%) for females.
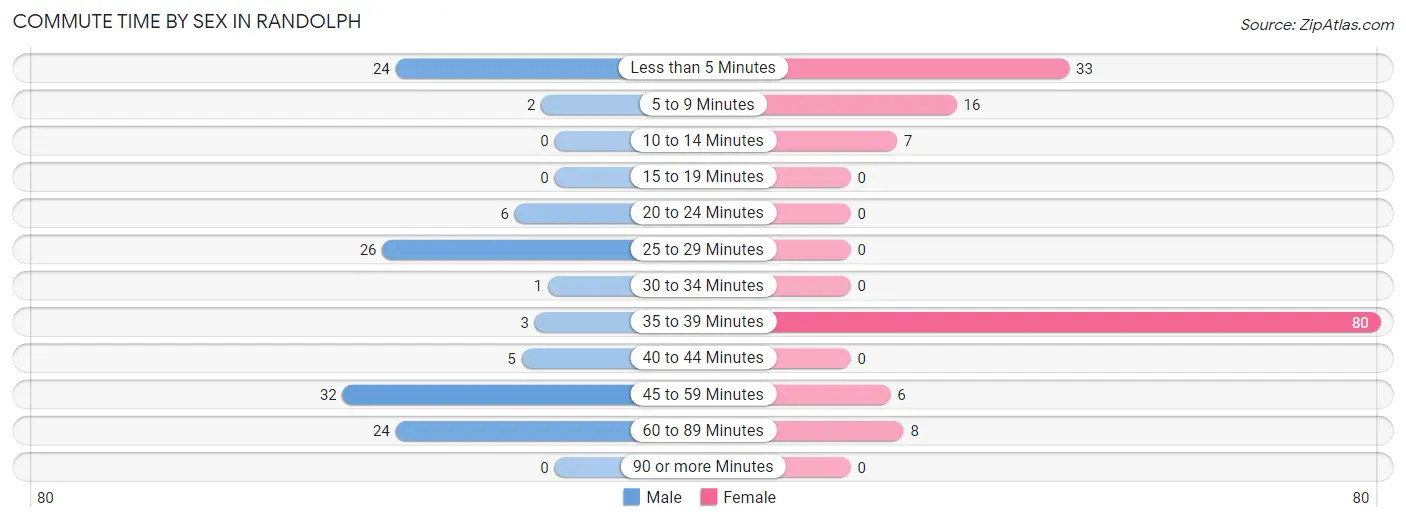
| Commute Time | Male | Female |
| Less than 5 Minutes | 24 (19.5%) | 33 (22.0%) |
| 5 to 9 Minutes | 2 (1.6%) | 16 (10.7%) |
| 10 to 14 Minutes | 0 (0.0%) | 7 (4.7%) |
| 15 to 19 Minutes | 0 (0.0%) | 0 (0.0%) |
| 20 to 24 Minutes | 6 (4.9%) | 0 (0.0%) |
| 25 to 29 Minutes | 26 (21.1%) | 0 (0.0%) |
| 30 to 34 Minutes | 1 (0.8%) | 0 (0.0%) |
| 35 to 39 Minutes | 3 (2.4%) | 80 (53.3%) |
| 40 to 44 Minutes | 5 (4.1%) | 0 (0.0%) |
| 45 to 59 Minutes | 32 (26.0%) | 6 (4.0%) |
| 60 to 89 Minutes | 24 (19.5%) | 8 (5.3%) |
| 90 or more Minutes | 0 (0.0%) | 0 (0.0%) |
Time of Departure to Work by Sex in Randolph
The most frequent times of departure to work in Randolph are 6:30 AM to 6:59 AM (34, 27.6%) for males and 6:00 AM to 6:29 AM (36, 24.0%) for females.
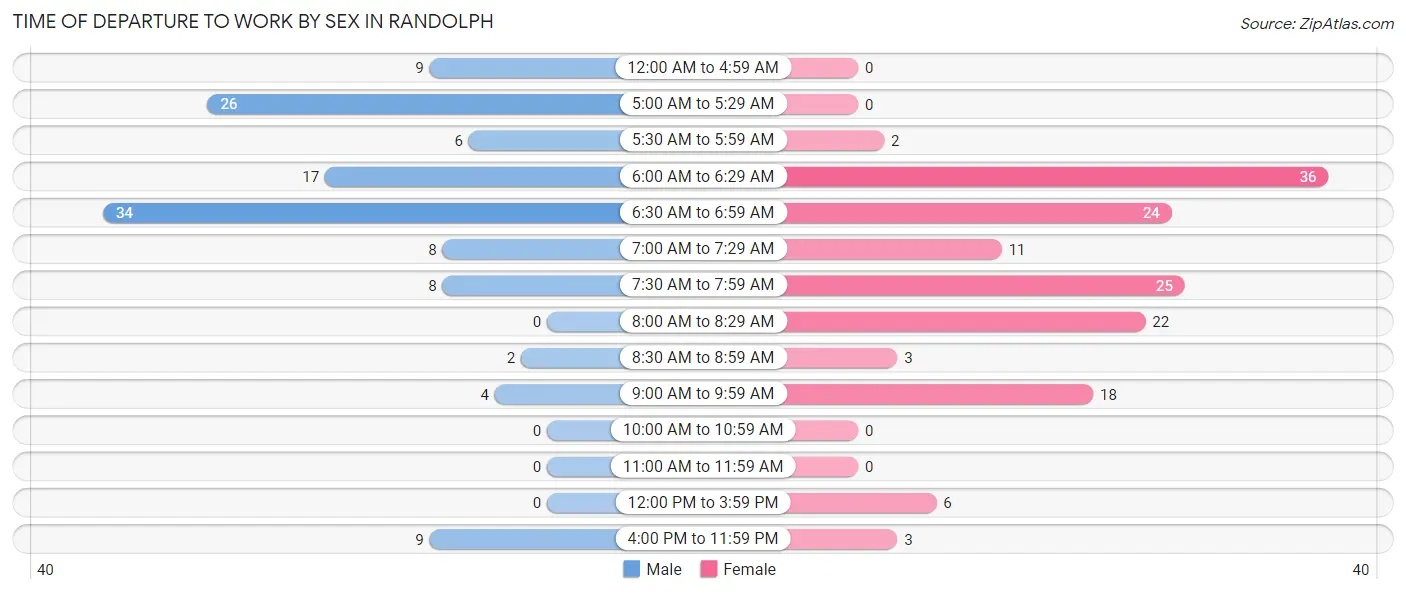
| Time of Departure | Male | Female |
| 12:00 AM to 4:59 AM | 9 (7.3%) | 0 (0.0%) |
| 5:00 AM to 5:29 AM | 26 (21.1%) | 0 (0.0%) |
| 5:30 AM to 5:59 AM | 6 (4.9%) | 2 (1.3%) |
| 6:00 AM to 6:29 AM | 17 (13.8%) | 36 (24.0%) |
| 6:30 AM to 6:59 AM | 34 (27.6%) | 24 (16.0%) |
| 7:00 AM to 7:29 AM | 8 (6.5%) | 11 (7.3%) |
| 7:30 AM to 7:59 AM | 8 (6.5%) | 25 (16.7%) |
| 8:00 AM to 8:29 AM | 0 (0.0%) | 22 (14.7%) |
| 8:30 AM to 8:59 AM | 2 (1.6%) | 3 (2.0%) |
| 9:00 AM to 9:59 AM | 4 (3.3%) | 18 (12.0%) |
| 10:00 AM to 10:59 AM | 0 (0.0%) | 0 (0.0%) |
| 11:00 AM to 11:59 AM | 0 (0.0%) | 0 (0.0%) |
| 12:00 PM to 3:59 PM | 0 (0.0%) | 6 (4.0%) |
| 4:00 PM to 11:59 PM | 9 (7.3%) | 3 (2.0%) |
| Total | 123 (100.0%) | 150 (100.0%) |
Housing Occupancy in Randolph
Occupancy by Ownership in Randolph
Of the total 179 dwellings in Randolph, owner-occupied units account for 119 (66.5%), while renter-occupied units make up 60 (33.5%).
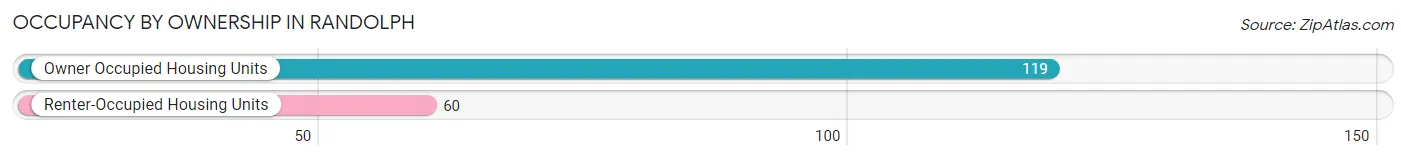
| Occupancy | # Housing Units | % Housing Units |
| Owner Occupied Housing Units | 119 | 66.5% |
| Renter-Occupied Housing Units | 60 | 33.5% |
| Total Occupied Housing Units | 179 | 100.0% |
Occupancy by Household Size in Randolph
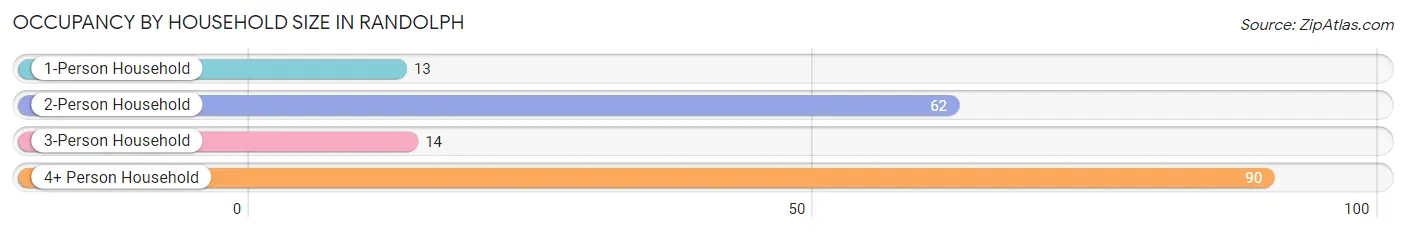
| Household Size | # Housing Units | % Housing Units |
| 1-Person Household | 13 | 7.3% |
| 2-Person Household | 62 | 34.6% |
| 3-Person Household | 14 | 7.8% |
| 4+ Person Household | 90 | 50.3% |
| Total Housing Units | 179 | 100.0% |
Occupancy by Ownership by Household Size in Randolph
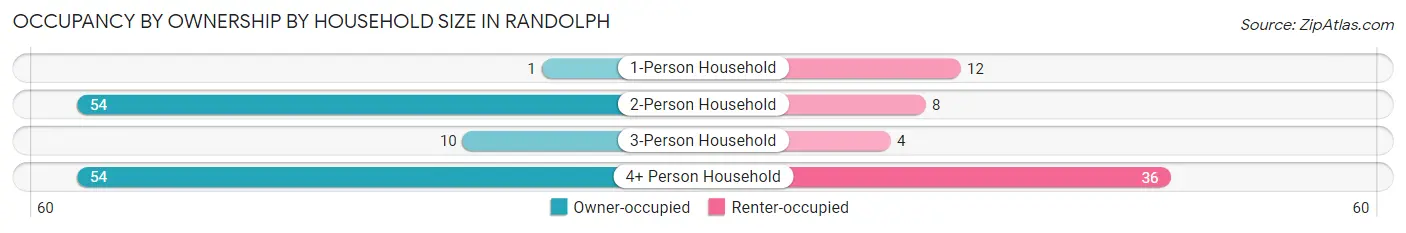
| Household Size | Owner-occupied | Renter-occupied |
| 1-Person Household | 1 (7.7%) | 12 (92.3%) |
| 2-Person Household | 54 (87.1%) | 8 (12.9%) |
| 3-Person Household | 10 (71.4%) | 4 (28.6%) |
| 4+ Person Household | 54 (60.0%) | 36 (40.0%) |
| Total Housing Units | 119 (66.5%) | 60 (33.5%) |
Occupancy by Educational Attainment in Randolph
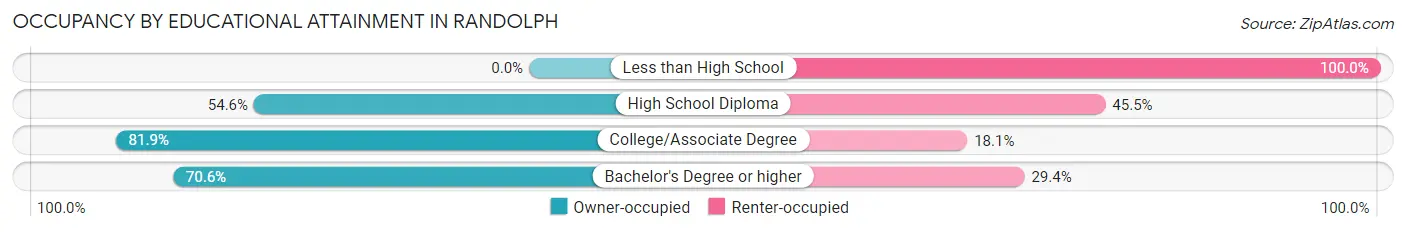
| Household Size | Owner-occupied | Renter-occupied |
| Less than High School | 0 (0.0%) | 12 (100.0%) |
| High School Diploma | 24 (54.5%) | 20 (45.5%) |
| College/Associate Degree | 59 (81.9%) | 13 (18.1%) |
| Bachelor's Degree or higher | 36 (70.6%) | 15 (29.4%) |
Occupancy by Age of Householder in Randolph
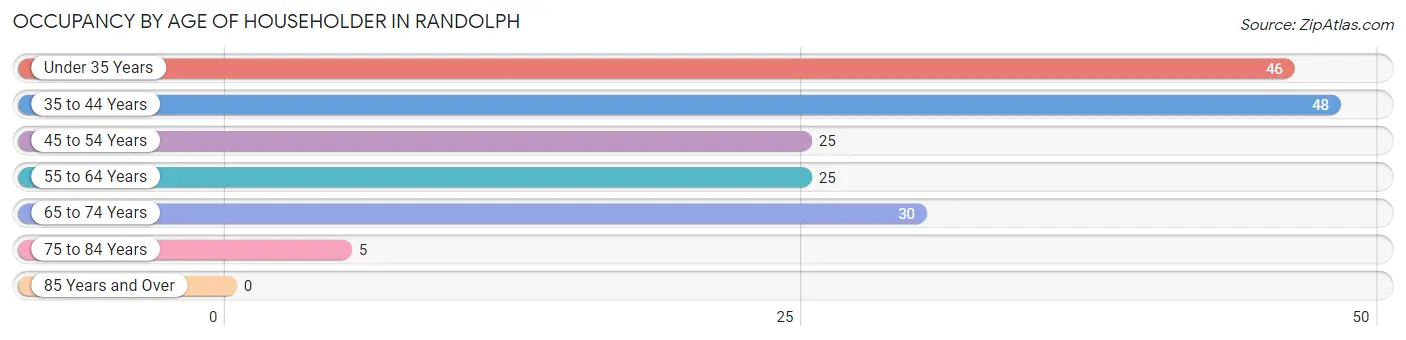
| Age Bracket | # Households | % Households |
| Under 35 Years | 46 | 25.7% |
| 35 to 44 Years | 48 | 26.8% |
| 45 to 54 Years | 25 | 14.0% |
| 55 to 64 Years | 25 | 14.0% |
| 65 to 74 Years | 30 | 16.8% |
| 75 to 84 Years | 5 | 2.8% |
| 85 Years and Over | 0 | 0.0% |
| Total | 179 | 100.0% |
Housing Finances in Randolph
Median Income by Occupancy in Randolph
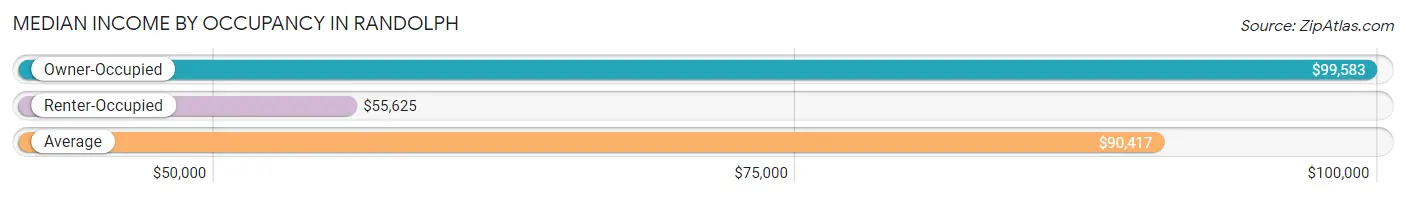
| Occupancy Type | # Households | Median Income |
| Owner-Occupied | 119 (66.5%) | $99,583 |
| Renter-Occupied | 60 (33.5%) | $55,625 |
| Average | 179 (100.0%) | $90,417 |
Occupancy by Householder Income Bracket in Randolph
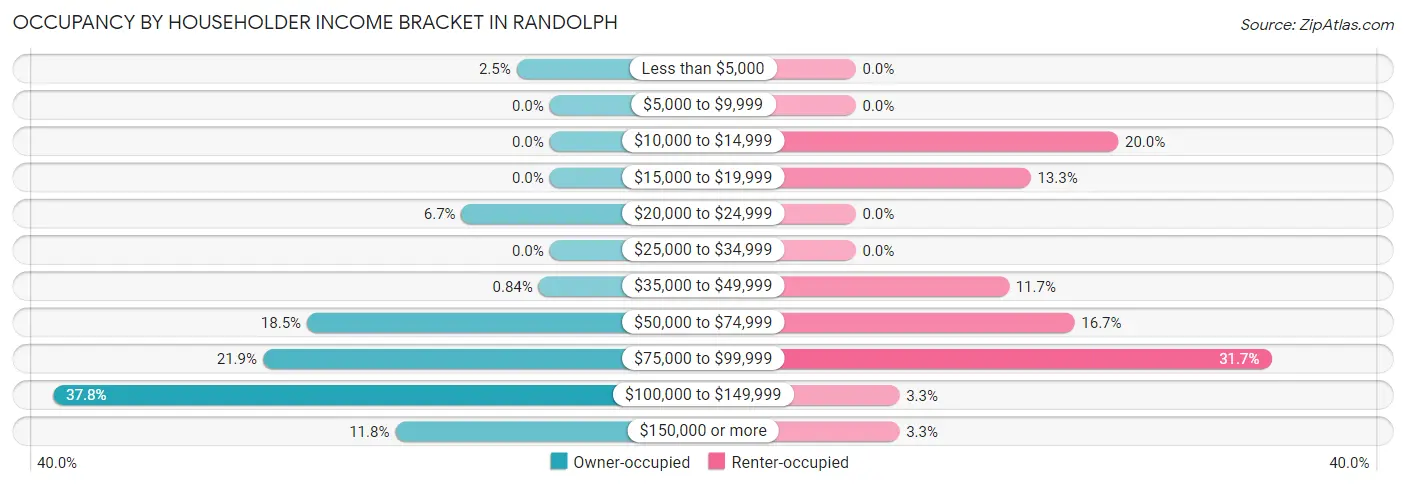
| Income Bracket | Owner-occupied | Renter-occupied |
| Less than $5,000 | 3 (2.5%) | 0 (0.0%) |
| $5,000 to $9,999 | 0 (0.0%) | 0 (0.0%) |
| $10,000 to $14,999 | 0 (0.0%) | 12 (20.0%) |
| $15,000 to $19,999 | 0 (0.0%) | 8 (13.3%) |
| $20,000 to $24,999 | 8 (6.7%) | 0 (0.0%) |
| $25,000 to $34,999 | 0 (0.0%) | 0 (0.0%) |
| $35,000 to $49,999 | 1 (0.8%) | 7 (11.7%) |
| $50,000 to $74,999 | 22 (18.5%) | 10 (16.7%) |
| $75,000 to $99,999 | 26 (21.8%) | 19 (31.7%) |
| $100,000 to $149,999 | 45 (37.8%) | 2 (3.3%) |
| $150,000 or more | 14 (11.8%) | 2 (3.3%) |
| Total | 119 (100.0%) | 60 (100.0%) |
Monthly Housing Cost Tiers in Randolph
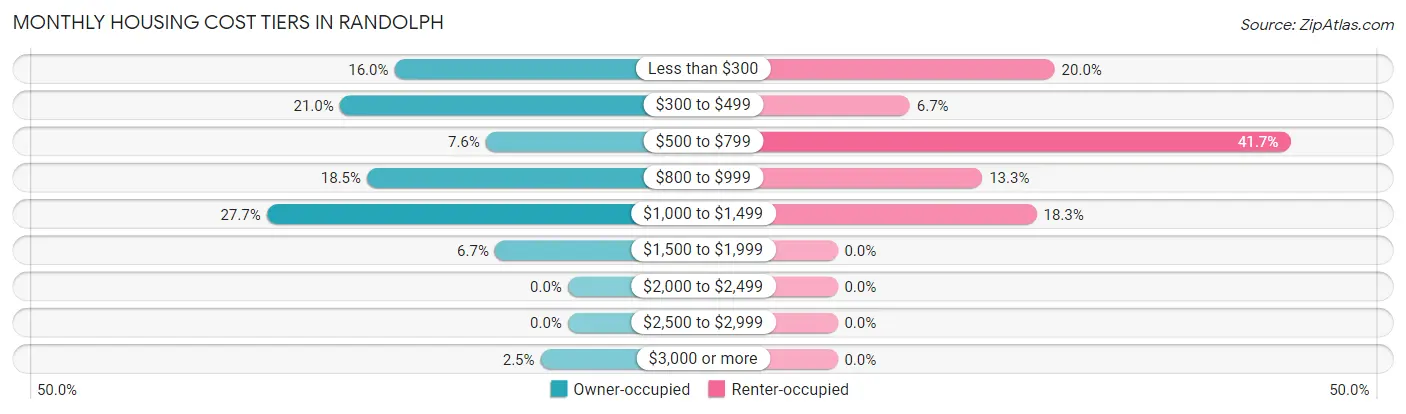
| Monthly Cost | Owner-occupied | Renter-occupied |
| Less than $300 | 19 (16.0%) | 12 (20.0%) |
| $300 to $499 | 25 (21.0%) | 4 (6.7%) |
| $500 to $799 | 9 (7.6%) | 25 (41.7%) |
| $800 to $999 | 22 (18.5%) | 8 (13.3%) |
| $1,000 to $1,499 | 33 (27.7%) | 11 (18.3%) |
| $1,500 to $1,999 | 8 (6.7%) | 0 (0.0%) |
| $2,000 to $2,499 | 0 (0.0%) | 0 (0.0%) |
| $2,500 to $2,999 | 0 (0.0%) | 0 (0.0%) |
| $3,000 or more | 3 (2.5%) | 0 (0.0%) |
| Total | 119 (100.0%) | 60 (100.0%) |
Physical Housing Characteristics in Randolph
Housing Structures in Randolph
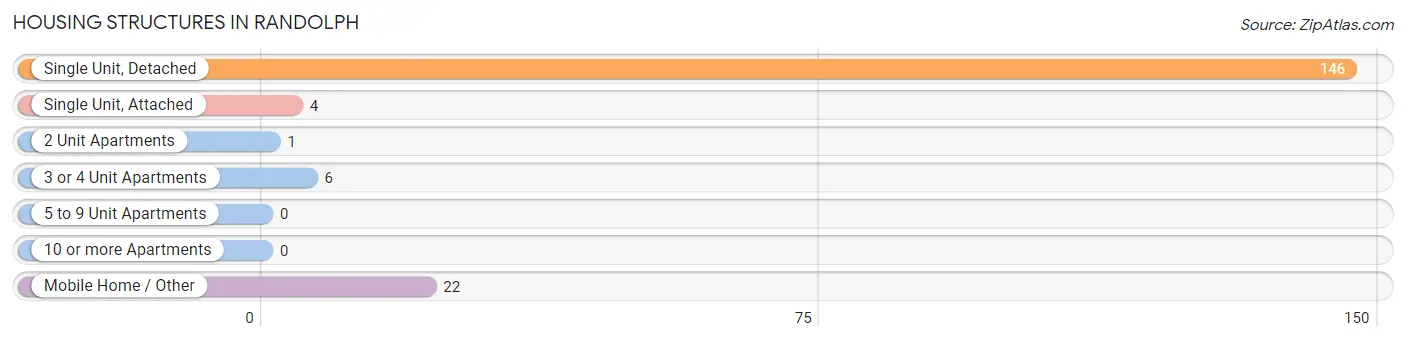
| Structure Type | # Housing Units | % Housing Units |
| Single Unit, Detached | 146 | 81.6% |
| Single Unit, Attached | 4 | 2.2% |
| 2 Unit Apartments | 1 | 0.6% |
| 3 or 4 Unit Apartments | 6 | 3.4% |
| 5 to 9 Unit Apartments | 0 | 0.0% |
| 10 or more Apartments | 0 | 0.0% |
| Mobile Home / Other | 22 | 12.3% |
| Total | 179 | 100.0% |
Housing Structures by Occupancy in Randolph
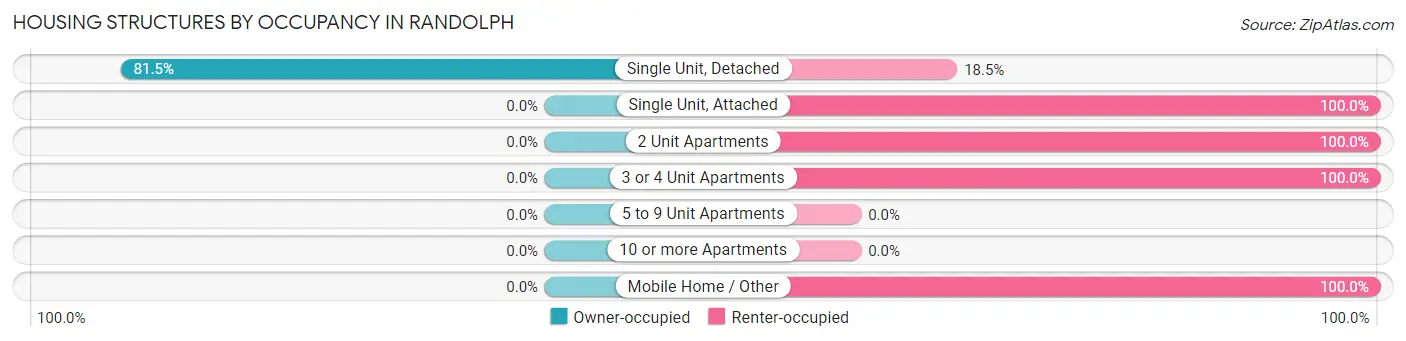
| Structure Type | Owner-occupied | Renter-occupied |
| Single Unit, Detached | 119 (81.5%) | 27 (18.5%) |
| Single Unit, Attached | 0 (0.0%) | 4 (100.0%) |
| 2 Unit Apartments | 0 (0.0%) | 1 (100.0%) |
| 3 or 4 Unit Apartments | 0 (0.0%) | 6 (100.0%) |
| 5 to 9 Unit Apartments | 0 (0.0%) | 0 (0.0%) |
| 10 or more Apartments | 0 (0.0%) | 0 (0.0%) |
| Mobile Home / Other | 0 (0.0%) | 22 (100.0%) |
| Total | 119 (66.5%) | 60 (33.5%) |
Housing Structures by Number of Rooms in Randolph
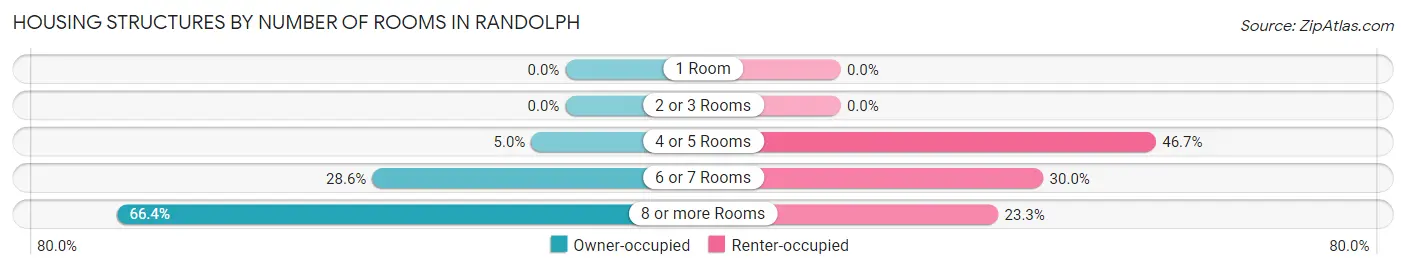
| Number of Rooms | Owner-occupied | Renter-occupied |
| 1 Room | 0 (0.0%) | 0 (0.0%) |
| 2 or 3 Rooms | 0 (0.0%) | 0 (0.0%) |
| 4 or 5 Rooms | 6 (5.0%) | 28 (46.7%) |
| 6 or 7 Rooms | 34 (28.6%) | 18 (30.0%) |
| 8 or more Rooms | 79 (66.4%) | 14 (23.3%) |
| Total | 119 (100.0%) | 60 (100.0%) |
Housing Structure by Heating Type in Randolph
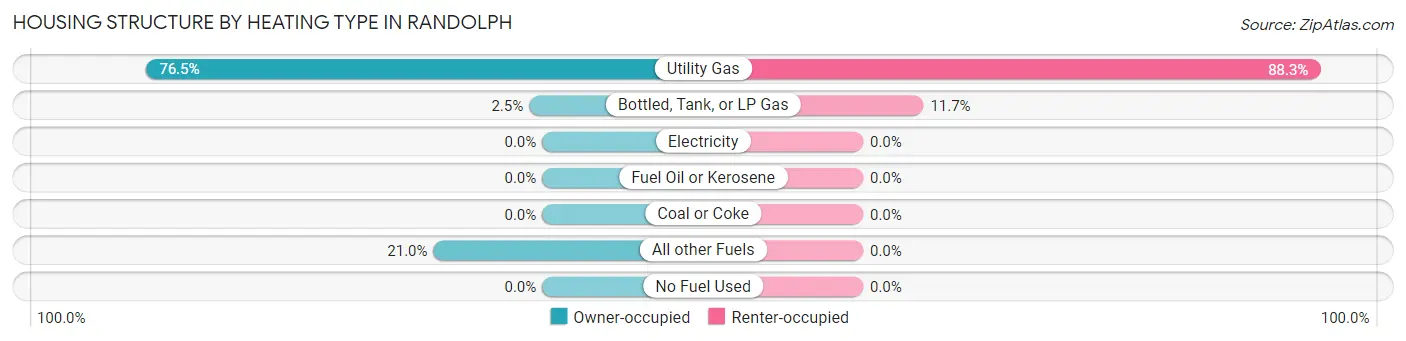
| Heating Type | Owner-occupied | Renter-occupied |
| Utility Gas | 91 (76.5%) | 53 (88.3%) |
| Bottled, Tank, or LP Gas | 3 (2.5%) | 7 (11.7%) |
| Electricity | 0 (0.0%) | 0 (0.0%) |
| Fuel Oil or Kerosene | 0 (0.0%) | 0 (0.0%) |
| Coal or Coke | 0 (0.0%) | 0 (0.0%) |
| All other Fuels | 25 (21.0%) | 0 (0.0%) |
| No Fuel Used | 0 (0.0%) | 0 (0.0%) |
| Total | 119 (100.0%) | 60 (100.0%) |
Household Vehicle Usage in Randolph
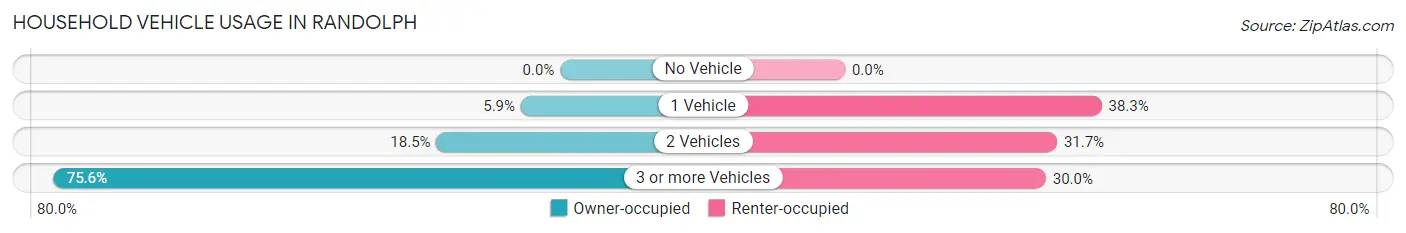
| Vehicles per Household | Owner-occupied | Renter-occupied |
| No Vehicle | 0 (0.0%) | 0 (0.0%) |
| 1 Vehicle | 7 (5.9%) | 23 (38.3%) |
| 2 Vehicles | 22 (18.5%) | 19 (31.7%) |
| 3 or more Vehicles | 90 (75.6%) | 18 (30.0%) |
| Total | 119 (100.0%) | 60 (100.0%) |
Real Estate & Mortgages in Randolph
Real Estate and Mortgage Overview in Randolph
| Characteristic | Without Mortgage | With Mortgage |
| Housing Units | 44 | 75 |
| Median Property Value | $147,600 | $225,000 |
| Median Household Income | $93,750 | $3 |
| Monthly Housing Costs | $325 | $3 |
| Real Estate Taxes | $931 | $3 |
Property Value by Mortgage Status in Randolph
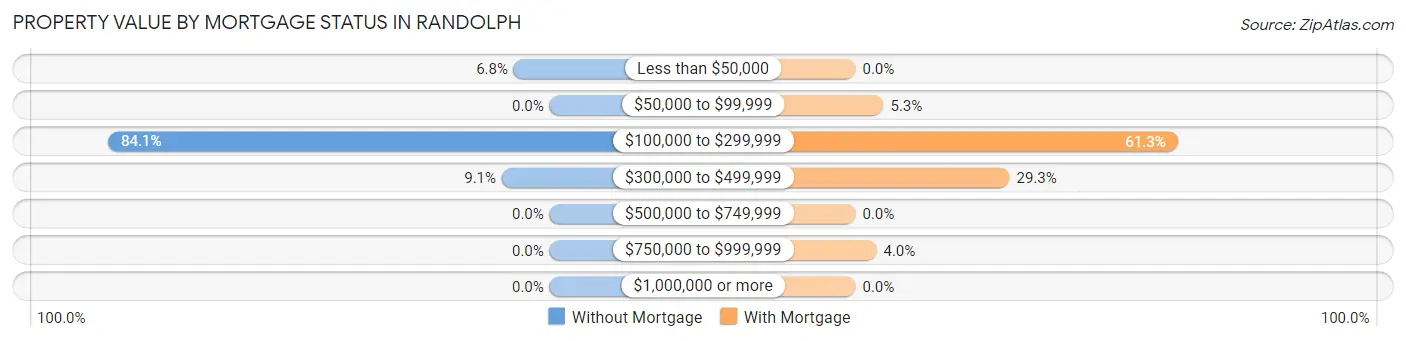
| Property Value | Without Mortgage | With Mortgage |
| Less than $50,000 | 3 (6.8%) | 0 (0.0%) |
| $50,000 to $99,999 | 0 (0.0%) | 4 (5.3%) |
| $100,000 to $299,999 | 37 (84.1%) | 46 (61.3%) |
| $300,000 to $499,999 | 4 (9.1%) | 22 (29.3%) |
| $500,000 to $749,999 | 0 (0.0%) | 0 (0.0%) |
| $750,000 to $999,999 | 0 (0.0%) | 3 (4.0%) |
| $1,000,000 or more | 0 (0.0%) | 0 (0.0%) |
| Total | 44 (100.0%) | 75 (100.0%) |
Household Income by Mortgage Status in Randolph
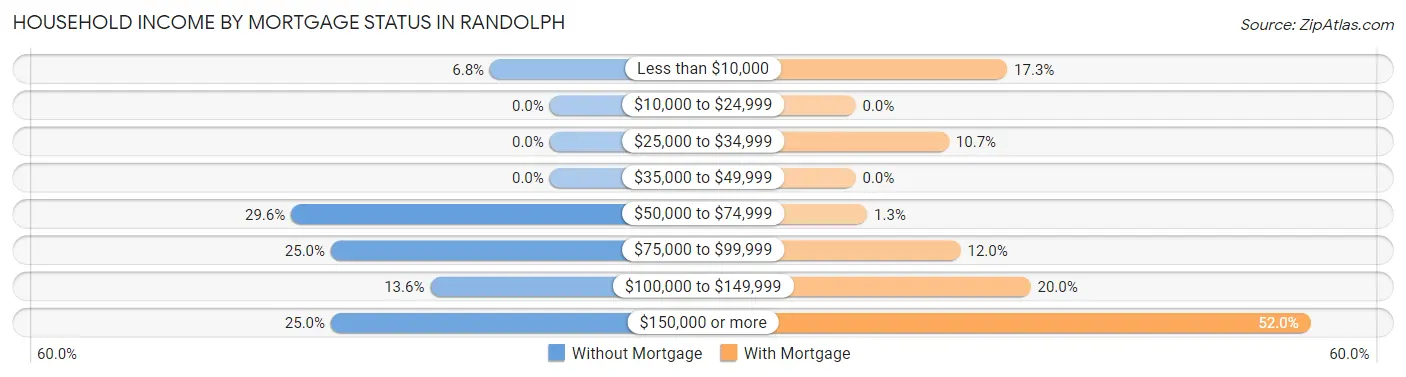
| Household Income | Without Mortgage | With Mortgage |
| Less than $10,000 | 3 (6.8%) | 13 (17.3%) |
| $10,000 to $24,999 | 0 (0.0%) | 0 (0.0%) |
| $25,000 to $34,999 | 0 (0.0%) | 8 (10.7%) |
| $35,000 to $49,999 | 0 (0.0%) | 0 (0.0%) |
| $50,000 to $74,999 | 13 (29.5%) | 1 (1.3%) |
| $75,000 to $99,999 | 11 (25.0%) | 9 (12.0%) |
| $100,000 to $149,999 | 6 (13.6%) | 15 (20.0%) |
| $150,000 or more | 11 (25.0%) | 39 (52.0%) |
| Total | 44 (100.0%) | 75 (100.0%) |
Property Value to Household Income Ratio in Randolph
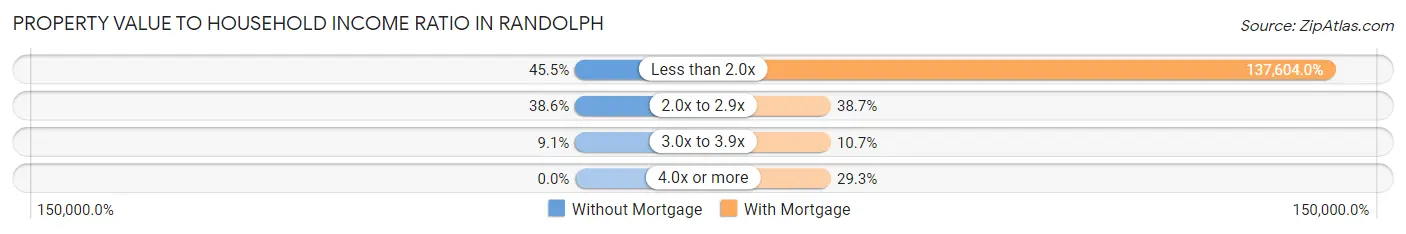
| Value-to-Income Ratio | Without Mortgage | With Mortgage |
| Less than 2.0x | 20 (45.5%) | 103,203 (137,604.0%) |
| 2.0x to 2.9x | 17 (38.6%) | 29 (38.7%) |
| 3.0x to 3.9x | 4 (9.1%) | 8 (10.7%) |
| 4.0x or more | 0 (0.0%) | 22 (29.3%) |
| Total | 44 (100.0%) | 75 (100.0%) |
Real Estate Taxes by Mortgage Status in Randolph
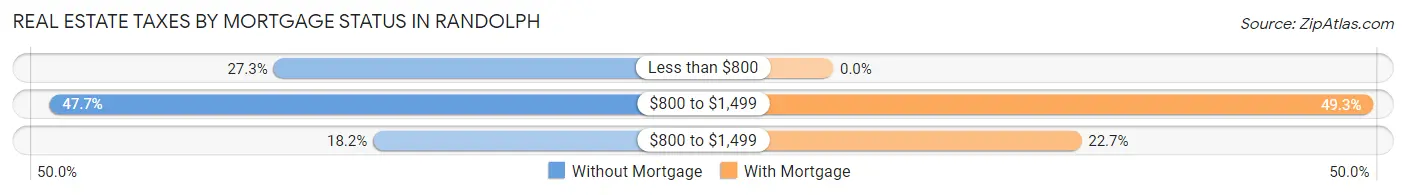
| Property Taxes | Without Mortgage | With Mortgage |
| Less than $800 | 12 (27.3%) | 0 (0.0%) |
| $800 to $1,499 | 21 (47.7%) | 37 (49.3%) |
| $800 to $1,499 | 8 (18.2%) | 17 (22.7%) |
| Total | 44 (100.0%) | 75 (100.0%) |
Health & Disability in Randolph
Health Insurance Coverage by Age in Randolph
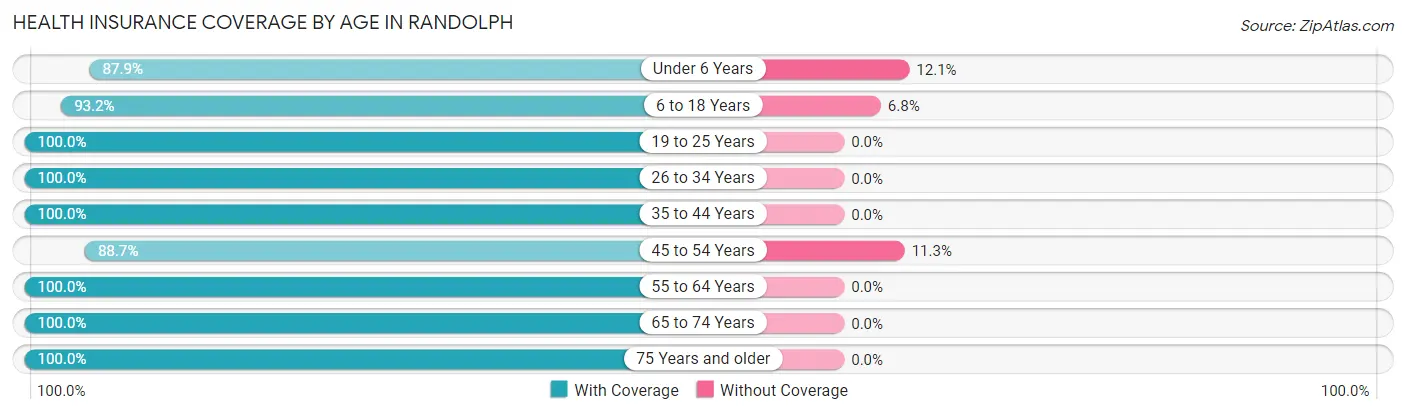
| Age Bracket | With Coverage | Without Coverage |
| Under 6 Years | 123 (87.9%) | 17 (12.1%) |
| 6 to 18 Years | 232 (93.2%) | 17 (6.8%) |
| 19 to 25 Years | 86 (100.0%) | 0 (0.0%) |
| 26 to 34 Years | 142 (100.0%) | 0 (0.0%) |
| 35 to 44 Years | 93 (100.0%) | 0 (0.0%) |
| 45 to 54 Years | 63 (88.7%) | 8 (11.3%) |
| 55 to 64 Years | 64 (100.0%) | 0 (0.0%) |
| 65 to 74 Years | 80 (100.0%) | 0 (0.0%) |
| 75 Years and older | 33 (100.0%) | 0 (0.0%) |
| Total | 916 (95.6%) | 42 (4.4%) |
Health Insurance Coverage by Citizenship Status in Randolph
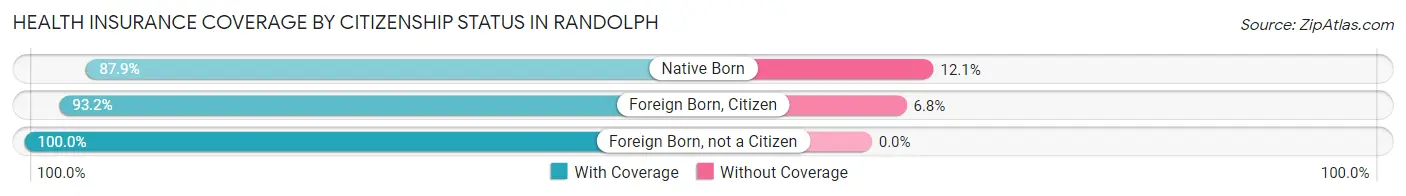
| Citizenship Status | With Coverage | Without Coverage |
| Native Born | 123 (87.9%) | 17 (12.1%) |
| Foreign Born, Citizen | 232 (93.2%) | 17 (6.8%) |
| Foreign Born, not a Citizen | 86 (100.0%) | 0 (0.0%) |
Health Insurance Coverage by Household Income in Randolph
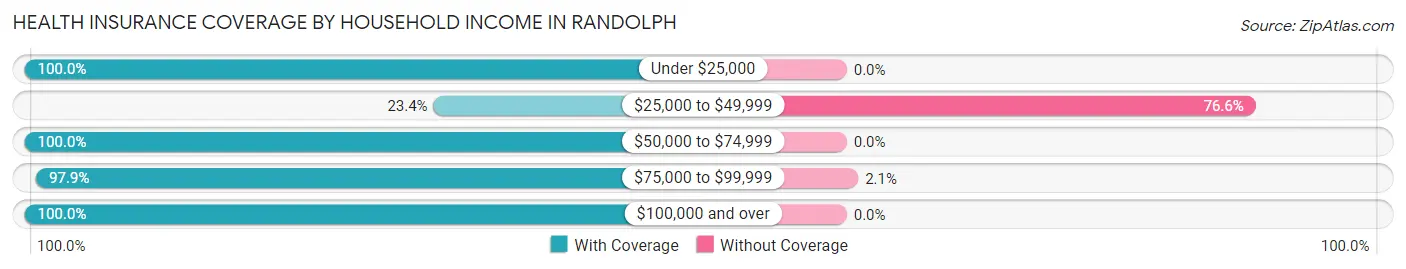
| Household Income | With Coverage | Without Coverage |
| Under $25,000 | 73 (100.0%) | 0 (0.0%) |
| $25,000 to $49,999 | 11 (23.4%) | 36 (76.6%) |
| $50,000 to $74,999 | 124 (100.0%) | 0 (0.0%) |
| $75,000 to $99,999 | 274 (97.9%) | 6 (2.1%) |
| $100,000 and over | 434 (100.0%) | 0 (0.0%) |
Public vs Private Health Insurance Coverage by Age in Randolph
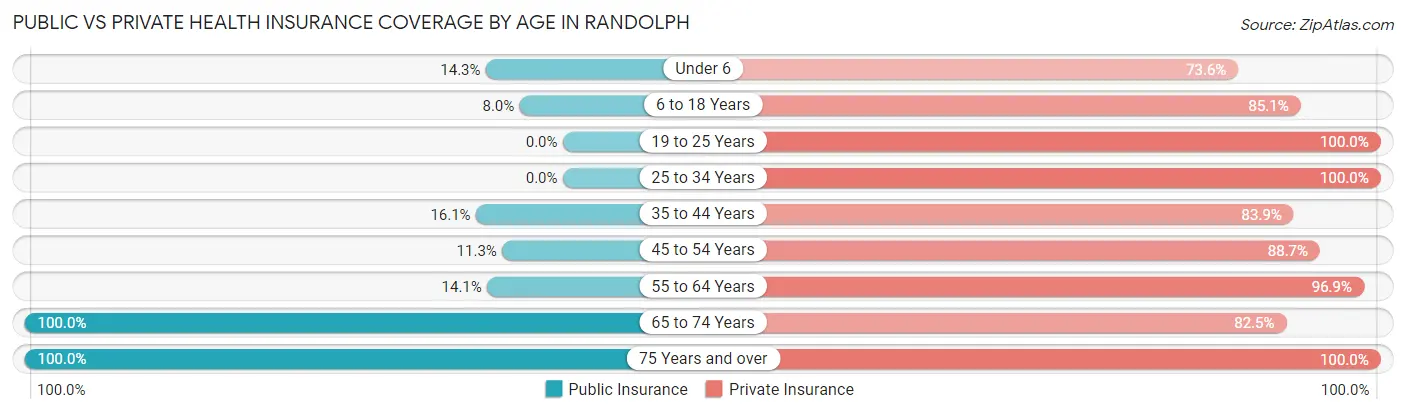
| Age Bracket | Public Insurance | Private Insurance |
| Under 6 | 20 (14.3%) | 103 (73.6%) |
| 6 to 18 Years | 20 (8.0%) | 212 (85.1%) |
| 19 to 25 Years | 0 (0.0%) | 86 (100.0%) |
| 25 to 34 Years | 0 (0.0%) | 142 (100.0%) |
| 35 to 44 Years | 15 (16.1%) | 78 (83.9%) |
| 45 to 54 Years | 8 (11.3%) | 63 (88.7%) |
| 55 to 64 Years | 9 (14.1%) | 62 (96.9%) |
| 65 to 74 Years | 80 (100.0%) | 66 (82.5%) |
| 75 Years and over | 33 (100.0%) | 33 (100.0%) |
| Total | 185 (19.3%) | 845 (88.2%) |
Disability Status by Sex by Age in Randolph
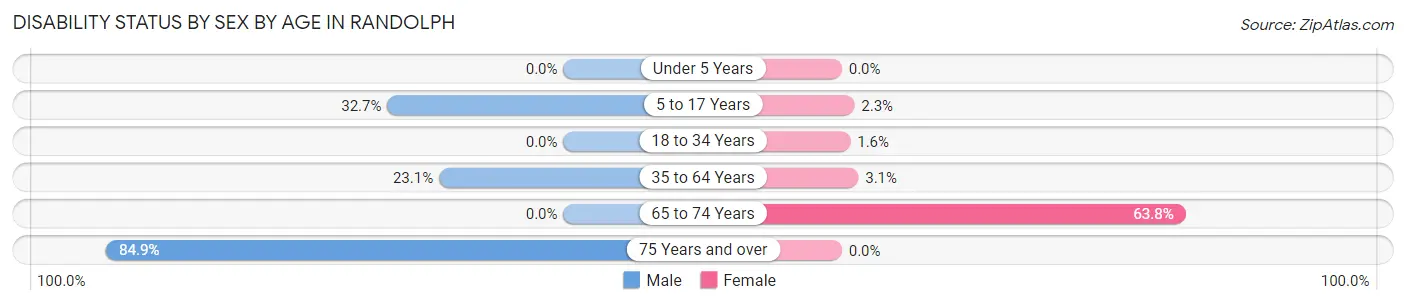
| Age Bracket | Male | Female |
| Under 5 Years | 0 (0.0%) | 0 (0.0%) |
| 5 to 17 Years | 50 (32.7%) | 2 (2.3%) |
| 18 to 34 Years | 0 (0.0%) | 3 (1.6%) |
| 35 to 64 Years | 30 (23.1%) | 3 (3.1%) |
| 65 to 74 Years | 0 (0.0%) | 37 (63.8%) |
| 75 Years and over | 28 (84.9%) | 0 (0.0%) |
Disability Class by Sex by Age in Randolph
Disability Class: Hearing Difficulty
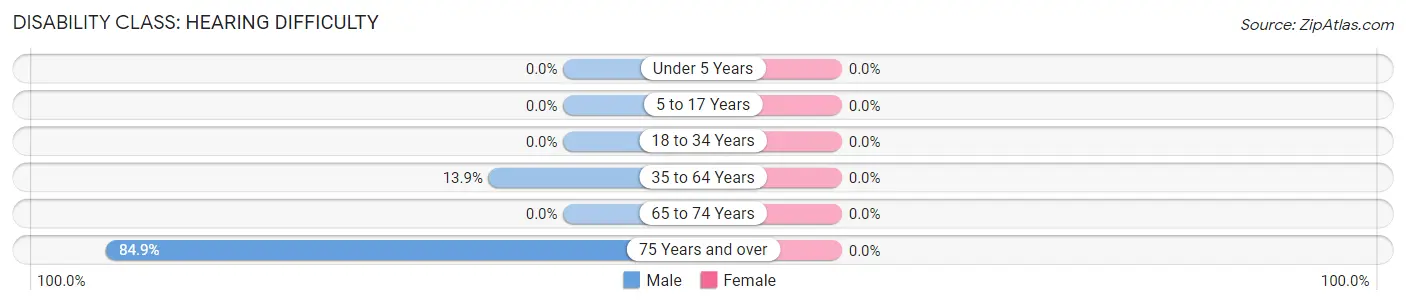
| Age Bracket | Male | Female |
| Under 5 Years | 0 (0.0%) | 0 (0.0%) |
| 5 to 17 Years | 0 (0.0%) | 0 (0.0%) |
| 18 to 34 Years | 0 (0.0%) | 0 (0.0%) |
| 35 to 64 Years | 18 (13.9%) | 0 (0.0%) |
| 65 to 74 Years | 0 (0.0%) | 0 (0.0%) |
| 75 Years and over | 28 (84.9%) | 0 (0.0%) |
Disability Class: Vision Difficulty
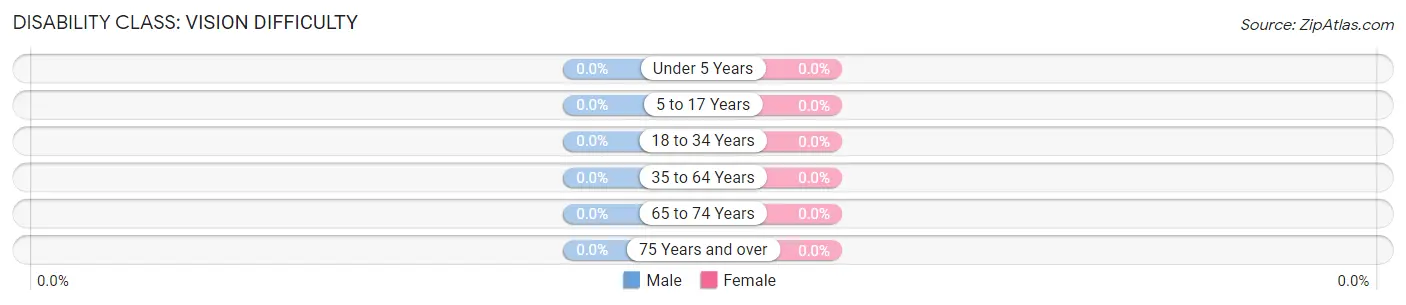
| Age Bracket | Male | Female |
| Under 5 Years | 0 (0.0%) | 0 (0.0%) |
| 5 to 17 Years | 0 (0.0%) | 0 (0.0%) |
| 18 to 34 Years | 0 (0.0%) | 0 (0.0%) |
| 35 to 64 Years | 0 (0.0%) | 0 (0.0%) |
| 65 to 74 Years | 0 (0.0%) | 0 (0.0%) |
| 75 Years and over | 0 (0.0%) | 0 (0.0%) |
Disability Class: Cognitive Difficulty
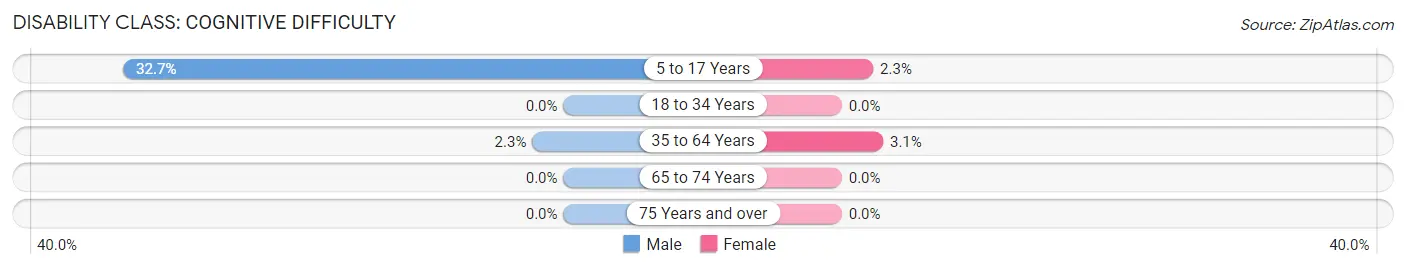
| Age Bracket | Male | Female |
| 5 to 17 Years | 50 (32.7%) | 2 (2.3%) |
| 18 to 34 Years | 0 (0.0%) | 0 (0.0%) |
| 35 to 64 Years | 3 (2.3%) | 3 (3.1%) |
| 65 to 74 Years | 0 (0.0%) | 0 (0.0%) |
| 75 Years and over | 0 (0.0%) | 0 (0.0%) |
Disability Class: Ambulatory Difficulty
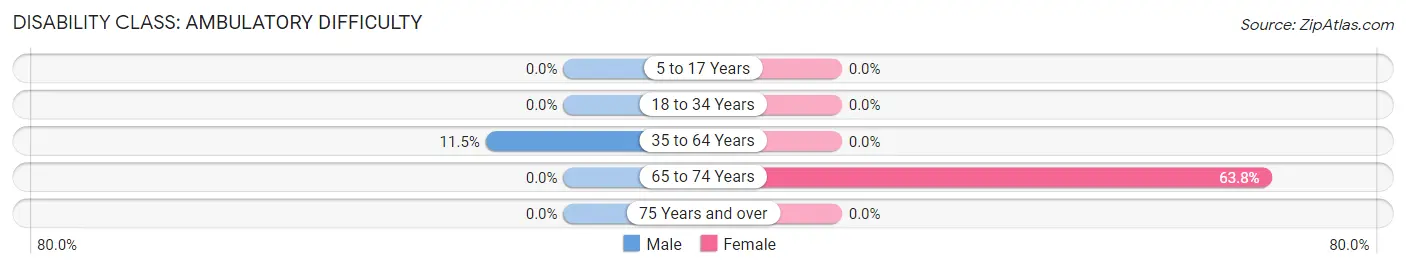
| Age Bracket | Male | Female |
| 5 to 17 Years | 0 (0.0%) | 0 (0.0%) |
| 18 to 34 Years | 0 (0.0%) | 0 (0.0%) |
| 35 to 64 Years | 15 (11.5%) | 0 (0.0%) |
| 65 to 74 Years | 0 (0.0%) | 37 (63.8%) |
| 75 Years and over | 0 (0.0%) | 0 (0.0%) |
Disability Class: Self-Care Difficulty
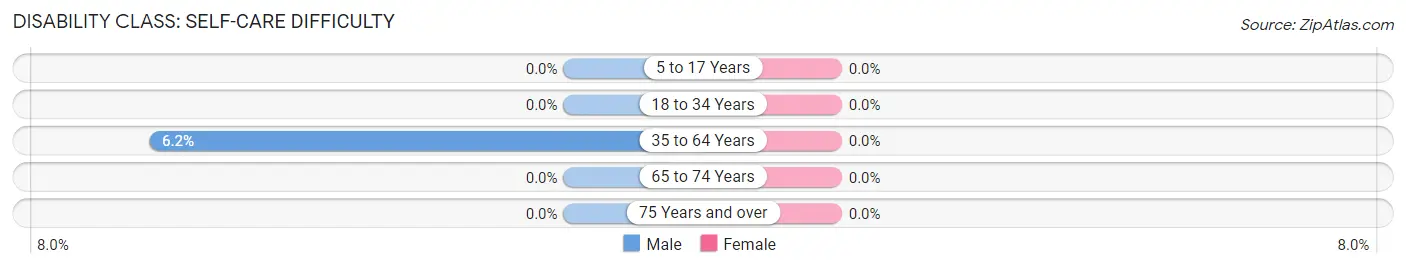
| Age Bracket | Male | Female |
| 5 to 17 Years | 0 (0.0%) | 0 (0.0%) |
| 18 to 34 Years | 0 (0.0%) | 0 (0.0%) |
| 35 to 64 Years | 8 (6.1%) | 0 (0.0%) |
| 65 to 74 Years | 0 (0.0%) | 0 (0.0%) |
| 75 Years and over | 0 (0.0%) | 0 (0.0%) |
Technology Access in Randolph
Computing Device Access in Randolph
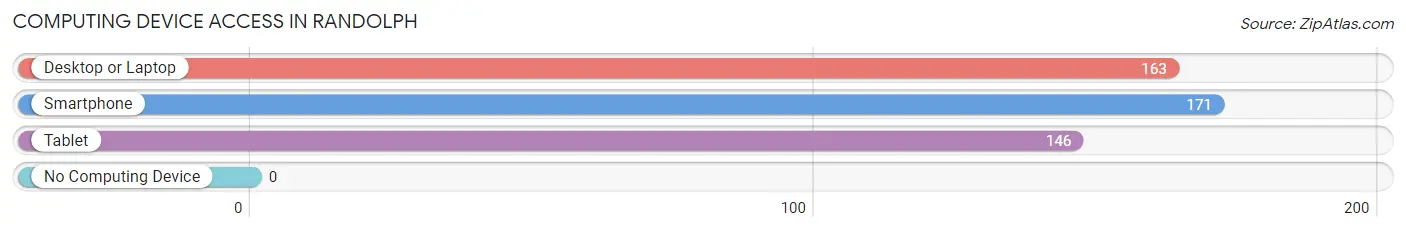
| Device Type | # Households | % Households |
| Desktop or Laptop | 163 | 91.1% |
| Smartphone | 171 | 95.5% |
| Tablet | 146 | 81.6% |
| No Computing Device | 0 | 0.0% |
| Total | 179 | 100.0% |
Internet Access in Randolph
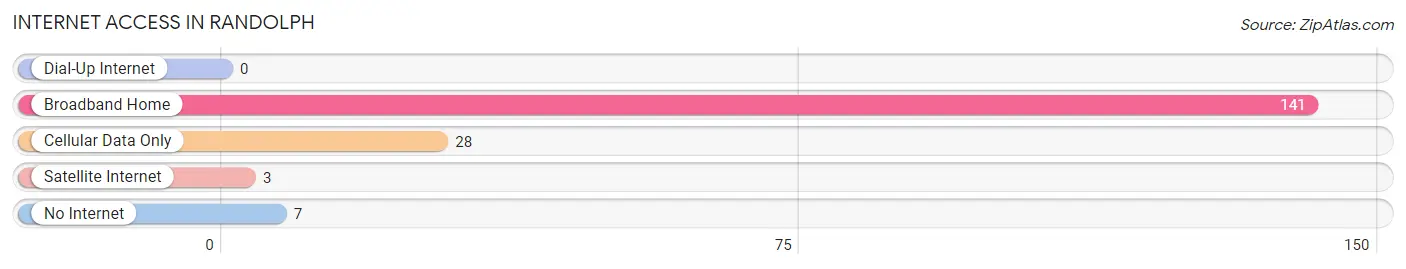
| Internet Type | # Households | % Households |
| Dial-Up Internet | 0 | 0.0% |
| Broadband Home | 141 | 78.8% |
| Cellular Data Only | 28 | 15.6% |
| Satellite Internet | 3 | 1.7% |
| No Internet | 7 | 3.9% |
| Total | 179 | 100.0% |
Randolph Summary
Randolph, Utah is a small town located in the northern part of the state, in Rich County. It is situated in the Bear River Valley, near the Idaho border. The town was founded in 1864 by a group of Mormon settlers, and was named after the town's first postmaster, Randolph Stewart. The town has a population of approximately 1,000 people, and is the county seat of Rich County.
Geography
Randolph is located in the Bear River Valley, at an elevation of 5,890 feet. The town is surrounded by mountains, including the Bear River Range to the east, the Wellsville Mountains to the south, and the Wasatch Range to the west. The Bear River flows through the town, and is a popular destination for fishing and other recreational activities. The town is located approximately 80 miles north of Salt Lake City, and is accessible by US Highway 89.
Economy
The economy of Randolph is largely based on agriculture and tourism. The town is home to several farms, which produce a variety of crops, including hay, wheat, and potatoes. The town is also home to several tourist attractions, including the Bear River State Park, which offers camping, fishing, and other outdoor activities. Additionally, the town is home to several small businesses, including restaurants, shops, and lodging.
Demographics
As of the 2010 census, the population of Randolph was 1,000, with a median age of 36.7 years. The racial makeup of the town was 97.2% White, 0.3% African American, 0.3% Native American, 0.3% Asian, 0.3% from other races, and 1.7% from two or more races. The median household income was $41,250, and the per capita income was $17,945.
Conclusion
Randolph, Utah is a small town located in the northern part of the state, in Rich County. It was founded in 1864 by a group of Mormon settlers, and is the county seat of Rich County. The town has a population of approximately 1,000 people, and is surrounded by mountains and the Bear River. The economy of Randolph is largely based on agriculture and tourism, and the town is home to several farms, tourist attractions, and small businesses. The population of Randolph is predominantly White, with a median age of 36.7 years and a median household income of $41,250.
Common Questions
What is Per Capita Income in Randolph?
Per Capita income in Randolph is $21,570.
What is the Median Family Income in Randolph?
Median Family Income in Randolph is $95,000.
What is the Median Household income in Randolph?
Median Household Income in Randolph is $90,417.
What is Income or Wage Gap in Randolph?
Income or Wage Gap in Randolph is 44.2%.
Women in Randolph earn 55.8 cents for every dollar earned by a man.
What is Inequality or Gini Index in Randolph?
Inequality or Gini Index in Randolph is 0.33.
What is the Total Population of Randolph?
Total Population of Randolph is 966.
What is the Total Male Population of Randolph?
Total Male Population of Randolph is 470.
What is the Total Female Population of Randolph?
Total Female Population of Randolph is 496.
What is the Ratio of Males per 100 Females in Randolph?
There are 94.76 Males per 100 Females in Randolph.
What is the Ratio of Females per 100 Males in Randolph?
There are 105.53 Females per 100 Males in Randolph.
What is the Median Population Age in Randolph?
Median Population Age in Randolph is 27.1 Years.
What is the Average Family Size in Randolph
Average Family Size in Randolph is 5.7 People.
What is the Average Household Size in Randolph
Average Household Size in Randolph is 5.3 People.
How Large is the Labor Force in Randolph?
There are 288 People in the Labor Forcein in Randolph.
What is the Percentage of People in the Labor Force in Randolph?
45.6% of People are in the Labor Force in Randolph.