Cities with the Highest Percentage of Immigrants from Oceania in Utah
RELATED REPORTS & OPTIONS
Oceania
Utah
Compare Cities
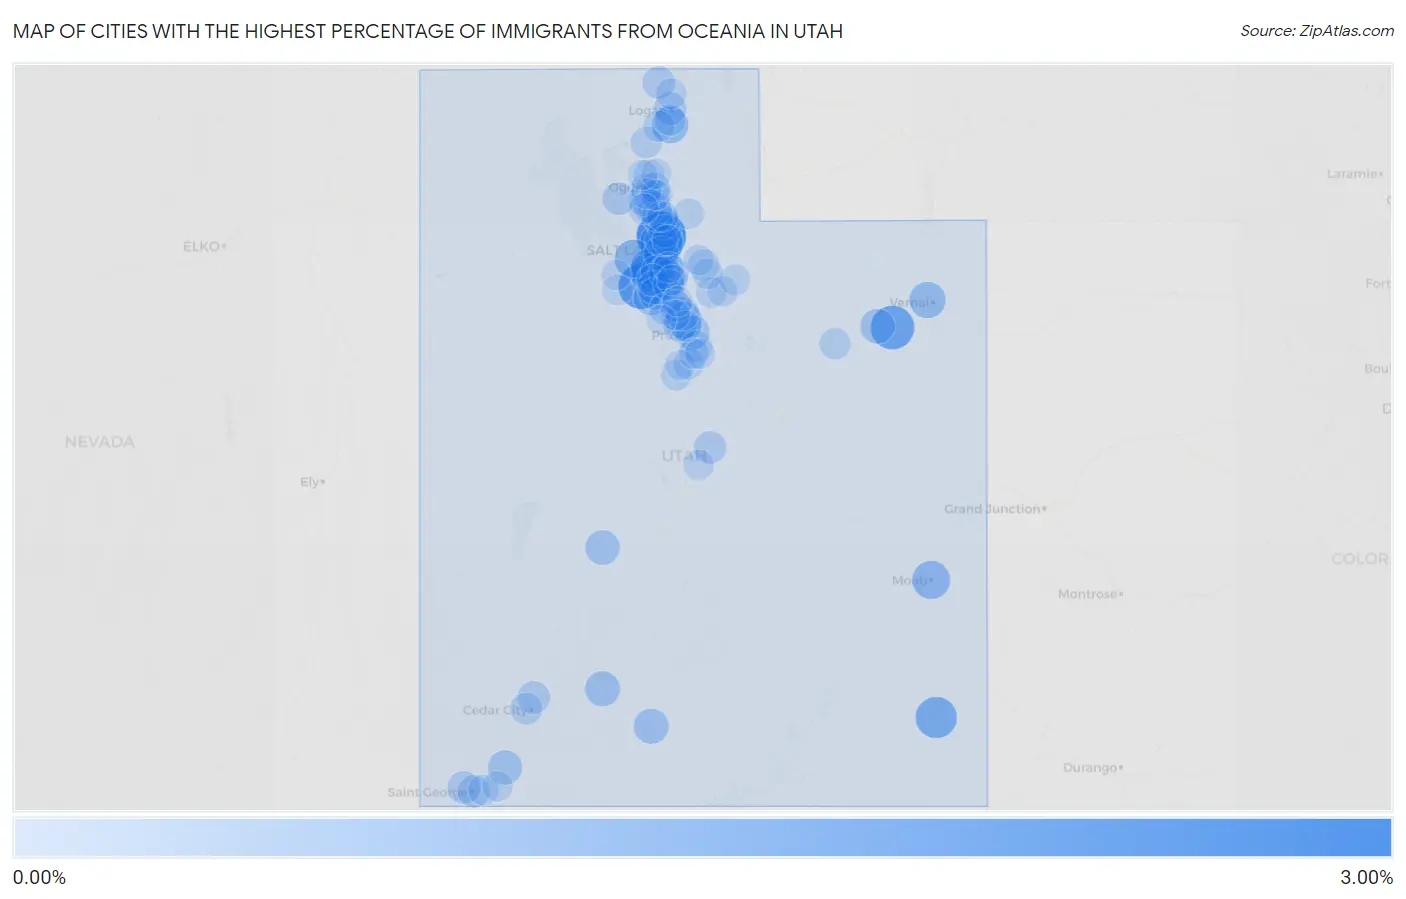
Map of Cities with the Highest Percentage of Immigrants from Oceania in Utah
0.00%
3.00%
Cities with the Highest Percentage of Immigrants from Oceania in Utah
| City | Oceania | vs State | vs National | |
| 1. | West Bountiful | 2.76% | 0.36%(+2.40)#-1 | 0.089%(+2.67)#0 |
| 2. | East Basin | 2.41% | 0.36%(+2.05)#0 | 0.089%(+2.32)#1 |
| 3. | Copperton | 2.16% | 0.36%(+1.80)#1 | 0.089%(+2.07)#2 |
| 4. | Fort Duchesne | 1.91% | 0.36%(+1.55)#2 | 0.089%(+1.82)#3 |
| 5. | North Salt Lake | 1.85% | 0.36%(+1.49)#3 | 0.089%(+1.76)#4 |
| 6. | Blanding | 1.58% | 0.36%(+1.22)#4 | 0.089%(+1.50)#5 |
| 7. | West Valley City | 1.58% | 0.36%(+1.21)#5 | 0.089%(+1.49)#6 |
| 8. | Kearns | 1.34% | 0.36%(+0.981)#6 | 0.089%(+1.25)#7 |
| 9. | Midvale | 1.23% | 0.36%(+0.869)#7 | 0.089%(+1.14)#8 |
| 10. | Magna | 1.16% | 0.36%(+0.797)#8 | 0.089%(+1.07)#9 |
| 11. | Moab | 1.11% | 0.36%(+0.746)#9 | 0.089%(+1.02)#10 |
| 12. | Hyrum | 0.92% | 0.36%(+0.558)#10 | 0.089%(+0.831)#11 |
| 13. | Lindon | 0.91% | 0.36%(+0.545)#11 | 0.089%(+0.817)#12 |
| 14. | Maeser | 0.87% | 0.36%(+0.511)#12 | 0.089%(+0.784)#13 |
| 15. | Herriman | 0.76% | 0.36%(+0.396)#13 | 0.089%(+0.669)#14 |
| 16. | Salt Lake City | 0.71% | 0.36%(+0.347)#14 | 0.089%(+0.619)#15 |
| 17. | Panguitch | 0.71% | 0.36%(+0.344)#15 | 0.089%(+0.616)#16 |
| 18. | Henrieville | 0.70% | 0.36%(+0.338)#16 | 0.089%(+0.611)#17 |
| 19. | Roosevelt | 0.65% | 0.36%(+0.292)#17 | 0.089%(+0.565)#18 |
| 20. | Kanosh | 0.64% | 0.36%(+0.283)#18 | 0.089%(+0.555)#19 |
| 21. | Taylorsville | 0.64% | 0.36%(+0.278)#19 | 0.089%(+0.551)#20 |
| 22. | Provo | 0.60% | 0.36%(+0.240)#20 | 0.089%(+0.513)#21 |
| 23. | Toquerville | 0.59% | 0.36%(+0.229)#21 | 0.089%(+0.501)#22 |
| 24. | Farmington | 0.54% | 0.36%(+0.182)#22 | 0.089%(+0.455)#23 |
| 25. | Layton | 0.47% | 0.36%(+0.113)#23 | 0.089%(+0.386)#24 |
| 26. | Vineyard | 0.46% | 0.36%(+0.097)#24 | 0.089%(+0.369)#25 |
| 27. | Pleasant Grove | 0.43% | 0.36%(+0.071)#25 | 0.089%(+0.344)#26 |
| 28. | Draper | 0.42% | 0.36%(+0.057)#26 | 0.089%(+0.330)#27 |
| 29. | South Jordan | 0.42% | 0.36%(+0.057)#27 | 0.089%(+0.330)#28 |
| 30. | Holladay | 0.39% | 0.36%(+0.028)#28 | 0.089%(+0.301)#29 |
| 31. | Santa Clara | 0.38% | 0.36%(+0.019)#29 | 0.089%(+0.292)#30 |
| 32. | Logan | 0.38% | 0.36%(+0.014)#30 | 0.089%(+0.287)#71 |
| 33. | Hooper | 0.37% | 0.36%(+0.013)#31 | 0.089%(+0.286)#72 |
| 34. | Clearfield | 0.37% | 0.36%(+0.009)#32 | 0.089%(+0.282)#73 |
| 35. | Spring City | 0.36% | 0.36%(-0.000)#33 | 0.089%(+0.272)#74 |
| 36. | Enoch | 0.36% | 0.36%(-0.004)#34 | 0.089%(+0.268)#75 |
| 37. | Trenton | 0.35% | 0.36%(-0.009)#35 | 0.089%(+0.264)#76 |
| 38. | Centerville | 0.35% | 0.36%(-0.009)#36 | 0.089%(+0.264)#77 |
| 39. | Riverton | 0.34% | 0.36%(-0.020)#37 | 0.089%(+0.252)#78 |
| 40. | St George | 0.32% | 0.36%(-0.037)#38 | 0.089%(+0.236)#79 |
| 41. | Murray | 0.32% | 0.36%(-0.038)#39 | 0.089%(+0.235)#80 |
| 42. | Woods Cross | 0.32% | 0.36%(-0.038)#40 | 0.089%(+0.235)#81 |
| 43. | West Jordan | 0.27% | 0.36%(-0.087)#41 | 0.089%(+0.185)#82 |
| 44. | Cedar City | 0.27% | 0.36%(-0.093)#42 | 0.089%(+0.179)#83 |
| 45. | Brigham City | 0.24% | 0.36%(-0.117)#43 | 0.089%(+0.156)#84 |
| 46. | Clinton | 0.23% | 0.36%(-0.131)#44 | 0.089%(+0.142)#85 |
| 47. | Lehi | 0.23% | 0.36%(-0.133)#45 | 0.089%(+0.140)#86 |
| 48. | Snyderville | 0.23% | 0.36%(-0.135)#46 | 0.089%(+0.138)#87 |
| 49. | Duchesne | 0.21% | 0.36%(-0.149)#47 | 0.089%(+0.124)#88 |
| 50. | Springville | 0.20% | 0.36%(-0.157)#48 | 0.089%(+0.116)#89 |
| 51. | Kaysville | 0.20% | 0.36%(-0.166)#49 | 0.089%(+0.107)#90 |
| 52. | Santaquin | 0.17% | 0.36%(-0.189)#50 | 0.089%(+0.084)#91 |
| 53. | Wellsville | 0.17% | 0.36%(-0.190)#51 | 0.089%(+0.083)#92 |
| 54. | Sandy | 0.17% | 0.36%(-0.190)#52 | 0.089%(+0.083)#93 |
| 55. | Highland | 0.17% | 0.36%(-0.190)#53 | 0.089%(+0.083)#94 |
| 56. | Salem | 0.17% | 0.36%(-0.192)#54 | 0.089%(+0.080)#95 |
| 57. | Farr West | 0.15% | 0.36%(-0.206)#55 | 0.089%(+0.066)#96 |
| 58. | Washington | 0.15% | 0.36%(-0.210)#56 | 0.089%(+0.062)#97 |
| 59. | Midway | 0.15% | 0.36%(-0.212)#57 | 0.089%(+0.061)#98 |
| 60. | Nibley | 0.15% | 0.36%(-0.212)#58 | 0.089%(+0.061)#99 |
| 61. | West Haven | 0.14% | 0.36%(-0.220)#59 | 0.089%(+0.053)#100 |
| 62. | Orem | 0.14% | 0.36%(-0.224)#60 | 0.089%(+0.048)#101 |
| 63. | Smithfield | 0.13% | 0.36%(-0.230)#61 | 0.089%(+0.043)#102 |
| 64. | Francis | 0.13% | 0.36%(-0.234)#62 | 0.089%(+0.039)#103 |
| 65. | Morgan | 0.12% | 0.36%(-0.242)#63 | 0.089%(+0.031)#104 |
| 66. | Park City | 0.12% | 0.36%(-0.242)#64 | 0.089%(+0.031)#105 |
| 67. | Tooele | 0.11% | 0.36%(-0.251)#65 | 0.089%(+0.022)#106 |
| 68. | South Ogden | 0.10% | 0.36%(-0.258)#66 | 0.089%(+0.014)#107 |
| 69. | Millcreek | 0.10% | 0.36%(-0.259)#67 | 0.089%(+0.014)#108 |
| 70. | Fruit Heights | 0.100% | 0.36%(-0.262)#68 | 0.089%(+0.011)#109 |
| 71. | Ogden | 0.088% | 0.36%(-0.274)#69 | 0.089%(-0.001)#110 |
| 72. | Cottonwood Heights | 0.084% | 0.36%(-0.277)#70 | 0.089%(-0.004)#111 |
| 73. | Heber | 0.083% | 0.36%(-0.279)#71 | 0.089%(-0.006)#112 |
| 74. | Roy | 0.074% | 0.36%(-0.287)#72 | 0.089%(-0.014)#113 |
| 75. | Hurricane | 0.073% | 0.36%(-0.289)#73 | 0.089%(-0.016)#114 |
| 76. | Ephraim | 0.070% | 0.36%(-0.292)#74 | 0.089%(-0.019)#115 |
| 77. | Summit Park | 0.069% | 0.36%(-0.292)#75 | 0.089%(-0.020)#116 |
| 78. | Washington Terrace | 0.065% | 0.36%(-0.296)#76 | 0.089%(-0.024)#117 |
| 79. | Syracuse | 0.058% | 0.36%(-0.303)#77 | 0.089%(-0.031)#118 |
| 80. | North Ogden | 0.057% | 0.36%(-0.304)#78 | 0.089%(-0.032)#119 |
| 81. | Alpine | 0.049% | 0.36%(-0.313)#79 | 0.089%(-0.040)#120 |
| 82. | Stansbury Park | 0.048% | 0.36%(-0.314)#80 | 0.089%(-0.041)#121 |
| 83. | Payson | 0.042% | 0.36%(-0.320)#81 | 0.089%(-0.047)#122 |
| 84. | Plain City | 0.038% | 0.36%(-0.323)#82 | 0.089%(-0.051)#123 |
| 85. | Spanish Fork | 0.037% | 0.36%(-0.324)#83 | 0.089%(-0.051)#124 |
| 86. | American Fork | 0.035% | 0.36%(-0.326)#84 | 0.089%(-0.053)#125 |
| 87. | Mapleton | 0.034% | 0.36%(-0.327)#85 | 0.089%(-0.055)#126 |
| 88. | Bountiful | 0.026% | 0.36%(-0.335)#86 | 0.089%(-0.062)#127 |
| 89. | Saratoga Springs | 0.017% | 0.36%(-0.344)#87 | 0.089%(-0.071)#128 |
Common Questions
What are the Top 10 Cities with the Highest Percentage of Immigrants from Oceania in Utah?
Top 10 Cities with the Highest Percentage of Immigrants from Oceania in Utah are:
#1
2.76%
#2
2.16%
#3
1.91%
#4
1.85%
#5
1.58%
#6
1.58%
#7
1.34%
#8
1.23%
#9
1.16%
#10
1.11%
What city has the Highest Percentage of Immigrants from Oceania in Utah?
West Bountiful has the Highest Percentage of Immigrants from Oceania in Utah with 2.76%.
What is the Percentage of Immigrants from Oceania in the State of Utah?
Percentage of Immigrants from Oceania in Utah is 0.36%.
What is the Percentage of Immigrants from Oceania in the United States?
Percentage of Immigrants from Oceania in the United States is 0.089%.