Salina, UT Map & Demographics
Salina Map
Salina Overview
$29,866
PER CAPITA INCOME
$70,227
AVG FAMILY INCOME
$61,742
AVG HOUSEHOLD INCOME
63.2%
WAGE / INCOME GAP [ % ]
36.8¢/ $1
WAGE / INCOME GAP [ $ ]
0.39
INEQUALITY / GINI INDEX
2,500
TOTAL POPULATION
1,349
MALE POPULATION
1,151
FEMALE POPULATION
117.20
MALES / 100 FEMALES
85.32
FEMALES / 100 MALES
36.8
MEDIAN AGE
3.0
AVG FAMILY SIZE
2.5
AVG HOUSEHOLD SIZE
1,272
LABOR FORCE [ PEOPLE ]
65.3%
PERCENT IN LABOR FORCE
10.0%
UNEMPLOYMENT RATE
Salina Zip Codes
Salina Area Codes
Income in Salina
Income Overview in Salina
Per Capita Income in Salina is $29,866, while median incomes of families and households are $70,227 and $61,742 respectively.
| Characteristic | Number | Measure |
| Per Capita Income | 2,500 | $29,866 |
| Median Family Income | 692 | $70,227 |
| Mean Family Income | 692 | $75,688 |
| Median Household Income | 982 | $61,742 |
| Mean Household Income | 982 | $74,846 |
| Income Deficit | 692 | $0 |
| Wage / Income Gap (%) | 2,500 | 63.25% |
| Wage / Income Gap ($) | 2,500 | 36.75¢ per $1 |
| Gini / Inequality Index | 2,500 | 0.39 |
Earnings by Sex in Salina
Average Earnings in Salina are $38,870, $46,593 for men and $17,125 for women, a difference of 63.2%.
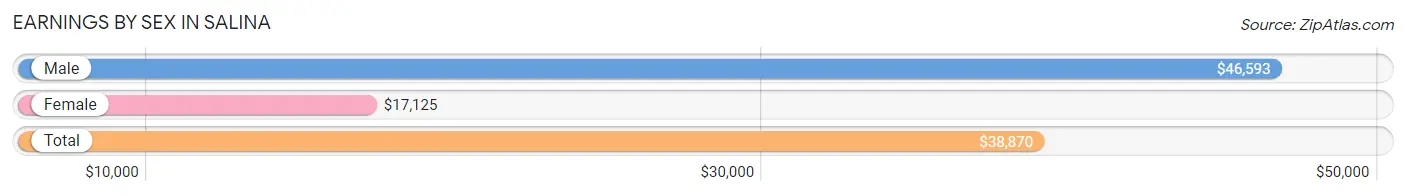
| Sex | Number | Average Earnings |
| Male | 763 (59.0%) | $46,593 |
| Female | 531 (41.0%) | $17,125 |
| Total | 1,294 (100.0%) | $38,870 |
Earnings by Sex by Income Bracket in Salina
The most common earnings brackets in Salina are $100,000+ for men (109 | 14.3%) and $10,000 to $12,499 for women (66 | 12.4%).
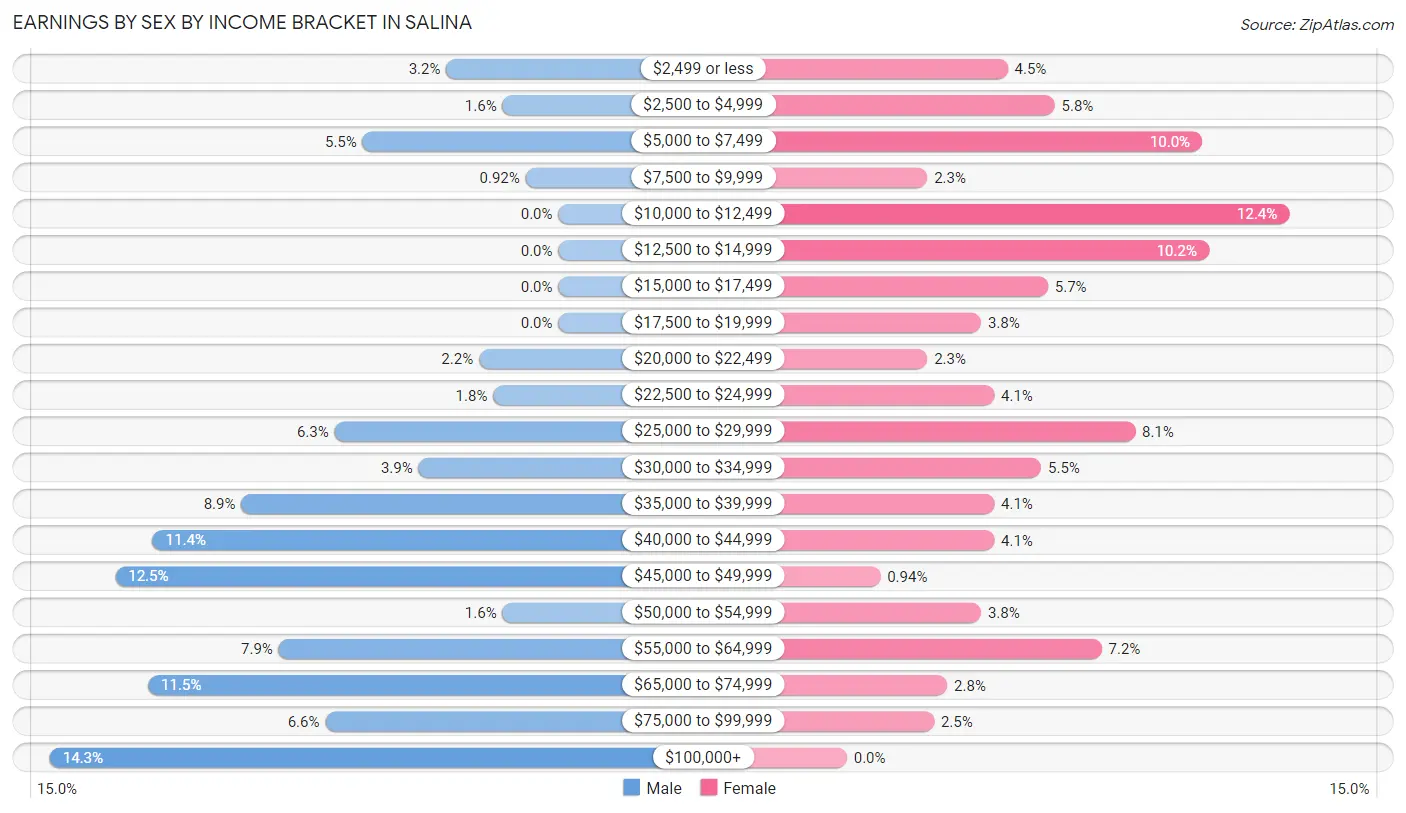
| Income | Male | Female |
| $2,499 or less | 24 (3.2%) | 24 (4.5%) |
| $2,500 to $4,999 | 12 (1.6%) | 31 (5.8%) |
| $5,000 to $7,499 | 42 (5.5%) | 53 (10.0%) |
| $7,500 to $9,999 | 7 (0.9%) | 12 (2.3%) |
| $10,000 to $12,499 | 0 (0.0%) | 66 (12.4%) |
| $12,500 to $14,999 | 0 (0.0%) | 54 (10.2%) |
| $15,000 to $17,499 | 0 (0.0%) | 30 (5.7%) |
| $17,500 to $19,999 | 0 (0.0%) | 20 (3.8%) |
| $20,000 to $22,499 | 17 (2.2%) | 12 (2.3%) |
| $22,500 to $24,999 | 14 (1.8%) | 22 (4.1%) |
| $25,000 to $29,999 | 48 (6.3%) | 43 (8.1%) |
| $30,000 to $34,999 | 30 (3.9%) | 29 (5.5%) |
| $35,000 to $39,999 | 68 (8.9%) | 22 (4.1%) |
| $40,000 to $44,999 | 87 (11.4%) | 22 (4.1%) |
| $45,000 to $49,999 | 95 (12.4%) | 5 (0.9%) |
| $50,000 to $54,999 | 12 (1.6%) | 20 (3.8%) |
| $55,000 to $64,999 | 60 (7.9%) | 38 (7.2%) |
| $65,000 to $74,999 | 88 (11.5%) | 15 (2.8%) |
| $75,000 to $99,999 | 50 (6.6%) | 13 (2.5%) |
| $100,000+ | 109 (14.3%) | 0 (0.0%) |
| Total | 763 (100.0%) | 531 (100.0%) |
Earnings by Sex by Educational Attainment in Salina
Average earnings in Salina are $51,771 for men and $21,563 for women, a difference of 58.4%. Men with an educational attainment of high school diploma enjoy the highest average annual earnings of $56,071, while those with less than high school education earn the least with $34,643. Women with an educational attainment of bachelor's degree earn the most with the average annual earnings of $50,089, while those with college or associate's degree education have the smallest earnings of $12,466.
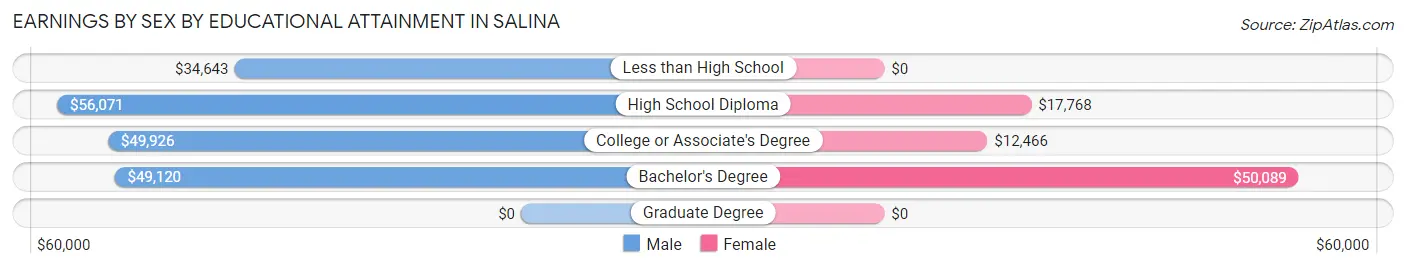
| Educational Attainment | Male Income | Female Income |
| Less than High School | $34,643 | $0 |
| High School Diploma | $56,071 | $17,768 |
| College or Associate's Degree | $49,926 | $12,466 |
| Bachelor's Degree | $49,120 | $50,089 |
| Graduate Degree | - | - |
| Total | $51,771 | $21,563 |
Family Income in Salina
Family Income Brackets in Salina
According to the Salina family income data, there are 199 families falling into the $100,000 to $149,999 income range, which is the most common income bracket and makes up 28.8% of all families.
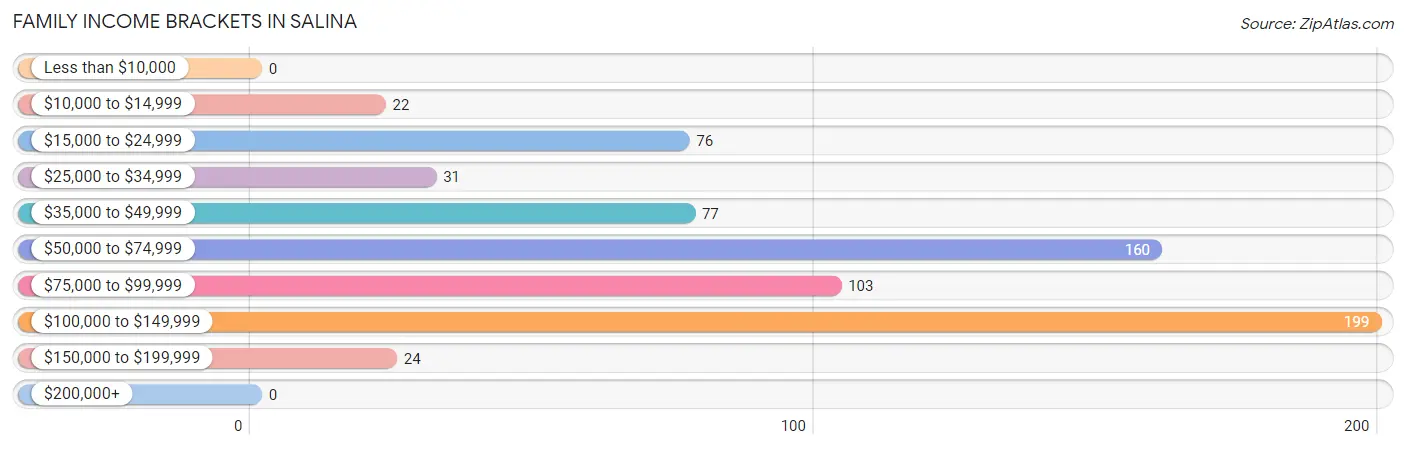
| Income Bracket | # Families | % Families |
| Less than $10,000 | 0 | 0.0% |
| $10,000 to $14,999 | 22 | 3.2% |
| $15,000 to $24,999 | 76 | 11.0% |
| $25,000 to $34,999 | 31 | 4.5% |
| $35,000 to $49,999 | 77 | 11.1% |
| $50,000 to $74,999 | 160 | 23.1% |
| $75,000 to $99,999 | 103 | 14.9% |
| $100,000 to $149,999 | 199 | 28.8% |
| $150,000 to $199,999 | 24 | 3.5% |
| $200,000+ | 0 | 0.0% |
Family Income by Famaliy Size in Salina
5-person families (71 | 10.3%) account for the highest median family income in Salina with $110,208 per family, while 2-person families (344 | 49.7%) have the highest median income of $32,656 per family member.
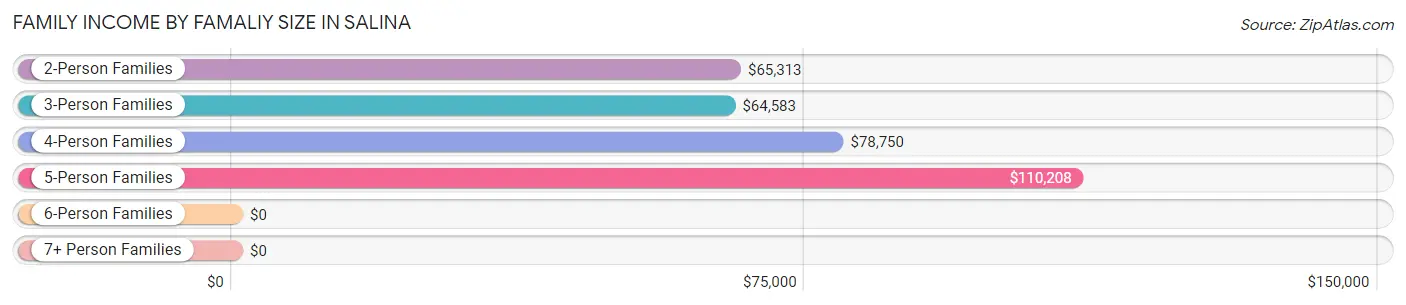
| Income Bracket | # Families | Median Income |
| 2-Person Families | 344 (49.7%) | $65,313 |
| 3-Person Families | 134 (19.4%) | $64,583 |
| 4-Person Families | 128 (18.5%) | $78,750 |
| 5-Person Families | 71 (10.3%) | $110,208 |
| 6-Person Families | 10 (1.5%) | $0 |
| 7+ Person Families | 5 (0.7%) | $0 |
| Total | 692 (100.0%) | $70,227 |
Family Income by Number of Earners in Salina
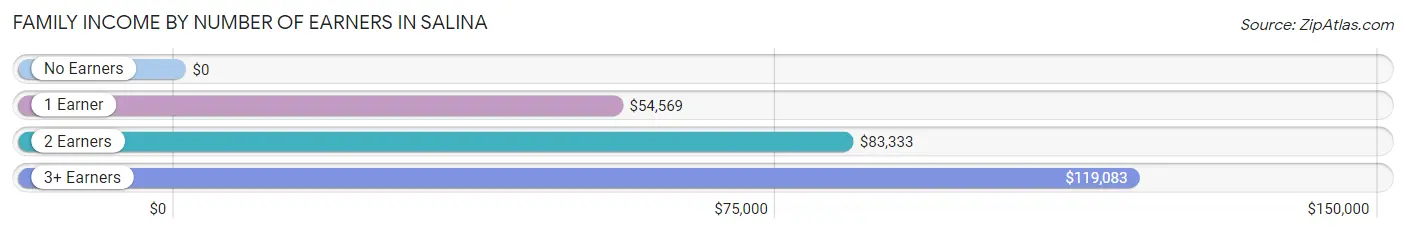
| Number of Earners | # Families | Median Income |
| No Earners | 101 (14.6%) | $0 |
| 1 Earner | 194 (28.0%) | $54,569 |
| 2 Earners | 362 (52.3%) | $83,333 |
| 3+ Earners | 35 (5.1%) | $119,083 |
| Total | 692 (100.0%) | $70,227 |
Household Income in Salina
Household Income Brackets in Salina
With 253 households falling in the category, the $100,000 to $149,999 income range is the most frequent in Salina, accounting for 25.8% of all households. In contrast, only 4 households (0.4%) fall into the $200,000+ income bracket, making it the least populous group.
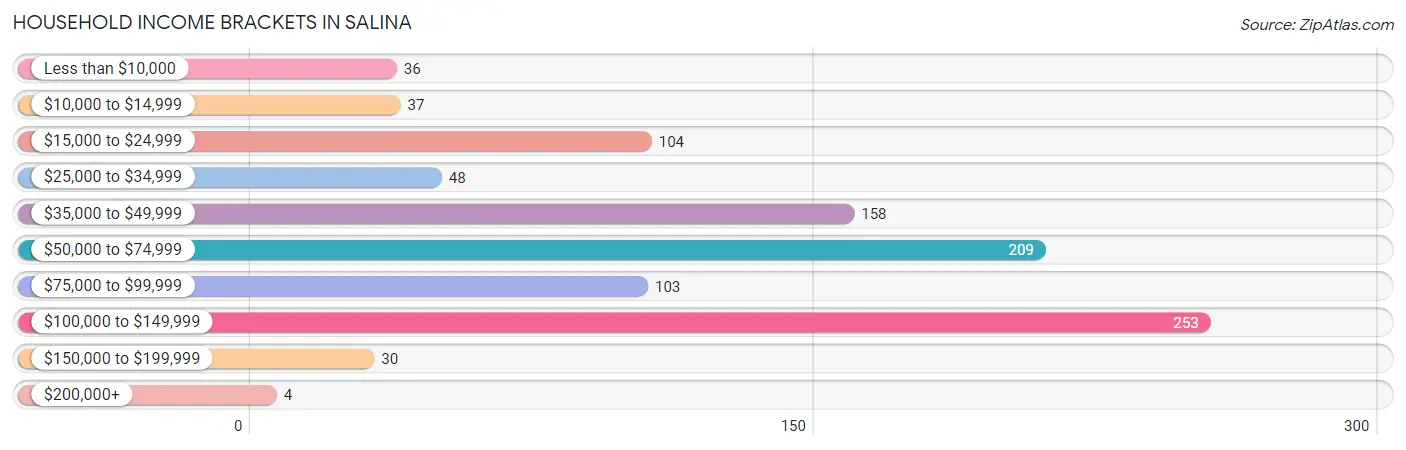
| Income Bracket | # Households | % Households |
| Less than $10,000 | 36 | 3.7% |
| $10,000 to $14,999 | 37 | 3.8% |
| $15,000 to $24,999 | 104 | 10.6% |
| $25,000 to $34,999 | 48 | 4.9% |
| $35,000 to $49,999 | 158 | 16.1% |
| $50,000 to $74,999 | 209 | 21.3% |
| $75,000 to $99,999 | 103 | 10.5% |
| $100,000 to $149,999 | 253 | 25.8% |
| $150,000 to $199,999 | 30 | 3.1% |
| $200,000+ | 4 | 0.4% |
Household Income by Householder Age in Salina
The median household income in Salina is $61,742, with the highest median household income of $93,929 found in the 45 to 64 years age bracket for the primary householder. A total of 230 households (23.4%) fall into this category. Meanwhile, the 15 to 24 years age bracket for the primary householder has the lowest median household income of $57,760, with 105 households (10.7%) in this group.
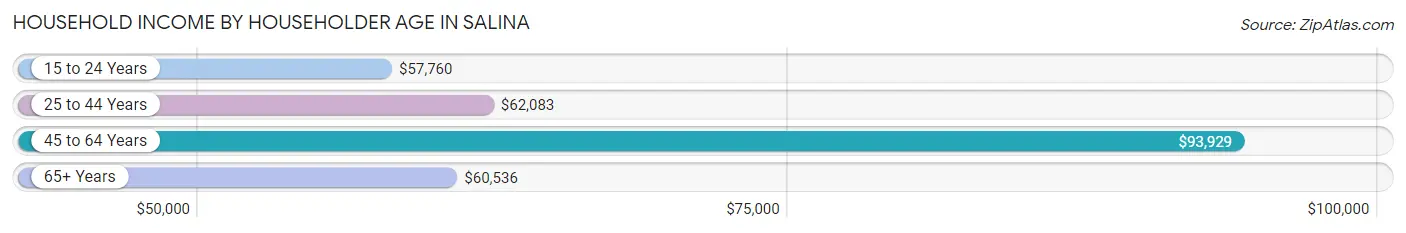
| Income Bracket | # Households | Median Income |
| 15 to 24 Years | 105 (10.7%) | $57,760 |
| 25 to 44 Years | 362 (36.9%) | $62,083 |
| 45 to 64 Years | 230 (23.4%) | $93,929 |
| 65+ Years | 285 (29.0%) | $60,536 |
| Total | 982 (100.0%) | $61,742 |
Poverty in Salina
Income Below Poverty by Sex and Age in Salina
With 12.3% poverty level for males and 16.7% for females among the residents of Salina, 6 to 11 year old males and 65 to 74 year old females are the most vulnerable to poverty, with 31 males (32.3%) and 52 females (40.6%) in their respective age groups living below the poverty level.
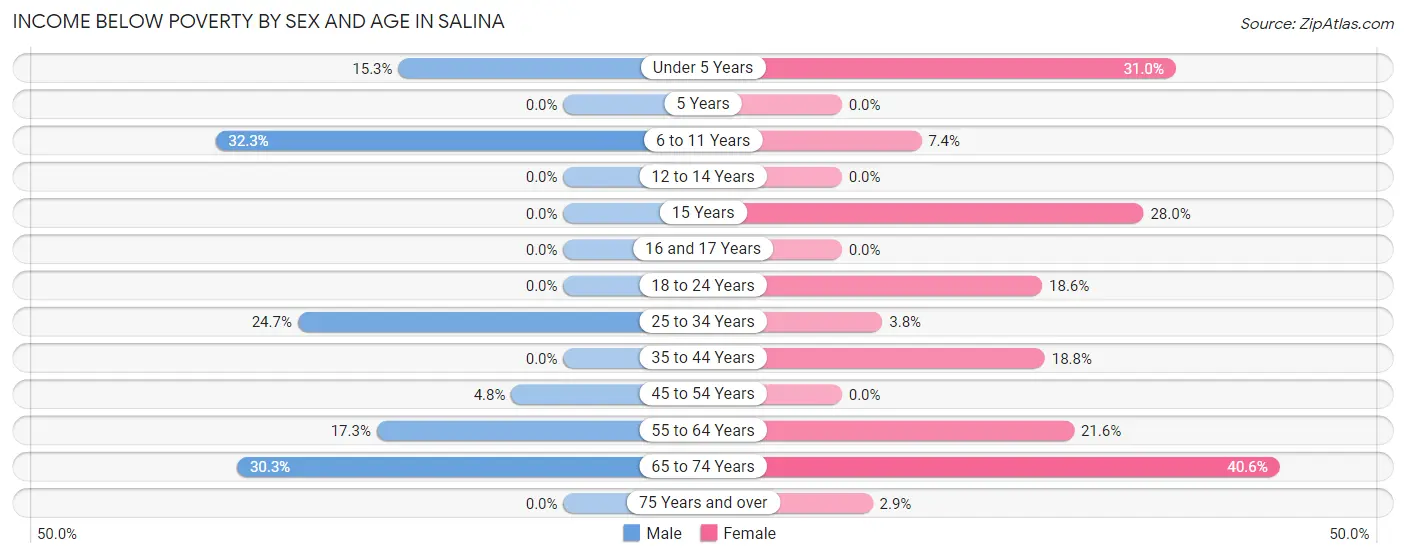
| Age Bracket | Male | Female |
| Under 5 Years | 15 (15.3%) | 22 (31.0%) |
| 5 Years | 0 (0.0%) | 0 (0.0%) |
| 6 to 11 Years | 31 (32.3%) | 7 (7.4%) |
| 12 to 14 Years | 0 (0.0%) | 0 (0.0%) |
| 15 Years | 0 (0.0%) | 7 (28.0%) |
| 16 and 17 Years | 0 (0.0%) | 0 (0.0%) |
| 18 to 24 Years | 0 (0.0%) | 29 (18.6%) |
| 25 to 34 Years | 35 (24.6%) | 5 (3.8%) |
| 35 to 44 Years | 0 (0.0%) | 39 (18.8%) |
| 45 to 54 Years | 7 (4.8%) | 0 (0.0%) |
| 55 to 64 Years | 22 (17.3%) | 25 (21.5%) |
| 65 to 74 Years | 53 (30.3%) | 52 (40.6%) |
| 75 Years and over | 0 (0.0%) | 2 (2.9%) |
| Total | 163 (12.3%) | 188 (16.7%) |
Income Above Poverty by Sex and Age in Salina
According to the poverty statistics in Salina, males aged 12 to 14 years and females aged 5 years are the age groups that are most secure financially, with 100.0% of males and 100.0% of females in these age groups living above the poverty line.
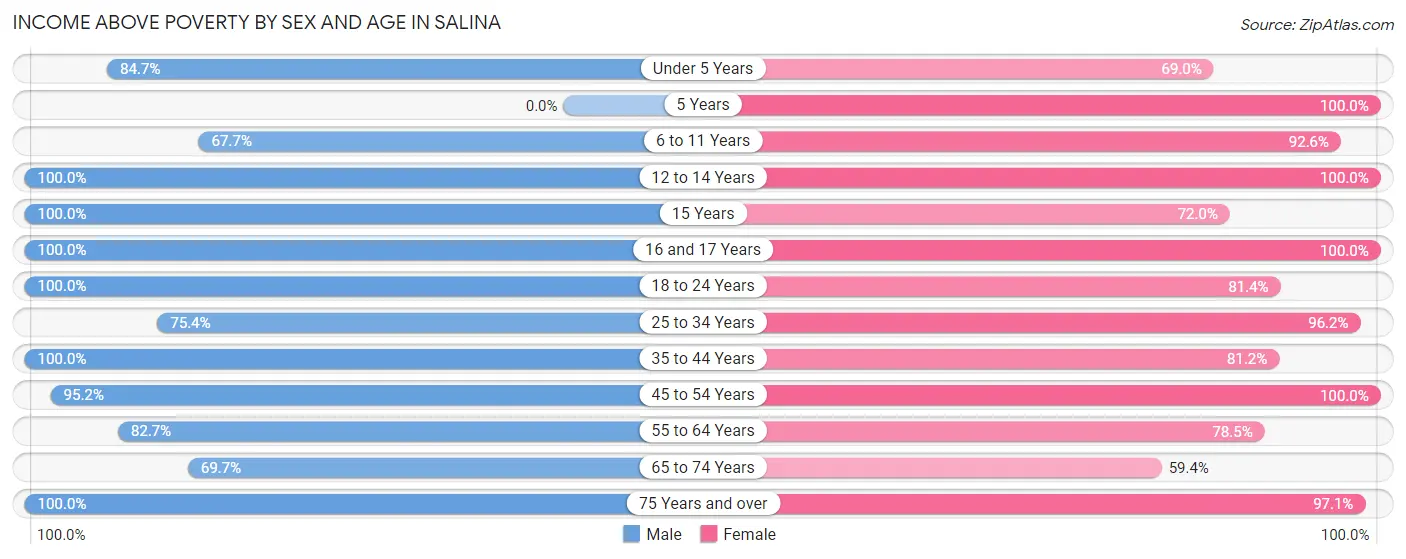
| Age Bracket | Male | Female |
| Under 5 Years | 83 (84.7%) | 49 (69.0%) |
| 5 Years | 0 (0.0%) | 4 (100.0%) |
| 6 to 11 Years | 65 (67.7%) | 88 (92.6%) |
| 12 to 14 Years | 91 (100.0%) | 18 (100.0%) |
| 15 Years | 6 (100.0%) | 18 (72.0%) |
| 16 and 17 Years | 46 (100.0%) | 7 (100.0%) |
| 18 to 24 Years | 119 (100.0%) | 127 (81.4%) |
| 25 to 34 Years | 107 (75.3%) | 128 (96.2%) |
| 35 to 44 Years | 234 (100.0%) | 168 (81.2%) |
| 45 to 54 Years | 138 (95.2%) | 97 (100.0%) |
| 55 to 64 Years | 105 (82.7%) | 91 (78.4%) |
| 65 to 74 Years | 122 (69.7%) | 76 (59.4%) |
| 75 Years and over | 46 (100.0%) | 68 (97.1%) |
| Total | 1,162 (87.7%) | 939 (83.3%) |
Income Below Poverty Among Married-Couple Families in Salina
The poverty statistics for married-couple families in Salina show that 12.9% or 76 of the total 589 families live below the poverty line. Families with 5 or more children have the highest poverty rate of 100.0%, comprising of 5 families. On the other hand, families with 1 or 2 children have the lowest poverty rate of 0.0%, which includes 0 families.
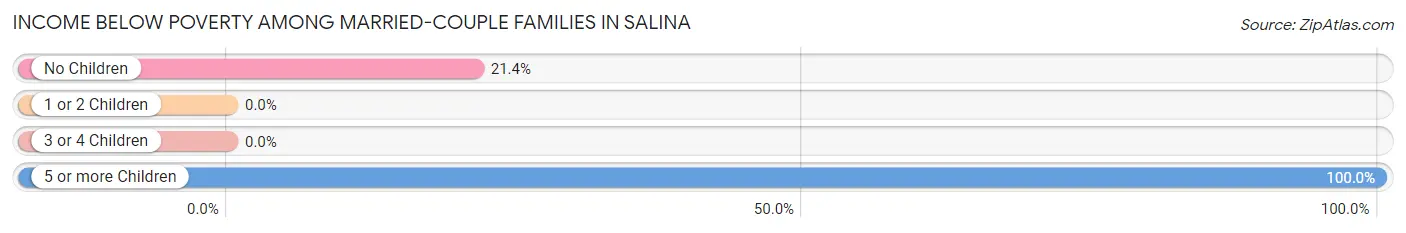
| Children | Above Poverty | Below Poverty |
| No Children | 261 (78.6%) | 71 (21.4%) |
| 1 or 2 Children | 179 (100.0%) | 0 (0.0%) |
| 3 or 4 Children | 73 (100.0%) | 0 (0.0%) |
| 5 or more Children | 0 (0.0%) | 5 (100.0%) |
| Total | 513 (87.1%) | 76 (12.9%) |
Income Below Poverty Among Single-Parent Households in Salina
According to the poverty data in Salina, 18.2% or 4 single-father households and 33.3% or 27 single-mother households are living below the poverty line. Among single-father households, those with 1 or 2 children have the highest poverty rate, with 4 households (36.4%) experiencing poverty. Likewise, among single-mother households, those with 1 or 2 children have the highest poverty rate, with 23 households (100.0%) falling below the poverty line.
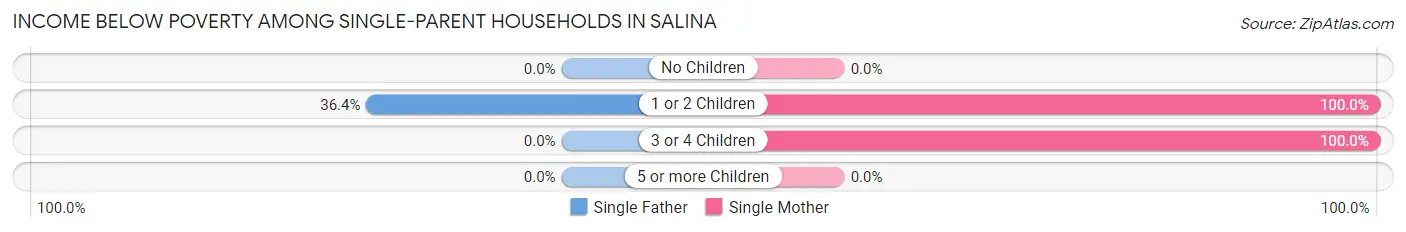
| Children | Single Father | Single Mother |
| No Children | 0 (0.0%) | 0 (0.0%) |
| 1 or 2 Children | 4 (36.4%) | 23 (100.0%) |
| 3 or 4 Children | 0 (0.0%) | 4 (100.0%) |
| 5 or more Children | 0 (0.0%) | 0 (0.0%) |
| Total | 4 (18.2%) | 27 (33.3%) |
Income Below Poverty Among Married-Couple vs Single-Parent Households in Salina
The poverty data for Salina shows that 76 of the married-couple family households (12.9%) and 31 of the single-parent households (30.1%) are living below the poverty level. Within the married-couple family households, those with 5 or more children have the highest poverty rate, with 5 households (100.0%) falling below the poverty line. Among the single-parent households, those with 3 or 4 children have the highest poverty rate, with 4 household (100.0%) living below poverty.
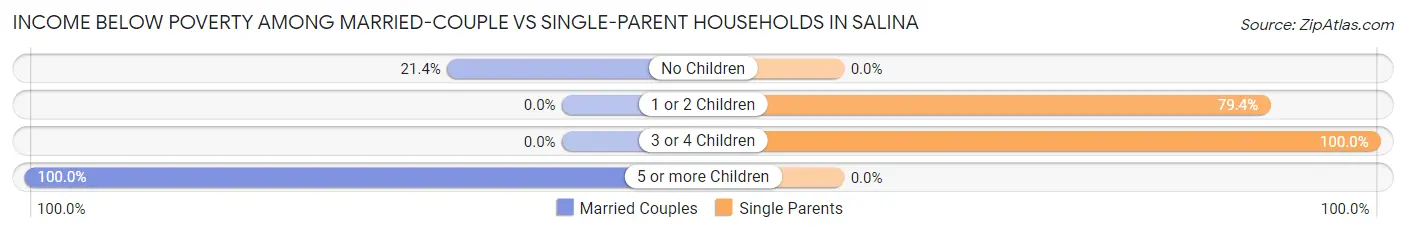
| Children | Married-Couple Families | Single-Parent Households |
| No Children | 71 (21.4%) | 0 (0.0%) |
| 1 or 2 Children | 0 (0.0%) | 27 (79.4%) |
| 3 or 4 Children | 0 (0.0%) | 4 (100.0%) |
| 5 or more Children | 5 (100.0%) | 0 (0.0%) |
| Total | 76 (12.9%) | 31 (30.1%) |
Race in Salina
The most populous races in Salina are White / Caucasian (2,373 | 94.9%), Hispanic or Latino (219 | 8.8%), and Some other Race (53 | 2.1%).
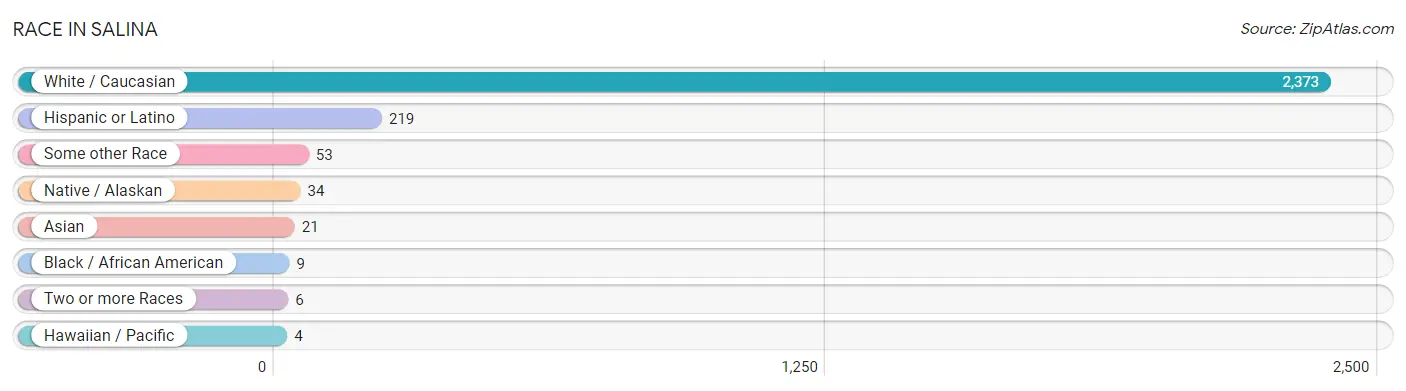
| Race | # Population | % Population |
| Asian | 21 | 0.8% |
| Black / African American | 9 | 0.4% |
| Hawaiian / Pacific | 4 | 0.2% |
| Hispanic or Latino | 219 | 8.8% |
| Native / Alaskan | 34 | 1.4% |
| White / Caucasian | 2,373 | 94.9% |
| Two or more Races | 6 | 0.2% |
| Some other Race | 53 | 2.1% |
| Total | 2,500 | 100.0% |
Ancestry in Salina
The most populous ancestries reported in Salina are English (553 | 22.1%), German (238 | 9.5%), Danish (232 | 9.3%), Mexican (187 | 7.5%), and American (157 | 6.3%), together accounting for 54.7% of all Salina residents.
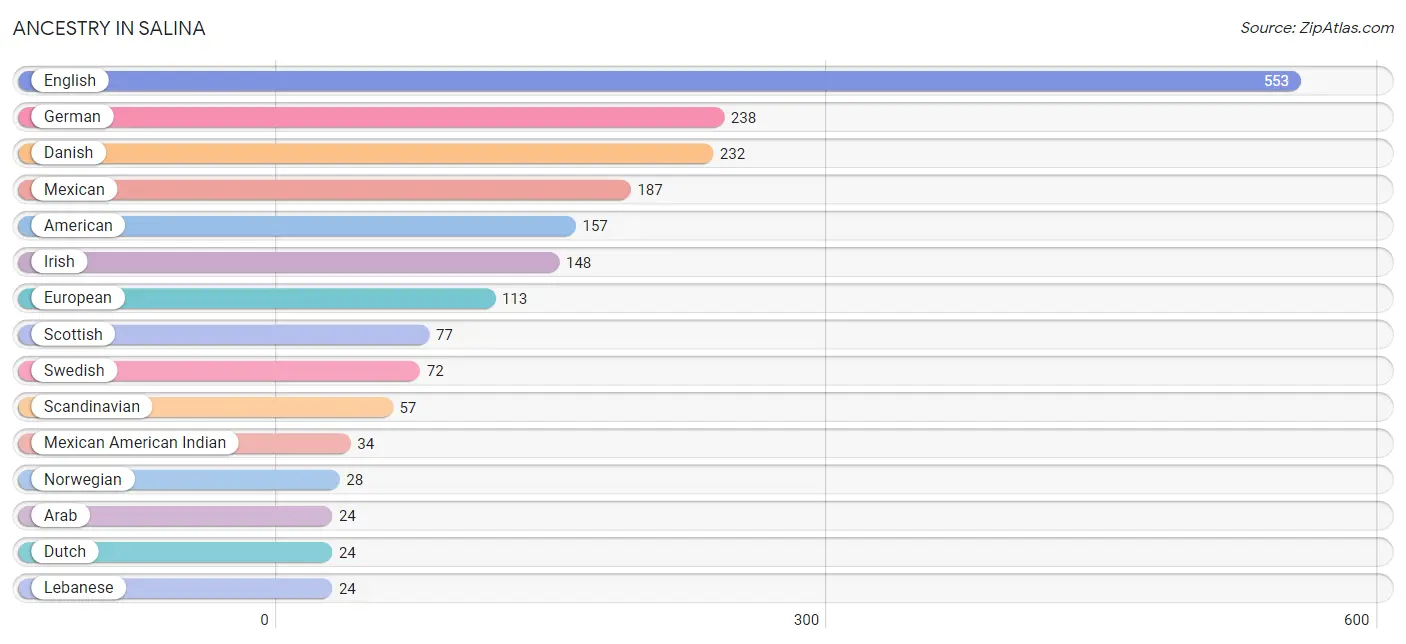
| Ancestry | # Population | % Population |
| American | 157 | 6.3% |
| Arab | 24 | 1.0% |
| Bhutanese | 21 | 0.8% |
| British | 14 | 0.6% |
| Danish | 232 | 9.3% |
| Dutch | 24 | 1.0% |
| English | 553 | 22.1% |
| European | 113 | 4.5% |
| Finnish | 8 | 0.3% |
| French | 20 | 0.8% |
| German | 238 | 9.5% |
| Icelander | 2 | 0.1% |
| Irish | 148 | 5.9% |
| Italian | 12 | 0.5% |
| Lebanese | 24 | 1.0% |
| Lithuanian | 6 | 0.2% |
| Mexican | 187 | 7.5% |
| Mexican American Indian | 34 | 1.4% |
| Native Hawaiian | 4 | 0.2% |
| Norwegian | 28 | 1.1% |
| Polish | 13 | 0.5% |
| Portuguese | 6 | 0.2% |
| Puerto Rican | 21 | 0.8% |
| Scandinavian | 57 | 2.3% |
| Scotch-Irish | 7 | 0.3% |
| Scottish | 77 | 3.1% |
| Swedish | 72 | 2.9% |
| Swiss | 7 | 0.3% |
| Welsh | 11 | 0.4% | View All 29 Rows |
Immigrants in Salina
The most numerous immigrant groups reported in Salina came from Central America (86 | 3.4%), Latin America (86 | 3.4%), Mexico (86 | 3.4%), and Canada (5 | 0.2%), together accounting for 10.5% of all Salina residents.
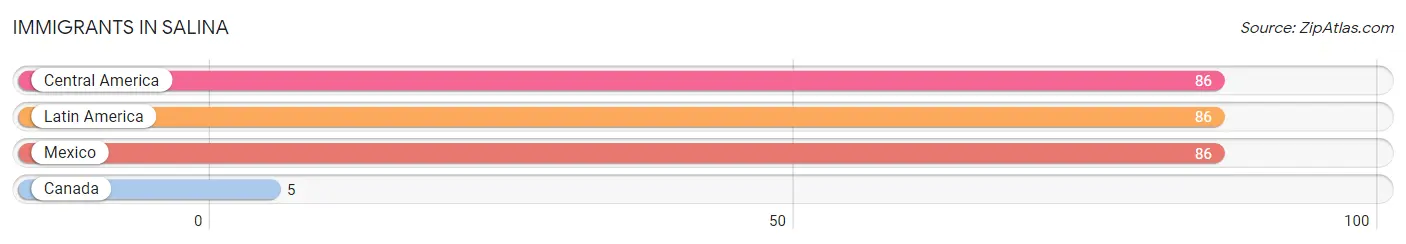
| Immigration Origin | # Population | % Population |
| Canada | 5 | 0.2% |
| Central America | 86 | 3.4% |
| Latin America | 86 | 3.4% |
| Mexico | 86 | 3.4% | View All 4 Rows |
Sex and Age in Salina
Sex and Age in Salina
The most populous age groups in Salina are 35 to 39 Years (159 | 11.8%) for men and 20 to 24 Years (119 | 10.3%) for women.
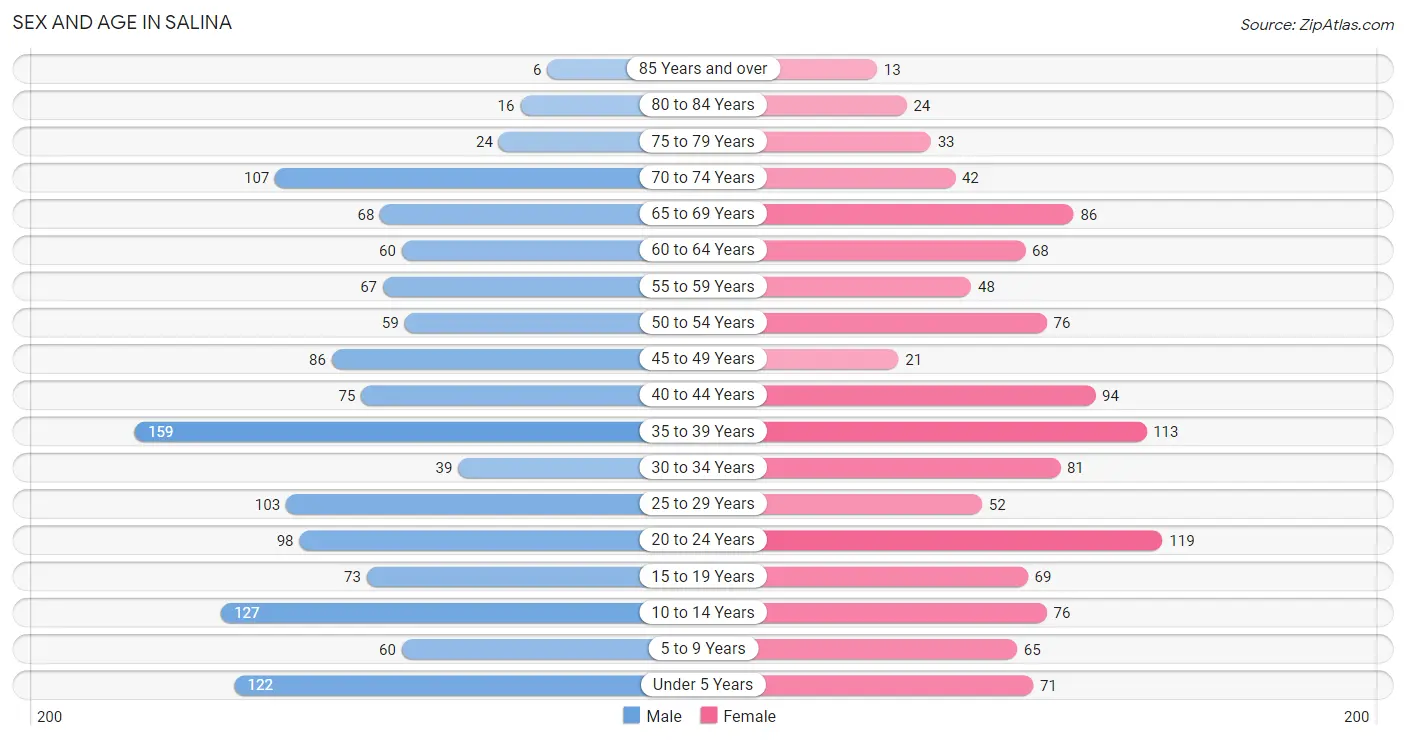
| Age Bracket | Male | Female |
| Under 5 Years | 122 (9.0%) | 71 (6.2%) |
| 5 to 9 Years | 60 (4.4%) | 65 (5.7%) |
| 10 to 14 Years | 127 (9.4%) | 76 (6.6%) |
| 15 to 19 Years | 73 (5.4%) | 69 (6.0%) |
| 20 to 24 Years | 98 (7.3%) | 119 (10.3%) |
| 25 to 29 Years | 103 (7.6%) | 52 (4.5%) |
| 30 to 34 Years | 39 (2.9%) | 81 (7.0%) |
| 35 to 39 Years | 159 (11.8%) | 113 (9.8%) |
| 40 to 44 Years | 75 (5.6%) | 94 (8.2%) |
| 45 to 49 Years | 86 (6.4%) | 21 (1.8%) |
| 50 to 54 Years | 59 (4.4%) | 76 (6.6%) |
| 55 to 59 Years | 67 (5.0%) | 48 (4.2%) |
| 60 to 64 Years | 60 (4.4%) | 68 (5.9%) |
| 65 to 69 Years | 68 (5.0%) | 86 (7.5%) |
| 70 to 74 Years | 107 (7.9%) | 42 (3.6%) |
| 75 to 79 Years | 24 (1.8%) | 33 (2.9%) |
| 80 to 84 Years | 16 (1.2%) | 24 (2.1%) |
| 85 Years and over | 6 (0.4%) | 13 (1.1%) |
| Total | 1,349 (100.0%) | 1,151 (100.0%) |
Families and Households in Salina
Median Family Size in Salina
The median family size in Salina is 3.04 persons per family, with married-couple families (589 | 85.1%) accounting for the largest median family size of 3.05 persons per family. On the other hand, single male/father families (22 | 3.2%) represent the smallest median family size with 2.91 persons per family.
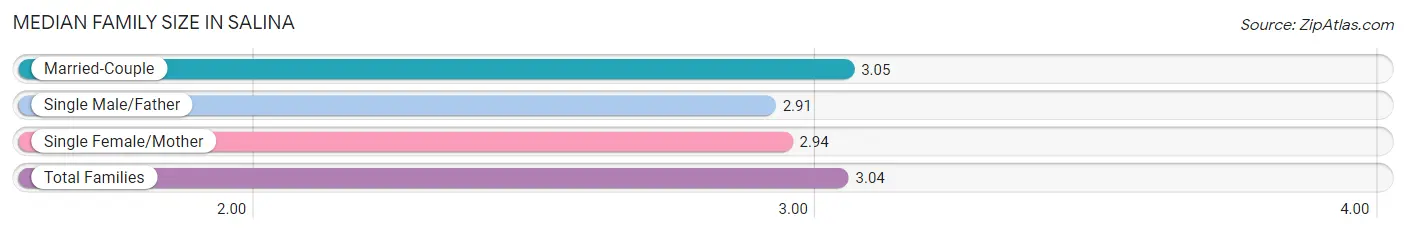
| Family Type | # Families | Family Size |
| Married-Couple | 589 (85.1%) | 3.05 |
| Single Male/Father | 22 (3.2%) | 2.91 |
| Single Female/Mother | 81 (11.7%) | 2.94 |
| Total Families | 692 (100.0%) | 3.04 |
Median Household Size in Salina
The median household size in Salina is 2.55 persons per household, with single male/father households (22 | 2.2%) accounting for the largest median household size of 4.5 persons per household. non-family households (290 | 29.5%) represent the smallest median household size with 1.11 persons per household.
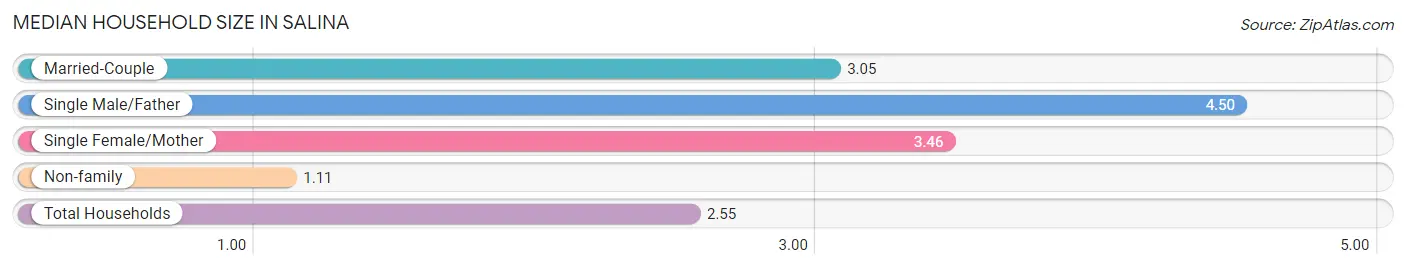
| Household Type | # Households | Household Size |
| Married-Couple | 589 (60.0%) | 3.05 |
| Single Male/Father | 22 (2.2%) | 4.50 |
| Single Female/Mother | 81 (8.3%) | 3.46 |
| Non-family | 290 (29.5%) | 1.11 |
| Total Households | 982 (100.0%) | 2.55 |
Household Size by Marriage Status in Salina
Out of a total of 982 households in Salina, 692 (70.5%) are family households, while 290 (29.5%) are nonfamily households. The most numerous type of family households are 2-person households, comprising 314, and the most common type of nonfamily households are 1-person households, comprising 270.
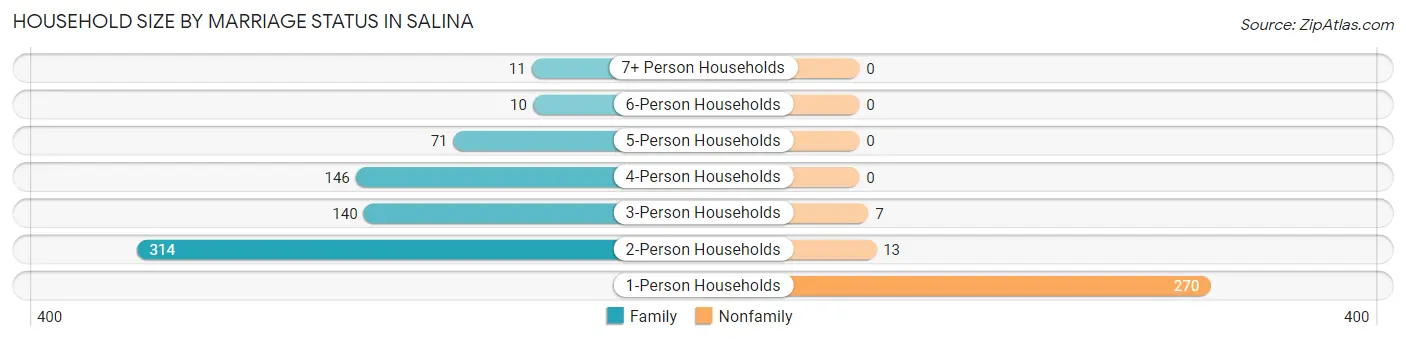
| Household Size | Family Households | Nonfamily Households |
| 1-Person Households | - | 270 (27.5%) |
| 2-Person Households | 314 (32.0%) | 13 (1.3%) |
| 3-Person Households | 140 (14.3%) | 7 (0.7%) |
| 4-Person Households | 146 (14.9%) | 0 (0.0%) |
| 5-Person Households | 71 (7.2%) | 0 (0.0%) |
| 6-Person Households | 10 (1.0%) | 0 (0.0%) |
| 7+ Person Households | 11 (1.1%) | 0 (0.0%) |
| Total | 692 (70.5%) | 290 (29.5%) |
Female Fertility in Salina
Fertility by Age in Salina
Average fertility rate in Salina is 44.0 births per 1,000 women. Women in the age bracket of 35 to 50 years have the highest fertility rate with 58.0 births per 1,000 women. Women in the age bracket of 35 to 50 years acount for 56.0% of all women with births.
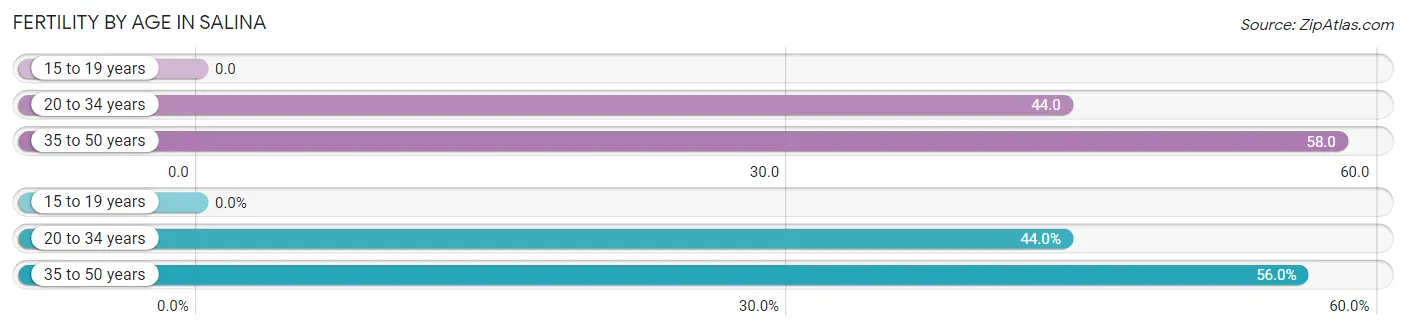
| Age Bracket | Women with Births | Births / 1,000 Women |
| 15 to 19 years | 0 (0.0%) | 0.0 |
| 20 to 34 years | 11 (44.0%) | 44.0 |
| 35 to 50 years | 14 (56.0%) | 58.0 |
| Total | 25 (100.0%) | 44.0 |
Fertility by Age by Marriage Status in Salina
76.0% of women with births (25) in Salina are married. The highest percentage of unmarried women with births falls into 20 to 34 years age bracket with 54.5% of them unmarried at the time of birth, while the lowest percentage of unmarried women with births belong to 35 to 50 years age bracket with 0.0% of them unmarried.
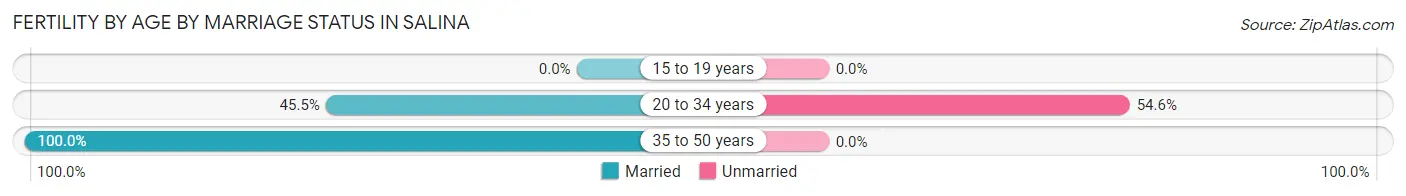
| Age Bracket | Married | Unmarried |
| 15 to 19 years | 0 (0.0%) | 0 (0.0%) |
| 20 to 34 years | 5 (45.5%) | 6 (54.5%) |
| 35 to 50 years | 14 (100.0%) | 0 (0.0%) |
| Total | 19 (76.0%) | 6 (24.0%) |
Fertility by Education in Salina
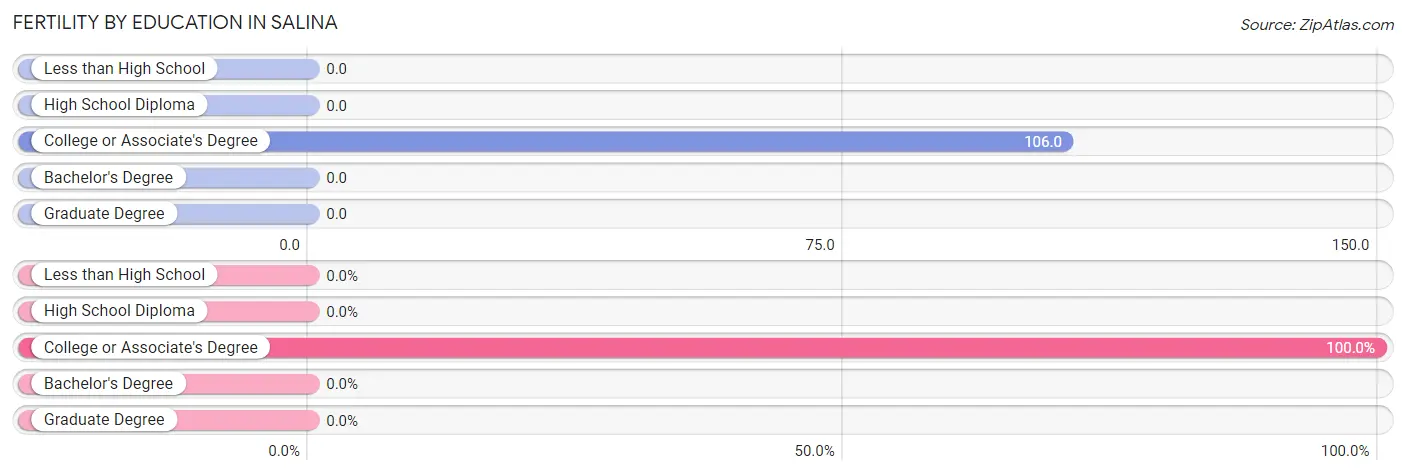
| Educational Attainment | Women with Births | Births / 1,000 Women |
| Less than High School | 0 (0.0%) | 0.0 |
| High School Diploma | 0 (0.0%) | 0.0 |
| College or Associate's Degree | 25 (100.0%) | 106.0 |
| Bachelor's Degree | 0 (0.0%) | 0.0 |
| Graduate Degree | 0 (0.0%) | 0.0 |
| Total | 25 (100.0%) | 44.0 |
Fertility by Education by Marriage Status in Salina
24.0% of women with births in Salina are unmarried. Women with the educational attainment of college or associate's degree are most likely to be married with 76.0% of them married at childbirth, while women with the educational attainment of college or associate's degree are least likely to be married with 24.0% of them unmarried at childbirth.
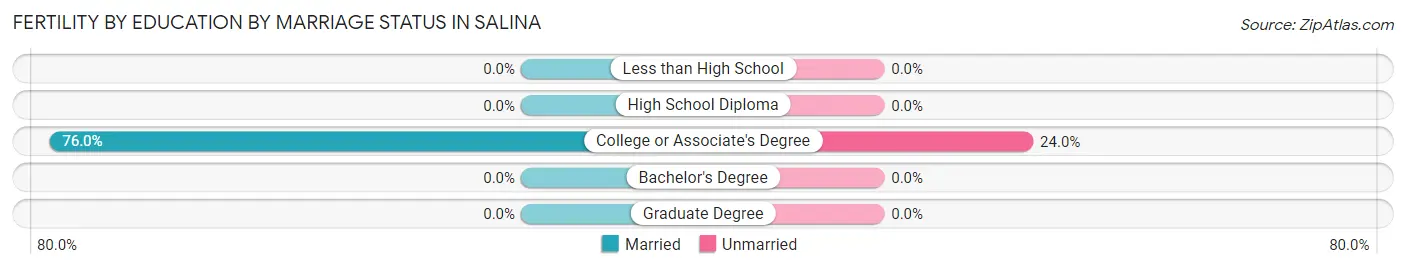
| Educational Attainment | Married | Unmarried |
| Less than High School | 0 (0.0%) | 0 (0.0%) |
| High School Diploma | 0 (0.0%) | 0 (0.0%) |
| College or Associate's Degree | 19 (76.0%) | 6 (24.0%) |
| Bachelor's Degree | 0 (0.0%) | 0 (0.0%) |
| Graduate Degree | 0 (0.0%) | 0 (0.0%) |
| Total | 19 (76.0%) | 6 (24.0%) |
Employment Characteristics in Salina
Employment by Class of Employer in Salina
Among the 1,081 employed individuals in Salina, private company employees (716 | 66.2%), state government employees (184 | 17.0%), and self-employed (not incorporated) (48 | 4.4%) make up the most common classes of employment.
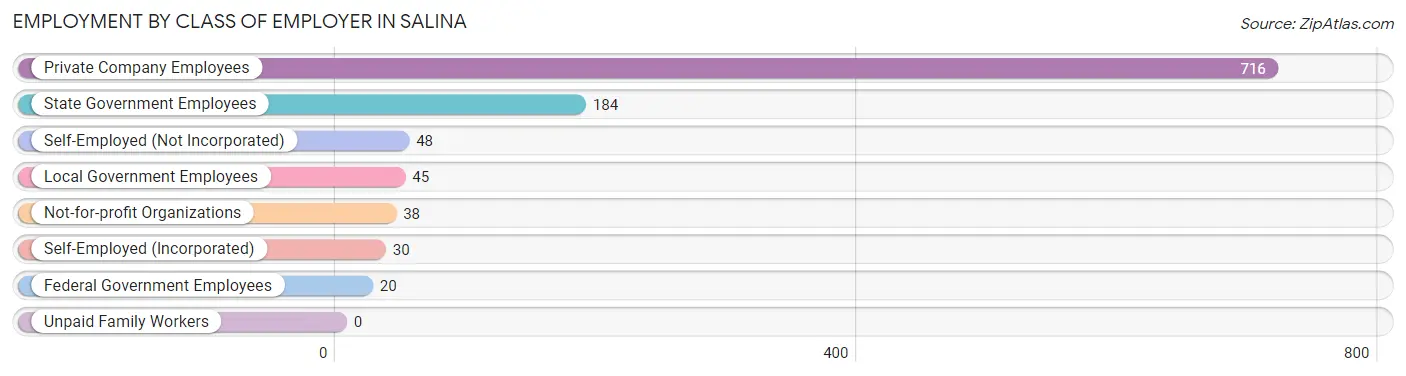
| Employer Class | # Employees | % Employees |
| Private Company Employees | 716 | 66.2% |
| Self-Employed (Incorporated) | 30 | 2.8% |
| Self-Employed (Not Incorporated) | 48 | 4.4% |
| Not-for-profit Organizations | 38 | 3.5% |
| Local Government Employees | 45 | 4.2% |
| State Government Employees | 184 | 17.0% |
| Federal Government Employees | 20 | 1.8% |
| Unpaid Family Workers | 0 | 0.0% |
| Total | 1,081 | 100.0% |
Employment Status by Age in Salina
According to the labor force statistics for Salina, out of the total population over 16 years of age (1,948), 65.3% or 1,272 individuals are in the labor force, with 10.0% or 127 of them unemployed. The age group with the highest labor force participation rate is 30 to 34 years, with 90.8% or 109 individuals in the labor force. Within the labor force, the 16 to 19 years age range has the highest percentage of unemployed individuals, with 24.1% or 19 of them being unemployed.
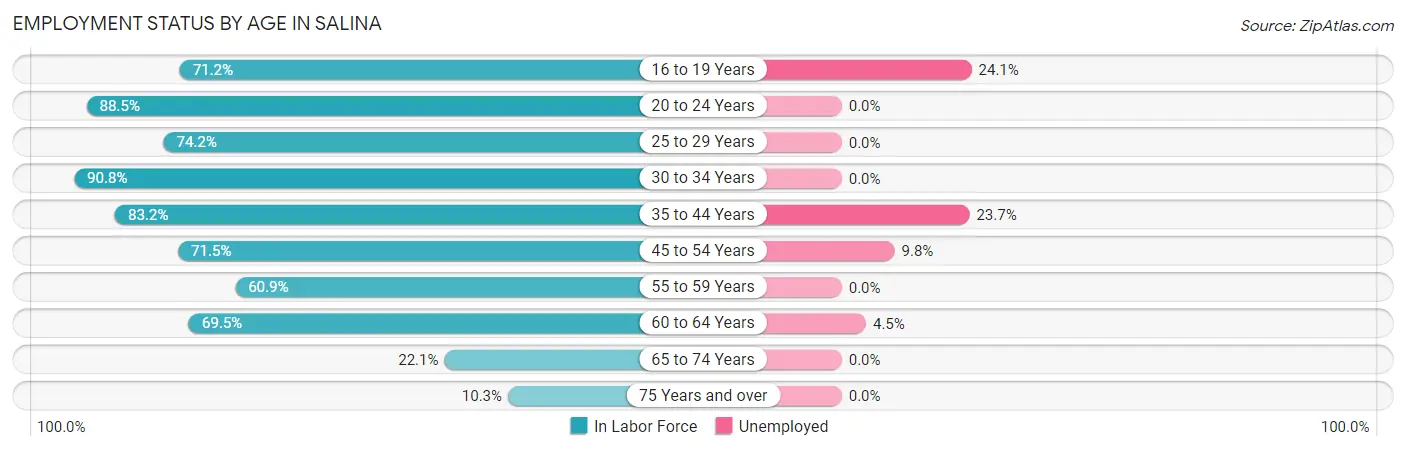
| Age Bracket | In Labor Force | Unemployed |
| 16 to 19 Years | 79 (71.2%) | 19 (24.1%) |
| 20 to 24 Years | 192 (88.5%) | 0 (0.0%) |
| 25 to 29 Years | 115 (74.2%) | 0 (0.0%) |
| 30 to 34 Years | 109 (90.8%) | 0 (0.0%) |
| 35 to 44 Years | 367 (83.2%) | 87 (23.7%) |
| 45 to 54 Years | 173 (71.5%) | 17 (9.8%) |
| 55 to 59 Years | 70 (60.9%) | 0 (0.0%) |
| 60 to 64 Years | 89 (69.5%) | 4 (4.5%) |
| 65 to 74 Years | 67 (22.1%) | 0 (0.0%) |
| 75 Years and over | 12 (10.3%) | 0 (0.0%) |
| Total | 1,272 (65.3%) | 127 (10.0%) |
Employment Status by Educational Attainment in Salina
According to labor force statistics for Salina, 76.9% of individuals (924) out of the total population between 25 and 64 years of age (1,201) are in the labor force, with 11.7% or 108 of them being unemployed. The group with the highest labor force participation rate are those with the educational attainment of bachelor's degree or higher, with 97.4% or 191 individuals in the labor force. Within the labor force, individuals with high school diploma education have the highest percentage of unemployment, with 27.4% or 87 of them being unemployed.
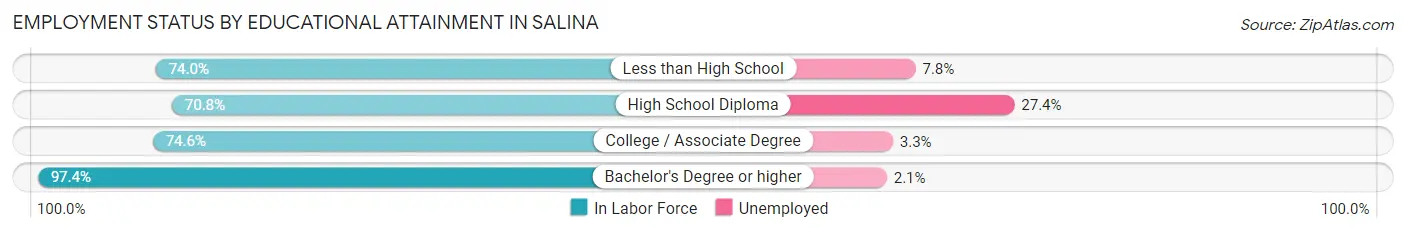
| Educational Attainment | In Labor Force | Unemployed |
| Less than High School | 77 (74.0%) | 8 (7.8%) |
| High School Diploma | 317 (70.8%) | 123 (27.4%) |
| College / Associate Degree | 338 (74.6%) | 15 (3.3%) |
| Bachelor's Degree or higher | 191 (97.4%) | 4 (2.1%) |
| Total | 924 (76.9%) | 141 (11.7%) |
Employment Occupations by Sex in Salina
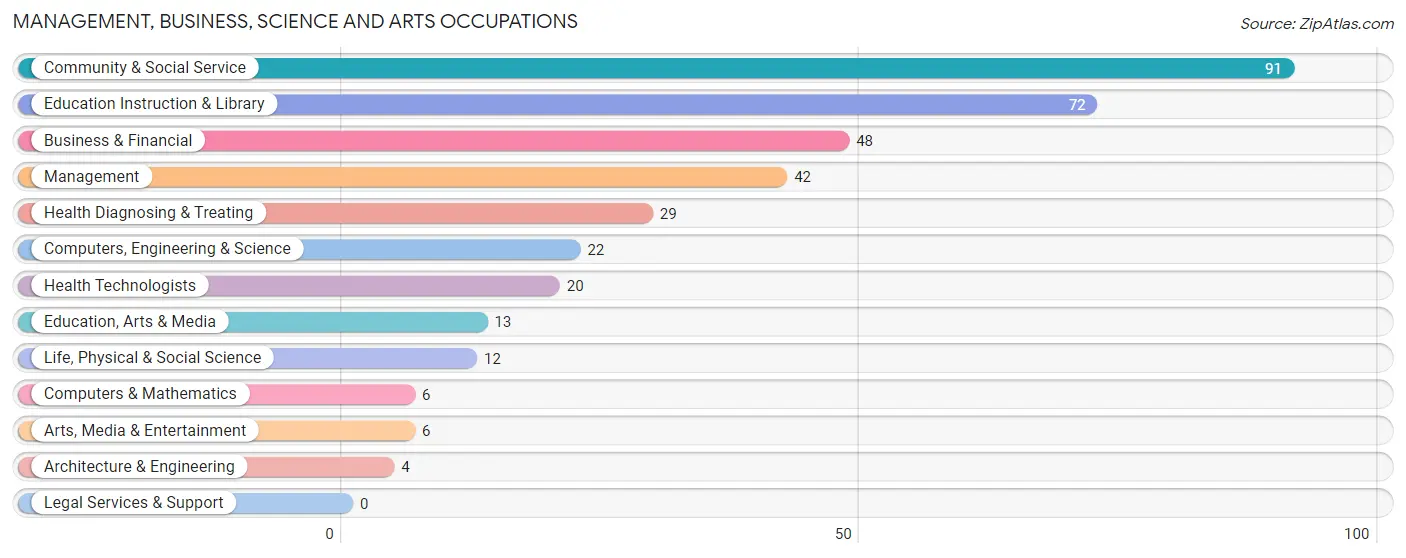
Management, Business, Science and Arts Occupations
The most common Management, Business, Science and Arts occupations in Salina are Community & Social Service (91 | 7.9%), Education Instruction & Library (72 | 6.3%), Business & Financial (48 | 4.2%), Management (42 | 3.7%), and Health Diagnosing & Treating (29 | 2.5%).
Management, Business, Science and Arts Occupations by Sex
Within the Management, Business, Science and Arts occupations in Salina, the most male-oriented occupations are Architecture & Engineering (100.0%), Life, Physical & Social Science (100.0%), and Computers, Engineering & Science (72.7%), while the most female-oriented occupations are Computers & Mathematics (100.0%), Education, Arts & Media (100.0%), and Arts, Media & Entertainment (100.0%).
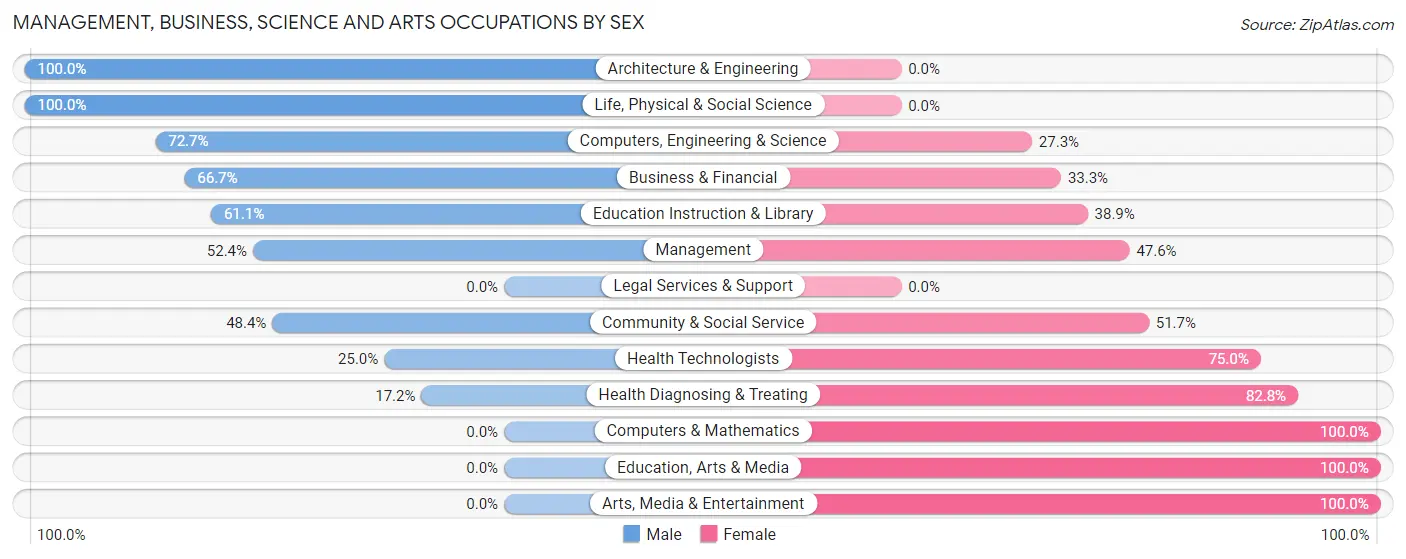
| Occupation | Male | Female |
| Management | 22 (52.4%) | 20 (47.6%) |
| Business & Financial | 32 (66.7%) | 16 (33.3%) |
| Computers, Engineering & Science | 16 (72.7%) | 6 (27.3%) |
| Computers & Mathematics | 0 (0.0%) | 6 (100.0%) |
| Architecture & Engineering | 4 (100.0%) | 0 (0.0%) |
| Life, Physical & Social Science | 12 (100.0%) | 0 (0.0%) |
| Community & Social Service | 44 (48.3%) | 47 (51.6%) |
| Education, Arts & Media | 0 (0.0%) | 13 (100.0%) |
| Legal Services & Support | 0 (0.0%) | 0 (0.0%) |
| Education Instruction & Library | 44 (61.1%) | 28 (38.9%) |
| Arts, Media & Entertainment | 0 (0.0%) | 6 (100.0%) |
| Health Diagnosing & Treating | 5 (17.2%) | 24 (82.8%) |
| Health Technologists | 5 (25.0%) | 15 (75.0%) |
| Total (Category) | 119 (51.3%) | 113 (48.7%) |
| Total (Overall) | 670 (58.5%) | 476 (41.5%) |
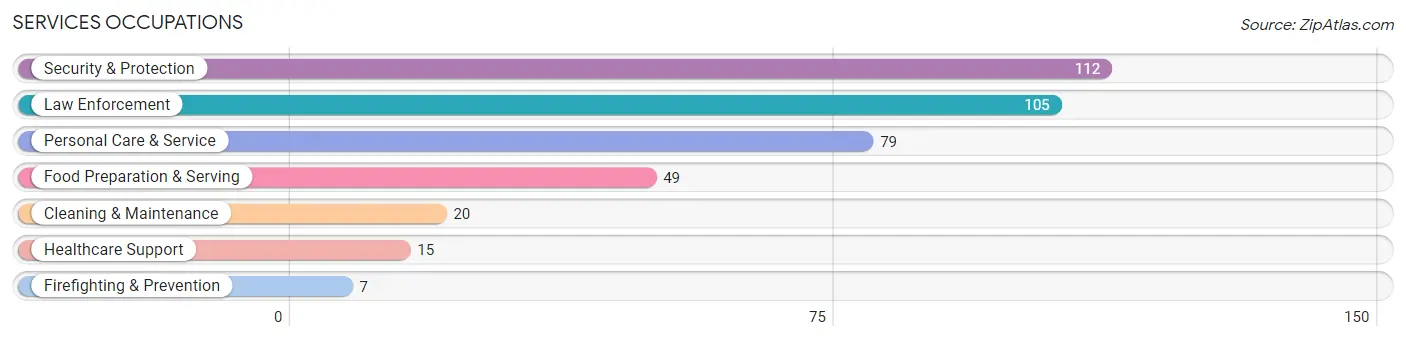
Services Occupations
The most common Services occupations in Salina are Security & Protection (112 | 9.8%), Law Enforcement (105 | 9.2%), Personal Care & Service (79 | 6.9%), Food Preparation & Serving (49 | 4.3%), and Cleaning & Maintenance (20 | 1.8%).
Services Occupations by Sex
Within the Services occupations in Salina, the most male-oriented occupations are Law Enforcement (100.0%), Security & Protection (93.8%), and Food Preparation & Serving (57.1%), while the most female-oriented occupations are Healthcare Support (100.0%), Firefighting & Prevention (100.0%), and Cleaning & Maintenance (100.0%).
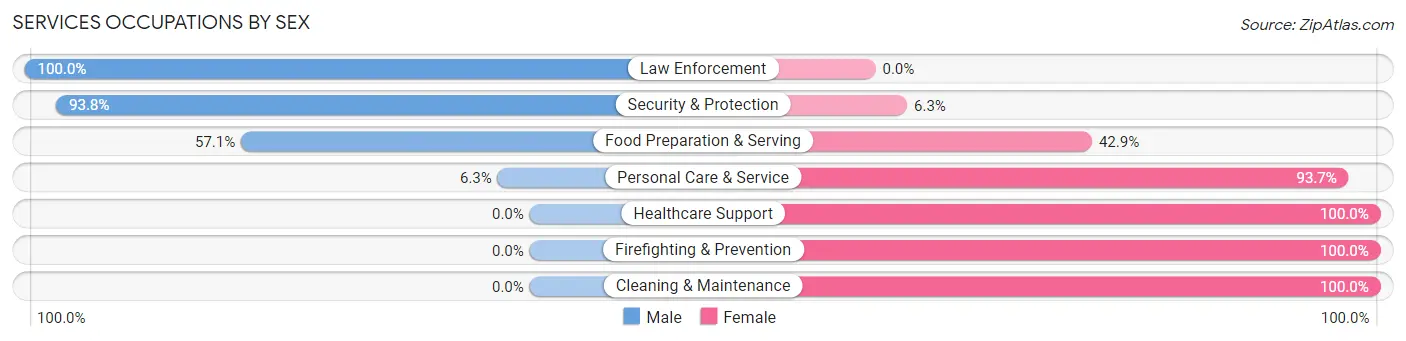
| Occupation | Male | Female |
| Healthcare Support | 0 (0.0%) | 15 (100.0%) |
| Security & Protection | 105 (93.8%) | 7 (6.2%) |
| Firefighting & Prevention | 0 (0.0%) | 7 (100.0%) |
| Law Enforcement | 105 (100.0%) | 0 (0.0%) |
| Food Preparation & Serving | 28 (57.1%) | 21 (42.9%) |
| Cleaning & Maintenance | 0 (0.0%) | 20 (100.0%) |
| Personal Care & Service | 5 (6.3%) | 74 (93.7%) |
| Total (Category) | 138 (50.2%) | 137 (49.8%) |
| Total (Overall) | 670 (58.5%) | 476 (41.5%) |
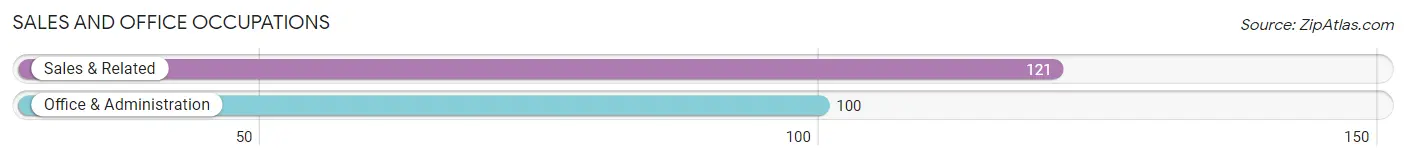
Sales and Office Occupations
The most common Sales and Office occupations in Salina are Sales & Related (121 | 10.6%), and Office & Administration (100 | 8.7%).
Sales and Office Occupations by Sex
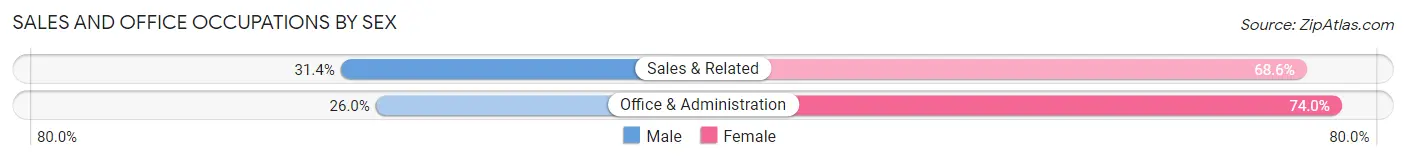
| Occupation | Male | Female |
| Sales & Related | 38 (31.4%) | 83 (68.6%) |
| Office & Administration | 26 (26.0%) | 74 (74.0%) |
| Total (Category) | 64 (29.0%) | 157 (71.0%) |
| Total (Overall) | 670 (58.5%) | 476 (41.5%) |
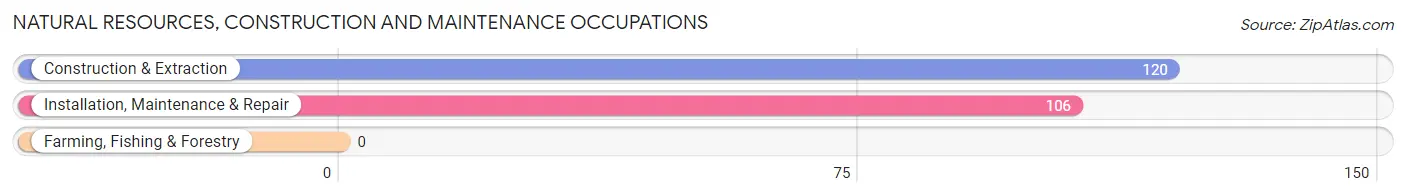
Natural Resources, Construction and Maintenance Occupations
The most common Natural Resources, Construction and Maintenance occupations in Salina are Construction & Extraction (120 | 10.5%), and Installation, Maintenance & Repair (106 | 9.2%).
Natural Resources, Construction and Maintenance Occupations by Sex
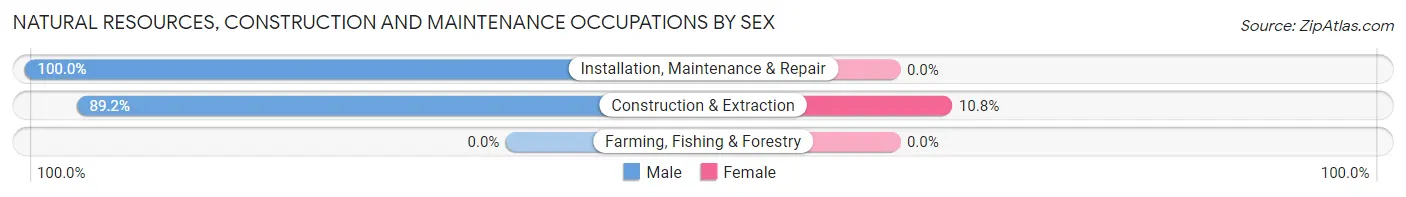
| Occupation | Male | Female |
| Farming, Fishing & Forestry | 0 (0.0%) | 0 (0.0%) |
| Construction & Extraction | 107 (89.2%) | 13 (10.8%) |
| Installation, Maintenance & Repair | 106 (100.0%) | 0 (0.0%) |
| Total (Category) | 213 (94.3%) | 13 (5.8%) |
| Total (Overall) | 670 (58.5%) | 476 (41.5%) |
Production, Transportation and Moving Occupations
The most common Production, Transportation and Moving occupations in Salina are Production (97 | 8.5%), Transportation (65 | 5.7%), and Material Moving (30 | 2.6%).
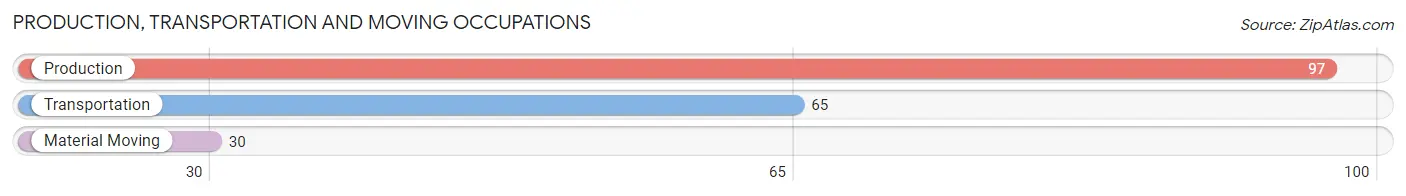
Production, Transportation and Moving Occupations by Sex
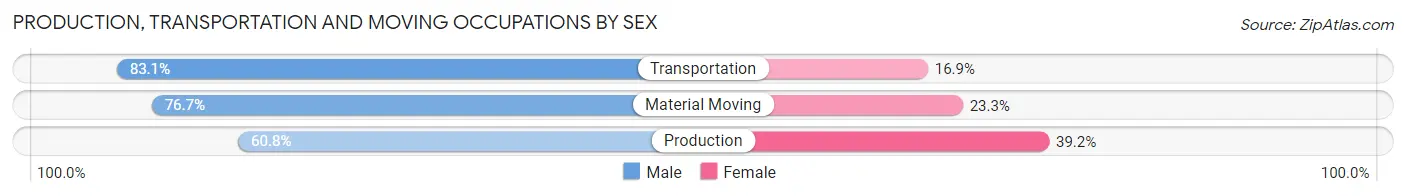
| Occupation | Male | Female |
| Production | 59 (60.8%) | 38 (39.2%) |
| Transportation | 54 (83.1%) | 11 (16.9%) |
| Material Moving | 23 (76.7%) | 7 (23.3%) |
| Total (Category) | 136 (70.8%) | 56 (29.2%) |
| Total (Overall) | 670 (58.5%) | 476 (41.5%) |
Employment Industries by Sex in Salina
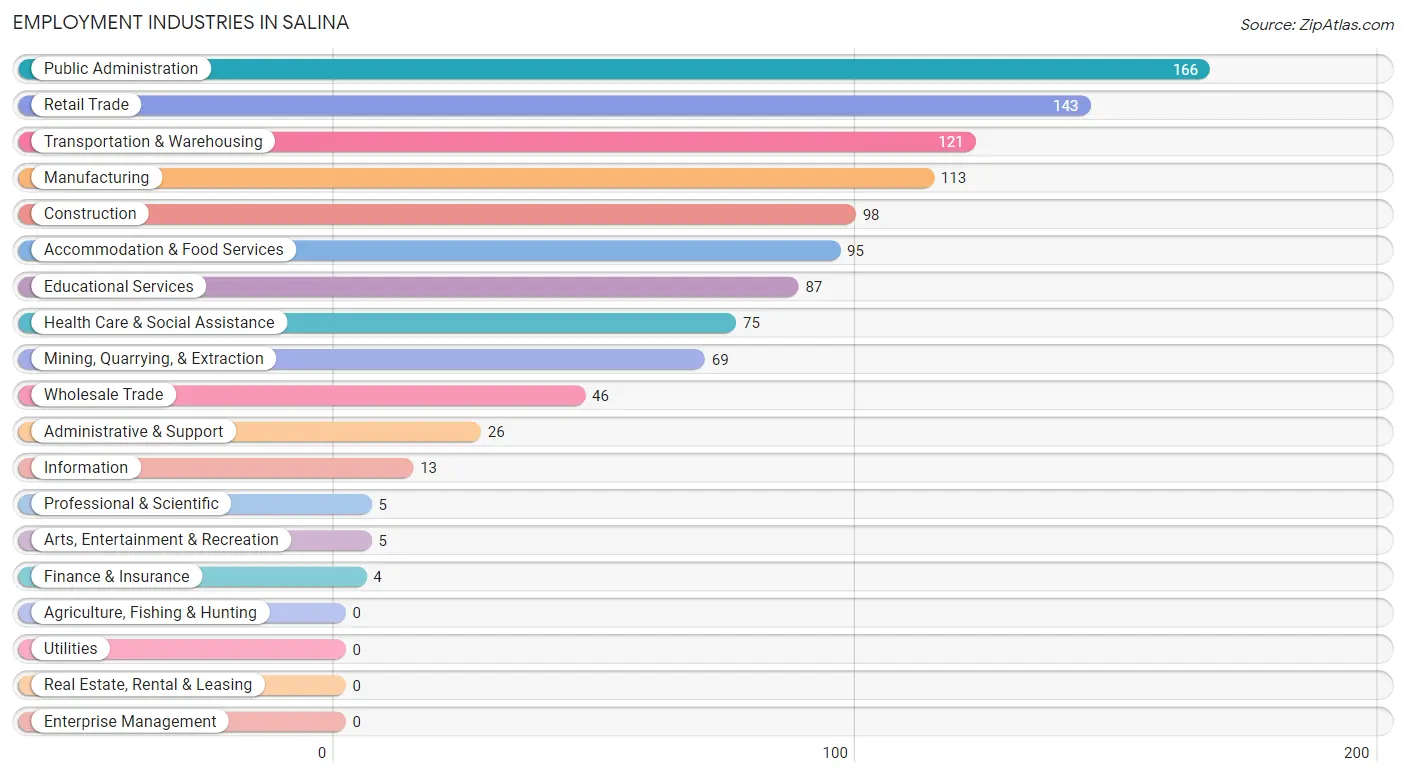
Employment Industries in Salina
The major employment industries in Salina include Public Administration (166 | 14.5%), Retail Trade (143 | 12.5%), Transportation & Warehousing (121 | 10.6%), Manufacturing (113 | 9.9%), and Construction (98 | 8.6%).
Employment Industries by Sex in Salina
The Salina industries that see more men than women are Arts, Entertainment & Recreation (100.0%), Construction (94.9%), and Wholesale Trade (87.0%), whereas the industries that tend to have a higher number of women are Finance & Insurance (100.0%), Professional & Scientific (100.0%), and Administrative & Support (100.0%).
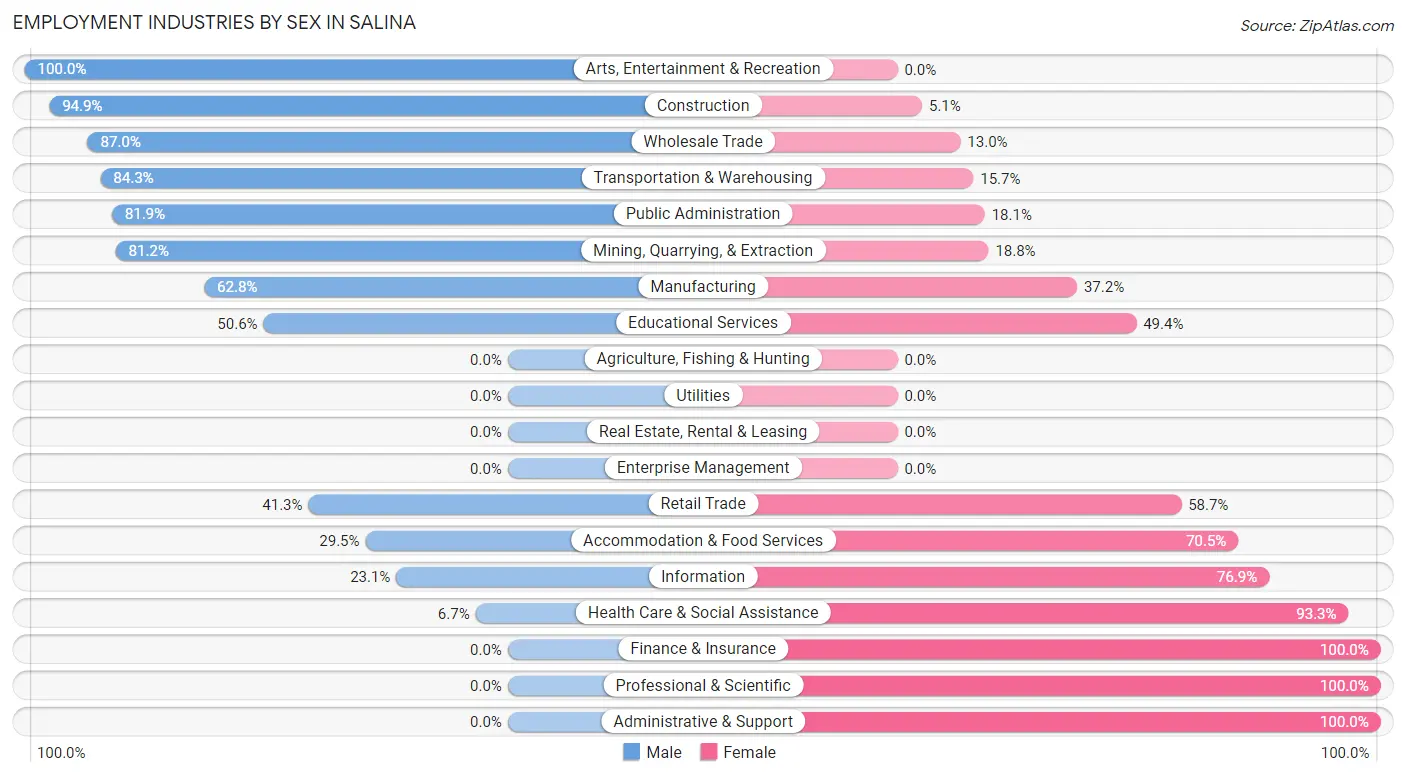
| Industry | Male | Female |
| Agriculture, Fishing & Hunting | 0 (0.0%) | 0 (0.0%) |
| Mining, Quarrying, & Extraction | 56 (81.2%) | 13 (18.8%) |
| Construction | 93 (94.9%) | 5 (5.1%) |
| Manufacturing | 71 (62.8%) | 42 (37.2%) |
| Wholesale Trade | 40 (87.0%) | 6 (13.0%) |
| Retail Trade | 59 (41.3%) | 84 (58.7%) |
| Transportation & Warehousing | 102 (84.3%) | 19 (15.7%) |
| Utilities | 0 (0.0%) | 0 (0.0%) |
| Information | 3 (23.1%) | 10 (76.9%) |
| Finance & Insurance | 0 (0.0%) | 4 (100.0%) |
| Real Estate, Rental & Leasing | 0 (0.0%) | 0 (0.0%) |
| Professional & Scientific | 0 (0.0%) | 5 (100.0%) |
| Enterprise Management | 0 (0.0%) | 0 (0.0%) |
| Administrative & Support | 0 (0.0%) | 26 (100.0%) |
| Educational Services | 44 (50.6%) | 43 (49.4%) |
| Health Care & Social Assistance | 5 (6.7%) | 70 (93.3%) |
| Arts, Entertainment & Recreation | 5 (100.0%) | 0 (0.0%) |
| Accommodation & Food Services | 28 (29.5%) | 67 (70.5%) |
| Public Administration | 136 (81.9%) | 30 (18.1%) |
| Total | 670 (58.5%) | 476 (41.5%) |
Education in Salina
School Enrollment in Salina
The most common levels of schooling among the 595 students in Salina are high school (209 | 35.1%), elementary school (115 | 19.3%), and middle school (109 | 18.3%).
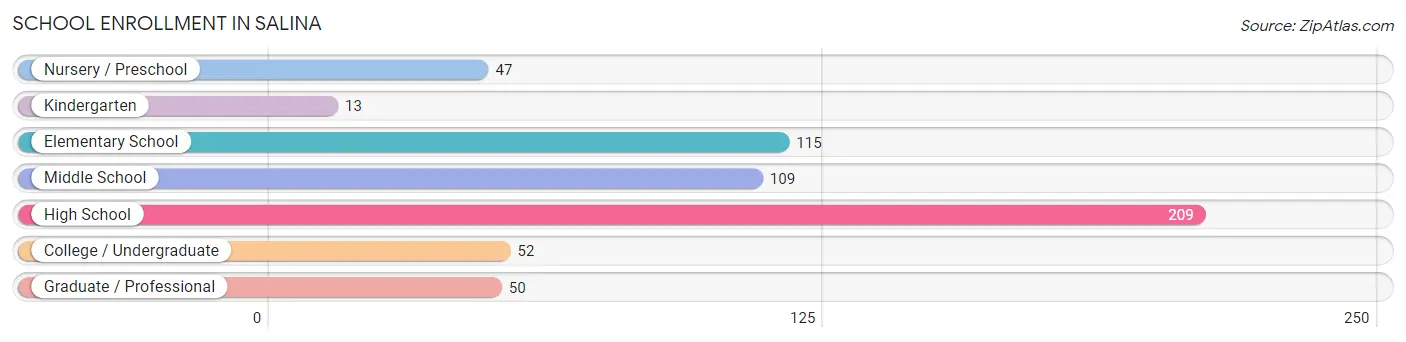
| School Level | # Students | % Students |
| Nursery / Preschool | 47 | 7.9% |
| Kindergarten | 13 | 2.2% |
| Elementary School | 115 | 19.3% |
| Middle School | 109 | 18.3% |
| High School | 209 | 35.1% |
| College / Undergraduate | 52 | 8.7% |
| Graduate / Professional | 50 | 8.4% |
| Total | 595 | 100.0% |
School Enrollment by Age by Funding Source in Salina
Out of a total of 595 students who are enrolled in schools in Salina, 35 (5.9%) attend a private institution, while the remaining 560 (94.1%) are enrolled in public schools. The age group of 25 to 34 year olds has the highest likelihood of being enrolled in private schools, with 21 (56.8% in the age bracket) enrolled. Conversely, the age group of 3 to 4 year olds has the lowest likelihood of being enrolled in a private school, with 47 (100.0% in the age bracket) attending a public institution.
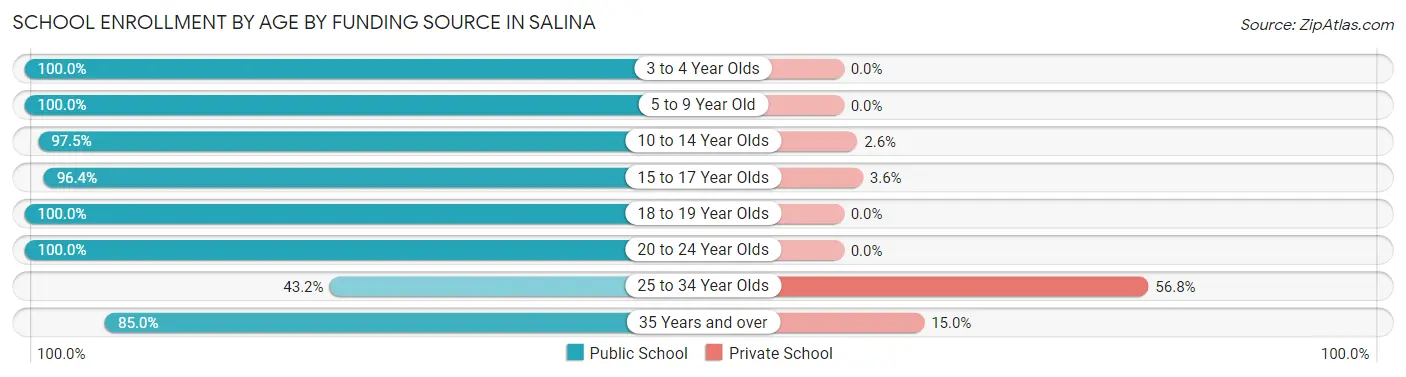
| Age Bracket | Public School | Private School |
| 3 to 4 Year Olds | 47 (100.0%) | 0 (0.0%) |
| 5 to 9 Year Old | 114 (100.0%) | 0 (0.0%) |
| 10 to 14 Year Olds | 191 (97.5%) | 5 (2.5%) |
| 15 to 17 Year Olds | 81 (96.4%) | 3 (3.6%) |
| 18 to 19 Year Olds | 58 (100.0%) | 0 (0.0%) |
| 20 to 24 Year Olds | 19 (100.0%) | 0 (0.0%) |
| 25 to 34 Year Olds | 16 (43.2%) | 21 (56.8%) |
| 35 Years and over | 34 (85.0%) | 6 (15.0%) |
| Total | 560 (94.1%) | 35 (5.9%) |
Educational Attainment by Field of Study in Salina
Education (60 | 21.8%), business (51 | 18.5%), liberal arts & history (38 | 13.8%), social sciences (35 | 12.7%), and science & technology (33 | 12.0%) are the most common fields of study among 275 individuals in Salina who have obtained a bachelor's degree or higher.
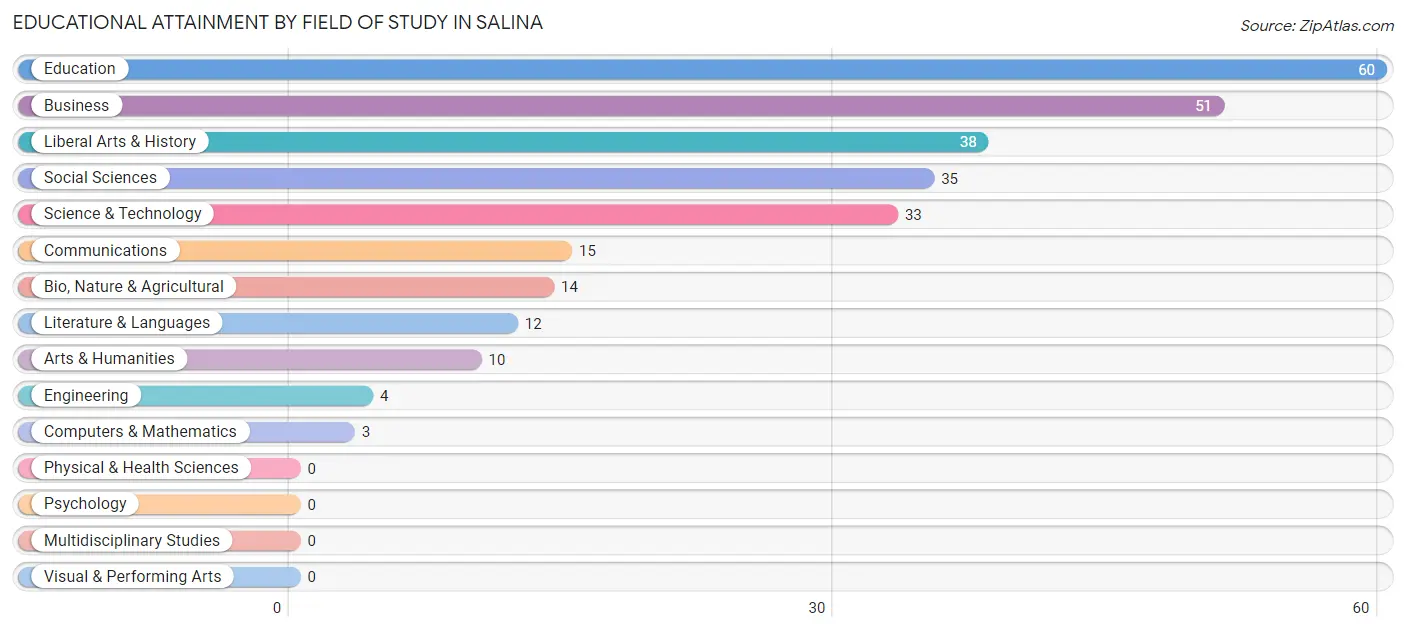
| Field of Study | # Graduates | % Graduates |
| Computers & Mathematics | 3 | 1.1% |
| Bio, Nature & Agricultural | 14 | 5.1% |
| Physical & Health Sciences | 0 | 0.0% |
| Psychology | 0 | 0.0% |
| Social Sciences | 35 | 12.7% |
| Engineering | 4 | 1.5% |
| Multidisciplinary Studies | 0 | 0.0% |
| Science & Technology | 33 | 12.0% |
| Business | 51 | 18.5% |
| Education | 60 | 21.8% |
| Literature & Languages | 12 | 4.4% |
| Liberal Arts & History | 38 | 13.8% |
| Visual & Performing Arts | 0 | 0.0% |
| Communications | 15 | 5.4% |
| Arts & Humanities | 10 | 3.6% |
| Total | 275 | 100.0% |
Transportation & Commute in Salina
Vehicle Availability by Sex in Salina
The most prevalent vehicle ownership categories in Salina are males with 2 vehicles (225, accounting for 34.8%) and females with 2 vehicles (147, making up 51.8%).
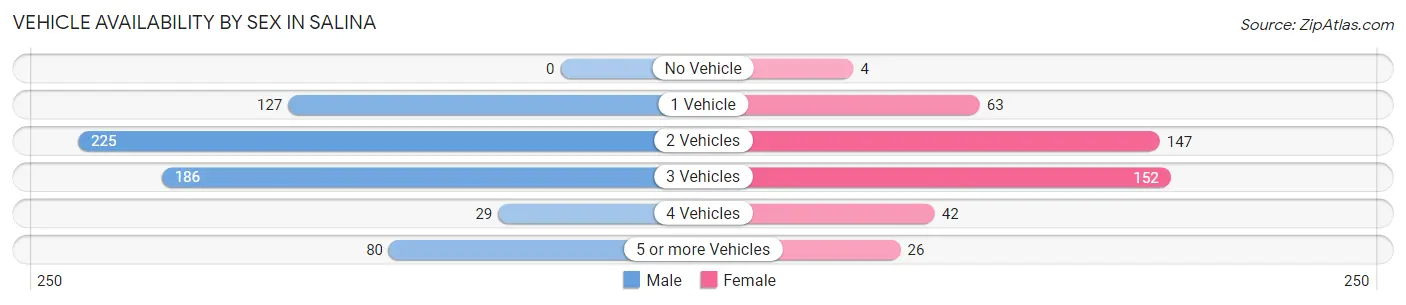
| Vehicles Available | Male | Female |
| No Vehicle | 0 (0.0%) | 4 (0.9%) |
| 1 Vehicle | 127 (19.6%) | 63 (14.5%) |
| 2 Vehicles | 225 (34.8%) | 147 (33.9%) |
| 3 Vehicles | 186 (28.7%) | 152 (35.0%) |
| 4 Vehicles | 29 (4.5%) | 42 (9.7%) |
| 5 or more Vehicles | 80 (12.4%) | 26 (6.0%) |
| Total | 647 (100.0%) | 434 (100.0%) |
Commute Time in Salina
The most frequently occuring commute durations in Salina are 20 to 24 minutes (219 commuters, 21.4%), 5 to 9 minutes (210 commuters, 20.5%), and less than 5 minutes (192 commuters, 18.8%).
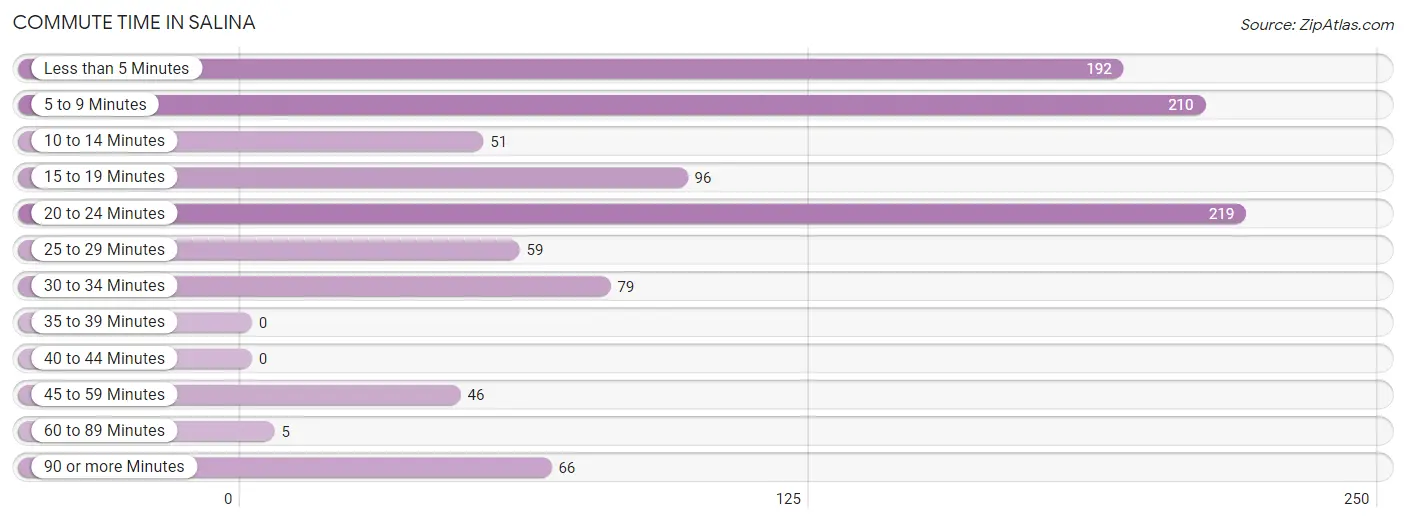
| Commute Time | # Commuters | % Commuters |
| Less than 5 Minutes | 192 | 18.8% |
| 5 to 9 Minutes | 210 | 20.5% |
| 10 to 14 Minutes | 51 | 5.0% |
| 15 to 19 Minutes | 96 | 9.4% |
| 20 to 24 Minutes | 219 | 21.4% |
| 25 to 29 Minutes | 59 | 5.8% |
| 30 to 34 Minutes | 79 | 7.7% |
| 35 to 39 Minutes | 0 | 0.0% |
| 40 to 44 Minutes | 0 | 0.0% |
| 45 to 59 Minutes | 46 | 4.5% |
| 60 to 89 Minutes | 5 | 0.5% |
| 90 or more Minutes | 66 | 6.5% |
Commute Time by Sex in Salina
The most common commute times in Salina are 5 to 9 minutes (160 commuters, 24.7%) for males and less than 5 minutes (95 commuters, 25.3%) for females.
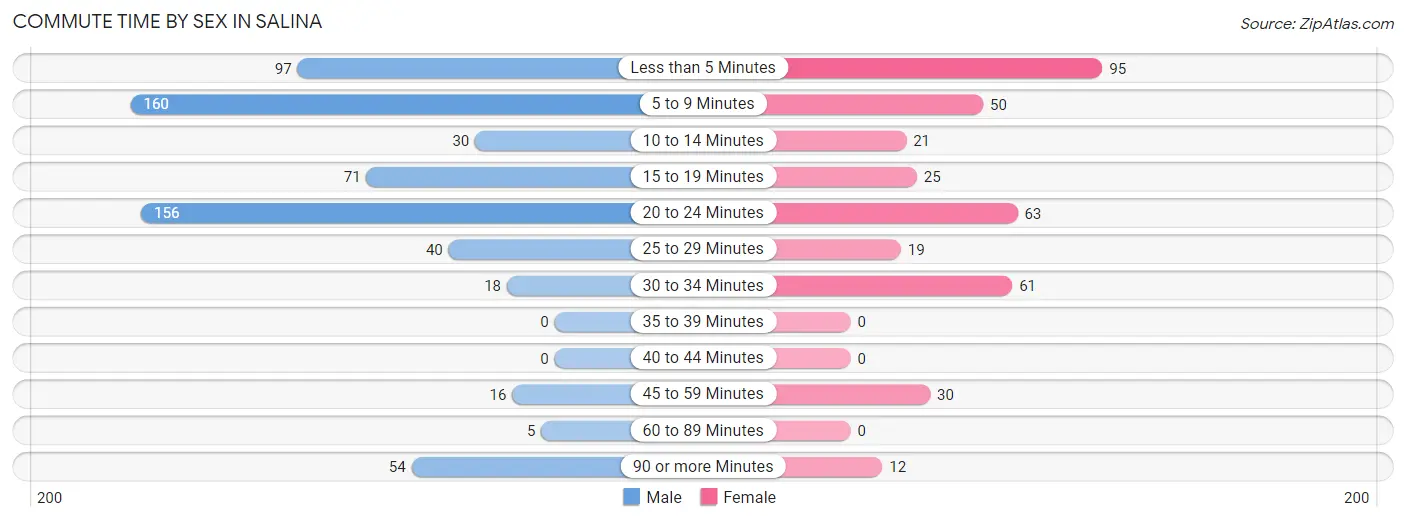
| Commute Time | Male | Female |
| Less than 5 Minutes | 97 (15.0%) | 95 (25.3%) |
| 5 to 9 Minutes | 160 (24.7%) | 50 (13.3%) |
| 10 to 14 Minutes | 30 (4.6%) | 21 (5.6%) |
| 15 to 19 Minutes | 71 (11.0%) | 25 (6.7%) |
| 20 to 24 Minutes | 156 (24.1%) | 63 (16.8%) |
| 25 to 29 Minutes | 40 (6.2%) | 19 (5.1%) |
| 30 to 34 Minutes | 18 (2.8%) | 61 (16.2%) |
| 35 to 39 Minutes | 0 (0.0%) | 0 (0.0%) |
| 40 to 44 Minutes | 0 (0.0%) | 0 (0.0%) |
| 45 to 59 Minutes | 16 (2.5%) | 30 (8.0%) |
| 60 to 89 Minutes | 5 (0.8%) | 0 (0.0%) |
| 90 or more Minutes | 54 (8.4%) | 12 (3.2%) |
Time of Departure to Work by Sex in Salina
The most frequent times of departure to work in Salina are 7:30 AM to 7:59 AM (131, 20.3%) for males and 7:30 AM to 7:59 AM (74, 19.7%) for females.
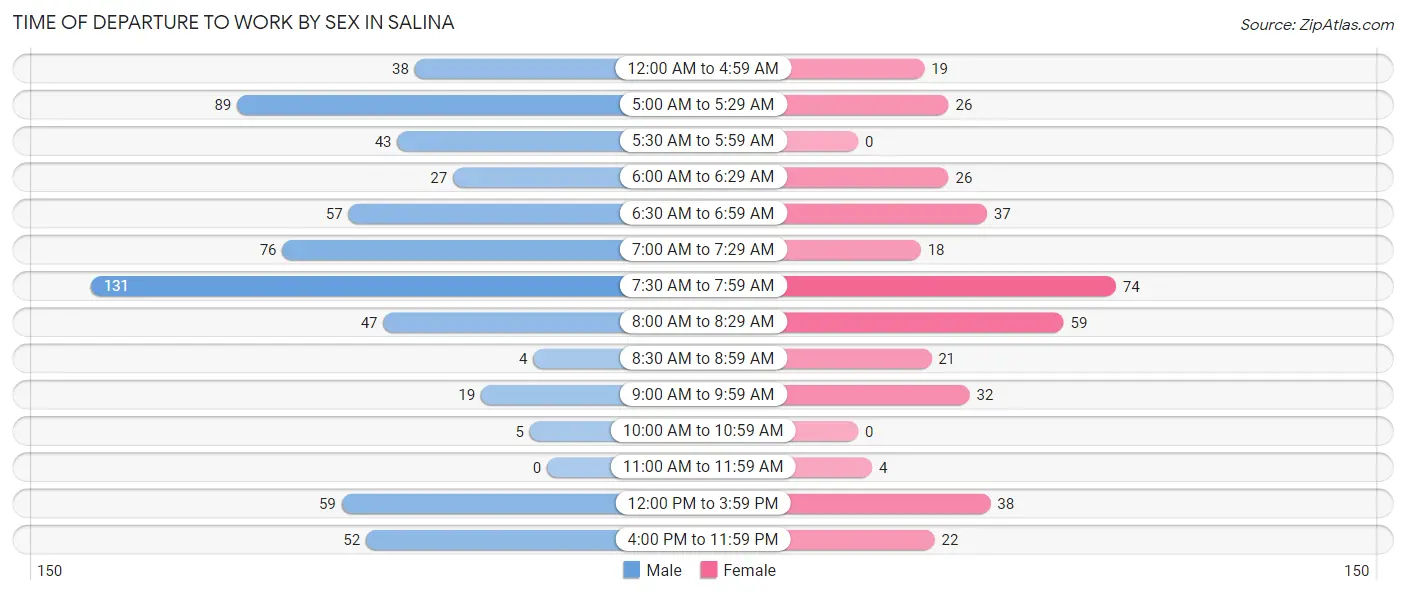
| Time of Departure | Male | Female |
| 12:00 AM to 4:59 AM | 38 (5.9%) | 19 (5.1%) |
| 5:00 AM to 5:29 AM | 89 (13.8%) | 26 (6.9%) |
| 5:30 AM to 5:59 AM | 43 (6.7%) | 0 (0.0%) |
| 6:00 AM to 6:29 AM | 27 (4.2%) | 26 (6.9%) |
| 6:30 AM to 6:59 AM | 57 (8.8%) | 37 (9.8%) |
| 7:00 AM to 7:29 AM | 76 (11.7%) | 18 (4.8%) |
| 7:30 AM to 7:59 AM | 131 (20.3%) | 74 (19.7%) |
| 8:00 AM to 8:29 AM | 47 (7.3%) | 59 (15.7%) |
| 8:30 AM to 8:59 AM | 4 (0.6%) | 21 (5.6%) |
| 9:00 AM to 9:59 AM | 19 (2.9%) | 32 (8.5%) |
| 10:00 AM to 10:59 AM | 5 (0.8%) | 0 (0.0%) |
| 11:00 AM to 11:59 AM | 0 (0.0%) | 4 (1.1%) |
| 12:00 PM to 3:59 PM | 59 (9.1%) | 38 (10.1%) |
| 4:00 PM to 11:59 PM | 52 (8.0%) | 22 (5.9%) |
| Total | 647 (100.0%) | 376 (100.0%) |
Housing Occupancy in Salina
Occupancy by Ownership in Salina
Of the total 982 dwellings in Salina, owner-occupied units account for 736 (75.0%), while renter-occupied units make up 246 (25.1%).
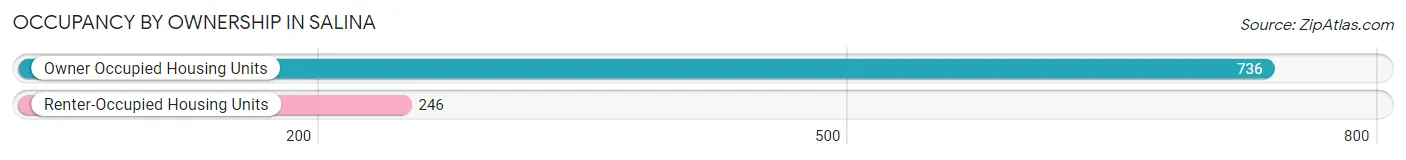
| Occupancy | # Housing Units | % Housing Units |
| Owner Occupied Housing Units | 736 | 75.0% |
| Renter-Occupied Housing Units | 246 | 25.1% |
| Total Occupied Housing Units | 982 | 100.0% |
Occupancy by Household Size in Salina
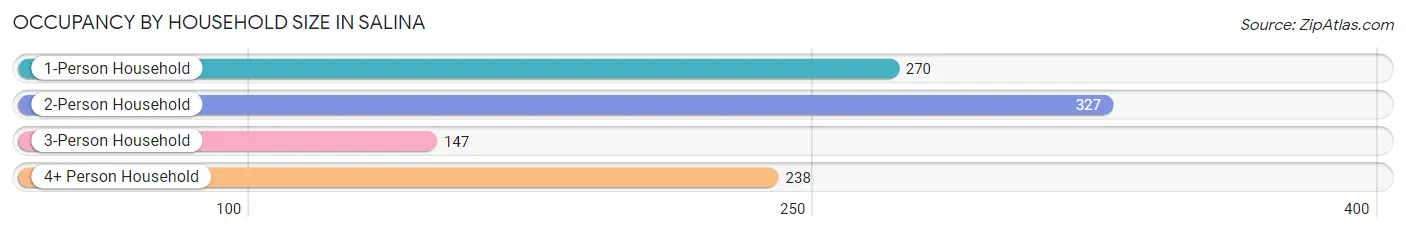
| Household Size | # Housing Units | % Housing Units |
| 1-Person Household | 270 | 27.5% |
| 2-Person Household | 327 | 33.3% |
| 3-Person Household | 147 | 15.0% |
| 4+ Person Household | 238 | 24.2% |
| Total Housing Units | 982 | 100.0% |
Occupancy by Ownership by Household Size in Salina
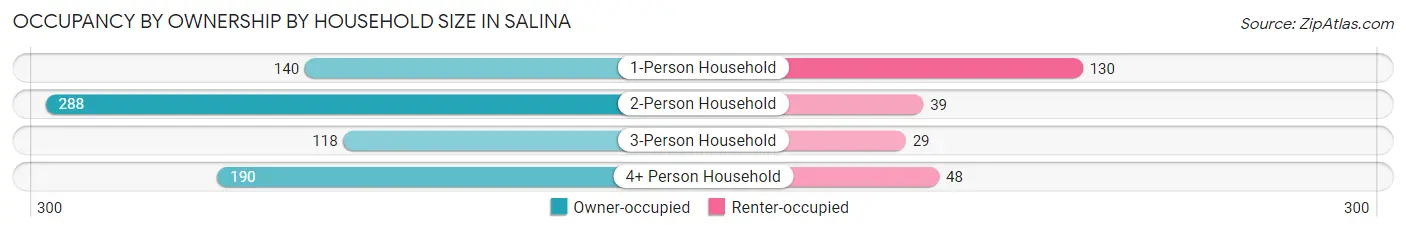
| Household Size | Owner-occupied | Renter-occupied |
| 1-Person Household | 140 (51.8%) | 130 (48.1%) |
| 2-Person Household | 288 (88.1%) | 39 (11.9%) |
| 3-Person Household | 118 (80.3%) | 29 (19.7%) |
| 4+ Person Household | 190 (79.8%) | 48 (20.2%) |
| Total Housing Units | 736 (75.0%) | 246 (25.1%) |
Occupancy by Educational Attainment in Salina
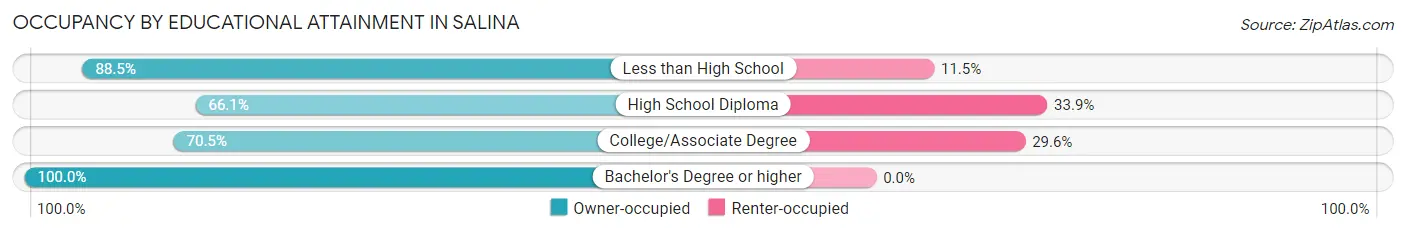
| Household Size | Owner-occupied | Renter-occupied |
| Less than High School | 54 (88.5%) | 7 (11.5%) |
| High School Diploma | 273 (66.1%) | 140 (33.9%) |
| College/Associate Degree | 236 (70.5%) | 99 (29.5%) |
| Bachelor's Degree or higher | 173 (100.0%) | 0 (0.0%) |
Occupancy by Age of Householder in Salina
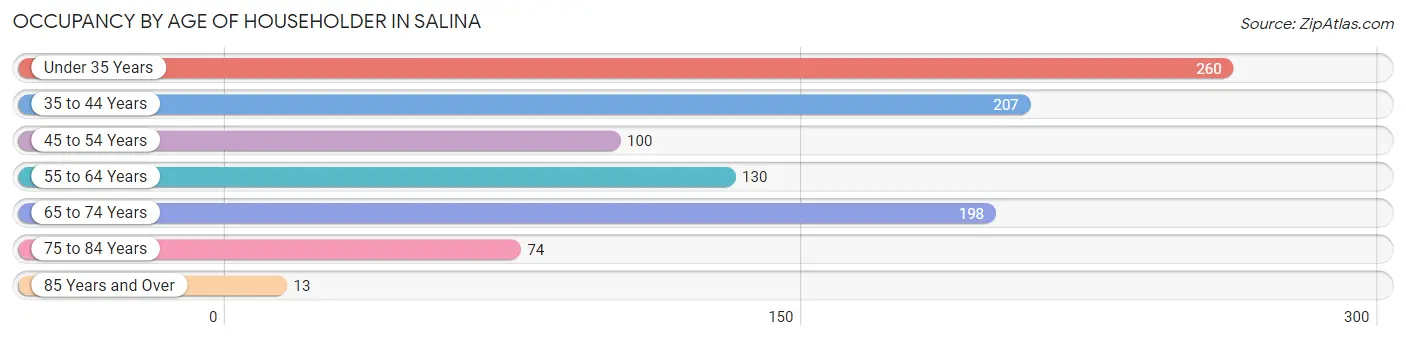
| Age Bracket | # Households | % Households |
| Under 35 Years | 260 | 26.5% |
| 35 to 44 Years | 207 | 21.1% |
| 45 to 54 Years | 100 | 10.2% |
| 55 to 64 Years | 130 | 13.2% |
| 65 to 74 Years | 198 | 20.2% |
| 75 to 84 Years | 74 | 7.5% |
| 85 Years and Over | 13 | 1.3% |
| Total | 982 | 100.0% |
Housing Finances in Salina
Median Income by Occupancy in Salina
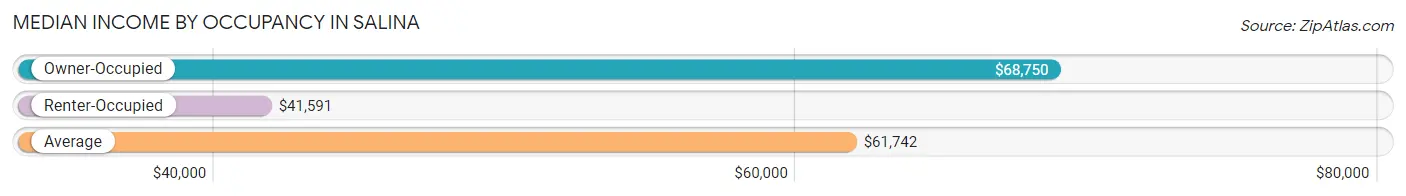
| Occupancy Type | # Households | Median Income |
| Owner-Occupied | 736 (75.0%) | $68,750 |
| Renter-Occupied | 246 (25.1%) | $41,591 |
| Average | 982 (100.0%) | $61,742 |
Occupancy by Householder Income Bracket in Salina
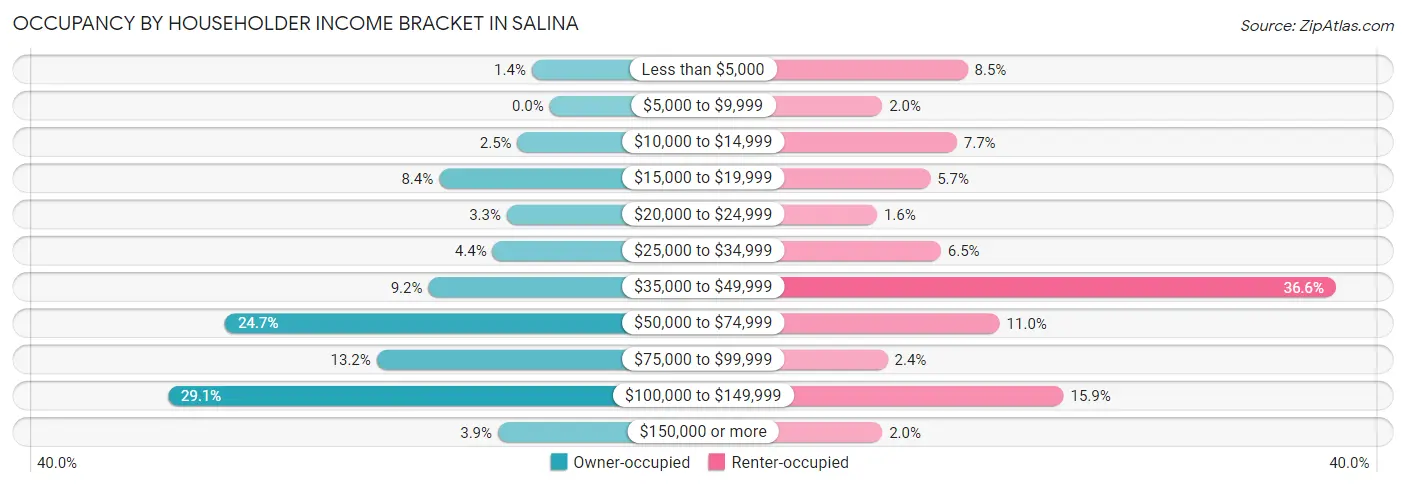
| Income Bracket | Owner-occupied | Renter-occupied |
| Less than $5,000 | 10 (1.4%) | 21 (8.5%) |
| $5,000 to $9,999 | 0 (0.0%) | 5 (2.0%) |
| $10,000 to $14,999 | 18 (2.5%) | 19 (7.7%) |
| $15,000 to $19,999 | 62 (8.4%) | 14 (5.7%) |
| $20,000 to $24,999 | 24 (3.3%) | 4 (1.6%) |
| $25,000 to $34,999 | 32 (4.3%) | 16 (6.5%) |
| $35,000 to $49,999 | 68 (9.2%) | 90 (36.6%) |
| $50,000 to $74,999 | 182 (24.7%) | 27 (11.0%) |
| $75,000 to $99,999 | 97 (13.2%) | 6 (2.4%) |
| $100,000 to $149,999 | 214 (29.1%) | 39 (15.9%) |
| $150,000 or more | 29 (3.9%) | 5 (2.0%) |
| Total | 736 (100.0%) | 246 (100.0%) |
Monthly Housing Cost Tiers in Salina
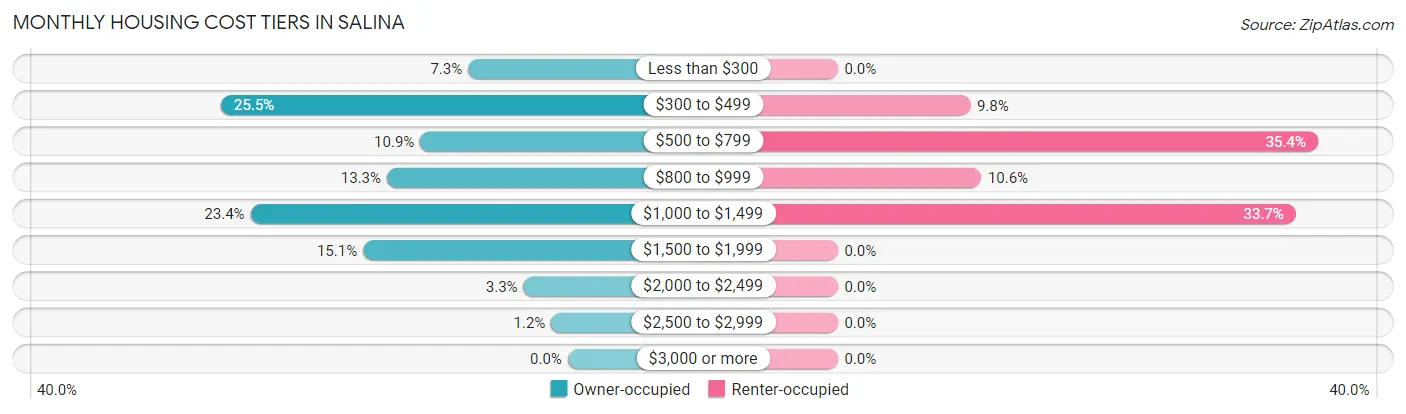
| Monthly Cost | Owner-occupied | Renter-occupied |
| Less than $300 | 54 (7.3%) | 0 (0.0%) |
| $300 to $499 | 188 (25.5%) | 24 (9.8%) |
| $500 to $799 | 80 (10.9%) | 87 (35.4%) |
| $800 to $999 | 98 (13.3%) | 26 (10.6%) |
| $1,000 to $1,499 | 172 (23.4%) | 83 (33.7%) |
| $1,500 to $1,999 | 111 (15.1%) | 0 (0.0%) |
| $2,000 to $2,499 | 24 (3.3%) | 0 (0.0%) |
| $2,500 to $2,999 | 9 (1.2%) | 0 (0.0%) |
| $3,000 or more | 0 (0.0%) | 0 (0.0%) |
| Total | 736 (100.0%) | 246 (100.0%) |
Physical Housing Characteristics in Salina
Housing Structures in Salina
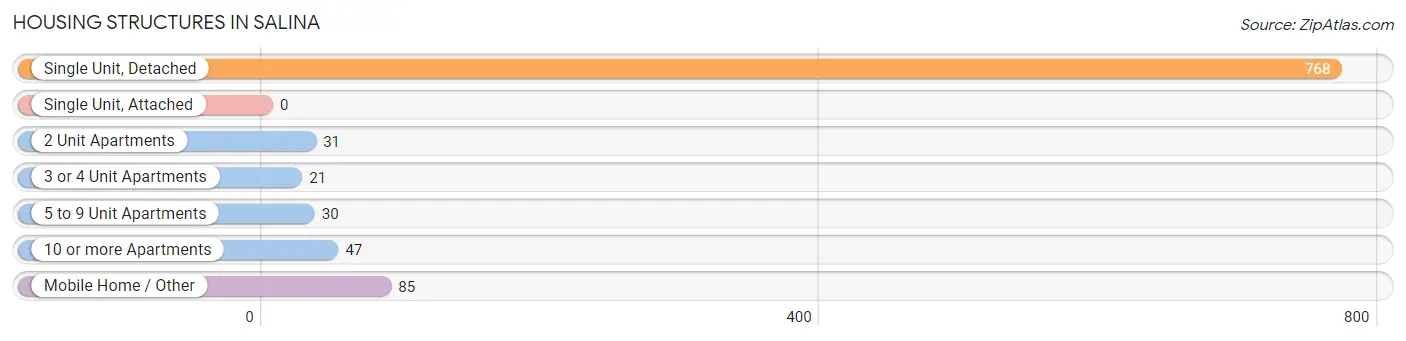
| Structure Type | # Housing Units | % Housing Units |
| Single Unit, Detached | 768 | 78.2% |
| Single Unit, Attached | 0 | 0.0% |
| 2 Unit Apartments | 31 | 3.2% |
| 3 or 4 Unit Apartments | 21 | 2.1% |
| 5 to 9 Unit Apartments | 30 | 3.0% |
| 10 or more Apartments | 47 | 4.8% |
| Mobile Home / Other | 85 | 8.7% |
| Total | 982 | 100.0% |
Housing Structures by Occupancy in Salina
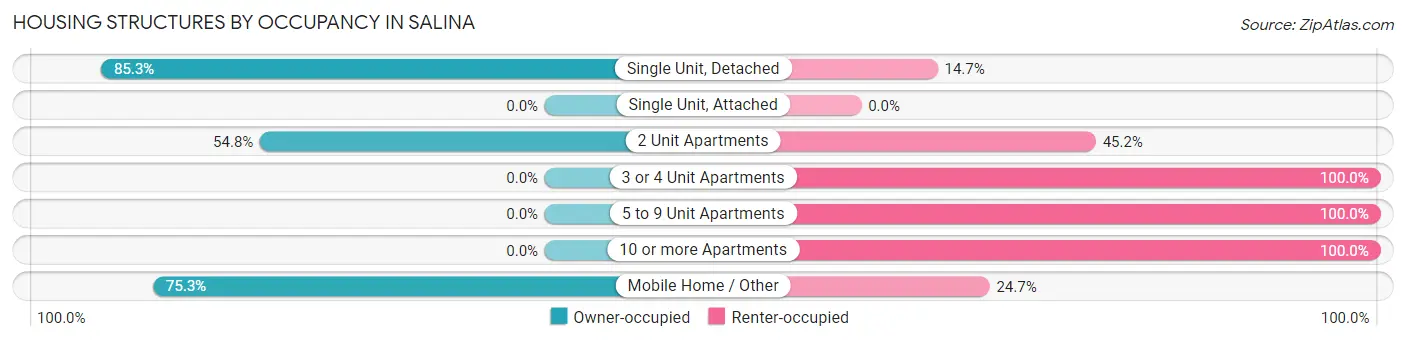
| Structure Type | Owner-occupied | Renter-occupied |
| Single Unit, Detached | 655 (85.3%) | 113 (14.7%) |
| Single Unit, Attached | 0 (0.0%) | 0 (0.0%) |
| 2 Unit Apartments | 17 (54.8%) | 14 (45.2%) |
| 3 or 4 Unit Apartments | 0 (0.0%) | 21 (100.0%) |
| 5 to 9 Unit Apartments | 0 (0.0%) | 30 (100.0%) |
| 10 or more Apartments | 0 (0.0%) | 47 (100.0%) |
| Mobile Home / Other | 64 (75.3%) | 21 (24.7%) |
| Total | 736 (75.0%) | 246 (25.1%) |
Housing Structures by Number of Rooms in Salina
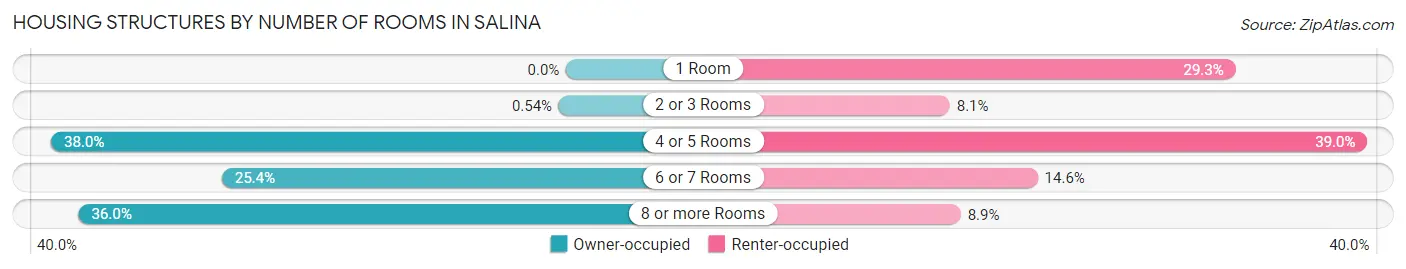
| Number of Rooms | Owner-occupied | Renter-occupied |
| 1 Room | 0 (0.0%) | 72 (29.3%) |
| 2 or 3 Rooms | 4 (0.5%) | 20 (8.1%) |
| 4 or 5 Rooms | 280 (38.0%) | 96 (39.0%) |
| 6 or 7 Rooms | 187 (25.4%) | 36 (14.6%) |
| 8 or more Rooms | 265 (36.0%) | 22 (8.9%) |
| Total | 736 (100.0%) | 246 (100.0%) |
Housing Structure by Heating Type in Salina
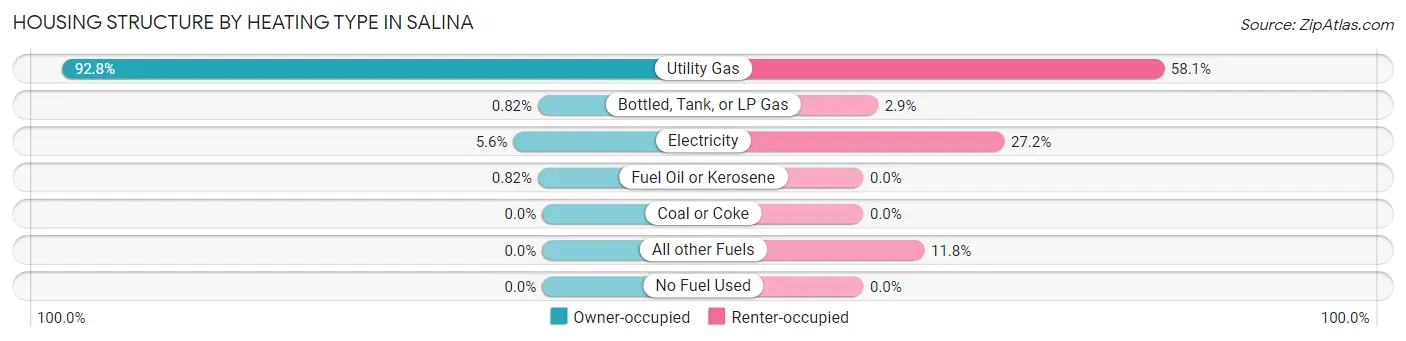
| Heating Type | Owner-occupied | Renter-occupied |
| Utility Gas | 683 (92.8%) | 143 (58.1%) |
| Bottled, Tank, or LP Gas | 6 (0.8%) | 7 (2.9%) |
| Electricity | 41 (5.6%) | 67 (27.2%) |
| Fuel Oil or Kerosene | 6 (0.8%) | 0 (0.0%) |
| Coal or Coke | 0 (0.0%) | 0 (0.0%) |
| All other Fuels | 0 (0.0%) | 29 (11.8%) |
| No Fuel Used | 0 (0.0%) | 0 (0.0%) |
| Total | 736 (100.0%) | 246 (100.0%) |
Household Vehicle Usage in Salina
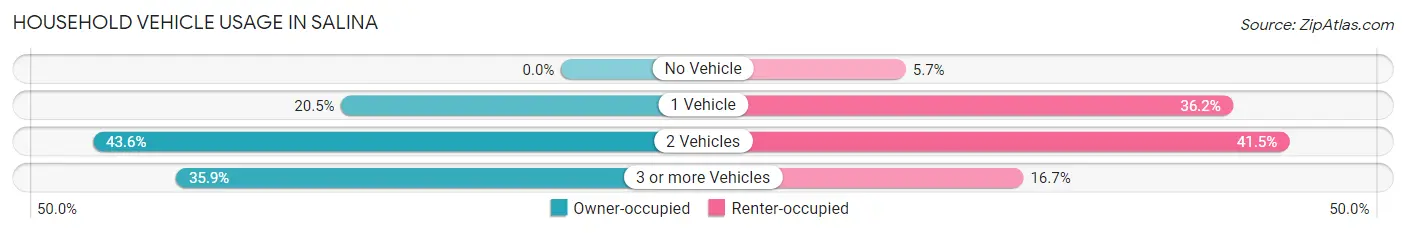
| Vehicles per Household | Owner-occupied | Renter-occupied |
| No Vehicle | 0 (0.0%) | 14 (5.7%) |
| 1 Vehicle | 151 (20.5%) | 89 (36.2%) |
| 2 Vehicles | 321 (43.6%) | 102 (41.5%) |
| 3 or more Vehicles | 264 (35.9%) | 41 (16.7%) |
| Total | 736 (100.0%) | 246 (100.0%) |
Real Estate & Mortgages in Salina
Real Estate and Mortgage Overview in Salina
| Characteristic | Without Mortgage | With Mortgage |
| Housing Units | 282 | 454 |
| Median Property Value | $260,700 | $217,600 |
| Median Household Income | $52,083 | $15 |
| Monthly Housing Costs | $343 | $0 |
| Real Estate Taxes | $1,022 | $0 |
Property Value by Mortgage Status in Salina
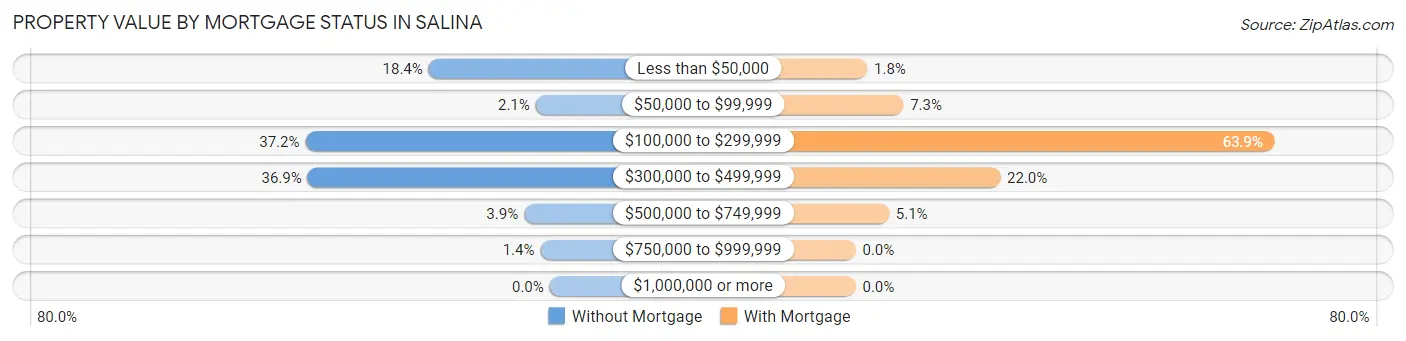
| Property Value | Without Mortgage | With Mortgage |
| Less than $50,000 | 52 (18.4%) | 8 (1.8%) |
| $50,000 to $99,999 | 6 (2.1%) | 33 (7.3%) |
| $100,000 to $299,999 | 105 (37.2%) | 290 (63.9%) |
| $300,000 to $499,999 | 104 (36.9%) | 100 (22.0%) |
| $500,000 to $749,999 | 11 (3.9%) | 23 (5.1%) |
| $750,000 to $999,999 | 4 (1.4%) | 0 (0.0%) |
| $1,000,000 or more | 0 (0.0%) | 0 (0.0%) |
| Total | 282 (100.0%) | 454 (100.0%) |
Household Income by Mortgage Status in Salina
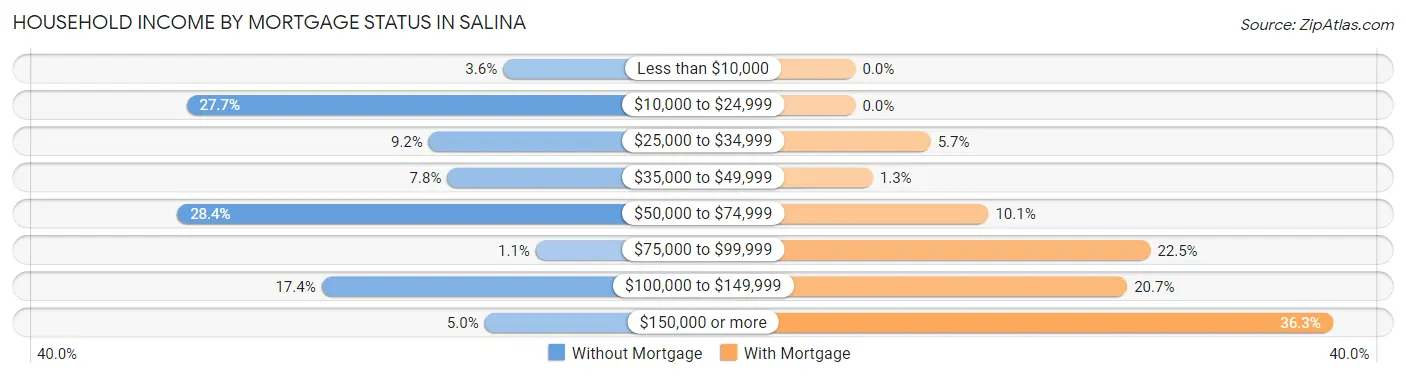
| Household Income | Without Mortgage | With Mortgage |
| Less than $10,000 | 10 (3.5%) | 0 (0.0%) |
| $10,000 to $24,999 | 78 (27.7%) | 0 (0.0%) |
| $25,000 to $34,999 | 26 (9.2%) | 26 (5.7%) |
| $35,000 to $49,999 | 22 (7.8%) | 6 (1.3%) |
| $50,000 to $74,999 | 80 (28.4%) | 46 (10.1%) |
| $75,000 to $99,999 | 3 (1.1%) | 102 (22.5%) |
| $100,000 to $149,999 | 49 (17.4%) | 94 (20.7%) |
| $150,000 or more | 14 (5.0%) | 165 (36.3%) |
| Total | 282 (100.0%) | 454 (100.0%) |
Property Value to Household Income Ratio in Salina
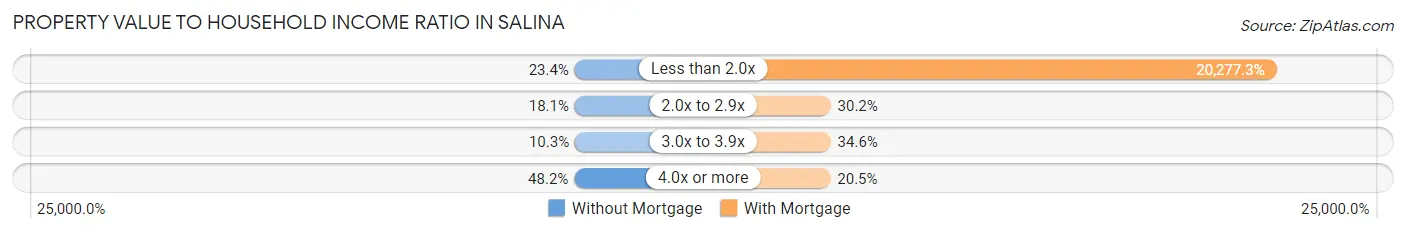
| Value-to-Income Ratio | Without Mortgage | With Mortgage |
| Less than 2.0x | 66 (23.4%) | 92,059 (20,277.3%) |
| 2.0x to 2.9x | 51 (18.1%) | 137 (30.2%) |
| 3.0x to 3.9x | 29 (10.3%) | 157 (34.6%) |
| 4.0x or more | 136 (48.2%) | 93 (20.5%) |
| Total | 282 (100.0%) | 454 (100.0%) |
Real Estate Taxes by Mortgage Status in Salina
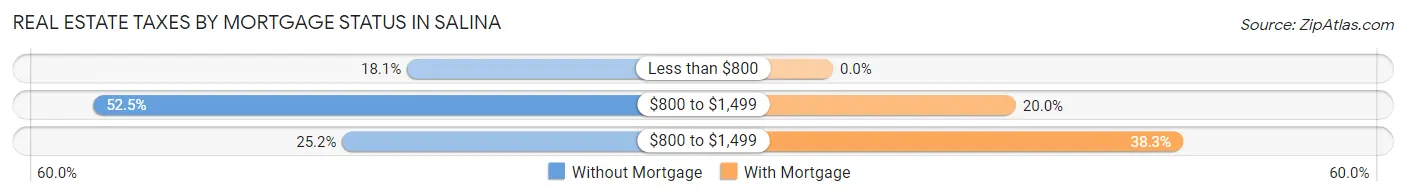
| Property Taxes | Without Mortgage | With Mortgage |
| Less than $800 | 51 (18.1%) | 0 (0.0%) |
| $800 to $1,499 | 148 (52.5%) | 91 (20.0%) |
| $800 to $1,499 | 71 (25.2%) | 174 (38.3%) |
| Total | 282 (100.0%) | 454 (100.0%) |
Health & Disability in Salina
Health Insurance Coverage by Age in Salina
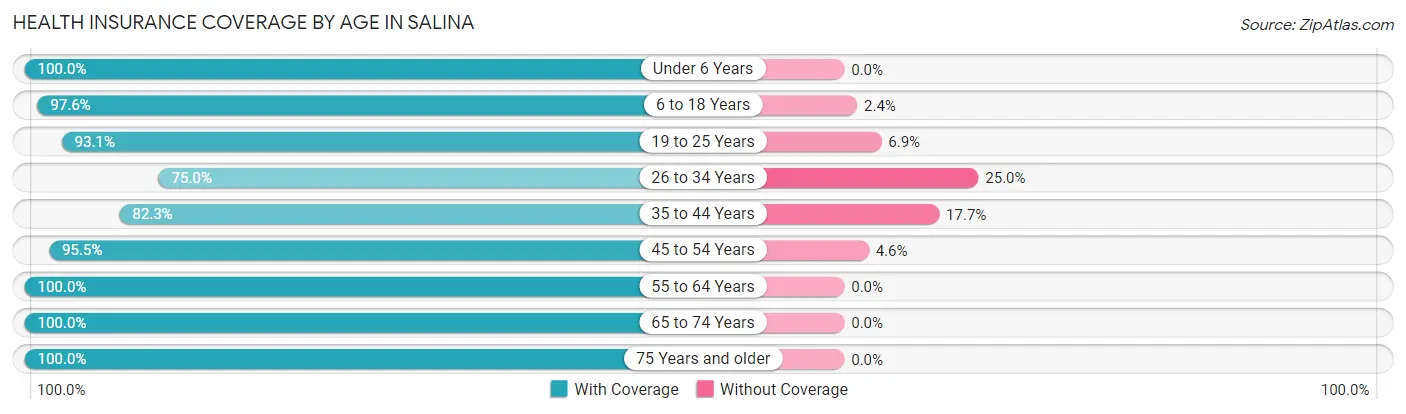
| Age Bracket | With Coverage | Without Coverage |
| Under 6 Years | 197 (100.0%) | 0 (0.0%) |
| 6 to 18 Years | 449 (97.6%) | 11 (2.4%) |
| 19 to 25 Years | 229 (93.1%) | 17 (6.9%) |
| 26 to 34 Years | 189 (75.0%) | 63 (25.0%) |
| 35 to 44 Years | 363 (82.3%) | 78 (17.7%) |
| 45 to 54 Years | 231 (95.5%) | 11 (4.5%) |
| 55 to 64 Years | 243 (100.0%) | 0 (0.0%) |
| 65 to 74 Years | 303 (100.0%) | 0 (0.0%) |
| 75 Years and older | 116 (100.0%) | 0 (0.0%) |
| Total | 2,320 (92.8%) | 180 (7.2%) |
Health Insurance Coverage by Citizenship Status in Salina
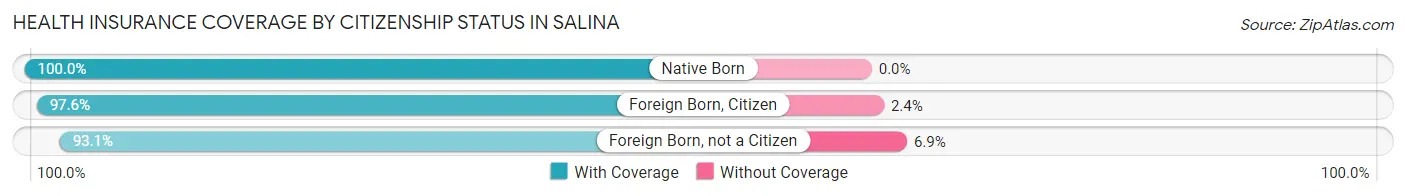
| Citizenship Status | With Coverage | Without Coverage |
| Native Born | 197 (100.0%) | 0 (0.0%) |
| Foreign Born, Citizen | 449 (97.6%) | 11 (2.4%) |
| Foreign Born, not a Citizen | 229 (93.1%) | 17 (6.9%) |
Health Insurance Coverage by Household Income in Salina
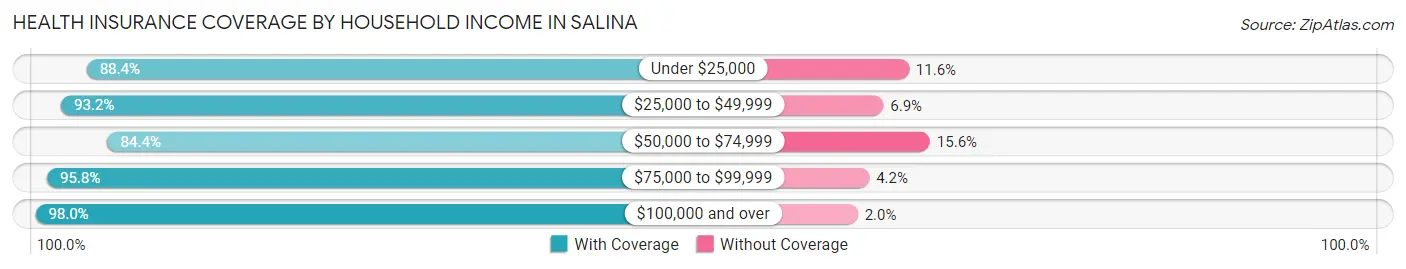
| Household Income | With Coverage | Without Coverage |
| Under $25,000 | 258 (88.4%) | 34 (11.6%) |
| $25,000 to $49,999 | 449 (93.1%) | 33 (6.9%) |
| $50,000 to $74,999 | 450 (84.4%) | 83 (15.6%) |
| $75,000 to $99,999 | 251 (95.8%) | 11 (4.2%) |
| $100,000 and over | 912 (98.0%) | 19 (2.0%) |
Public vs Private Health Insurance Coverage by Age in Salina
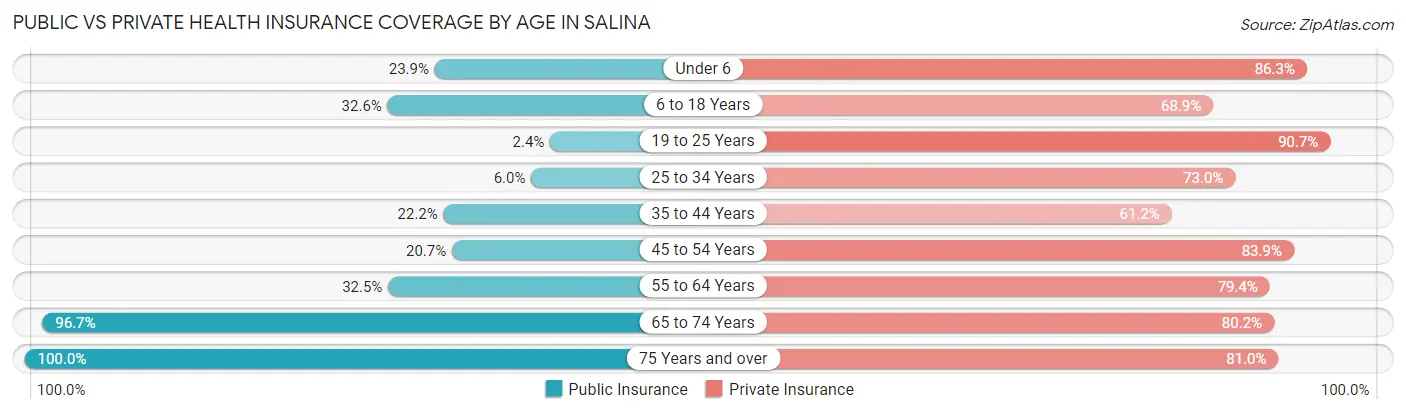
| Age Bracket | Public Insurance | Private Insurance |
| Under 6 | 47 (23.9%) | 170 (86.3%) |
| 6 to 18 Years | 150 (32.6%) | 317 (68.9%) |
| 19 to 25 Years | 6 (2.4%) | 223 (90.6%) |
| 25 to 34 Years | 15 (5.9%) | 184 (73.0%) |
| 35 to 44 Years | 98 (22.2%) | 270 (61.2%) |
| 45 to 54 Years | 50 (20.7%) | 203 (83.9%) |
| 55 to 64 Years | 79 (32.5%) | 193 (79.4%) |
| 65 to 74 Years | 293 (96.7%) | 243 (80.2%) |
| 75 Years and over | 116 (100.0%) | 94 (81.0%) |
| Total | 854 (34.2%) | 1,897 (75.9%) |
Disability Status by Sex by Age in Salina
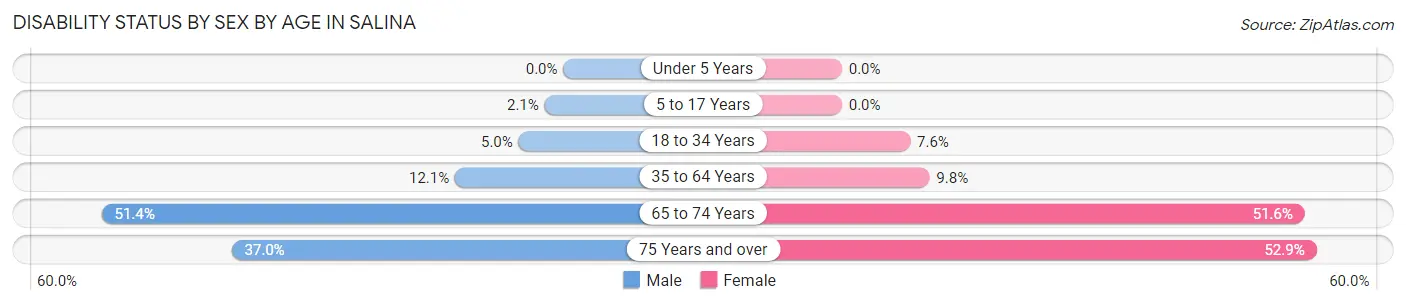
| Age Bracket | Male | Female |
| Under 5 Years | 0 (0.0%) | 0 (0.0%) |
| 5 to 17 Years | 5 (2.1%) | 0 (0.0%) |
| 18 to 34 Years | 13 (5.0%) | 22 (7.6%) |
| 35 to 64 Years | 61 (12.1%) | 41 (9.8%) |
| 65 to 74 Years | 90 (51.4%) | 66 (51.6%) |
| 75 Years and over | 17 (37.0%) | 37 (52.9%) |
Disability Class by Sex by Age in Salina
Disability Class: Hearing Difficulty
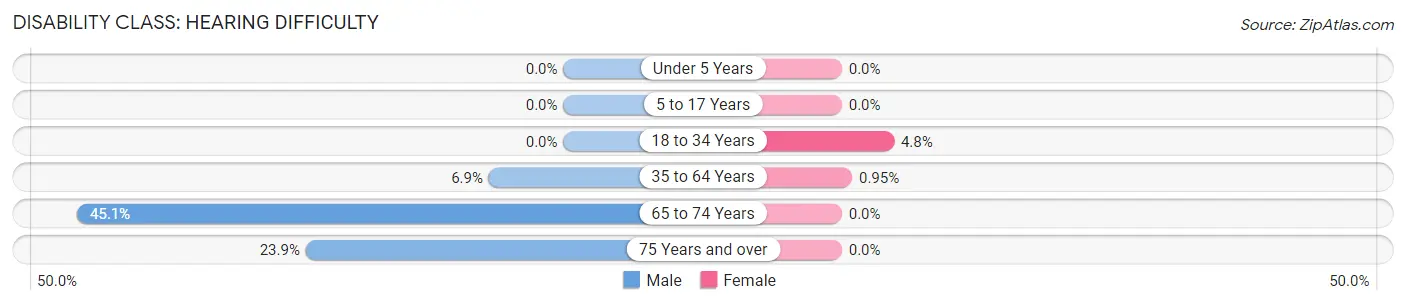
| Age Bracket | Male | Female |
| Under 5 Years | 0 (0.0%) | 0 (0.0%) |
| 5 to 17 Years | 0 (0.0%) | 0 (0.0%) |
| 18 to 34 Years | 0 (0.0%) | 14 (4.8%) |
| 35 to 64 Years | 35 (6.9%) | 4 (0.9%) |
| 65 to 74 Years | 79 (45.1%) | 0 (0.0%) |
| 75 Years and over | 11 (23.9%) | 0 (0.0%) |
Disability Class: Vision Difficulty
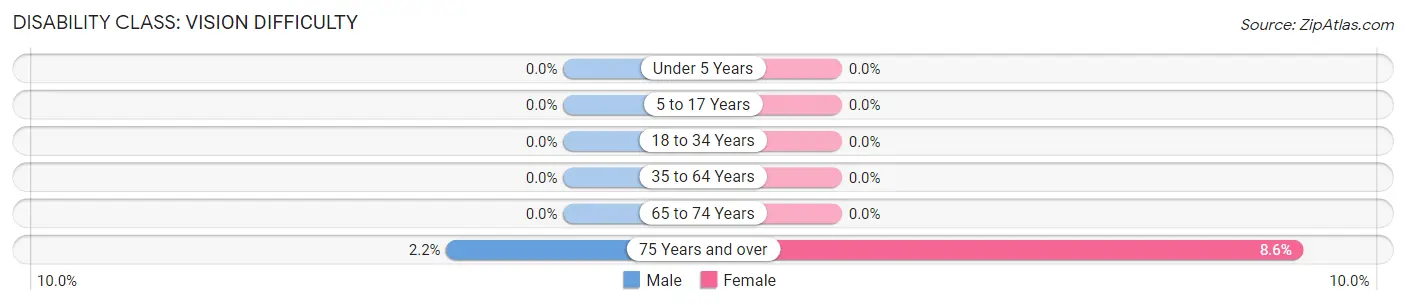
| Age Bracket | Male | Female |
| Under 5 Years | 0 (0.0%) | 0 (0.0%) |
| 5 to 17 Years | 0 (0.0%) | 0 (0.0%) |
| 18 to 34 Years | 0 (0.0%) | 0 (0.0%) |
| 35 to 64 Years | 0 (0.0%) | 0 (0.0%) |
| 65 to 74 Years | 0 (0.0%) | 0 (0.0%) |
| 75 Years and over | 1 (2.2%) | 6 (8.6%) |
Disability Class: Cognitive Difficulty
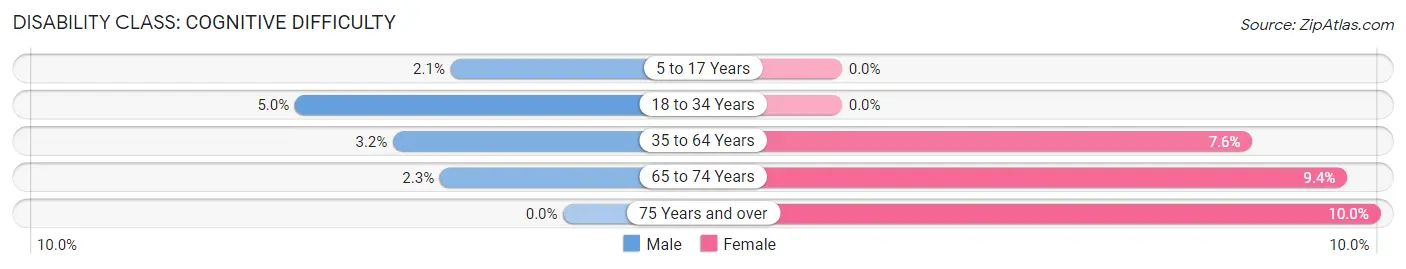
| Age Bracket | Male | Female |
| 5 to 17 Years | 5 (2.1%) | 0 (0.0%) |
| 18 to 34 Years | 13 (5.0%) | 0 (0.0%) |
| 35 to 64 Years | 16 (3.2%) | 32 (7.6%) |
| 65 to 74 Years | 4 (2.3%) | 12 (9.4%) |
| 75 Years and over | 0 (0.0%) | 7 (10.0%) |
Disability Class: Ambulatory Difficulty
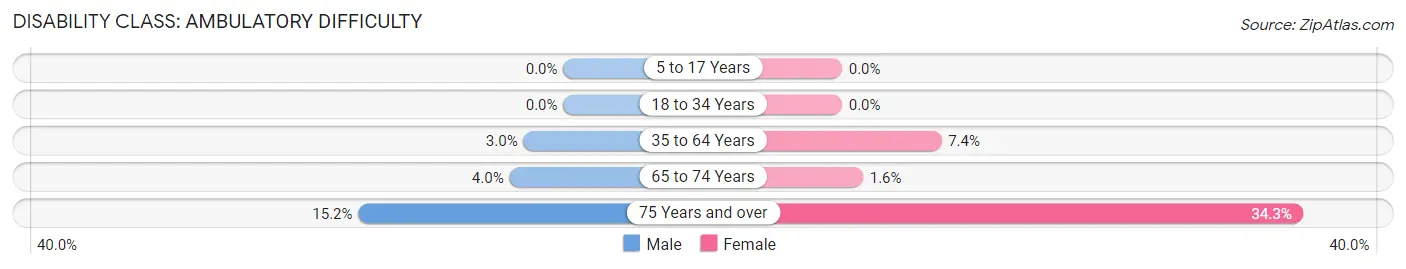
| Age Bracket | Male | Female |
| 5 to 17 Years | 0 (0.0%) | 0 (0.0%) |
| 18 to 34 Years | 0 (0.0%) | 0 (0.0%) |
| 35 to 64 Years | 15 (3.0%) | 31 (7.4%) |
| 65 to 74 Years | 7 (4.0%) | 2 (1.6%) |
| 75 Years and over | 7 (15.2%) | 24 (34.3%) |
Disability Class: Self-Care Difficulty
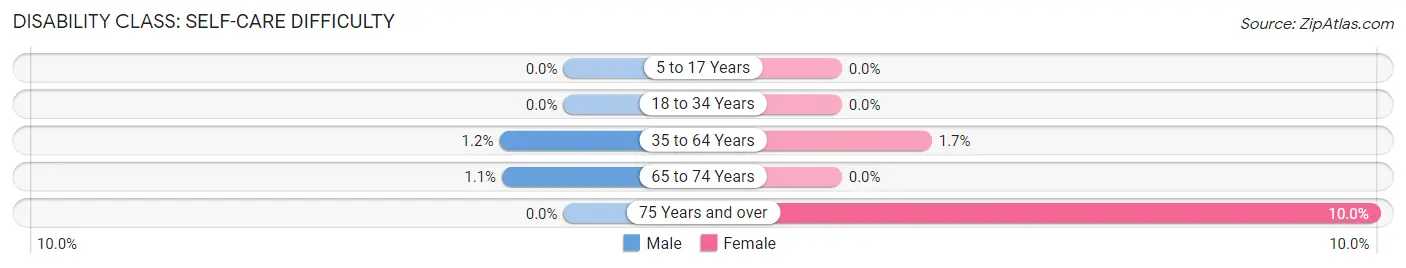
| Age Bracket | Male | Female |
| 5 to 17 Years | 0 (0.0%) | 0 (0.0%) |
| 18 to 34 Years | 0 (0.0%) | 0 (0.0%) |
| 35 to 64 Years | 6 (1.2%) | 7 (1.7%) |
| 65 to 74 Years | 2 (1.1%) | 0 (0.0%) |
| 75 Years and over | 0 (0.0%) | 7 (10.0%) |
Technology Access in Salina
Computing Device Access in Salina
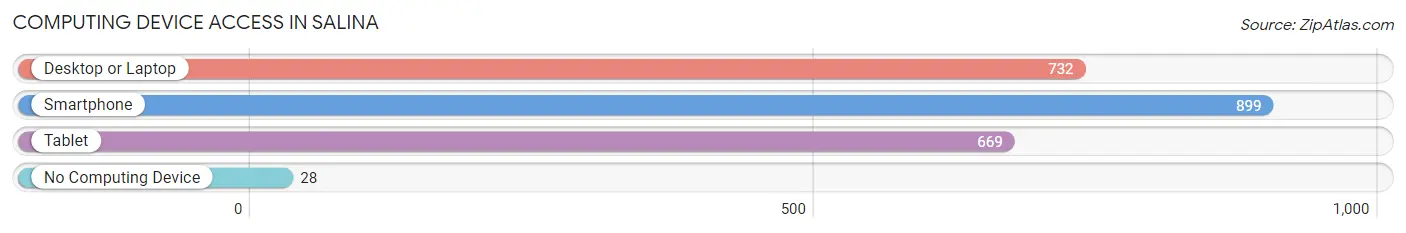
| Device Type | # Households | % Households |
| Desktop or Laptop | 732 | 74.5% |
| Smartphone | 899 | 91.5% |
| Tablet | 669 | 68.1% |
| No Computing Device | 28 | 2.9% |
| Total | 982 | 100.0% |
Internet Access in Salina
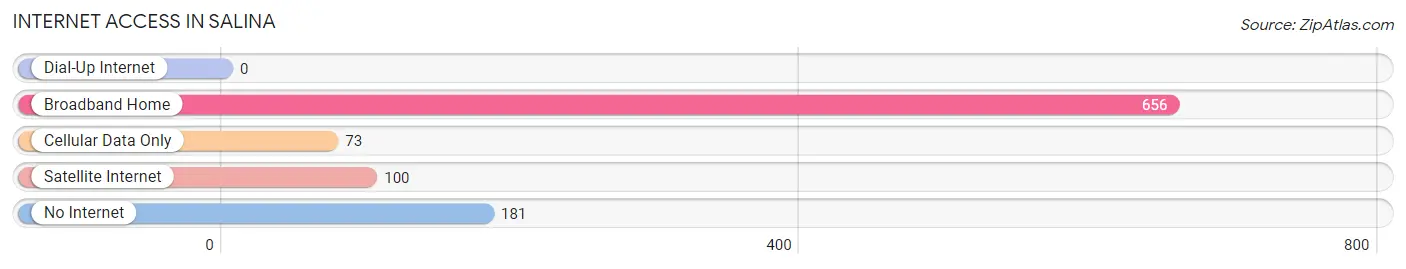
| Internet Type | # Households | % Households |
| Dial-Up Internet | 0 | 0.0% |
| Broadband Home | 656 | 66.8% |
| Cellular Data Only | 73 | 7.4% |
| Satellite Internet | 100 | 10.2% |
| No Internet | 181 | 18.4% |
| Total | 982 | 100.0% |
Salina Summary
Salina, Utah is a small city located in Sevier County, Utah. It is situated in the central part of the state, about halfway between Salt Lake City and St. George. The city has a population of approximately 2,500 people and is the county seat of Sevier County.
History
Salina was first settled in 1864 by a group of Mormon pioneers led by John R. Murdock. The town was named after Salina, New York, the hometown of Murdock's wife. The settlers built a fort and a sawmill, and the town quickly grew. By 1868, Salina had a population of over 500 people and was the largest town in Sevier County.
In 1871, the Utah Central Railroad was built through Salina, connecting the town to Salt Lake City and other cities in the region. This allowed for the growth of the local economy and the population of Salina continued to grow. By the early 1900s, Salina had become a major agricultural center, with a variety of crops being grown in the area.
In the 1950s, Salina began to experience a decline in population as people moved away to larger cities. However, the city has since experienced a resurgence in population and is now home to a variety of businesses and industries.
Geography
Salina is located in the central part of Utah, about halfway between Salt Lake City and St. George. The city is situated in the Sevier Valley, which is surrounded by the Wasatch Mountains to the east and the Fishlake National Forest to the west. The city is located at an elevation of 4,890 feet above sea level.
The climate in Salina is semi-arid, with hot summers and cold winters. The average annual temperature is around 50 degrees Fahrenheit, with temperatures ranging from the low 20s in the winter to the high 90s in the summer. The average annual precipitation is around 10 inches.
Economy
The economy of Salina is largely based on agriculture and tourism. The city is home to a variety of farms and ranches, which produce a variety of crops, including hay, alfalfa, corn, wheat, and potatoes. The city is also home to a number of tourist attractions, including the Salina Canyon Scenic Byway, the Salina Canyon Petroglyphs, and the Salina Hot Springs.
In addition to agriculture and tourism, Salina is home to a variety of businesses and industries. The city is home to a number of manufacturing companies, including a furniture factory, a plastics factory, and a food processing plant. The city is also home to a number of retail stores, restaurants, and other businesses.
Demographics
As of the 2010 census, the population of Salina was 2,521. The racial makeup of the city was 95.3% White, 0.3% African American, 0.7% Native American, 0.3% Asian, 0.1% Pacific Islander, 1.2% from other races, and 2.3% from two or more races. Hispanic or Latino of any race were 4.2% of the population.
The median household income in Salina was $37,917, and the median family income was $45,938. The per capita income for the city was $17,945. About 11.3% of families and 14.2% of the population were below the poverty line, including 18.2% of those under age 18 and 8.3% of those age 65 or over.
Common Questions
What is Per Capita Income in Salina?
Per Capita income in Salina is $29,866.
What is the Median Family Income in Salina?
Median Family Income in Salina is $70,227.
What is the Median Household income in Salina?
Median Household Income in Salina is $61,742.
What is Income or Wage Gap in Salina?
Income or Wage Gap in Salina is 63.2%.
Women in Salina earn 36.8 cents for every dollar earned by a man.
What is Inequality or Gini Index in Salina?
Inequality or Gini Index in Salina is 0.39.
What is the Total Population of Salina?
Total Population of Salina is 2,500.
What is the Total Male Population of Salina?
Total Male Population of Salina is 1,349.
What is the Total Female Population of Salina?
Total Female Population of Salina is 1,151.
What is the Ratio of Males per 100 Females in Salina?
There are 117.20 Males per 100 Females in Salina.
What is the Ratio of Females per 100 Males in Salina?
There are 85.32 Females per 100 Males in Salina.
What is the Median Population Age in Salina?
Median Population Age in Salina is 36.8 Years.
What is the Average Family Size in Salina
Average Family Size in Salina is 3.0 People.
What is the Average Household Size in Salina
Average Household Size in Salina is 2.5 People.
How Large is the Labor Force in Salina?
There are 1,272 People in the Labor Forcein in Salina.
What is the Percentage of People in the Labor Force in Salina?
65.3% of People are in the Labor Force in Salina.
What is the Unemployment Rate in Salina?
Unemployment Rate in Salina is 10.0%.