Moab, UT Map & Demographics
Moab Map
Moab Overview
$32,173
PER CAPITA INCOME
$63,393
AVG FAMILY INCOME
$52,385
AVG HOUSEHOLD INCOME
14.0%
WAGE / INCOME GAP [ % ]
86.0¢/ $1
WAGE / INCOME GAP [ $ ]
$11,251
FAMILY INCOME DEFICIT
0.49
INEQUALITY / GINI INDEX
5,329
TOTAL POPULATION
2,738
MALE POPULATION
2,591
FEMALE POPULATION
105.67
MALES / 100 FEMALES
94.63
FEMALES / 100 MALES
36.3
MEDIAN AGE
2.8
AVG FAMILY SIZE
2.3
AVG HOUSEHOLD SIZE
3,278
LABOR FORCE [ PEOPLE ]
73.1%
PERCENT IN LABOR FORCE
2.2%
UNEMPLOYMENT RATE
Moab Zip Codes
Moab Area Codes
Income in Moab
Income Overview in Moab
Per Capita Income in Moab is $32,173, while median incomes of families and households are $63,393 and $52,385 respectively.
| Characteristic | Number | Measure |
| Per Capita Income | 5,329 | $32,173 |
| Median Family Income | 1,377 | $63,393 |
| Mean Family Income | 1,377 | $85,360 |
| Median Household Income | 2,284 | $52,385 |
| Mean Household Income | 2,284 | $70,512 |
| Income Deficit | 1,377 | $11,251 |
| Wage / Income Gap (%) | 5,329 | 13.99% |
| Wage / Income Gap ($) | 5,329 | 86.01¢ per $1 |
| Gini / Inequality Index | 5,329 | 0.49 |
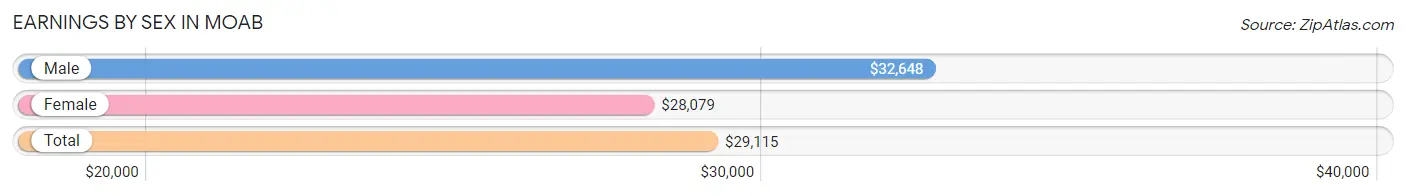
Earnings by Sex in Moab
Average Earnings in Moab are $29,115, $32,648 for men and $28,079 for women, a difference of 14.0%.
| Sex | Number | Average Earnings |
| Male | 1,755 (52.2%) | $32,648 |
| Female | 1,608 (47.8%) | $28,079 |
| Total | 3,363 (100.0%) | $29,115 |
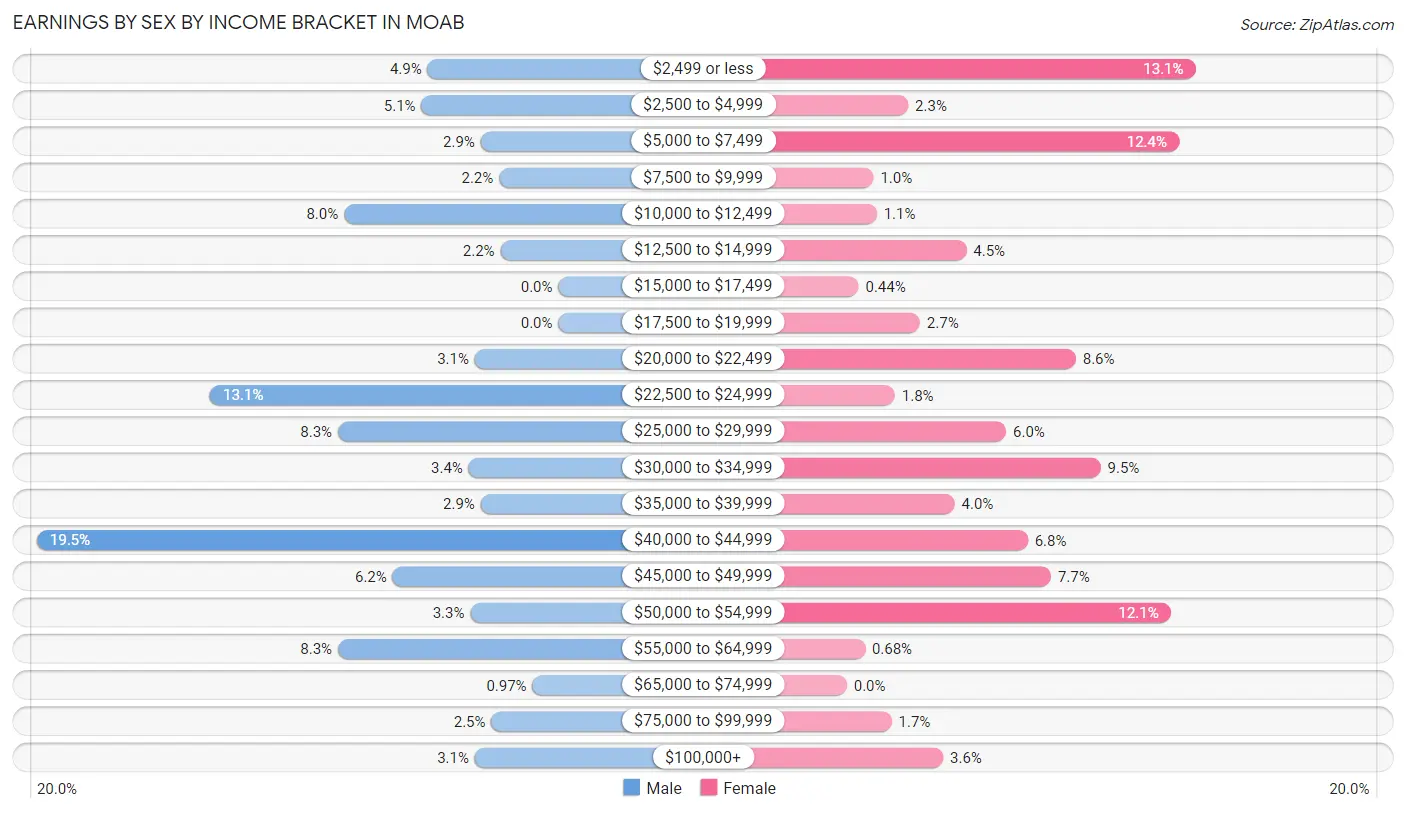
Earnings by Sex by Income Bracket in Moab
The most common earnings brackets in Moab are $40,000 to $44,999 for men (343 | 19.5%) and $2,499 or less for women (210 | 13.1%).
| Income | Male | Female |
| $2,499 or less | 86 (4.9%) | 210 (13.1%) |
| $2,500 to $4,999 | 90 (5.1%) | 37 (2.3%) |
| $5,000 to $7,499 | 51 (2.9%) | 200 (12.4%) |
| $7,500 to $9,999 | 39 (2.2%) | 16 (1.0%) |
| $10,000 to $12,499 | 141 (8.0%) | 18 (1.1%) |
| $12,500 to $14,999 | 38 (2.2%) | 72 (4.5%) |
| $15,000 to $17,499 | 0 (0.0%) | 7 (0.4%) |
| $17,500 to $19,999 | 0 (0.0%) | 44 (2.7%) |
| $20,000 to $22,499 | 55 (3.1%) | 138 (8.6%) |
| $22,500 to $24,999 | 229 (13.1%) | 29 (1.8%) |
| $25,000 to $29,999 | 145 (8.3%) | 96 (6.0%) |
| $30,000 to $34,999 | 59 (3.4%) | 153 (9.5%) |
| $35,000 to $39,999 | 51 (2.9%) | 65 (4.0%) |
| $40,000 to $44,999 | 343 (19.5%) | 109 (6.8%) |
| $45,000 to $49,999 | 109 (6.2%) | 123 (7.6%) |
| $50,000 to $54,999 | 58 (3.3%) | 195 (12.1%) |
| $55,000 to $64,999 | 145 (8.3%) | 11 (0.7%) |
| $65,000 to $74,999 | 17 (1.0%) | 0 (0.0%) |
| $75,000 to $99,999 | 44 (2.5%) | 27 (1.7%) |
| $100,000+ | 55 (3.1%) | 58 (3.6%) |
| Total | 1,755 (100.0%) | 1,608 (100.0%) |
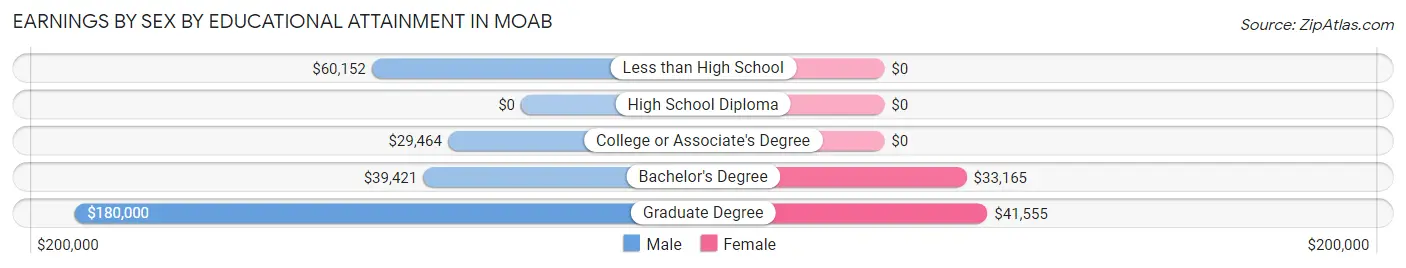
Earnings by Sex by Educational Attainment in Moab
Average earnings in Moab are $40,231 for men and $29,787 for women, a difference of 26.0%. Men with an educational attainment of graduate degree enjoy the highest average annual earnings of $180,000, while those with college or associate's degree education earn the least with $29,464. Women with an educational attainment of graduate degree earn the most with the average annual earnings of $41,555, while those with bachelor's degree education have the smallest earnings of $33,165.
| Educational Attainment | Male Income | Female Income |
| Less than High School | $60,152 | $0 |
| High School Diploma | - | - |
| College or Associate's Degree | $29,464 | $0 |
| Bachelor's Degree | $39,421 | $33,165 |
| Graduate Degree | $180,000 | $41,555 |
| Total | $40,231 | $29,787 |
Family Income in Moab
Family Income Brackets in Moab
According to the Moab family income data, there are 406 families falling into the $50,000 to $74,999 income range, which is the most common income bracket and makes up 29.5% of all families. Conversely, the $150,000 to $199,999 income bracket is the least frequent group with only 41 families (3.0%) belonging to this category.
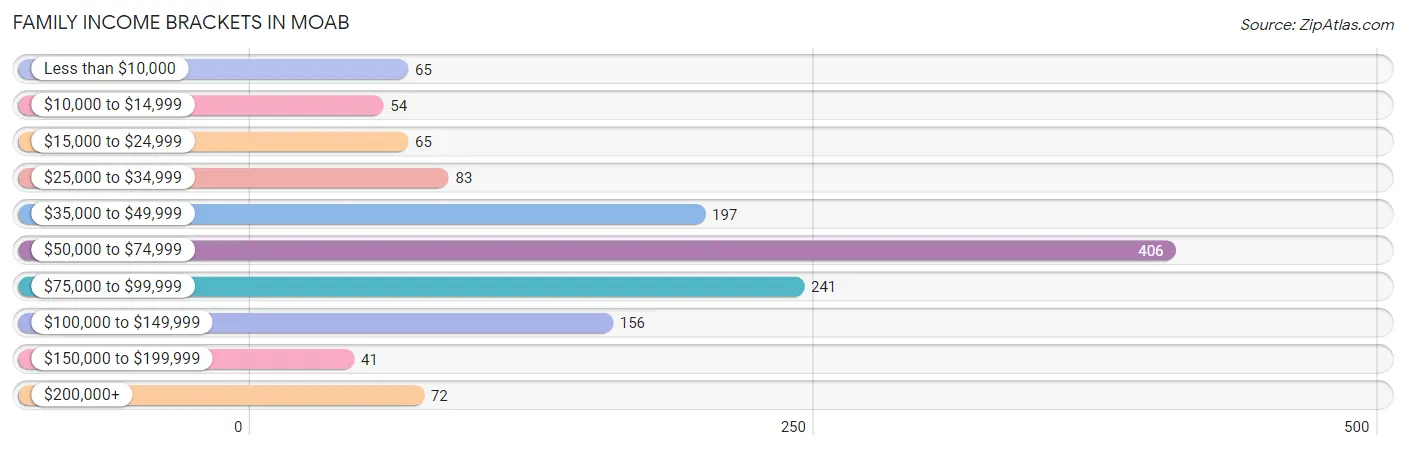
| Income Bracket | # Families | % Families |
| Less than $10,000 | 65 | 4.7% |
| $10,000 to $14,999 | 54 | 3.9% |
| $15,000 to $24,999 | 65 | 4.7% |
| $25,000 to $34,999 | 83 | 6.0% |
| $35,000 to $49,999 | 197 | 14.3% |
| $50,000 to $74,999 | 406 | 29.5% |
| $75,000 to $99,999 | 241 | 17.5% |
| $100,000 to $149,999 | 156 | 11.3% |
| $150,000 to $199,999 | 41 | 3.0% |
| $200,000+ | 72 | 5.2% |
Family Income by Famaliy Size in Moab
3-person families (211 | 15.3%) account for the highest median family income in Moab with $95,319 per family, while 2-person families (750 | 54.5%) have the highest median income of $32,272 per family member.
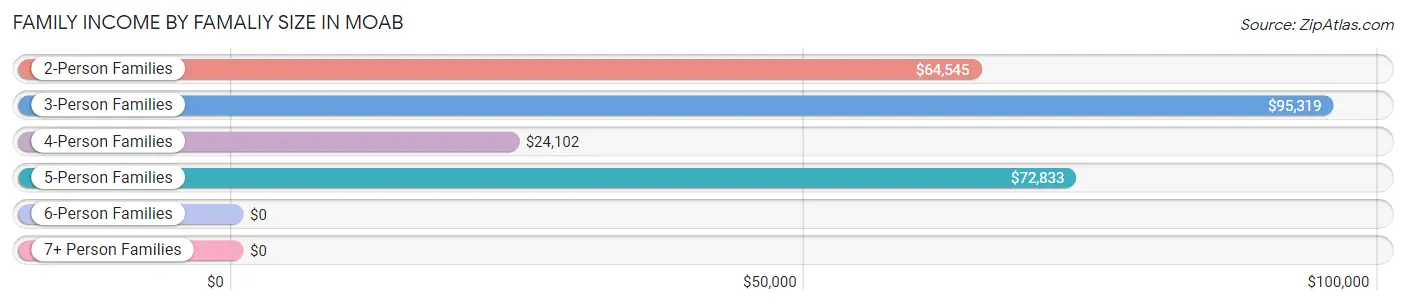
| Income Bracket | # Families | Median Income |
| 2-Person Families | 750 (54.5%) | $64,545 |
| 3-Person Families | 211 (15.3%) | $95,319 |
| 4-Person Families | 251 (18.2%) | $24,102 |
| 5-Person Families | 76 (5.5%) | $72,833 |
| 6-Person Families | 66 (4.8%) | $0 |
| 7+ Person Families | 23 (1.7%) | $0 |
| Total | 1,377 (100.0%) | $63,393 |
Family Income by Number of Earners in Moab
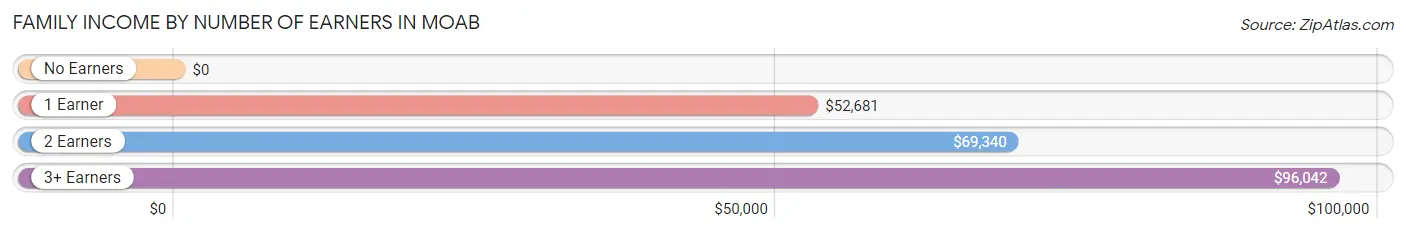
| Number of Earners | # Families | Median Income |
| No Earners | 125 (9.1%) | $0 |
| 1 Earner | 372 (27.0%) | $52,681 |
| 2 Earners | 701 (50.9%) | $69,340 |
| 3+ Earners | 179 (13.0%) | $96,042 |
| Total | 1,377 (100.0%) | $63,393 |
Household Income in Moab
Household Income Brackets in Moab
With 498 households falling in the category, the $50,000 to $74,999 income range is the most frequent in Moab, accounting for 21.8% of all households. In contrast, only 73 households (3.2%) fall into the $150,000 to $199,999 income bracket, making it the least populous group.
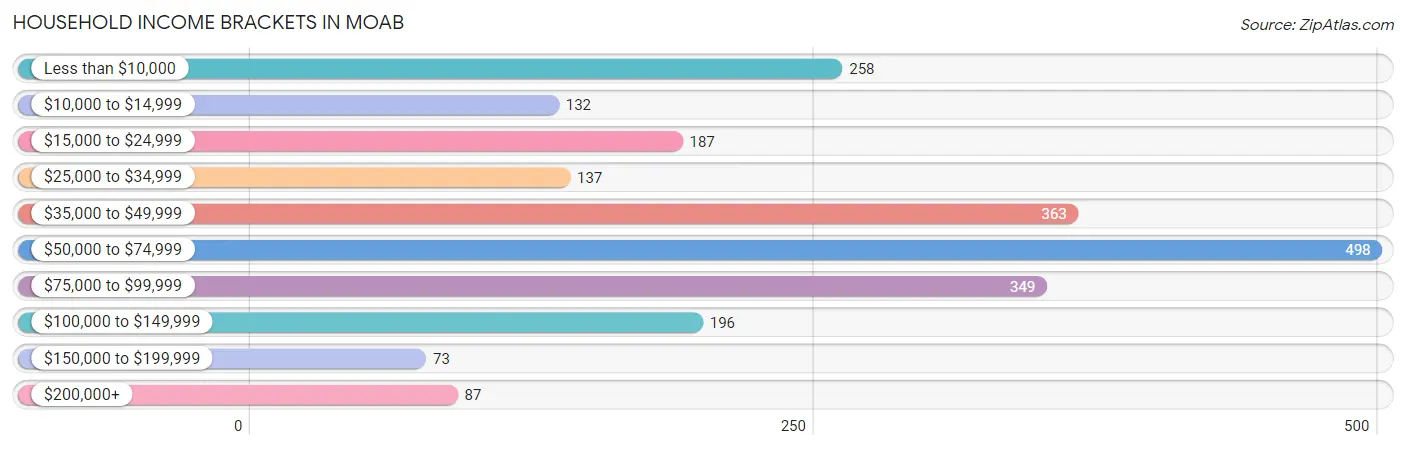
| Income Bracket | # Households | % Households |
| Less than $10,000 | 258 | 11.3% |
| $10,000 to $14,999 | 132 | 5.8% |
| $15,000 to $24,999 | 187 | 8.2% |
| $25,000 to $34,999 | 137 | 6.0% |
| $35,000 to $49,999 | 363 | 15.9% |
| $50,000 to $74,999 | 498 | 21.8% |
| $75,000 to $99,999 | 349 | 15.3% |
| $100,000 to $149,999 | 196 | 8.6% |
| $150,000 to $199,999 | 73 | 3.2% |
| $200,000+ | 87 | 3.8% |
Household Income by Householder Age in Moab
The median household income in Moab is $52,385, with the highest median household income of $74,625 found in the 45 to 64 years age bracket for the primary householder. A total of 529 households (23.2%) fall into this category. Meanwhile, the 15 to 24 years age bracket for the primary householder has the lowest median household income of $0, with 157 households (6.9%) in this group.
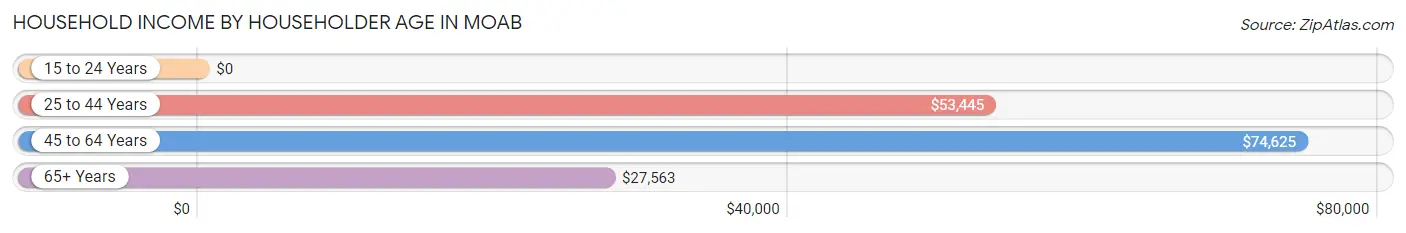
| Income Bracket | # Households | Median Income |
| 15 to 24 Years | 157 (6.9%) | $0 |
| 25 to 44 Years | 883 (38.7%) | $53,445 |
| 45 to 64 Years | 529 (23.2%) | $74,625 |
| 65+ Years | 715 (31.3%) | $27,563 |
| Total | 2,284 (100.0%) | $52,385 |
Poverty in Moab
Income Below Poverty by Sex and Age in Moab
With 17.8% poverty level for males and 22.0% for females among the residents of Moab, under 5 year old males and under 5 year old females are the most vulnerable to poverty, with 77 males (43.3%) and 66 females (83.5%) in their respective age groups living below the poverty level.
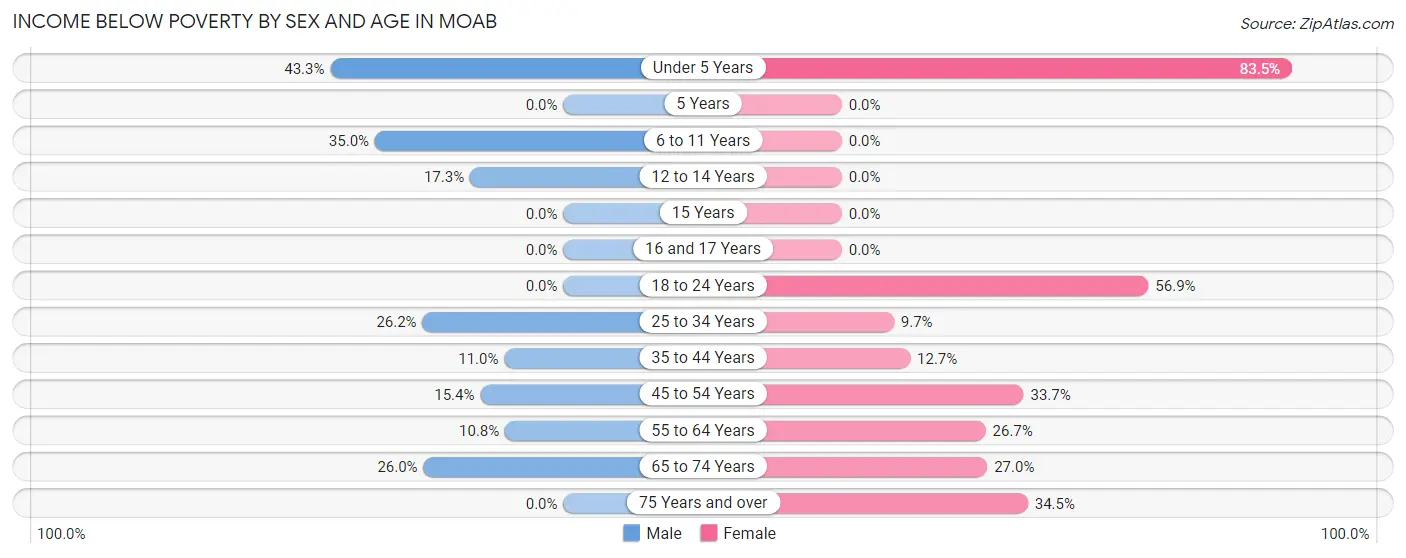
| Age Bracket | Male | Female |
| Under 5 Years | 77 (43.3%) | 66 (83.5%) |
| 5 Years | 0 (0.0%) | 0 (0.0%) |
| 6 to 11 Years | 78 (35.0%) | 0 (0.0%) |
| 12 to 14 Years | 13 (17.3%) | 0 (0.0%) |
| 15 Years | 0 (0.0%) | 0 (0.0%) |
| 16 and 17 Years | 0 (0.0%) | 0 (0.0%) |
| 18 to 24 Years | 0 (0.0%) | 107 (56.9%) |
| 25 to 34 Years | 119 (26.2%) | 57 (9.7%) |
| 35 to 44 Years | 32 (11.0%) | 54 (12.7%) |
| 45 to 54 Years | 47 (15.4%) | 57 (33.7%) |
| 55 to 64 Years | 16 (10.8%) | 55 (26.7%) |
| 65 to 74 Years | 100 (26.0%) | 108 (27.0%) |
| 75 Years and over | 0 (0.0%) | 58 (34.5%) |
| Total | 482 (17.8%) | 562 (22.0%) |
Income Above Poverty by Sex and Age in Moab
According to the poverty statistics in Moab, males aged 15 years and females aged 5 years are the age groups that are most secure financially, with 100.0% of males and 100.0% of females in these age groups living above the poverty line.
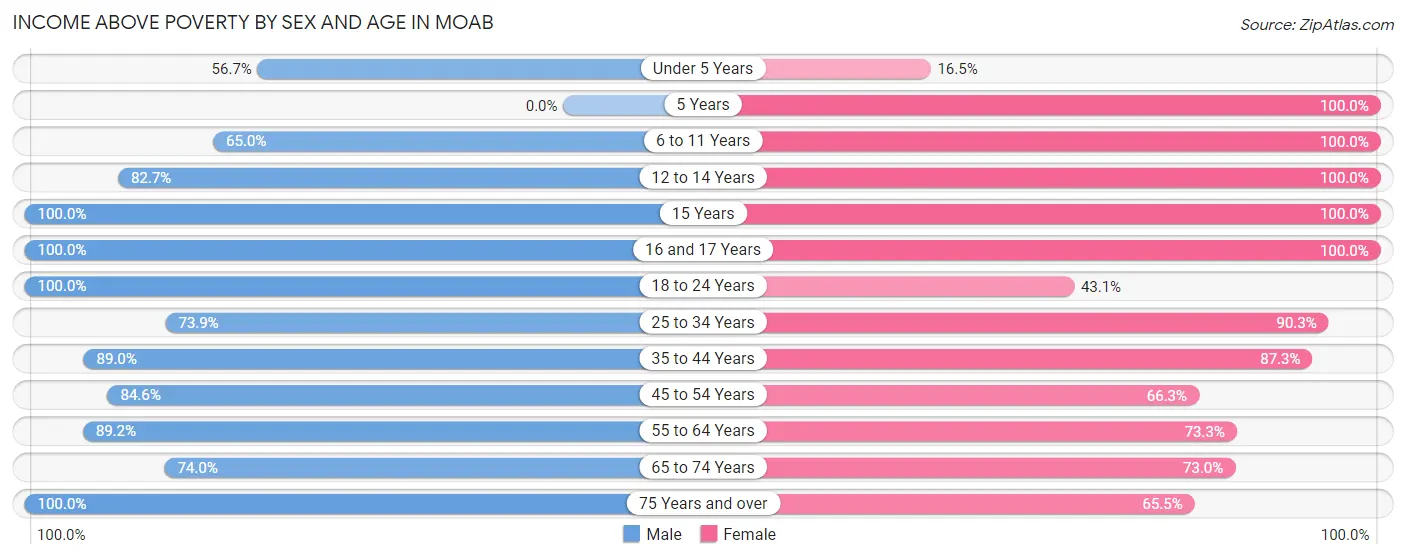
| Age Bracket | Male | Female |
| Under 5 Years | 101 (56.7%) | 13 (16.5%) |
| 5 Years | 0 (0.0%) | 13 (100.0%) |
| 6 to 11 Years | 145 (65.0%) | 137 (100.0%) |
| 12 to 14 Years | 62 (82.7%) | 97 (100.0%) |
| 15 Years | 10 (100.0%) | 33 (100.0%) |
| 16 and 17 Years | 63 (100.0%) | 44 (100.0%) |
| 18 to 24 Years | 435 (100.0%) | 81 (43.1%) |
| 25 to 34 Years | 336 (73.9%) | 533 (90.3%) |
| 35 to 44 Years | 260 (89.0%) | 372 (87.3%) |
| 45 to 54 Years | 258 (84.6%) | 112 (66.3%) |
| 55 to 64 Years | 132 (89.2%) | 151 (73.3%) |
| 65 to 74 Years | 285 (74.0%) | 292 (73.0%) |
| 75 Years and over | 139 (100.0%) | 110 (65.5%) |
| Total | 2,226 (82.2%) | 1,988 (78.0%) |
Income Below Poverty Among Married-Couple Families in Moab
The poverty statistics for married-couple families in Moab show that 11.0% or 104 of the total 945 families live below the poverty line. Families with 1 or 2 children have the highest poverty rate of 28.3%, comprising of 104 families. On the other hand, families with no children have the lowest poverty rate of 0.0%, which includes 0 families.
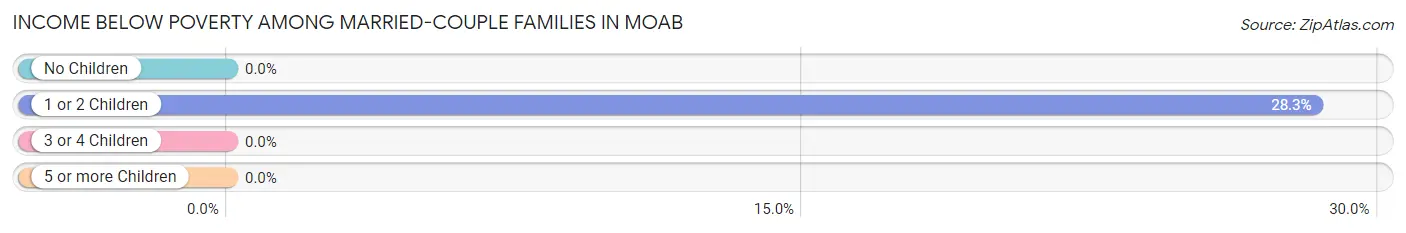
| Children | Above Poverty | Below Poverty |
| No Children | 466 (100.0%) | 0 (0.0%) |
| 1 or 2 Children | 263 (71.7%) | 104 (28.3%) |
| 3 or 4 Children | 112 (100.0%) | 0 (0.0%) |
| 5 or more Children | 0 (0.0%) | 0 (0.0%) |
| Total | 841 (89.0%) | 104 (11.0%) |
Income Below Poverty Among Single-Parent Households in Moab
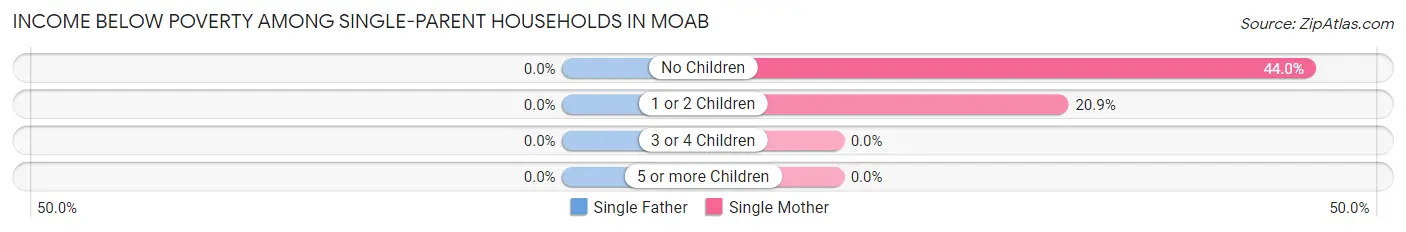
| Children | Single Father | Single Mother |
| No Children | 0 (0.0%) | 40 (44.0%) |
| 1 or 2 Children | 0 (0.0%) | 40 (20.9%) |
| 3 or 4 Children | 0 (0.0%) | 0 (0.0%) |
| 5 or more Children | 0 (0.0%) | 0 (0.0%) |
| Total | 0 (0.0%) | 80 (27.0%) |
Income Below Poverty Among Married-Couple vs Single-Parent Households in Moab
The poverty data for Moab shows that 104 of the married-couple family households (11.0%) and 80 of the single-parent households (18.5%) are living below the poverty level. Within the married-couple family households, those with 1 or 2 children have the highest poverty rate, with 104 households (28.3%) falling below the poverty line. Among the single-parent households, those with no children have the highest poverty rate, with 40 household (19.4%) living below poverty.
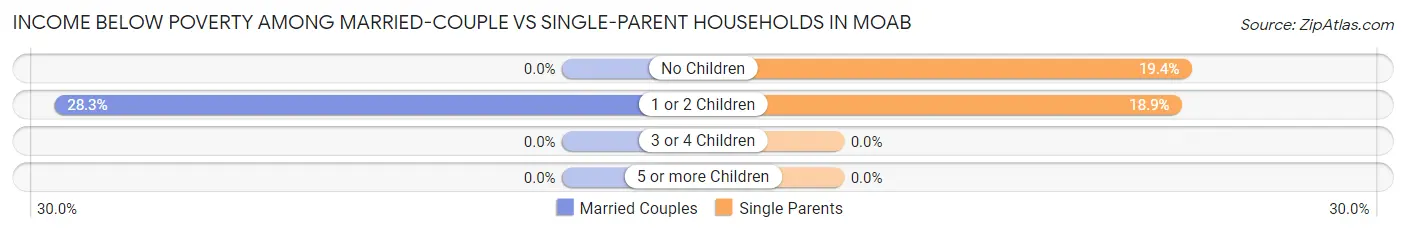
| Children | Married-Couple Families | Single-Parent Households |
| No Children | 0 (0.0%) | 40 (19.4%) |
| 1 or 2 Children | 104 (28.3%) | 40 (18.9%) |
| 3 or 4 Children | 0 (0.0%) | 0 (0.0%) |
| 5 or more Children | 0 (0.0%) | 0 (0.0%) |
| Total | 104 (11.0%) | 80 (18.5%) |
Race in Moab
The most populous races in Moab are White / Caucasian (4,458 | 83.7%), Hispanic or Latino (910 | 17.1%), and Two or more Races (398 | 7.5%).
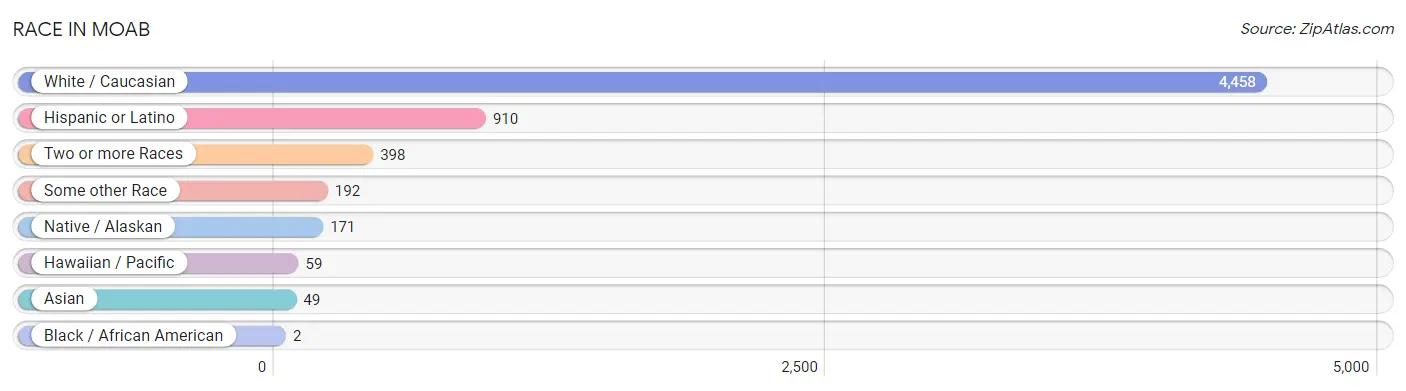
| Race | # Population | % Population |
| Asian | 49 | 0.9% |
| Black / African American | 2 | 0.0% |
| Hawaiian / Pacific | 59 | 1.1% |
| Hispanic or Latino | 910 | 17.1% |
| Native / Alaskan | 171 | 3.2% |
| White / Caucasian | 4,458 | 83.7% |
| Two or more Races | 398 | 7.5% |
| Some other Race | 192 | 3.6% |
| Total | 5,329 | 100.0% |
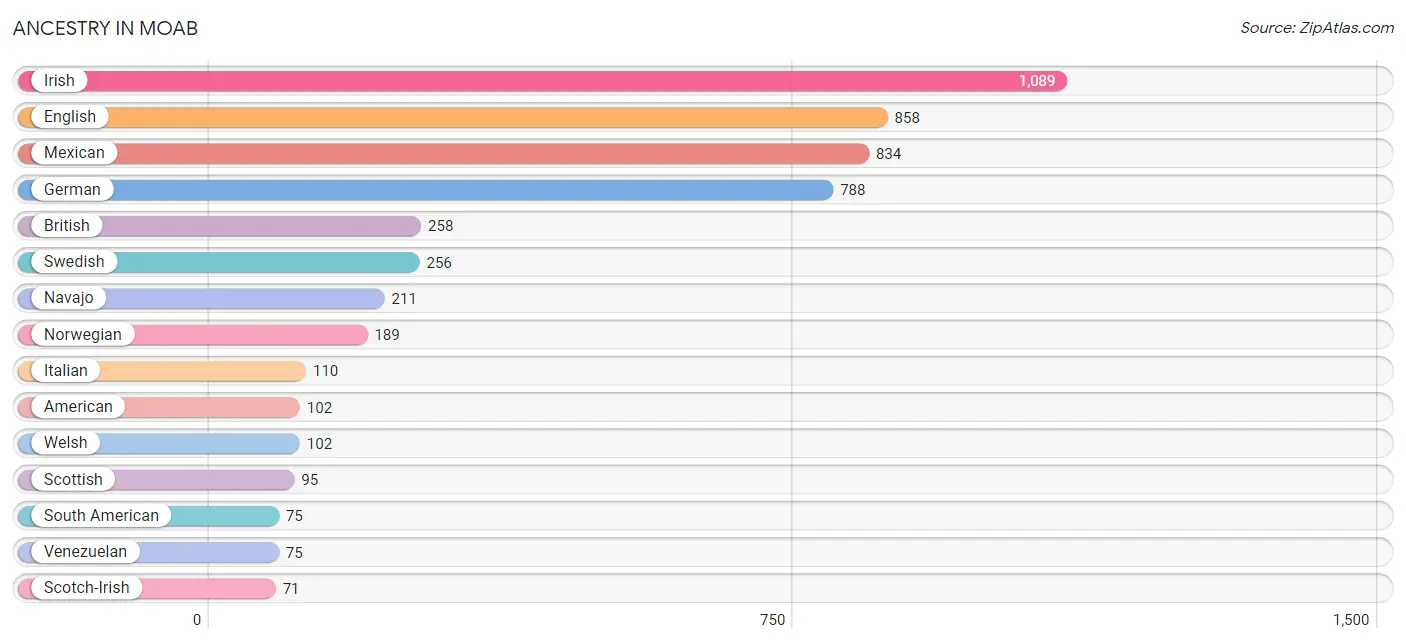
Ancestry in Moab
The most populous ancestries reported in Moab are Irish (1,089 | 20.4%), English (858 | 16.1%), Mexican (834 | 15.7%), German (788 | 14.8%), and British (258 | 4.8%), together accounting for 71.8% of all Moab residents.
| Ancestry | # Population | % Population |
| American | 102 | 1.9% |
| British | 258 | 4.8% |
| Canadian | 24 | 0.4% |
| Danish | 33 | 0.6% |
| Dutch | 53 | 1.0% |
| English | 858 | 16.1% |
| European | 55 | 1.0% |
| Finnish | 54 | 1.0% |
| French | 70 | 1.3% |
| French Canadian | 32 | 0.6% |
| German | 788 | 14.8% |
| Hungarian | 31 | 0.6% |
| Indian (Asian) | 29 | 0.5% |
| Irish | 1,089 | 20.4% |
| Italian | 110 | 2.1% |
| Mexican | 834 | 15.7% |
| Navajo | 211 | 4.0% |
| Northern European | 31 | 0.6% |
| Norwegian | 189 | 3.5% |
| Pakistani | 49 | 0.9% |
| Polish | 56 | 1.1% |
| Russian | 5 | 0.1% |
| Scandinavian | 9 | 0.2% |
| Scotch-Irish | 71 | 1.3% |
| Scottish | 95 | 1.8% |
| South American | 75 | 1.4% |
| Swedish | 256 | 4.8% |
| Swiss | 16 | 0.3% |
| Tongan | 71 | 1.3% |
| Ukrainian | 23 | 0.4% |
| Venezuelan | 75 | 1.4% |
| Welsh | 102 | 1.9% | View All 32 Rows |
Immigrants in Moab
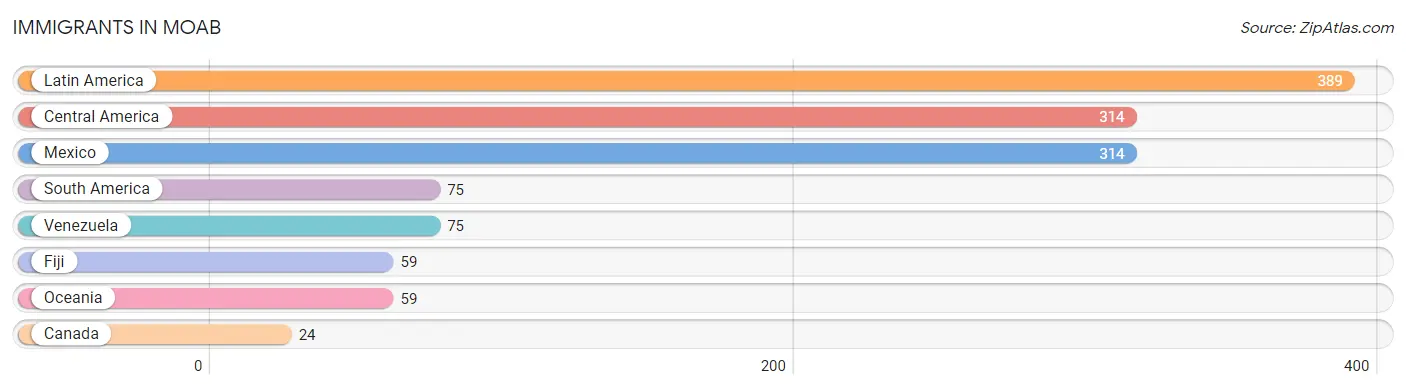
The most numerous immigrant groups reported in Moab came from Latin America (389 | 7.3%), Central America (314 | 5.9%), Mexico (314 | 5.9%), South America (75 | 1.4%), and Venezuela (75 | 1.4%), together accounting for 21.9% of all Moab residents.
| Immigration Origin | # Population | % Population |
| Canada | 24 | 0.4% |
| Central America | 314 | 5.9% |
| Fiji | 59 | 1.1% |
| Latin America | 389 | 7.3% |
| Mexico | 314 | 5.9% |
| Oceania | 59 | 1.1% |
| South America | 75 | 1.4% |
| Venezuela | 75 | 1.4% | View All 8 Rows |
Sex and Age in Moab
Sex and Age in Moab
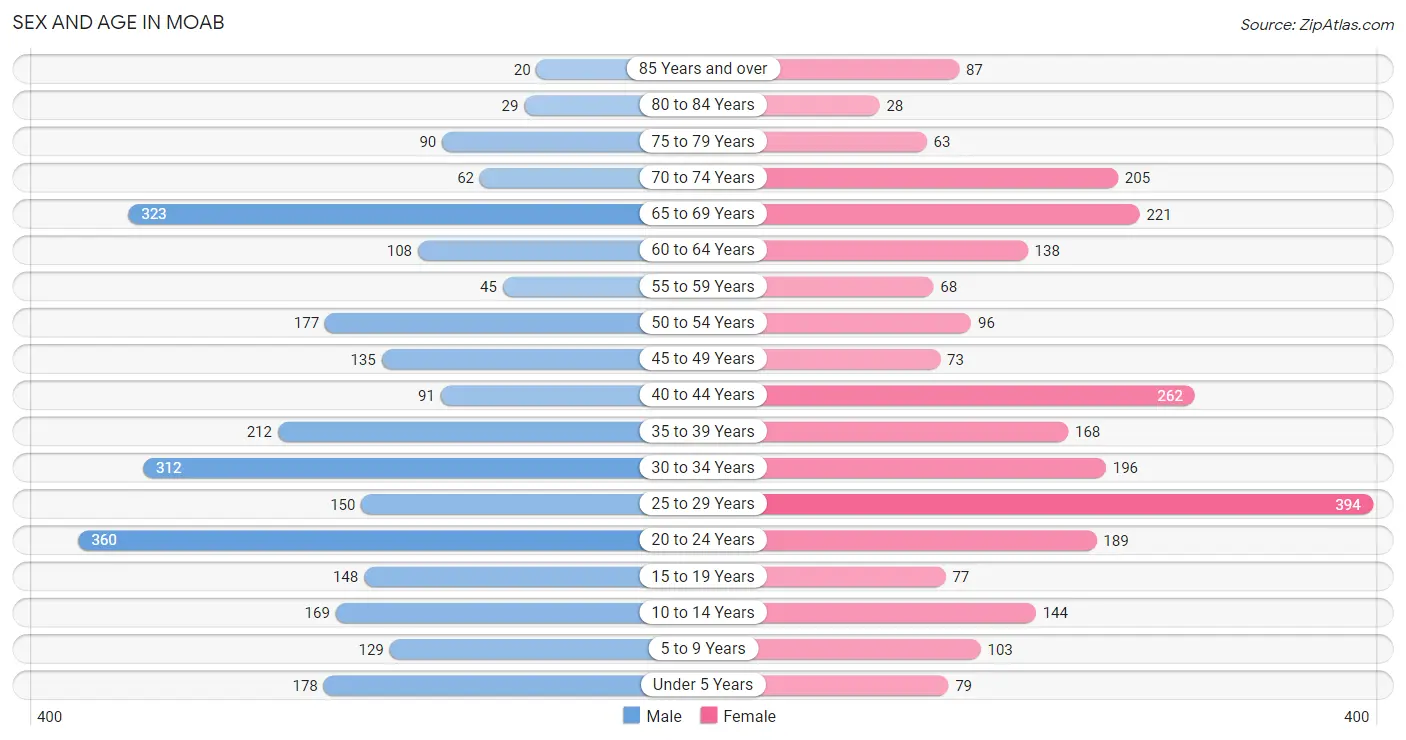
The most populous age groups in Moab are 20 to 24 Years (360 | 13.2%) for men and 25 to 29 Years (394 | 15.2%) for women.
| Age Bracket | Male | Female |
| Under 5 Years | 178 (6.5%) | 79 (3.0%) |
| 5 to 9 Years | 129 (4.7%) | 103 (4.0%) |
| 10 to 14 Years | 169 (6.2%) | 144 (5.6%) |
| 15 to 19 Years | 148 (5.4%) | 77 (3.0%) |
| 20 to 24 Years | 360 (13.2%) | 189 (7.3%) |
| 25 to 29 Years | 150 (5.5%) | 394 (15.2%) |
| 30 to 34 Years | 312 (11.4%) | 196 (7.6%) |
| 35 to 39 Years | 212 (7.7%) | 168 (6.5%) |
| 40 to 44 Years | 91 (3.3%) | 262 (10.1%) |
| 45 to 49 Years | 135 (4.9%) | 73 (2.8%) |
| 50 to 54 Years | 177 (6.5%) | 96 (3.7%) |
| 55 to 59 Years | 45 (1.6%) | 68 (2.6%) |
| 60 to 64 Years | 108 (3.9%) | 138 (5.3%) |
| 65 to 69 Years | 323 (11.8%) | 221 (8.5%) |
| 70 to 74 Years | 62 (2.3%) | 205 (7.9%) |
| 75 to 79 Years | 90 (3.3%) | 63 (2.4%) |
| 80 to 84 Years | 29 (1.1%) | 28 (1.1%) |
| 85 Years and over | 20 (0.7%) | 87 (3.4%) |
| Total | 2,738 (100.0%) | 2,591 (100.0%) |
Families and Households in Moab
Median Family Size in Moab
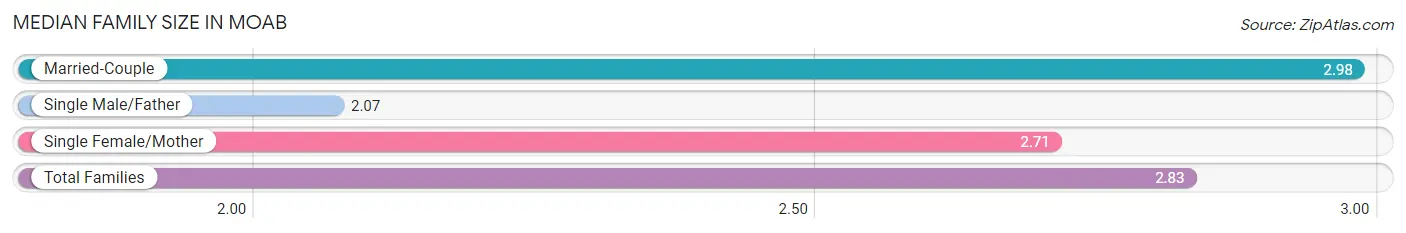
The median family size in Moab is 2.83 persons per family, with married-couple families (945 | 68.6%) accounting for the largest median family size of 2.98 persons per family. On the other hand, single male/father families (136 | 9.9%) represent the smallest median family size with 2.07 persons per family.
| Family Type | # Families | Family Size |
| Married-Couple | 945 (68.6%) | 2.98 |
| Single Male/Father | 136 (9.9%) | 2.07 |
| Single Female/Mother | 296 (21.5%) | 2.71 |
| Total Families | 1,377 (100.0%) | 2.83 |
Median Household Size in Moab
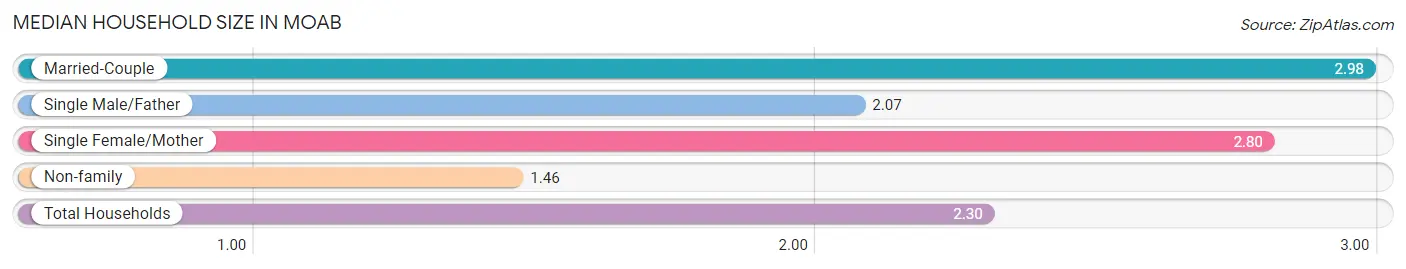
The median household size in Moab is 2.30 persons per household, with married-couple households (945 | 41.4%) accounting for the largest median household size of 2.98 persons per household. non-family households (907 | 39.7%) represent the smallest median household size with 1.46 persons per household.
| Household Type | # Households | Household Size |
| Married-Couple | 945 (41.4%) | 2.98 |
| Single Male/Father | 136 (5.9%) | 2.07 |
| Single Female/Mother | 296 (13.0%) | 2.80 |
| Non-family | 907 (39.7%) | 1.46 |
| Total Households | 2,284 (100.0%) | 2.30 |
Household Size by Marriage Status in Moab
Out of a total of 2,284 households in Moab, 1,377 (60.3%) are family households, while 907 (39.7%) are nonfamily households. The most numerous type of family households are 2-person households, comprising 737, and the most common type of nonfamily households are 1-person households, comprising 750.
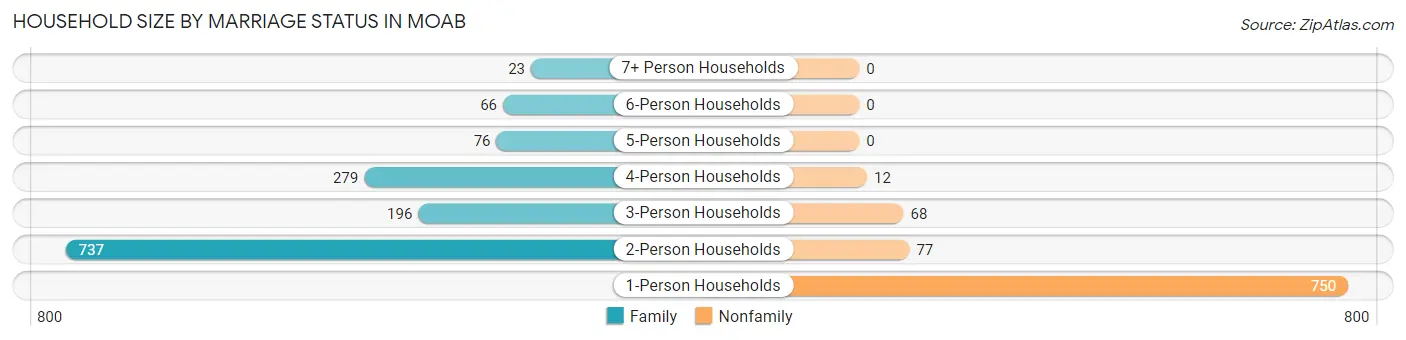
| Household Size | Family Households | Nonfamily Households |
| 1-Person Households | - | 750 (32.8%) |
| 2-Person Households | 737 (32.3%) | 77 (3.4%) |
| 3-Person Households | 196 (8.6%) | 68 (3.0%) |
| 4-Person Households | 279 (12.2%) | 12 (0.5%) |
| 5-Person Households | 76 (3.3%) | 0 (0.0%) |
| 6-Person Households | 66 (2.9%) | 0 (0.0%) |
| 7+ Person Households | 23 (1.0%) | 0 (0.0%) |
| Total | 1,377 (60.3%) | 907 (39.7%) |
Female Fertility in Moab
Fertility by Age in Moab
Average fertility rate in Moab is 105.0 births per 1,000 women. Women in the age bracket of 20 to 34 years have the highest fertility rate with 184.0 births per 1,000 women. Women in the age bracket of 20 to 34 years acount for 100.0% of all women with births.
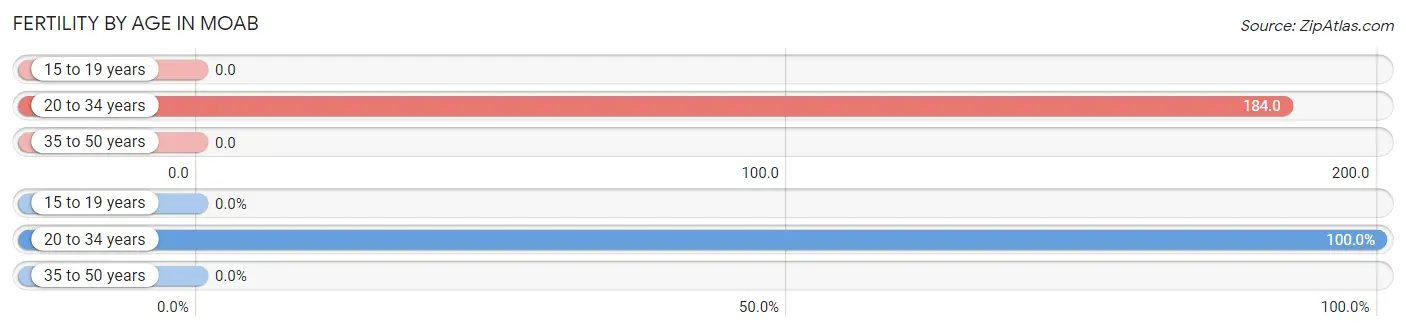
| Age Bracket | Women with Births | Births / 1,000 Women |
| 15 to 19 years | 0 (0.0%) | 0.0 |
| 20 to 34 years | 143 (100.0%) | 184.0 |
| 35 to 50 years | 0 (0.0%) | 0.0 |
| Total | 143 (100.0%) | 105.0 |
Fertility by Age by Marriage Status in Moab
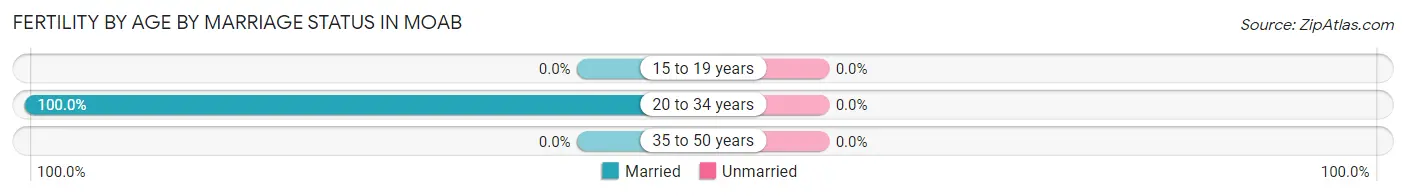
| Age Bracket | Married | Unmarried |
| 15 to 19 years | 0 (0.0%) | 0 (0.0%) |
| 20 to 34 years | 143 (100.0%) | 0 (0.0%) |
| 35 to 50 years | 0 (0.0%) | 0 (0.0%) |
| Total | 143 (100.0%) | 0 (0.0%) |
Fertility by Education in Moab
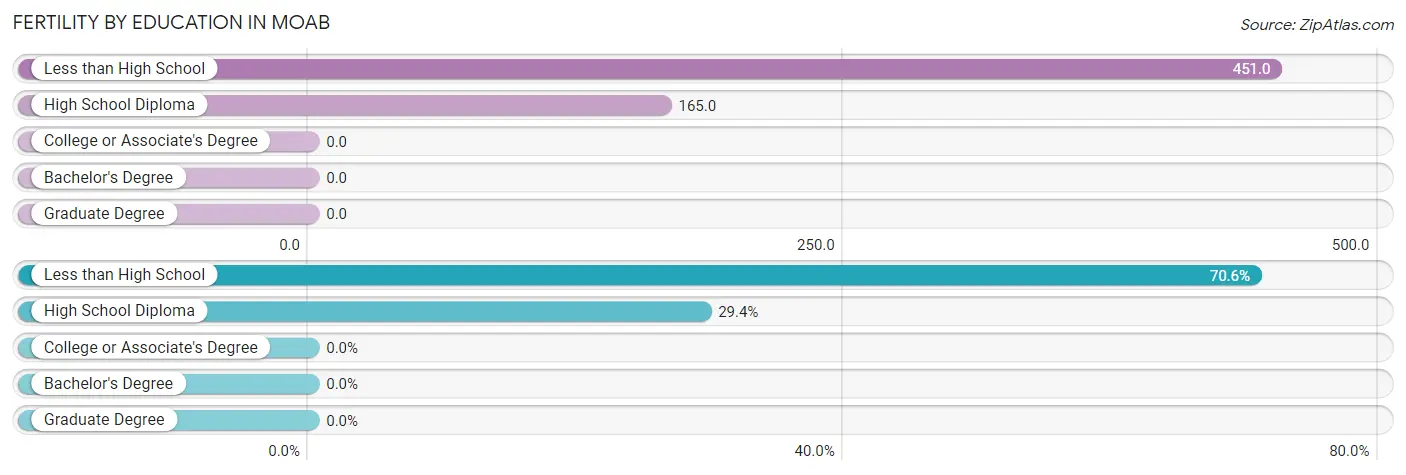
| Educational Attainment | Women with Births | Births / 1,000 Women |
| Less than High School | 101 (70.6%) | 451.0 |
| High School Diploma | 42 (29.4%) | 165.0 |
| College or Associate's Degree | 0 (0.0%) | 0.0 |
| Bachelor's Degree | 0 (0.0%) | 0.0 |
| Graduate Degree | 0 (0.0%) | 0.0 |
| Total | 143 (100.0%) | 105.0 |
Fertility by Education by Marriage Status in Moab
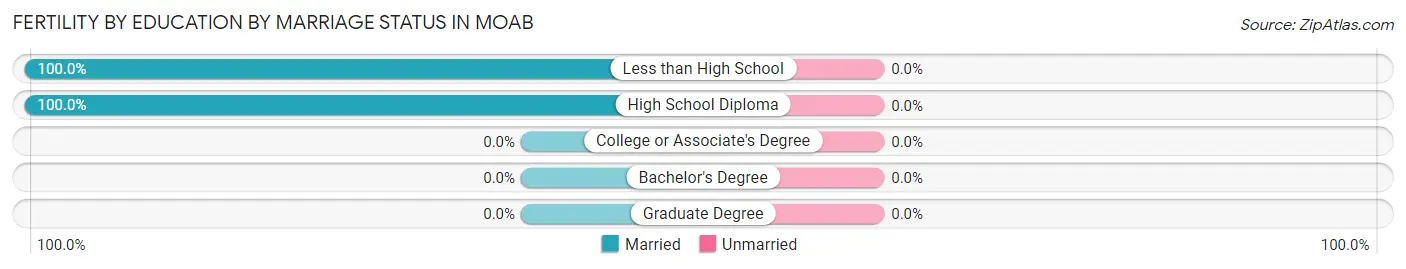
| Educational Attainment | Married | Unmarried |
| Less than High School | 101 (100.0%) | 0 (0.0%) |
| High School Diploma | 42 (100.0%) | 0 (0.0%) |
| College or Associate's Degree | 0 (0.0%) | 0 (0.0%) |
| Bachelor's Degree | 0 (0.0%) | 0 (0.0%) |
| Graduate Degree | 0 (0.0%) | 0 (0.0%) |
| Total | 143 (100.0%) | 0 (0.0%) |
Employment Characteristics in Moab
Employment by Class of Employer in Moab
Among the 3,056 employed individuals in Moab, private company employees (2,201 | 72.0%), local government employees (195 | 6.4%), and self-employed (incorporated) (174 | 5.7%) make up the most common classes of employment.
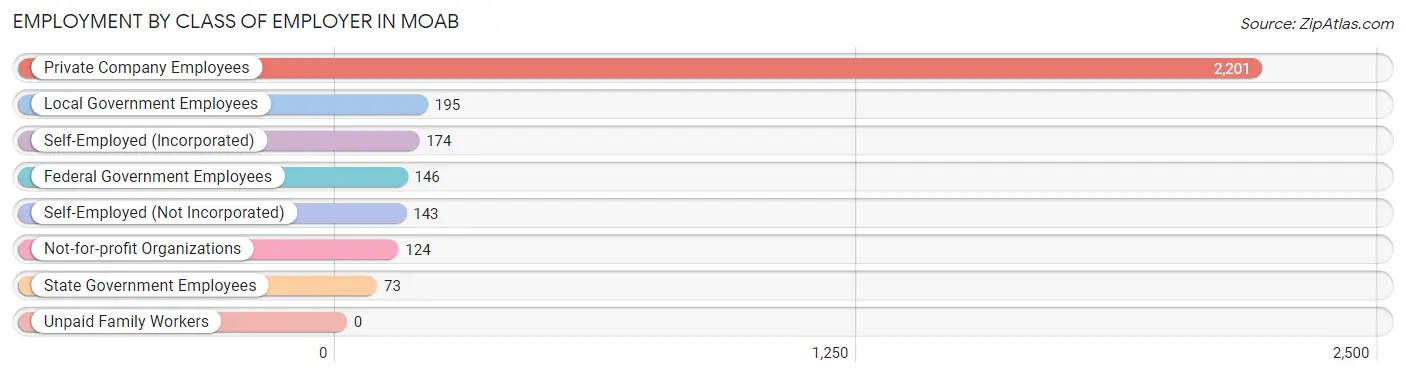
| Employer Class | # Employees | % Employees |
| Private Company Employees | 2,201 | 72.0% |
| Self-Employed (Incorporated) | 174 | 5.7% |
| Self-Employed (Not Incorporated) | 143 | 4.7% |
| Not-for-profit Organizations | 124 | 4.1% |
| Local Government Employees | 195 | 6.4% |
| State Government Employees | 73 | 2.4% |
| Federal Government Employees | 146 | 4.8% |
| Unpaid Family Workers | 0 | 0.0% |
| Total | 3,056 | 100.0% |
Employment Status by Age in Moab
According to the labor force statistics for Moab, out of the total population over 16 years of age (4,484), 73.1% or 3,278 individuals are in the labor force, with 2.2% or 72 of them unemployed. The age group with the highest labor force participation rate is 20 to 24 years, with 99.5% or 546 individuals in the labor force. Within the labor force, the 75 years and over age range has the highest percentage of unemployed individuals, with 58.0% or 58 of them being unemployed.
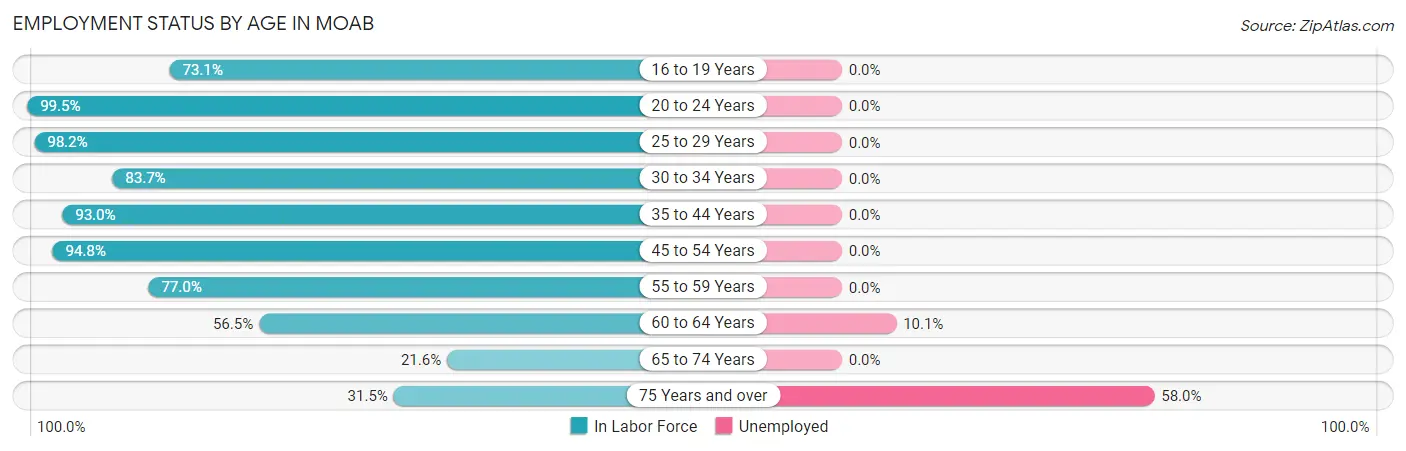
| Age Bracket | In Labor Force | Unemployed |
| 16 to 19 Years | 133 (73.1%) | 0 (0.0%) |
| 20 to 24 Years | 546 (99.5%) | 0 (0.0%) |
| 25 to 29 Years | 534 (98.2%) | 0 (0.0%) |
| 30 to 34 Years | 425 (83.7%) | 0 (0.0%) |
| 35 to 44 Years | 682 (93.0%) | 0 (0.0%) |
| 45 to 54 Years | 456 (94.8%) | 0 (0.0%) |
| 55 to 59 Years | 87 (77.0%) | 0 (0.0%) |
| 60 to 64 Years | 139 (56.5%) | 14 (10.1%) |
| 65 to 74 Years | 175 (21.6%) | 0 (0.0%) |
| 75 Years and over | 100 (31.5%) | 58 (58.0%) |
| Total | 3,278 (73.1%) | 72 (2.2%) |
Employment Status by Educational Attainment in Moab
According to labor force statistics for Moab, 88.5% of individuals (2,323) out of the total population between 25 and 64 years of age (2,625) are in the labor force, with 0.6% or 14 of them being unemployed. The group with the highest labor force participation rate are those with the educational attainment of high school diploma, with 95.9% or 611 individuals in the labor force. Within the labor force, individuals with bachelor's degree or higher education have the highest percentage of unemployment, with 1.5% or 14 of them being unemployed.
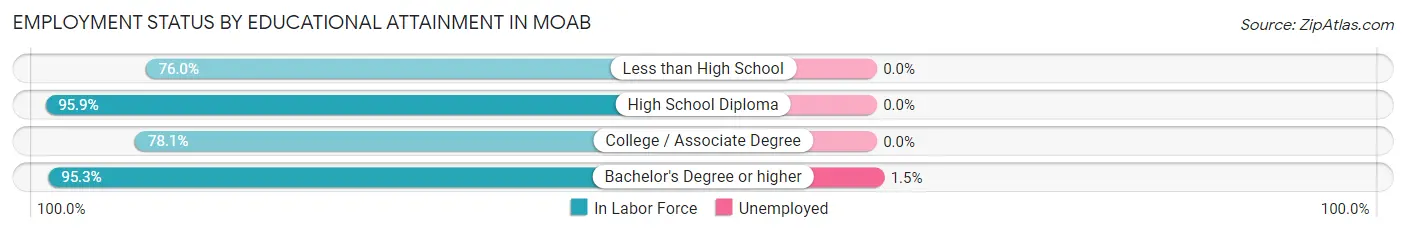
| Educational Attainment | In Labor Force | Unemployed |
| Less than High School | 155 (76.0%) | 0 (0.0%) |
| High School Diploma | 611 (95.9%) | 0 (0.0%) |
| College / Associate Degree | 648 (78.1%) | 0 (0.0%) |
| Bachelor's Degree or higher | 909 (95.3%) | 14 (1.5%) |
| Total | 2,323 (88.5%) | 16 (0.6%) |
Employment Occupations by Sex in Moab
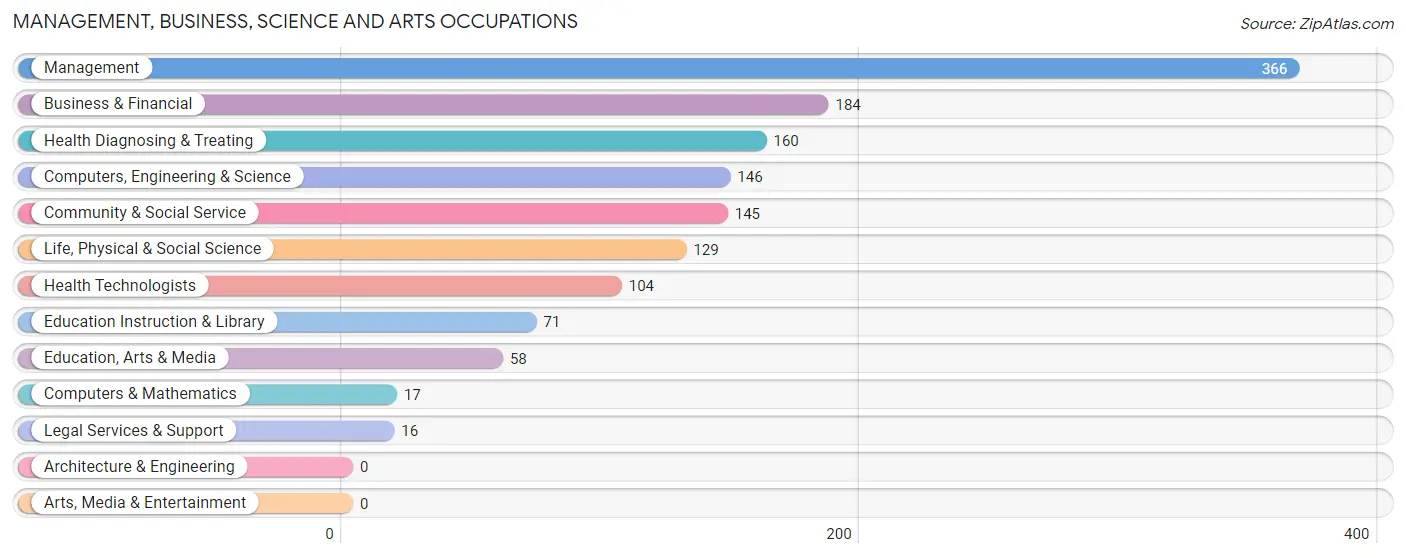
Management, Business, Science and Arts Occupations
The most common Management, Business, Science and Arts occupations in Moab are Management (366 | 11.4%), Business & Financial (184 | 5.7%), Health Diagnosing & Treating (160 | 5.0%), Computers, Engineering & Science (146 | 4.6%), and Community & Social Service (145 | 4.5%).
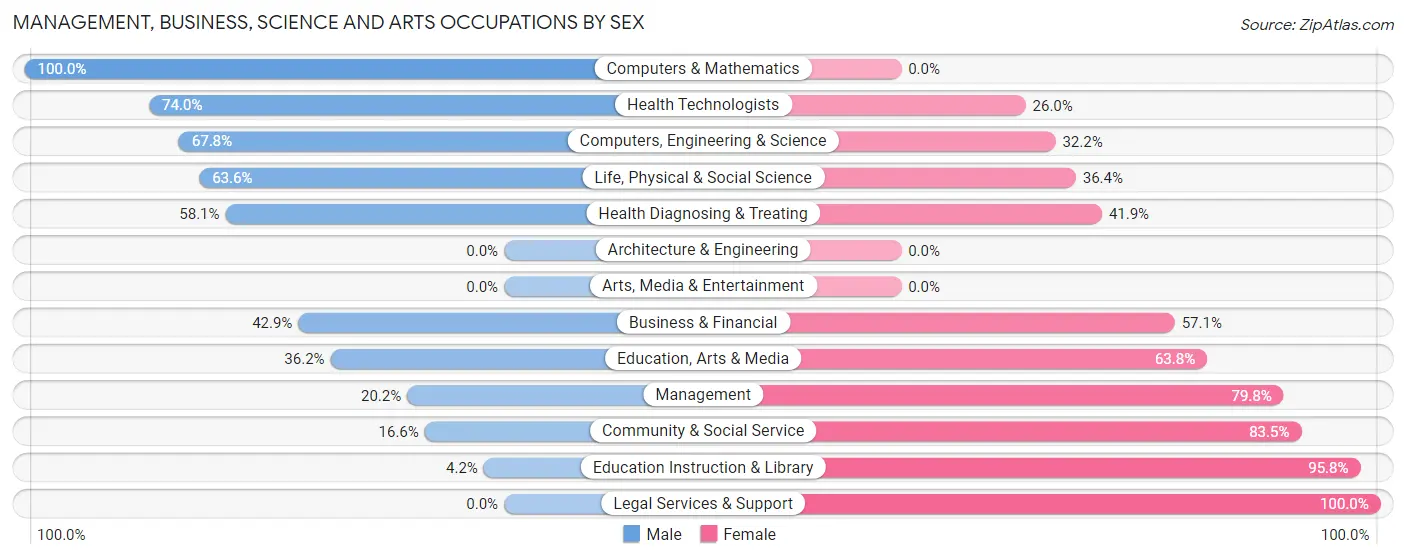
Management, Business, Science and Arts Occupations by Sex
Within the Management, Business, Science and Arts occupations in Moab, the most male-oriented occupations are Computers & Mathematics (100.0%), Health Technologists (74.0%), and Computers, Engineering & Science (67.8%), while the most female-oriented occupations are Legal Services & Support (100.0%), Education Instruction & Library (95.8%), and Community & Social Service (83.5%).
| Occupation | Male | Female |
| Management | 74 (20.2%) | 292 (79.8%) |
| Business & Financial | 79 (42.9%) | 105 (57.1%) |
| Computers, Engineering & Science | 99 (67.8%) | 47 (32.2%) |
| Computers & Mathematics | 17 (100.0%) | 0 (0.0%) |
| Architecture & Engineering | 0 (0.0%) | 0 (0.0%) |
| Life, Physical & Social Science | 82 (63.6%) | 47 (36.4%) |
| Community & Social Service | 24 (16.6%) | 121 (83.5%) |
| Education, Arts & Media | 21 (36.2%) | 37 (63.8%) |
| Legal Services & Support | 0 (0.0%) | 16 (100.0%) |
| Education Instruction & Library | 3 (4.2%) | 68 (95.8%) |
| Arts, Media & Entertainment | 0 (0.0%) | 0 (0.0%) |
| Health Diagnosing & Treating | 93 (58.1%) | 67 (41.9%) |
| Health Technologists | 77 (74.0%) | 27 (26.0%) |
| Total (Category) | 369 (36.9%) | 632 (63.1%) |
| Total (Overall) | 1,647 (51.4%) | 1,558 (48.6%) |
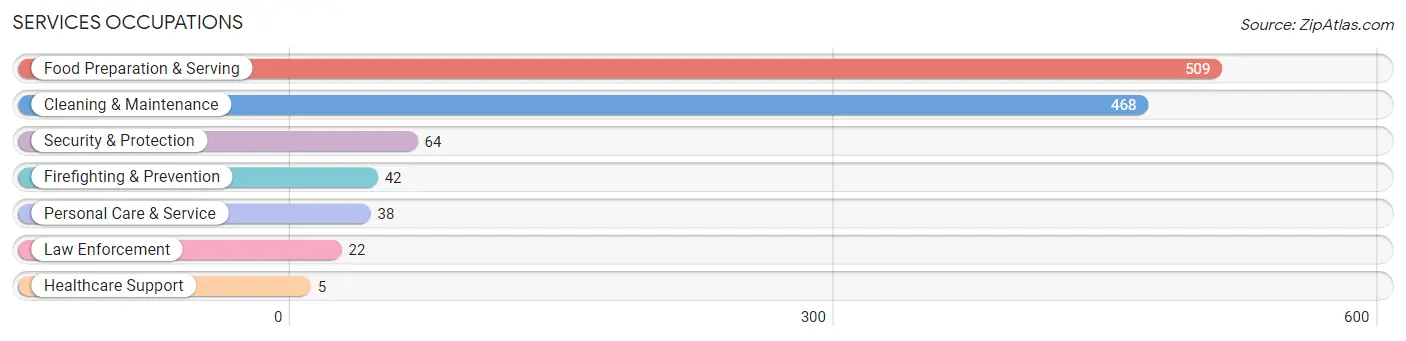
Services Occupations
The most common Services occupations in Moab are Food Preparation & Serving (509 | 15.9%), Cleaning & Maintenance (468 | 14.6%), Security & Protection (64 | 2.0%), Firefighting & Prevention (42 | 1.3%), and Personal Care & Service (38 | 1.2%).
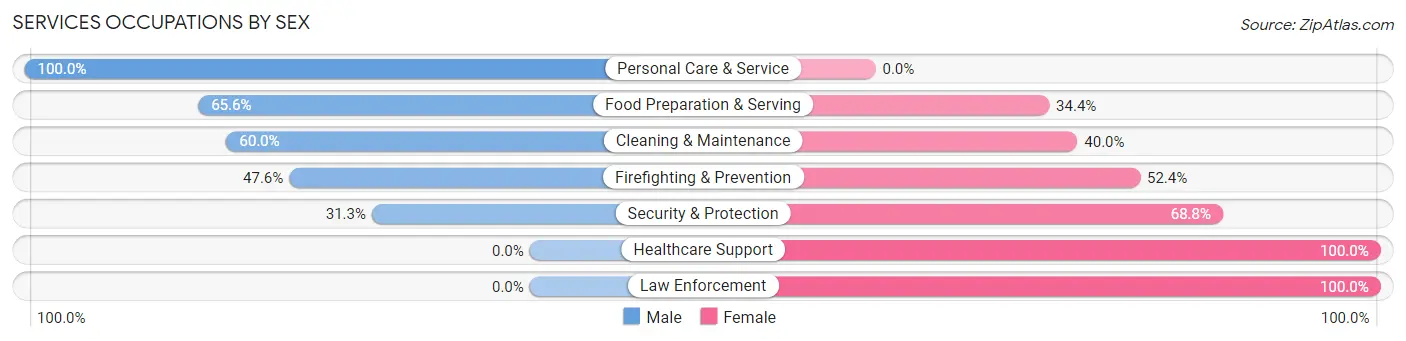
Services Occupations by Sex
Within the Services occupations in Moab, the most male-oriented occupations are Personal Care & Service (100.0%), Food Preparation & Serving (65.6%), and Cleaning & Maintenance (60.0%), while the most female-oriented occupations are Healthcare Support (100.0%), Law Enforcement (100.0%), and Security & Protection (68.8%).
| Occupation | Male | Female |
| Healthcare Support | 0 (0.0%) | 5 (100.0%) |
| Security & Protection | 20 (31.2%) | 44 (68.8%) |
| Firefighting & Prevention | 20 (47.6%) | 22 (52.4%) |
| Law Enforcement | 0 (0.0%) | 22 (100.0%) |
| Food Preparation & Serving | 334 (65.6%) | 175 (34.4%) |
| Cleaning & Maintenance | 281 (60.0%) | 187 (40.0%) |
| Personal Care & Service | 38 (100.0%) | 0 (0.0%) |
| Total (Category) | 673 (62.1%) | 411 (37.9%) |
| Total (Overall) | 1,647 (51.4%) | 1,558 (48.6%) |
Sales and Office Occupations
The most common Sales and Office occupations in Moab are Sales & Related (326 | 10.2%), and Office & Administration (255 | 8.0%).
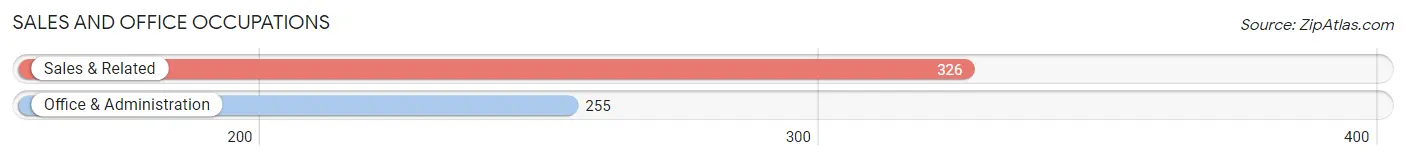
Sales and Office Occupations by Sex
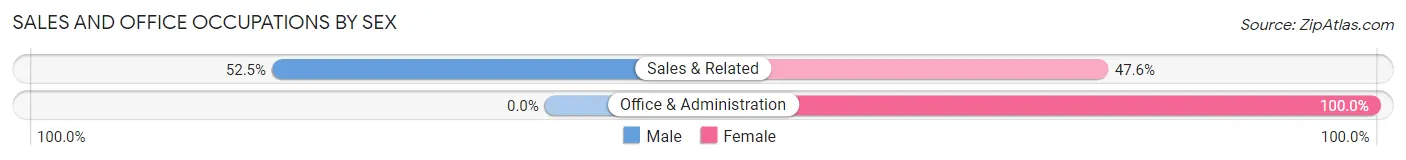
| Occupation | Male | Female |
| Sales & Related | 171 (52.4%) | 155 (47.5%) |
| Office & Administration | 0 (0.0%) | 255 (100.0%) |
| Total (Category) | 171 (29.4%) | 410 (70.6%) |
| Total (Overall) | 1,647 (51.4%) | 1,558 (48.6%) |
Natural Resources, Construction and Maintenance Occupations
The most common Natural Resources, Construction and Maintenance occupations in Moab are Construction & Extraction (202 | 6.3%), Installation, Maintenance & Repair (50 | 1.6%), and Farming, Fishing & Forestry (41 | 1.3%).
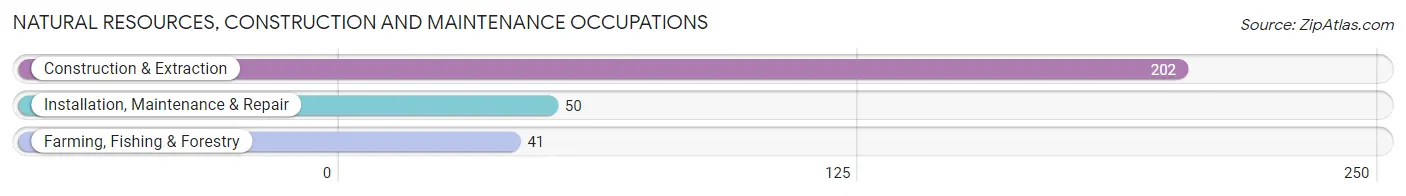
Natural Resources, Construction and Maintenance Occupations by Sex
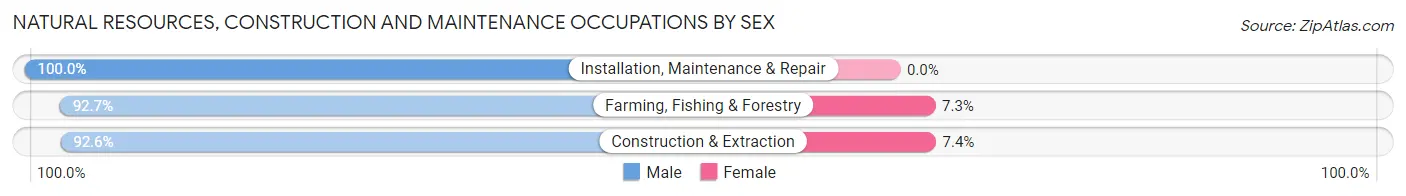
| Occupation | Male | Female |
| Farming, Fishing & Forestry | 38 (92.7%) | 3 (7.3%) |
| Construction & Extraction | 187 (92.6%) | 15 (7.4%) |
| Installation, Maintenance & Repair | 50 (100.0%) | 0 (0.0%) |
| Total (Category) | 275 (93.9%) | 18 (6.1%) |
| Total (Overall) | 1,647 (51.4%) | 1,558 (48.6%) |
Production, Transportation and Moving Occupations
The most common Production, Transportation and Moving occupations in Moab are Production (204 | 6.4%), and Transportation (42 | 1.3%).
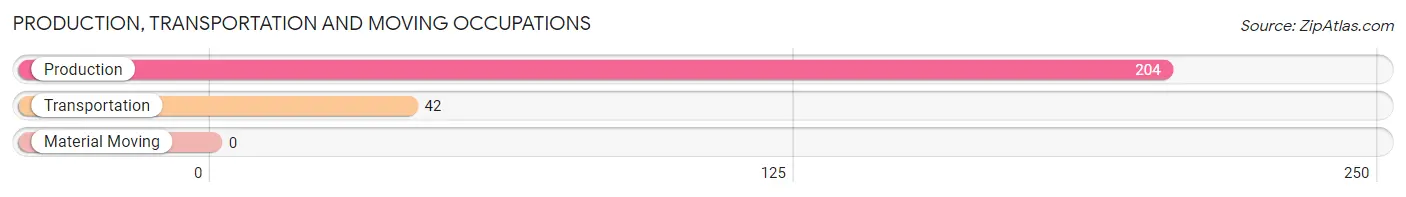
Production, Transportation and Moving Occupations by Sex
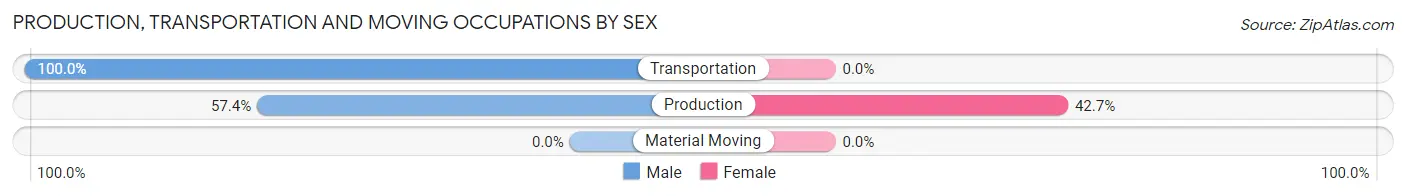
| Occupation | Male | Female |
| Production | 117 (57.4%) | 87 (42.6%) |
| Transportation | 42 (100.0%) | 0 (0.0%) |
| Material Moving | 0 (0.0%) | 0 (0.0%) |
| Total (Category) | 159 (64.6%) | 87 (35.4%) |
| Total (Overall) | 1,647 (51.4%) | 1,558 (48.6%) |
Employment Industries by Sex in Moab
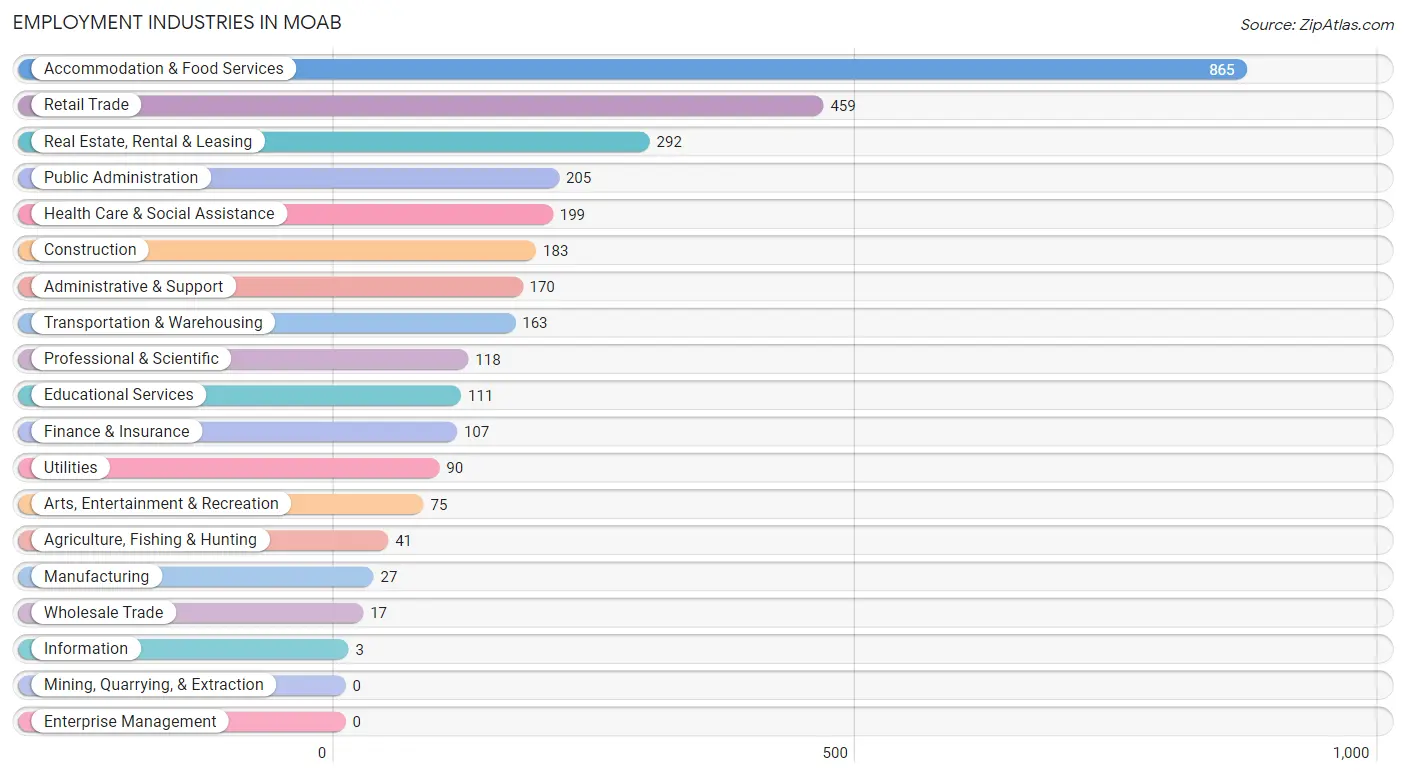
Employment Industries in Moab
The major employment industries in Moab include Accommodation & Food Services (865 | 27.0%), Retail Trade (459 | 14.3%), Real Estate, Rental & Leasing (292 | 9.1%), Public Administration (205 | 6.4%), and Health Care & Social Assistance (199 | 6.2%).
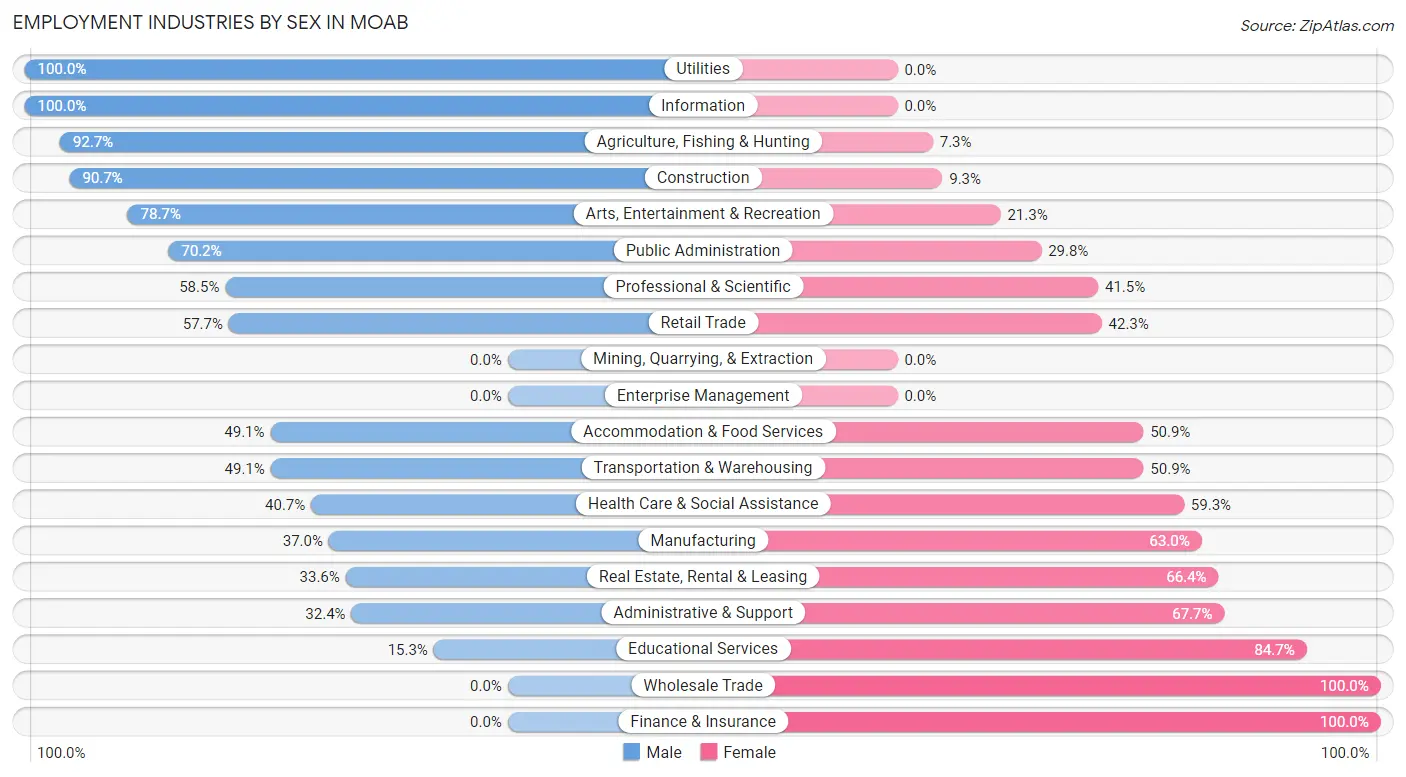
Employment Industries by Sex in Moab
The Moab industries that see more men than women are Utilities (100.0%), Information (100.0%), and Agriculture, Fishing & Hunting (92.7%), whereas the industries that tend to have a higher number of women are Wholesale Trade (100.0%), Finance & Insurance (100.0%), and Educational Services (84.7%).
| Industry | Male | Female |
| Agriculture, Fishing & Hunting | 38 (92.7%) | 3 (7.3%) |
| Mining, Quarrying, & Extraction | 0 (0.0%) | 0 (0.0%) |
| Construction | 166 (90.7%) | 17 (9.3%) |
| Manufacturing | 10 (37.0%) | 17 (63.0%) |
| Wholesale Trade | 0 (0.0%) | 17 (100.0%) |
| Retail Trade | 265 (57.7%) | 194 (42.3%) |
| Transportation & Warehousing | 80 (49.1%) | 83 (50.9%) |
| Utilities | 90 (100.0%) | 0 (0.0%) |
| Information | 3 (100.0%) | 0 (0.0%) |
| Finance & Insurance | 0 (0.0%) | 107 (100.0%) |
| Real Estate, Rental & Leasing | 98 (33.6%) | 194 (66.4%) |
| Professional & Scientific | 69 (58.5%) | 49 (41.5%) |
| Enterprise Management | 0 (0.0%) | 0 (0.0%) |
| Administrative & Support | 55 (32.4%) | 115 (67.6%) |
| Educational Services | 17 (15.3%) | 94 (84.7%) |
| Health Care & Social Assistance | 81 (40.7%) | 118 (59.3%) |
| Arts, Entertainment & Recreation | 59 (78.7%) | 16 (21.3%) |
| Accommodation & Food Services | 425 (49.1%) | 440 (50.9%) |
| Public Administration | 144 (70.2%) | 61 (29.8%) |
| Total | 1,647 (51.4%) | 1,558 (48.6%) |
Education in Moab
School Enrollment in Moab
The most common levels of schooling among the 892 students in Moab are middle school (210 | 23.5%), high school (200 | 22.4%), and elementary school (176 | 19.7%).
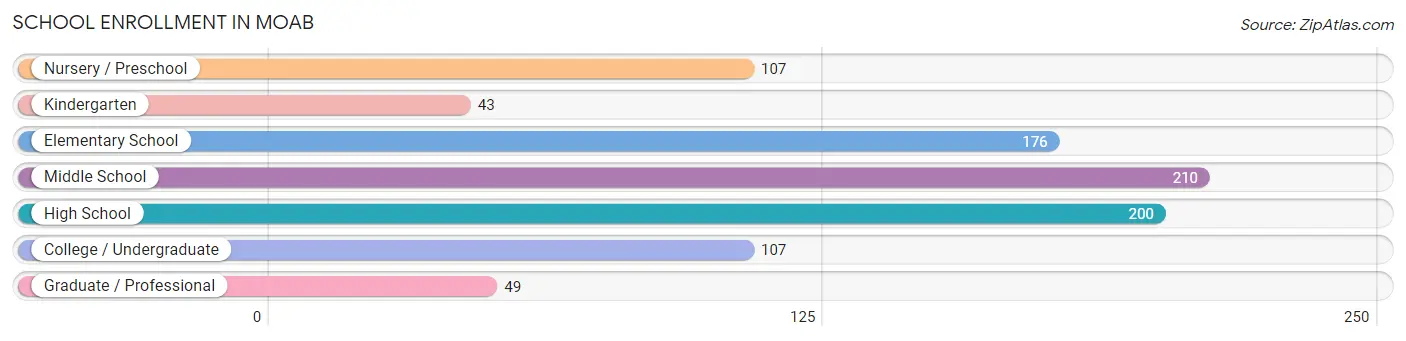
| School Level | # Students | % Students |
| Nursery / Preschool | 107 | 12.0% |
| Kindergarten | 43 | 4.8% |
| Elementary School | 176 | 19.7% |
| Middle School | 210 | 23.5% |
| High School | 200 | 22.4% |
| College / Undergraduate | 107 | 12.0% |
| Graduate / Professional | 49 | 5.5% |
| Total | 892 | 100.0% |
School Enrollment by Age by Funding Source in Moab
Out of a total of 892 students who are enrolled in schools in Moab, 160 (17.9%) attend a private institution, while the remaining 732 (82.1%) are enrolled in public schools. The age group of 3 to 4 year olds has the highest likelihood of being enrolled in private schools, with 94 (100.0% in the age bracket) enrolled. Conversely, the age group of 5 to 9 year old has the lowest likelihood of being enrolled in a private school, with 232 (100.0% in the age bracket) attending a public institution.
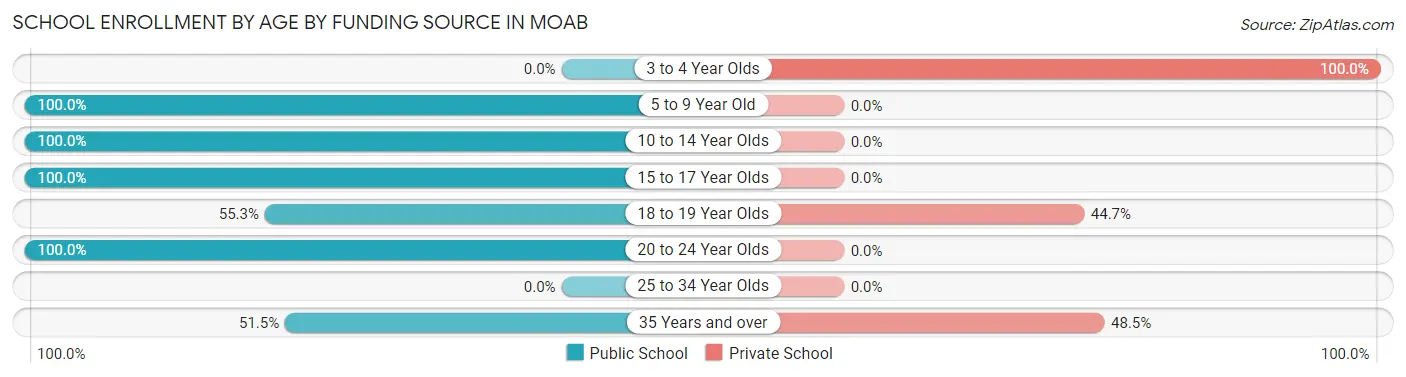
| Age Bracket | Public School | Private School |
| 3 to 4 Year Olds | 0 (0.0%) | 94 (100.0%) |
| 5 to 9 Year Old | 232 (100.0%) | 0 (0.0%) |
| 10 to 14 Year Olds | 269 (100.0%) | 0 (0.0%) |
| 15 to 17 Year Olds | 117 (100.0%) | 0 (0.0%) |
| 18 to 19 Year Olds | 21 (55.3%) | 17 (44.7%) |
| 20 to 24 Year Olds | 41 (100.0%) | 0 (0.0%) |
| 25 to 34 Year Olds | 0 (0.0%) | 0 (0.0%) |
| 35 Years and over | 52 (51.5%) | 49 (48.5%) |
| Total | 732 (82.1%) | 160 (17.9%) |
Educational Attainment by Field of Study in Moab
Bio, nature & agricultural (245 | 17.9%), arts & humanities (234 | 17.1%), social sciences (129 | 9.5%), education (129 | 9.5%), and psychology (110 | 8.1%) are the most common fields of study among 1,365 individuals in Moab who have obtained a bachelor's degree or higher.
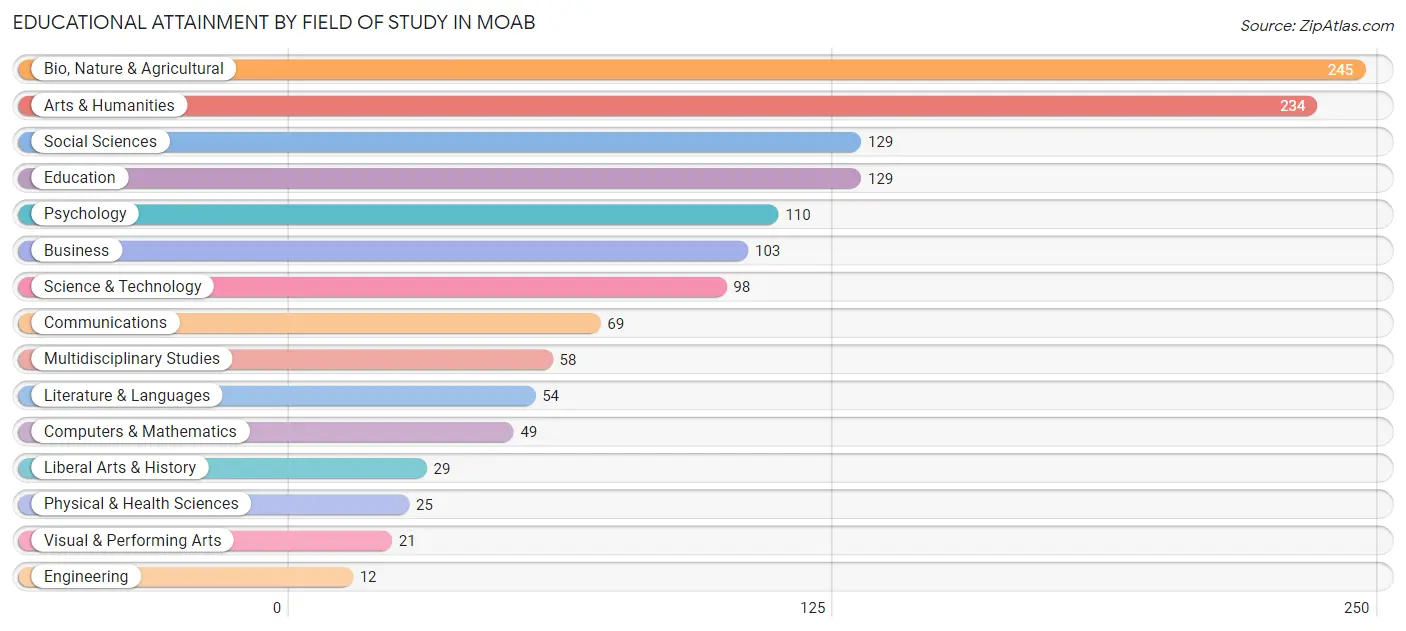
| Field of Study | # Graduates | % Graduates |
| Computers & Mathematics | 49 | 3.6% |
| Bio, Nature & Agricultural | 245 | 17.9% |
| Physical & Health Sciences | 25 | 1.8% |
| Psychology | 110 | 8.1% |
| Social Sciences | 129 | 9.5% |
| Engineering | 12 | 0.9% |
| Multidisciplinary Studies | 58 | 4.3% |
| Science & Technology | 98 | 7.2% |
| Business | 103 | 7.5% |
| Education | 129 | 9.5% |
| Literature & Languages | 54 | 4.0% |
| Liberal Arts & History | 29 | 2.1% |
| Visual & Performing Arts | 21 | 1.5% |
| Communications | 69 | 5.1% |
| Arts & Humanities | 234 | 17.1% |
| Total | 1,365 | 100.0% |
Transportation & Commute in Moab
Vehicle Availability by Sex in Moab
The most prevalent vehicle ownership categories in Moab are males with 2 vehicles (576, accounting for 38.1%) and females with 2 vehicles (436, making up 37.4%).
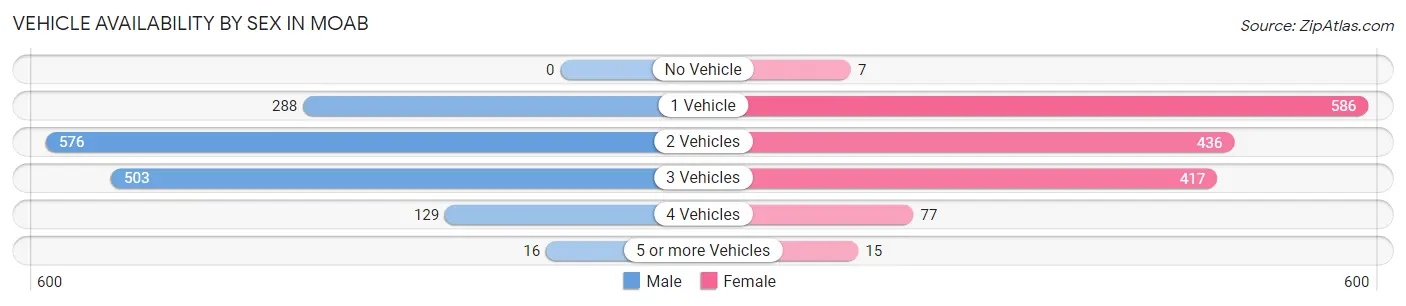
| Vehicles Available | Male | Female |
| No Vehicle | 0 (0.0%) | 7 (0.5%) |
| 1 Vehicle | 288 (19.1%) | 586 (38.1%) |
| 2 Vehicles | 576 (38.1%) | 436 (28.3%) |
| 3 Vehicles | 503 (33.3%) | 417 (27.1%) |
| 4 Vehicles | 129 (8.5%) | 77 (5.0%) |
| 5 or more Vehicles | 16 (1.1%) | 15 (1.0%) |
| Total | 1,512 (100.0%) | 1,538 (100.0%) |
Commute Time in Moab
The most frequently occuring commute durations in Moab are 5 to 9 minutes (1,400 commuters, 49.4%), less than 5 minutes (469 commuters, 16.5%), and 15 to 19 minutes (359 commuters, 12.7%).
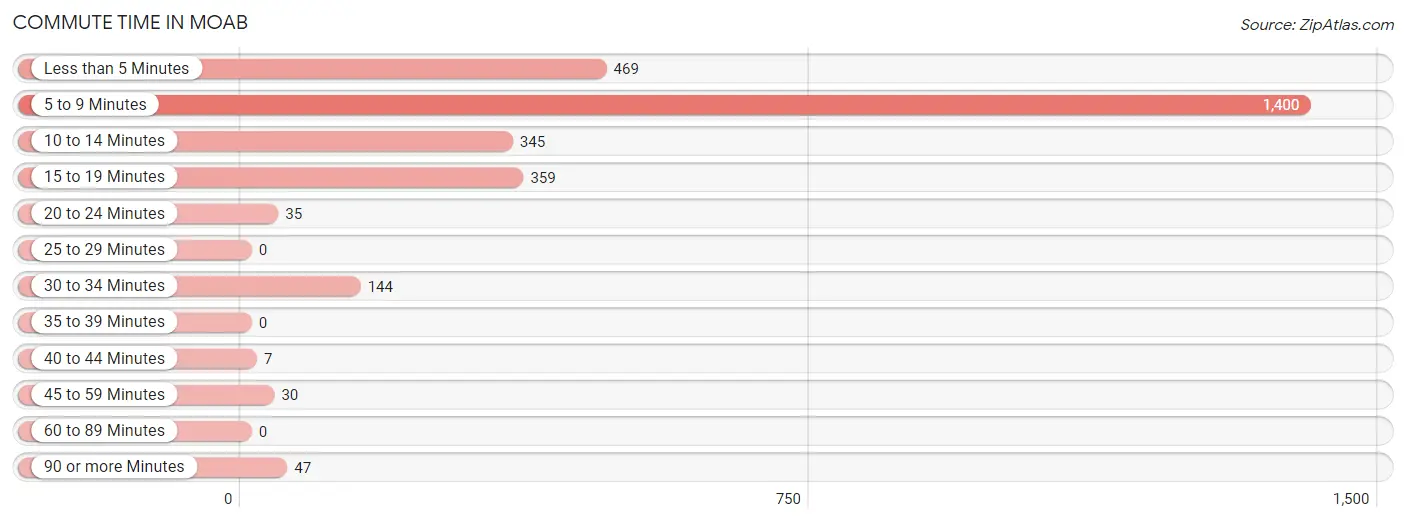
| Commute Time | # Commuters | % Commuters |
| Less than 5 Minutes | 469 | 16.5% |
| 5 to 9 Minutes | 1,400 | 49.4% |
| 10 to 14 Minutes | 345 | 12.2% |
| 15 to 19 Minutes | 359 | 12.7% |
| 20 to 24 Minutes | 35 | 1.2% |
| 25 to 29 Minutes | 0 | 0.0% |
| 30 to 34 Minutes | 144 | 5.1% |
| 35 to 39 Minutes | 0 | 0.0% |
| 40 to 44 Minutes | 7 | 0.3% |
| 45 to 59 Minutes | 30 | 1.1% |
| 60 to 89 Minutes | 0 | 0.0% |
| 90 or more Minutes | 47 | 1.7% |
Commute Time by Sex in Moab
The most common commute times in Moab are 5 to 9 minutes (510 commuters, 34.6%) for males and 5 to 9 minutes (890 commuters, 65.2%) for females.
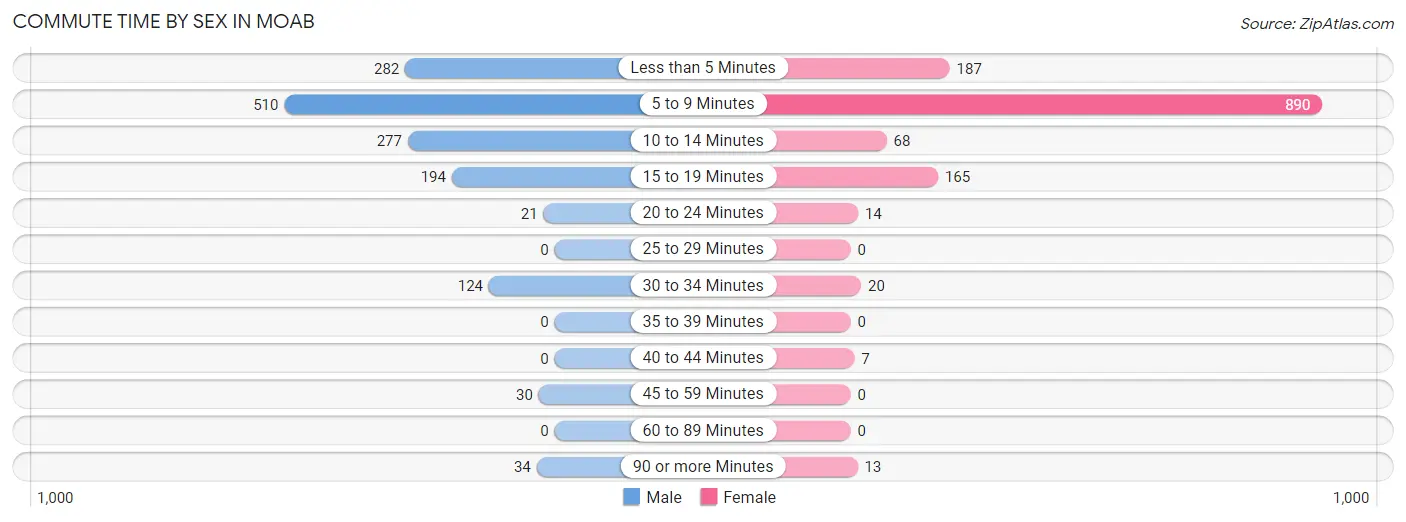
| Commute Time | Male | Female |
| Less than 5 Minutes | 282 (19.2%) | 187 (13.7%) |
| 5 to 9 Minutes | 510 (34.6%) | 890 (65.2%) |
| 10 to 14 Minutes | 277 (18.8%) | 68 (5.0%) |
| 15 to 19 Minutes | 194 (13.2%) | 165 (12.1%) |
| 20 to 24 Minutes | 21 (1.4%) | 14 (1.0%) |
| 25 to 29 Minutes | 0 (0.0%) | 0 (0.0%) |
| 30 to 34 Minutes | 124 (8.4%) | 20 (1.5%) |
| 35 to 39 Minutes | 0 (0.0%) | 0 (0.0%) |
| 40 to 44 Minutes | 0 (0.0%) | 7 (0.5%) |
| 45 to 59 Minutes | 30 (2.0%) | 0 (0.0%) |
| 60 to 89 Minutes | 0 (0.0%) | 0 (0.0%) |
| 90 or more Minutes | 34 (2.3%) | 13 (0.9%) |
Time of Departure to Work by Sex in Moab
The most frequent times of departure to work in Moab are 8:00 AM to 8:29 AM (300, 20.4%) for males and 4:00 PM to 11:59 PM (252, 18.5%) for females.
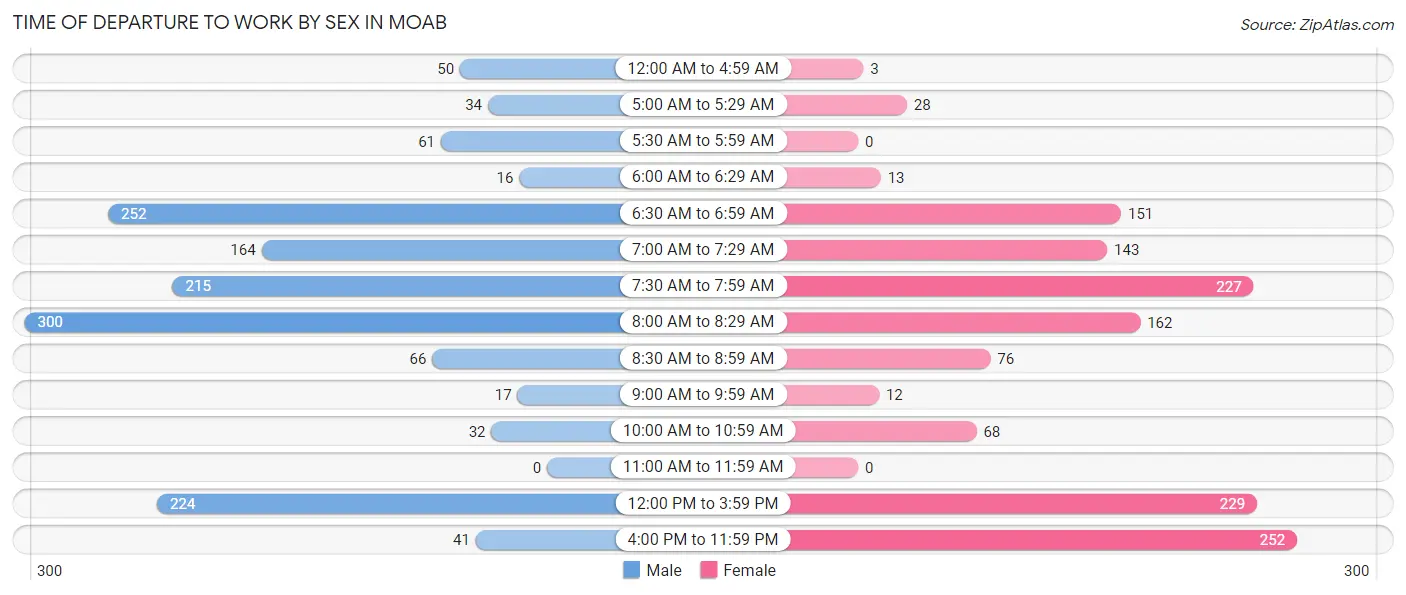
| Time of Departure | Male | Female |
| 12:00 AM to 4:59 AM | 50 (3.4%) | 3 (0.2%) |
| 5:00 AM to 5:29 AM | 34 (2.3%) | 28 (2.1%) |
| 5:30 AM to 5:59 AM | 61 (4.1%) | 0 (0.0%) |
| 6:00 AM to 6:29 AM | 16 (1.1%) | 13 (0.9%) |
| 6:30 AM to 6:59 AM | 252 (17.1%) | 151 (11.1%) |
| 7:00 AM to 7:29 AM | 164 (11.1%) | 143 (10.5%) |
| 7:30 AM to 7:59 AM | 215 (14.6%) | 227 (16.6%) |
| 8:00 AM to 8:29 AM | 300 (20.4%) | 162 (11.9%) |
| 8:30 AM to 8:59 AM | 66 (4.5%) | 76 (5.6%) |
| 9:00 AM to 9:59 AM | 17 (1.1%) | 12 (0.9%) |
| 10:00 AM to 10:59 AM | 32 (2.2%) | 68 (5.0%) |
| 11:00 AM to 11:59 AM | 0 (0.0%) | 0 (0.0%) |
| 12:00 PM to 3:59 PM | 224 (15.2%) | 229 (16.8%) |
| 4:00 PM to 11:59 PM | 41 (2.8%) | 252 (18.5%) |
| Total | 1,472 (100.0%) | 1,364 (100.0%) |
Housing Occupancy in Moab
Occupancy by Ownership in Moab
Of the total 2,284 dwellings in Moab, owner-occupied units account for 1,243 (54.4%), while renter-occupied units make up 1,041 (45.6%).
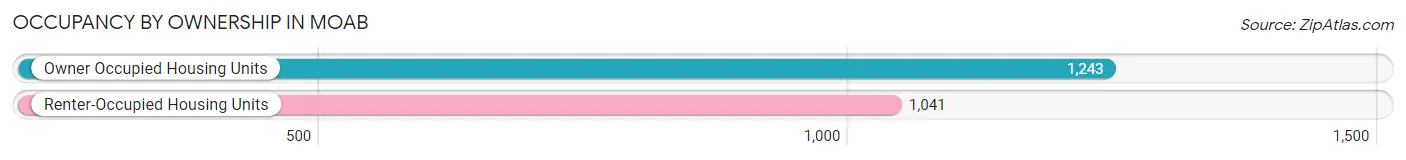
| Occupancy | # Housing Units | % Housing Units |
| Owner Occupied Housing Units | 1,243 | 54.4% |
| Renter-Occupied Housing Units | 1,041 | 45.6% |
| Total Occupied Housing Units | 2,284 | 100.0% |
Occupancy by Household Size in Moab
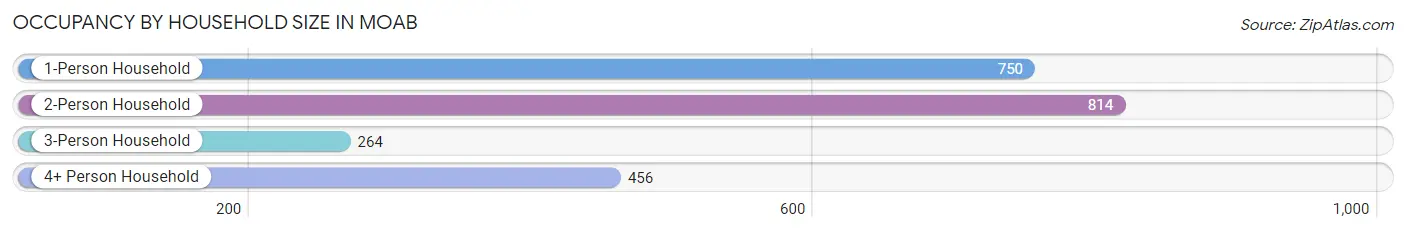
| Household Size | # Housing Units | % Housing Units |
| 1-Person Household | 750 | 32.8% |
| 2-Person Household | 814 | 35.6% |
| 3-Person Household | 264 | 11.6% |
| 4+ Person Household | 456 | 20.0% |
| Total Housing Units | 2,284 | 100.0% |
Occupancy by Ownership by Household Size in Moab
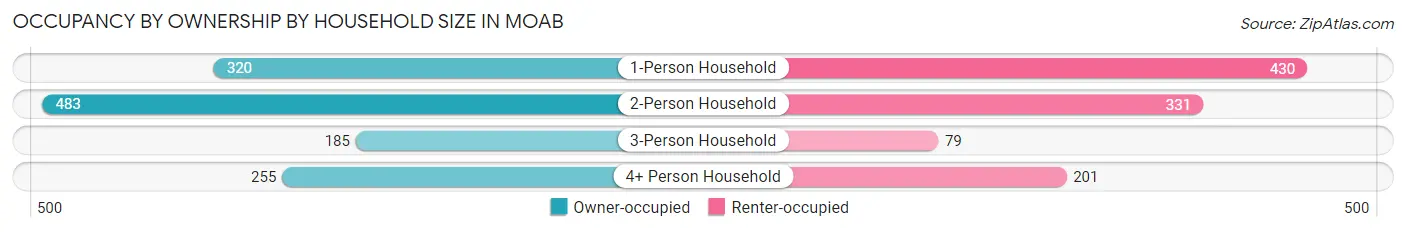
| Household Size | Owner-occupied | Renter-occupied |
| 1-Person Household | 320 (42.7%) | 430 (57.3%) |
| 2-Person Household | 483 (59.3%) | 331 (40.7%) |
| 3-Person Household | 185 (70.1%) | 79 (29.9%) |
| 4+ Person Household | 255 (55.9%) | 201 (44.1%) |
| Total Housing Units | 1,243 (54.4%) | 1,041 (45.6%) |
Occupancy by Educational Attainment in Moab
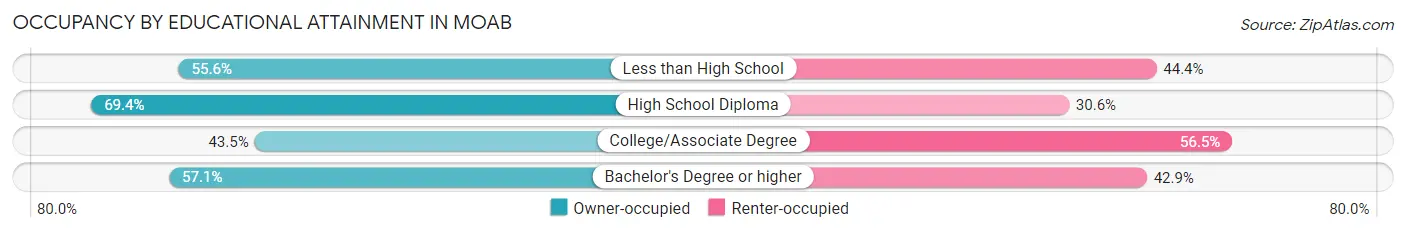
| Household Size | Owner-occupied | Renter-occupied |
| Less than High School | 85 (55.6%) | 68 (44.4%) |
| High School Diploma | 343 (69.4%) | 151 (30.6%) |
| College/Associate Degree | 384 (43.5%) | 498 (56.5%) |
| Bachelor's Degree or higher | 431 (57.1%) | 324 (42.9%) |
Occupancy by Age of Householder in Moab
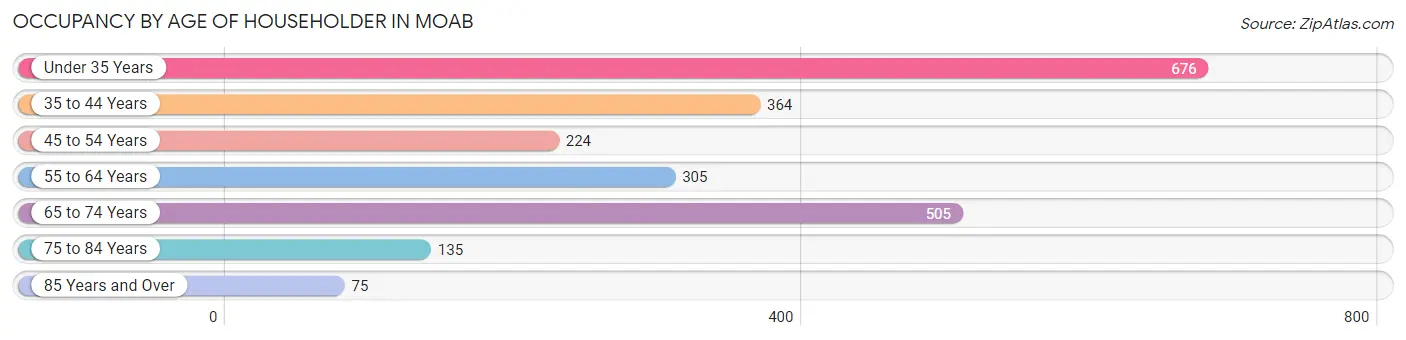
| Age Bracket | # Households | % Households |
| Under 35 Years | 676 | 29.6% |
| 35 to 44 Years | 364 | 15.9% |
| 45 to 54 Years | 224 | 9.8% |
| 55 to 64 Years | 305 | 13.4% |
| 65 to 74 Years | 505 | 22.1% |
| 75 to 84 Years | 135 | 5.9% |
| 85 Years and Over | 75 | 3.3% |
| Total | 2,284 | 100.0% |
Housing Finances in Moab
Median Income by Occupancy in Moab
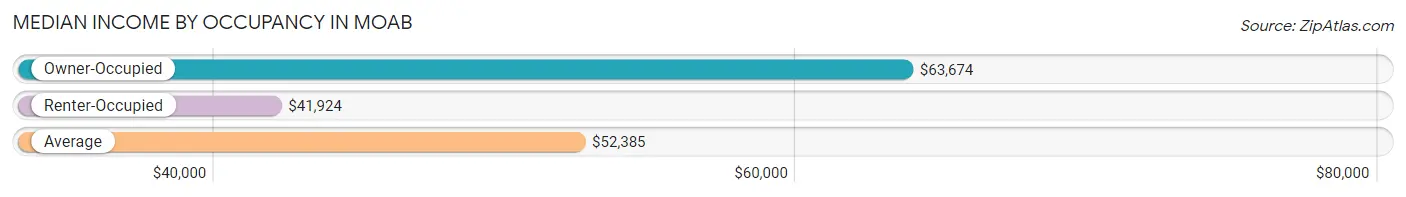
| Occupancy Type | # Households | Median Income |
| Owner-Occupied | 1,243 (54.4%) | $63,674 |
| Renter-Occupied | 1,041 (45.6%) | $41,924 |
| Average | 2,284 (100.0%) | $52,385 |
Occupancy by Householder Income Bracket in Moab
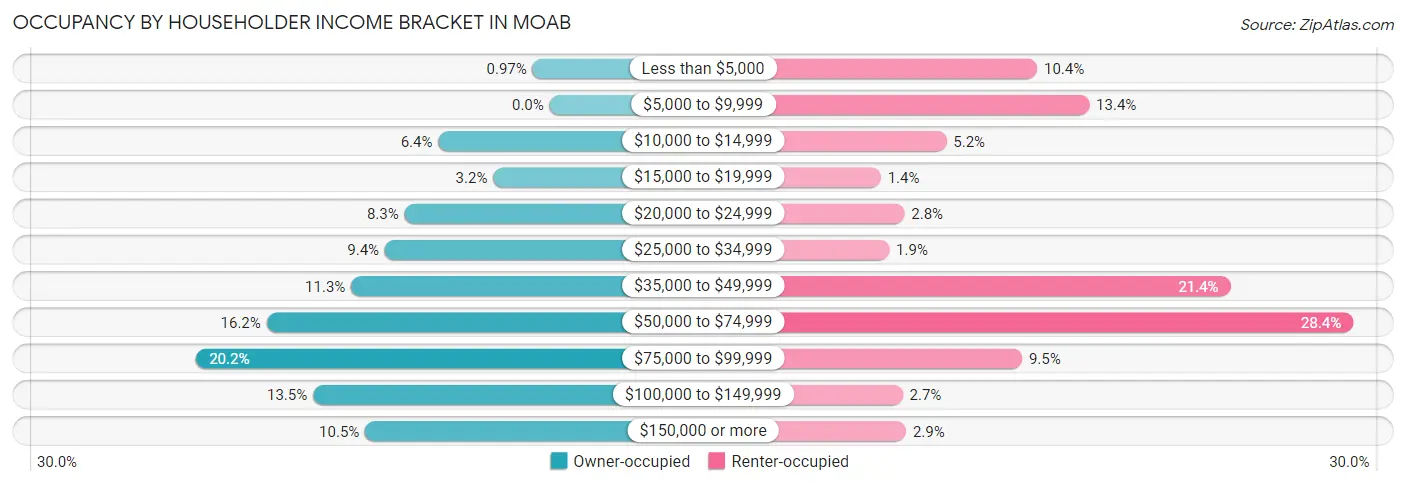
| Income Bracket | Owner-occupied | Renter-occupied |
| Less than $5,000 | 12 (1.0%) | 108 (10.4%) |
| $5,000 to $9,999 | 0 (0.0%) | 139 (13.4%) |
| $10,000 to $14,999 | 79 (6.4%) | 54 (5.2%) |
| $15,000 to $19,999 | 40 (3.2%) | 15 (1.4%) |
| $20,000 to $24,999 | 103 (8.3%) | 29 (2.8%) |
| $25,000 to $34,999 | 117 (9.4%) | 20 (1.9%) |
| $35,000 to $49,999 | 141 (11.3%) | 223 (21.4%) |
| $50,000 to $74,999 | 201 (16.2%) | 296 (28.4%) |
| $75,000 to $99,999 | 251 (20.2%) | 99 (9.5%) |
| $100,000 to $149,999 | 168 (13.5%) | 28 (2.7%) |
| $150,000 or more | 131 (10.5%) | 30 (2.9%) |
| Total | 1,243 (100.0%) | 1,041 (100.0%) |
Monthly Housing Cost Tiers in Moab
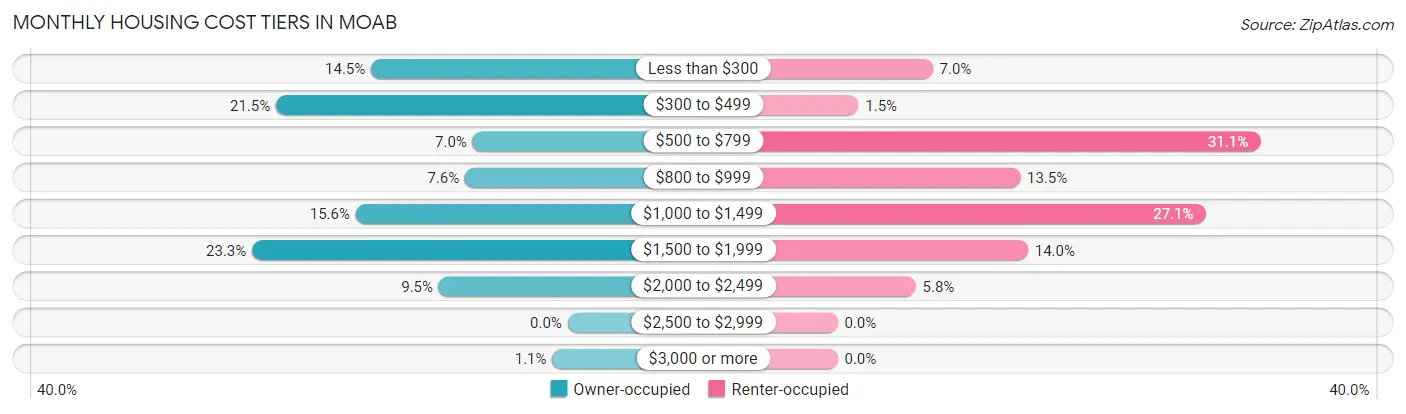
| Monthly Cost | Owner-occupied | Renter-occupied |
| Less than $300 | 180 (14.5%) | 73 (7.0%) |
| $300 to $499 | 267 (21.5%) | 16 (1.5%) |
| $500 to $799 | 87 (7.0%) | 324 (31.1%) |
| $800 to $999 | 94 (7.6%) | 140 (13.5%) |
| $1,000 to $1,499 | 194 (15.6%) | 282 (27.1%) |
| $1,500 to $1,999 | 289 (23.3%) | 146 (14.0%) |
| $2,000 to $2,499 | 118 (9.5%) | 60 (5.8%) |
| $2,500 to $2,999 | 0 (0.0%) | 0 (0.0%) |
| $3,000 or more | 14 (1.1%) | 0 (0.0%) |
| Total | 1,243 (100.0%) | 1,041 (100.0%) |
Physical Housing Characteristics in Moab
Housing Structures in Moab
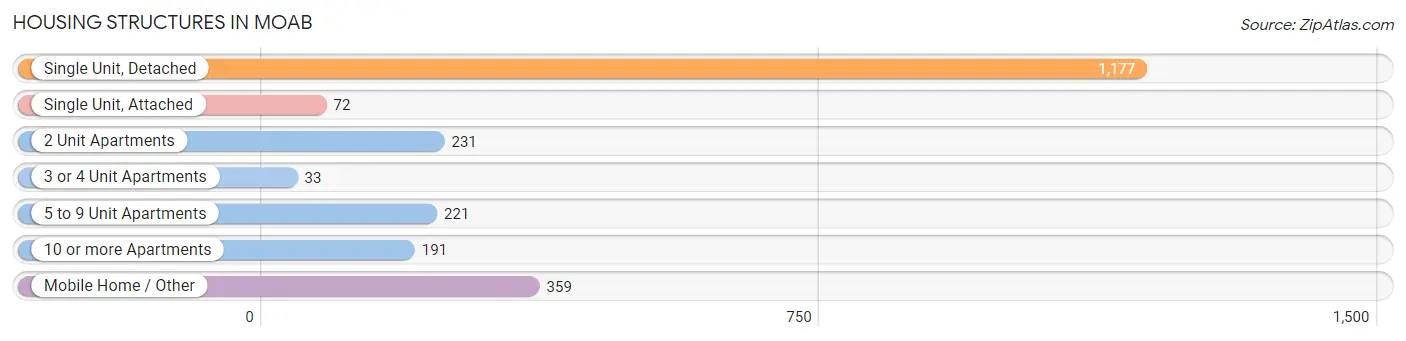
| Structure Type | # Housing Units | % Housing Units |
| Single Unit, Detached | 1,177 | 51.5% |
| Single Unit, Attached | 72 | 3.2% |
| 2 Unit Apartments | 231 | 10.1% |
| 3 or 4 Unit Apartments | 33 | 1.4% |
| 5 to 9 Unit Apartments | 221 | 9.7% |
| 10 or more Apartments | 191 | 8.4% |
| Mobile Home / Other | 359 | 15.7% |
| Total | 2,284 | 100.0% |
Housing Structures by Occupancy in Moab
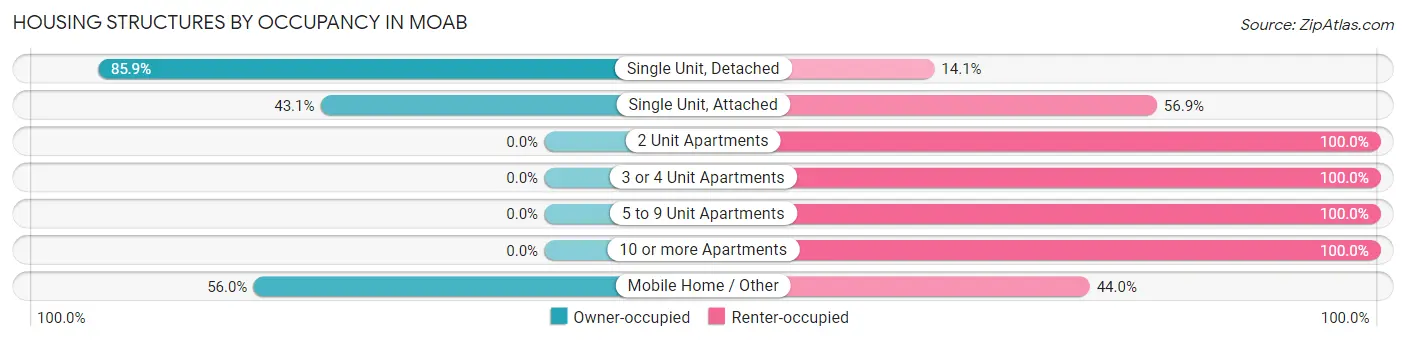
| Structure Type | Owner-occupied | Renter-occupied |
| Single Unit, Detached | 1,011 (85.9%) | 166 (14.1%) |
| Single Unit, Attached | 31 (43.1%) | 41 (56.9%) |
| 2 Unit Apartments | 0 (0.0%) | 231 (100.0%) |
| 3 or 4 Unit Apartments | 0 (0.0%) | 33 (100.0%) |
| 5 to 9 Unit Apartments | 0 (0.0%) | 221 (100.0%) |
| 10 or more Apartments | 0 (0.0%) | 191 (100.0%) |
| Mobile Home / Other | 201 (56.0%) | 158 (44.0%) |
| Total | 1,243 (54.4%) | 1,041 (45.6%) |
Housing Structures by Number of Rooms in Moab
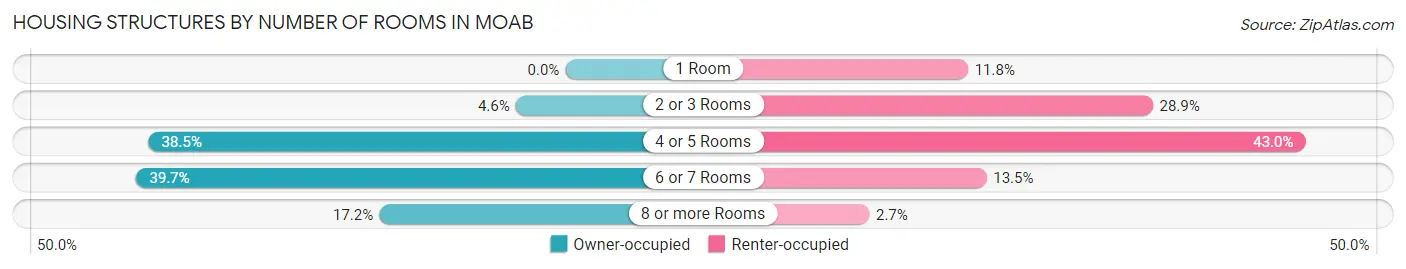
| Number of Rooms | Owner-occupied | Renter-occupied |
| 1 Room | 0 (0.0%) | 123 (11.8%) |
| 2 or 3 Rooms | 57 (4.6%) | 301 (28.9%) |
| 4 or 5 Rooms | 479 (38.5%) | 448 (43.0%) |
| 6 or 7 Rooms | 493 (39.7%) | 141 (13.5%) |
| 8 or more Rooms | 214 (17.2%) | 28 (2.7%) |
| Total | 1,243 (100.0%) | 1,041 (100.0%) |
Housing Structure by Heating Type in Moab
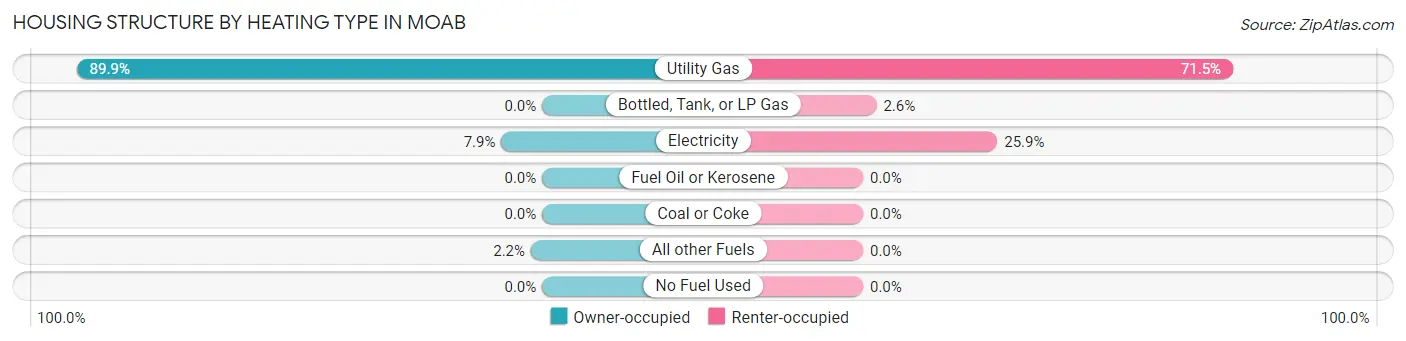
| Heating Type | Owner-occupied | Renter-occupied |
| Utility Gas | 1,118 (89.9%) | 744 (71.5%) |
| Bottled, Tank, or LP Gas | 0 (0.0%) | 27 (2.6%) |
| Electricity | 98 (7.9%) | 270 (25.9%) |
| Fuel Oil or Kerosene | 0 (0.0%) | 0 (0.0%) |
| Coal or Coke | 0 (0.0%) | 0 (0.0%) |
| All other Fuels | 27 (2.2%) | 0 (0.0%) |
| No Fuel Used | 0 (0.0%) | 0 (0.0%) |
| Total | 1,243 (100.0%) | 1,041 (100.0%) |
Household Vehicle Usage in Moab
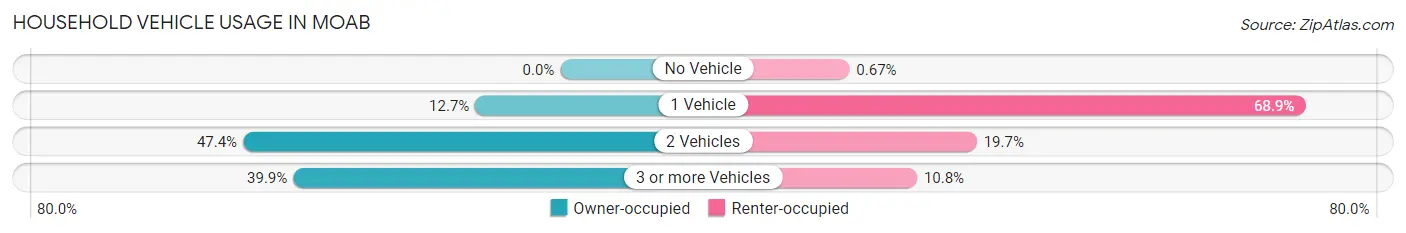
| Vehicles per Household | Owner-occupied | Renter-occupied |
| No Vehicle | 0 (0.0%) | 7 (0.7%) |
| 1 Vehicle | 158 (12.7%) | 717 (68.9%) |
| 2 Vehicles | 589 (47.4%) | 205 (19.7%) |
| 3 or more Vehicles | 496 (39.9%) | 112 (10.8%) |
| Total | 1,243 (100.0%) | 1,041 (100.0%) |
Real Estate & Mortgages in Moab
Real Estate and Mortgage Overview in Moab
| Characteristic | Without Mortgage | With Mortgage |
| Housing Units | 555 | 688 |
| Median Property Value | $374,600 | $433,300 |
| Median Household Income | $75,701 | $81 |
| Monthly Housing Costs | $359 | $14 |
| Real Estate Taxes | $1,583 | $3 |
Property Value by Mortgage Status in Moab
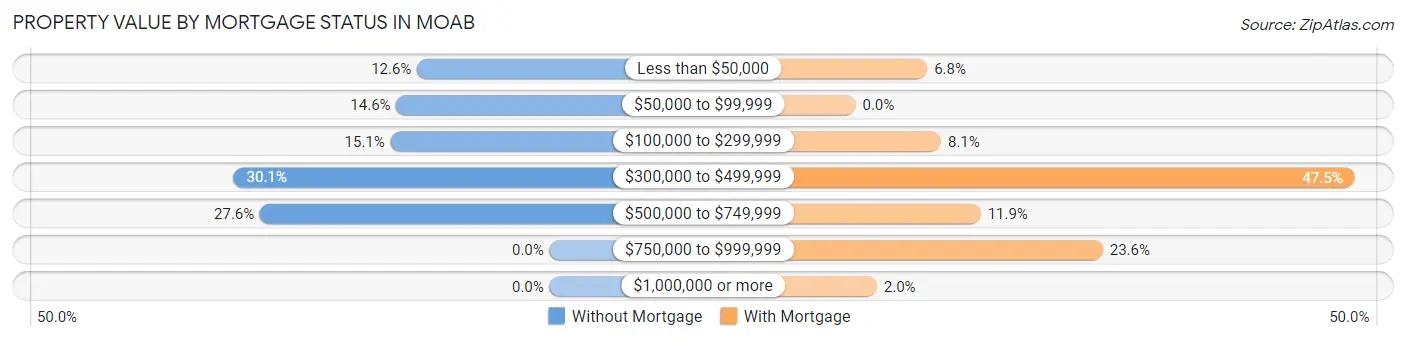
| Property Value | Without Mortgage | With Mortgage |
| Less than $50,000 | 70 (12.6%) | 47 (6.8%) |
| $50,000 to $99,999 | 81 (14.6%) | 0 (0.0%) |
| $100,000 to $299,999 | 84 (15.1%) | 56 (8.1%) |
| $300,000 to $499,999 | 167 (30.1%) | 327 (47.5%) |
| $500,000 to $749,999 | 153 (27.6%) | 82 (11.9%) |
| $750,000 to $999,999 | 0 (0.0%) | 162 (23.5%) |
| $1,000,000 or more | 0 (0.0%) | 14 (2.0%) |
| Total | 555 (100.0%) | 688 (100.0%) |
Household Income by Mortgage Status in Moab
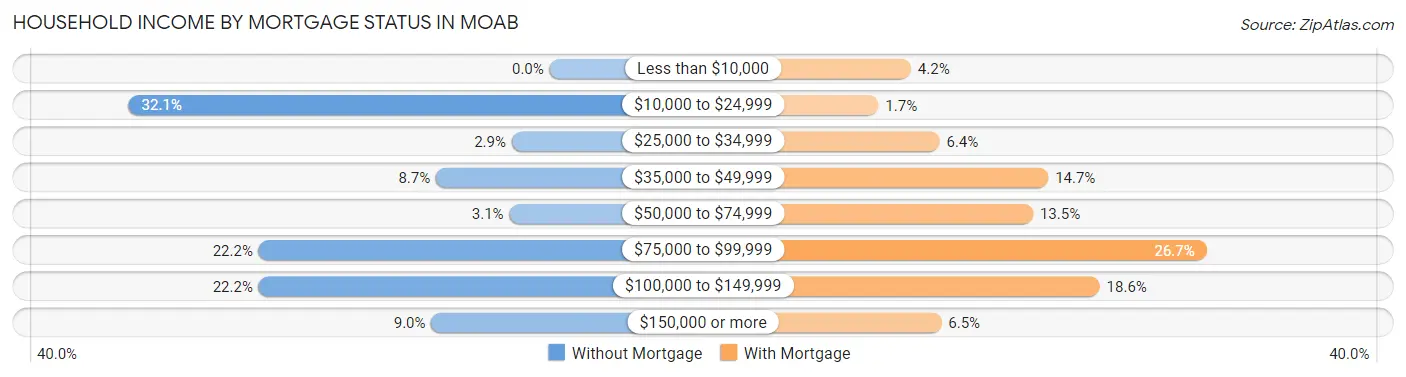
| Household Income | Without Mortgage | With Mortgage |
| Less than $10,000 | 0 (0.0%) | 29 (4.2%) |
| $10,000 to $24,999 | 178 (32.1%) | 12 (1.7%) |
| $25,000 to $34,999 | 16 (2.9%) | 44 (6.4%) |
| $35,000 to $49,999 | 48 (8.6%) | 101 (14.7%) |
| $50,000 to $74,999 | 17 (3.1%) | 93 (13.5%) |
| $75,000 to $99,999 | 123 (22.2%) | 184 (26.7%) |
| $100,000 to $149,999 | 123 (22.2%) | 128 (18.6%) |
| $150,000 or more | 50 (9.0%) | 45 (6.5%) |
| Total | 555 (100.0%) | 688 (100.0%) |
Property Value to Household Income Ratio in Moab
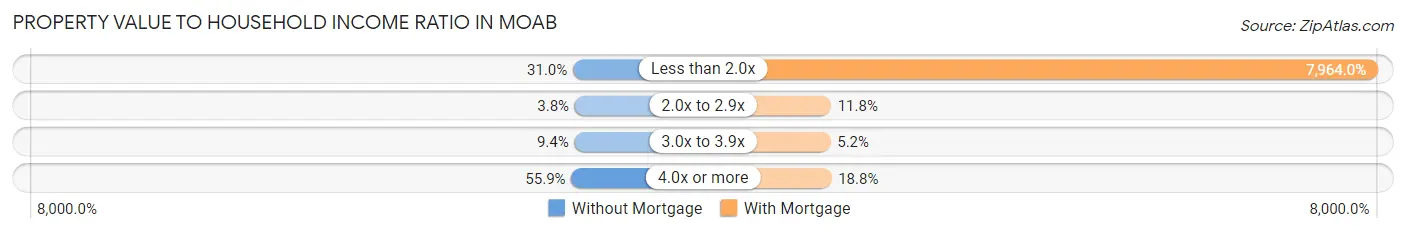
| Value-to-Income Ratio | Without Mortgage | With Mortgage |
| Less than 2.0x | 172 (31.0%) | 54,792 (7,963.9%) |
| 2.0x to 2.9x | 21 (3.8%) | 81 (11.8%) |
| 3.0x to 3.9x | 52 (9.4%) | 36 (5.2%) |
| 4.0x or more | 310 (55.9%) | 129 (18.8%) |
| Total | 555 (100.0%) | 688 (100.0%) |
Real Estate Taxes by Mortgage Status in Moab
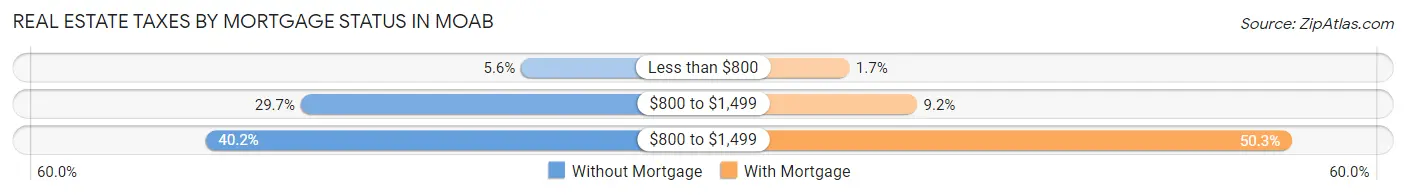
| Property Taxes | Without Mortgage | With Mortgage |
| Less than $800 | 31 (5.6%) | 12 (1.7%) |
| $800 to $1,499 | 165 (29.7%) | 63 (9.2%) |
| $800 to $1,499 | 223 (40.2%) | 346 (50.3%) |
| Total | 555 (100.0%) | 688 (100.0%) |
Health & Disability in Moab
Health Insurance Coverage by Age in Moab
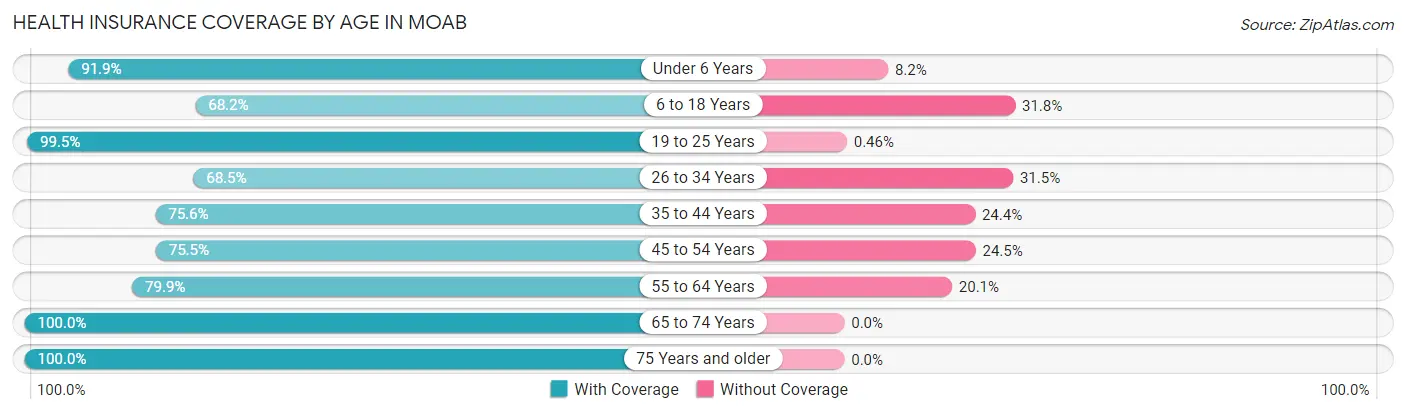
| Age Bracket | With Coverage | Without Coverage |
| Under 6 Years | 248 (91.8%) | 22 (8.2%) |
| 6 to 18 Years | 516 (68.2%) | 241 (31.8%) |
| 19 to 25 Years | 649 (99.5%) | 3 (0.5%) |
| 26 to 34 Years | 645 (68.5%) | 296 (31.5%) |
| 35 to 44 Years | 543 (75.6%) | 175 (24.4%) |
| 45 to 54 Years | 358 (75.5%) | 116 (24.5%) |
| 55 to 64 Years | 283 (79.9%) | 71 (20.1%) |
| 65 to 74 Years | 785 (100.0%) | 0 (0.0%) |
| 75 Years and older | 307 (100.0%) | 0 (0.0%) |
| Total | 4,334 (82.4%) | 924 (17.6%) |
Health Insurance Coverage by Citizenship Status in Moab
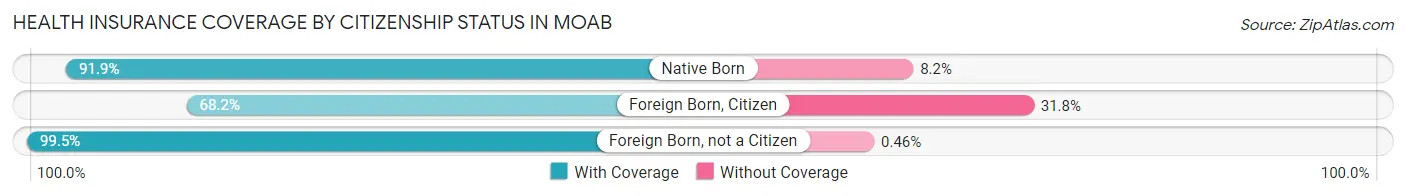
| Citizenship Status | With Coverage | Without Coverage |
| Native Born | 248 (91.8%) | 22 (8.2%) |
| Foreign Born, Citizen | 516 (68.2%) | 241 (31.8%) |
| Foreign Born, not a Citizen | 649 (99.5%) | 3 (0.5%) |
Health Insurance Coverage by Household Income in Moab
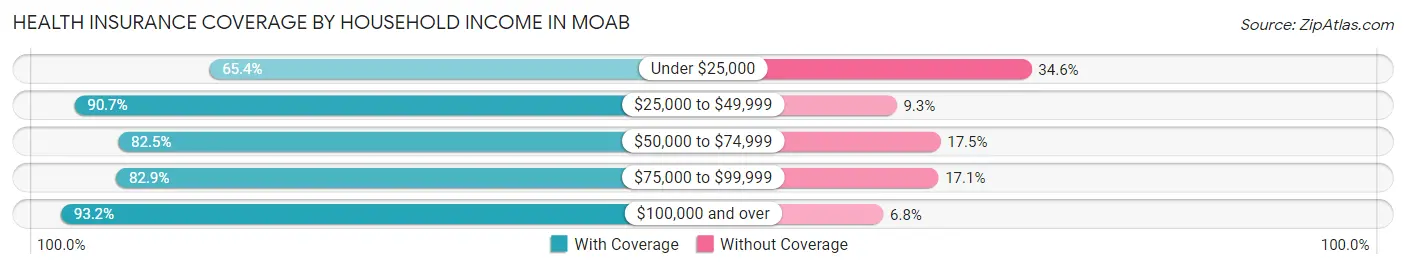
| Household Income | With Coverage | Without Coverage |
| Under $25,000 | 713 (65.4%) | 377 (34.6%) |
| $25,000 to $49,999 | 779 (90.7%) | 80 (9.3%) |
| $50,000 to $74,999 | 1,069 (82.5%) | 227 (17.5%) |
| $75,000 to $99,999 | 808 (82.9%) | 167 (17.1%) |
| $100,000 and over | 959 (93.2%) | 70 (6.8%) |
Public vs Private Health Insurance Coverage by Age in Moab
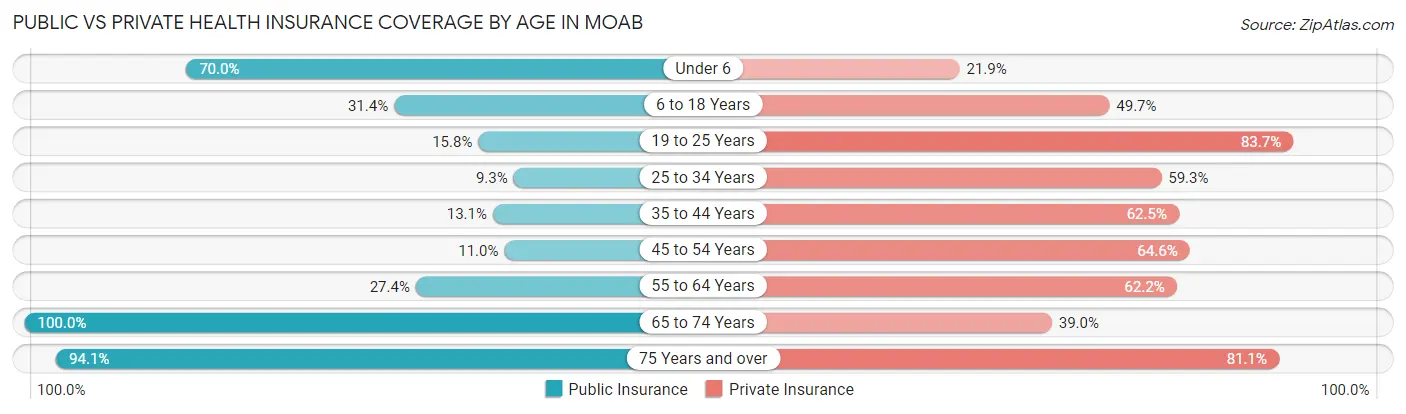
| Age Bracket | Public Insurance | Private Insurance |
| Under 6 | 189 (70.0%) | 59 (21.8%) |
| 6 to 18 Years | 238 (31.4%) | 376 (49.7%) |
| 19 to 25 Years | 103 (15.8%) | 546 (83.7%) |
| 25 to 34 Years | 87 (9.2%) | 558 (59.3%) |
| 35 to 44 Years | 94 (13.1%) | 449 (62.5%) |
| 45 to 54 Years | 52 (11.0%) | 306 (64.6%) |
| 55 to 64 Years | 97 (27.4%) | 220 (62.2%) |
| 65 to 74 Years | 785 (100.0%) | 306 (39.0%) |
| 75 Years and over | 289 (94.1%) | 249 (81.1%) |
| Total | 1,934 (36.8%) | 3,069 (58.4%) |
Disability Status by Sex by Age in Moab
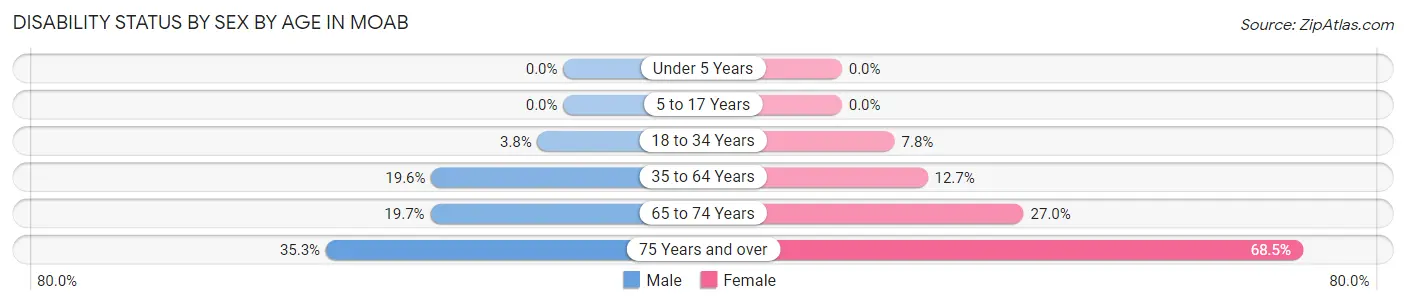
| Age Bracket | Male | Female |
| Under 5 Years | 0 (0.0%) | 0 (0.0%) |
| 5 to 17 Years | 0 (0.0%) | 0 (0.0%) |
| 18 to 34 Years | 34 (3.8%) | 61 (7.8%) |
| 35 to 64 Years | 146 (19.6%) | 102 (12.7%) |
| 65 to 74 Years | 76 (19.7%) | 108 (27.0%) |
| 75 Years and over | 49 (35.2%) | 115 (68.4%) |
Disability Class by Sex by Age in Moab
Disability Class: Hearing Difficulty
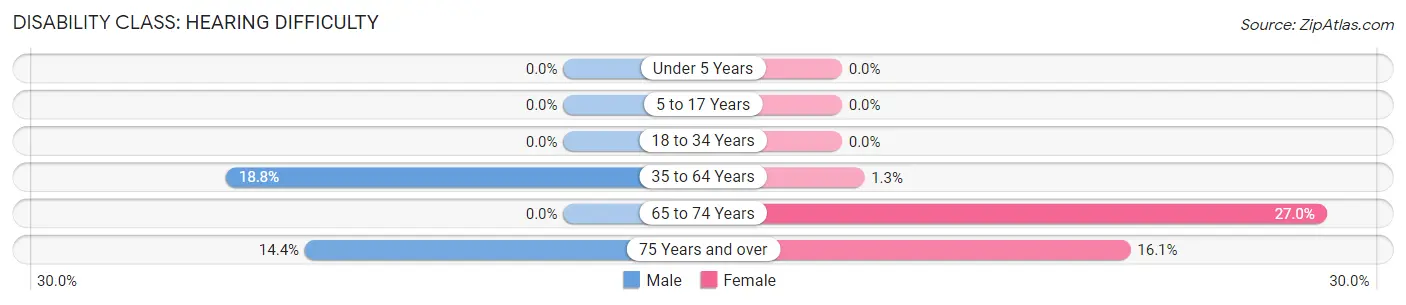
| Age Bracket | Male | Female |
| Under 5 Years | 0 (0.0%) | 0 (0.0%) |
| 5 to 17 Years | 0 (0.0%) | 0 (0.0%) |
| 18 to 34 Years | 0 (0.0%) | 0 (0.0%) |
| 35 to 64 Years | 140 (18.8%) | 10 (1.3%) |
| 65 to 74 Years | 0 (0.0%) | 108 (27.0%) |
| 75 Years and over | 20 (14.4%) | 27 (16.1%) |
Disability Class: Vision Difficulty
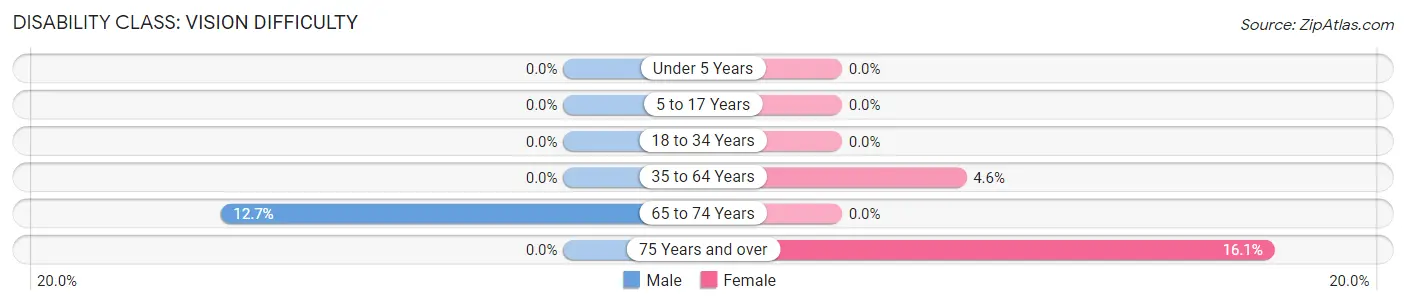
| Age Bracket | Male | Female |
| Under 5 Years | 0 (0.0%) | 0 (0.0%) |
| 5 to 17 Years | 0 (0.0%) | 0 (0.0%) |
| 18 to 34 Years | 0 (0.0%) | 0 (0.0%) |
| 35 to 64 Years | 0 (0.0%) | 37 (4.6%) |
| 65 to 74 Years | 49 (12.7%) | 0 (0.0%) |
| 75 Years and over | 0 (0.0%) | 27 (16.1%) |
Disability Class: Cognitive Difficulty
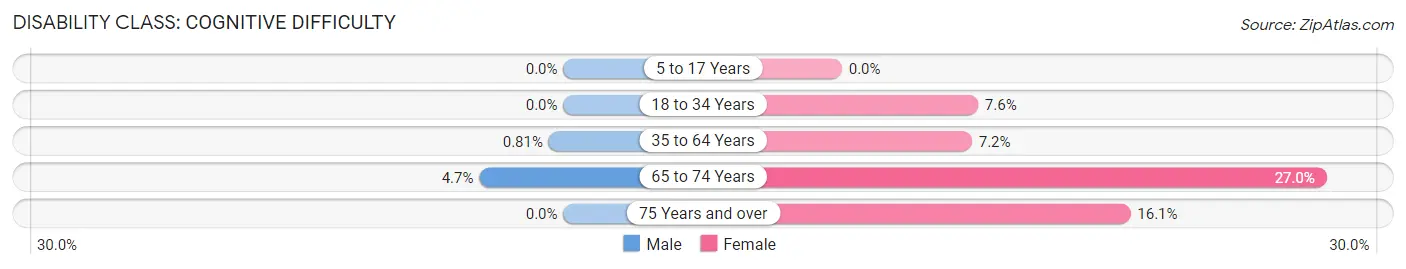
| Age Bracket | Male | Female |
| 5 to 17 Years | 0 (0.0%) | 0 (0.0%) |
| 18 to 34 Years | 0 (0.0%) | 59 (7.6%) |
| 35 to 64 Years | 6 (0.8%) | 58 (7.2%) |
| 65 to 74 Years | 18 (4.7%) | 108 (27.0%) |
| 75 Years and over | 0 (0.0%) | 27 (16.1%) |
Disability Class: Ambulatory Difficulty
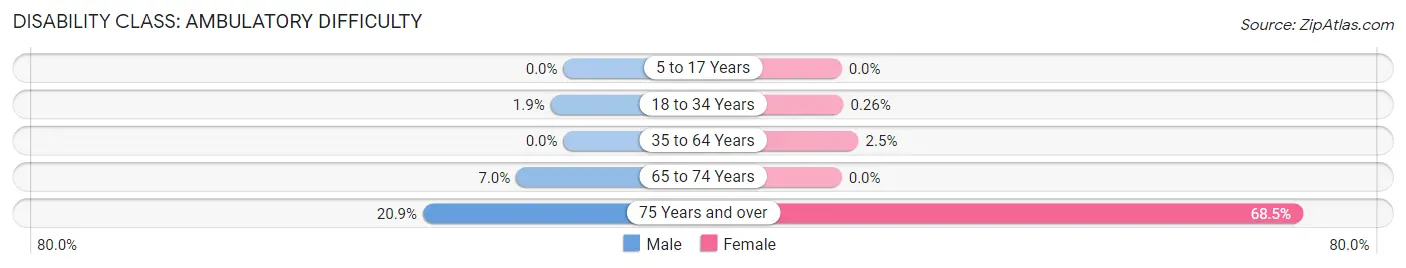
| Age Bracket | Male | Female |
| 5 to 17 Years | 0 (0.0%) | 0 (0.0%) |
| 18 to 34 Years | 17 (1.9%) | 2 (0.3%) |
| 35 to 64 Years | 0 (0.0%) | 20 (2.5%) |
| 65 to 74 Years | 27 (7.0%) | 0 (0.0%) |
| 75 Years and over | 29 (20.9%) | 115 (68.4%) |
Disability Class: Self-Care Difficulty
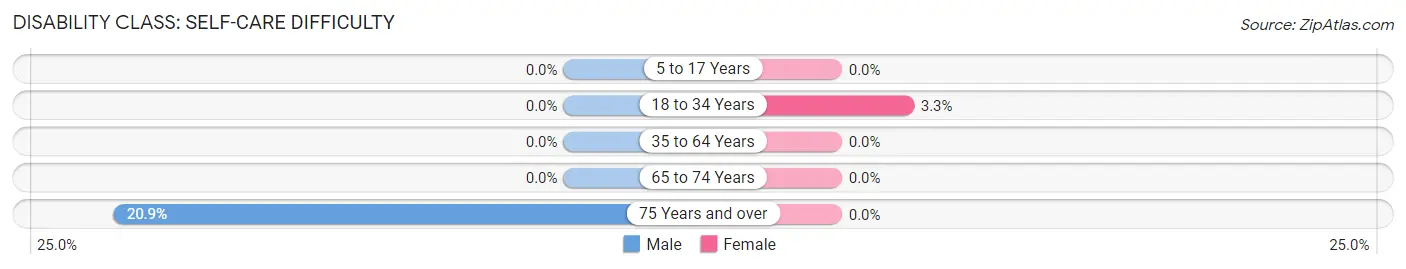
| Age Bracket | Male | Female |
| 5 to 17 Years | 0 (0.0%) | 0 (0.0%) |
| 18 to 34 Years | 0 (0.0%) | 26 (3.3%) |
| 35 to 64 Years | 0 (0.0%) | 0 (0.0%) |
| 65 to 74 Years | 0 (0.0%) | 0 (0.0%) |
| 75 Years and over | 29 (20.9%) | 0 (0.0%) |
Technology Access in Moab
Computing Device Access in Moab
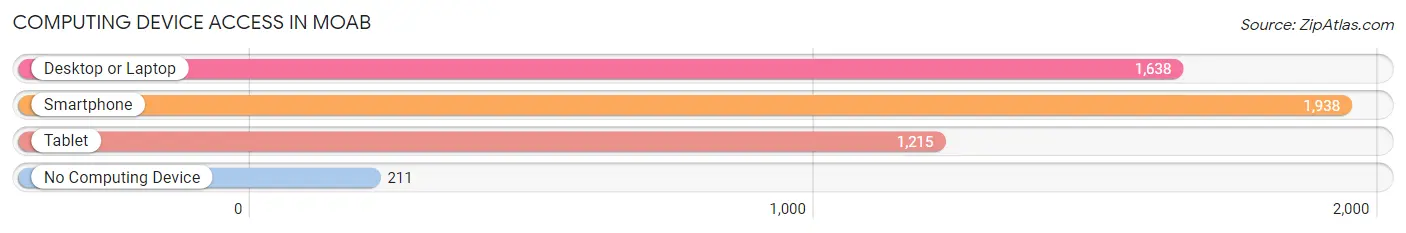
| Device Type | # Households | % Households |
| Desktop or Laptop | 1,638 | 71.7% |
| Smartphone | 1,938 | 84.9% |
| Tablet | 1,215 | 53.2% |
| No Computing Device | 211 | 9.2% |
| Total | 2,284 | 100.0% |
Internet Access in Moab
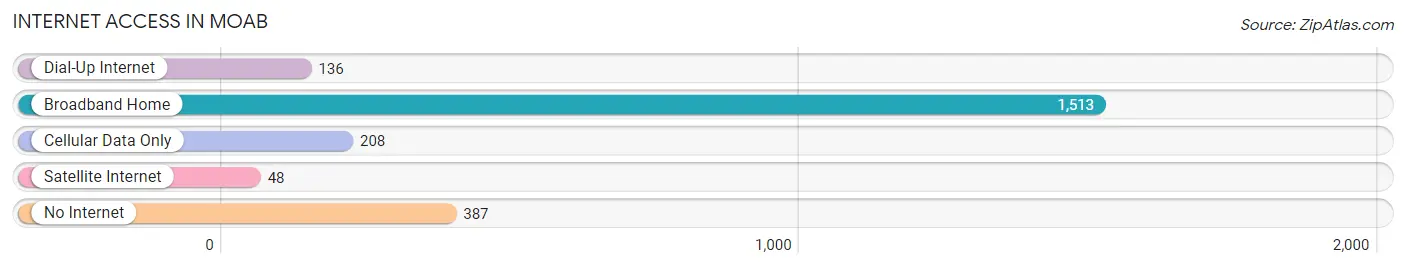
| Internet Type | # Households | % Households |
| Dial-Up Internet | 136 | 5.9% |
| Broadband Home | 1,513 | 66.2% |
| Cellular Data Only | 208 | 9.1% |
| Satellite Internet | 48 | 2.1% |
| No Internet | 387 | 16.9% |
| Total | 2,284 | 100.0% |
Moab Summary
Moab, Utah is a small city located in the southeastern corner of the state, near the Colorado border. It is the county seat of Grand County and is situated in a beautiful desert landscape, surrounded by red rock formations and the Colorado River. The city has a population of 5,046 as of the 2020 census, and is the largest city in Grand County.
History
The area around Moab has been inhabited for thousands of years, with evidence of human habitation dating back to the Archaic period. The first Europeans to explore the area were Spanish explorers in the late 1700s. The first permanent settlement in the area was established in 1855 by Mormon pioneers, who named the settlement Moab after the biblical city of Moab. The settlement was initially a farming community, but by the late 1800s, the area had become a popular tourist destination due to its stunning scenery.
In the early 1900s, the city began to grow rapidly, and by the 1950s, it had become a popular destination for outdoor recreation. The city was incorporated in 1951, and in the following decades, it continued to grow and develop. Today, Moab is a popular tourist destination, known for its stunning scenery, outdoor recreation opportunities, and unique culture.
Geography
Moab is located in the southeastern corner of Utah, near the Colorado border. It is situated in a desert landscape, surrounded by red rock formations and the Colorado River. The city is located at an elevation of 4,025 feet, and has a total area of 8.3 square miles.
The climate in Moab is semi-arid, with hot summers and mild winters. The average high temperature in the summer is around 90 degrees Fahrenheit, and the average low temperature in the winter is around 30 degrees Fahrenheit.
Economy
The economy of Moab is largely based on tourism. The city is a popular destination for outdoor recreation, and is home to several national parks and monuments, including Arches National Park, Canyonlands National Park, and Dead Horse Point State Park. The city also has a thriving arts and culture scene, with several galleries, museums, and performing arts venues.
In addition to tourism, Moab is also home to several industries, including mining, oil and gas, and agriculture. The city is also home to several manufacturing companies, including a large aluminum smelter.
Demographics
As of the 2020 census, the population of Moab was 5,046. The racial makeup of the city was 91.2% White, 0.7% African American, 0.7% Native American, 0.7% Asian, 0.2% Pacific Islander, 4.3% from other races, and 2.1% from two or more races. Hispanic or Latino of any race were 8.3% of the population.
The median household income in Moab was $45,945, and the median family income was $50,945. The per capita income in the city was $25,945. About 11.2% of the population was below the poverty line.
Common Questions
What is Per Capita Income in Moab?
Per Capita income in Moab is $32,173.
What is the Median Family Income in Moab?
Median Family Income in Moab is $63,393.
What is the Median Household income in Moab?
Median Household Income in Moab is $52,385.
What is Income or Wage Gap in Moab?
Income or Wage Gap in Moab is 14.0%.
Women in Moab earn 86.0 cents for every dollar earned by a man.
What is Family Income Deficit in Moab?
Family Income Deficit in Moab is $11,251.
Families that are below poverty line in Moab earn $11,251 less on average than the poverty threshold level.
What is Inequality or Gini Index in Moab?
Inequality or Gini Index in Moab is 0.49.
What is the Total Population of Moab?
Total Population of Moab is 5,329.
What is the Total Male Population of Moab?
Total Male Population of Moab is 2,738.
What is the Total Female Population of Moab?
Total Female Population of Moab is 2,591.
What is the Ratio of Males per 100 Females in Moab?
There are 105.67 Males per 100 Females in Moab.
What is the Ratio of Females per 100 Males in Moab?
There are 94.63 Females per 100 Males in Moab.
What is the Median Population Age in Moab?
Median Population Age in Moab is 36.3 Years.
What is the Average Family Size in Moab
Average Family Size in Moab is 2.8 People.
What is the Average Household Size in Moab
Average Household Size in Moab is 2.3 People.
How Large is the Labor Force in Moab?
There are 3,278 People in the Labor Forcein in Moab.
What is the Percentage of People in the Labor Force in Moab?
73.1% of People are in the Labor Force in Moab.
What is the Unemployment Rate in Moab?
Unemployment Rate in Moab is 2.2%.