Richfield, UT Map & Demographics
Richfield Map
Richfield Overview
$26,407
PER CAPITA INCOME
$76,423
AVG FAMILY INCOME
$70,477
AVG HOUSEHOLD INCOME
40.0%
WAGE / INCOME GAP [ % ]
60.0¢/ $1
WAGE / INCOME GAP [ $ ]
0.40
INEQUALITY / GINI INDEX
8,213
TOTAL POPULATION
4,031
MALE POPULATION
4,182
FEMALE POPULATION
96.39
MALES / 100 FEMALES
103.75
FEMALES / 100 MALES
31.5
MEDIAN AGE
3.5
AVG FAMILY SIZE
3.0
AVG HOUSEHOLD SIZE
3,480
LABOR FORCE [ PEOPLE ]
59.0%
PERCENT IN LABOR FORCE
5.3%
UNEMPLOYMENT RATE
Richfield Zip Codes
Richfield Area Codes
Income in Richfield
Income Overview in Richfield
Per Capita Income in Richfield is $26,407, while median incomes of families and households are $76,423 and $70,477 respectively.
| Characteristic | Number | Measure |
| Per Capita Income | 8,213 | $26,407 |
| Median Family Income | 2,008 | $76,423 |
| Mean Family Income | 2,008 | $88,061 |
| Median Household Income | 2,645 | $70,477 |
| Mean Household Income | 2,645 | $78,777 |
| Income Deficit | 2,008 | $0 |
| Wage / Income Gap (%) | 8,213 | 40.01% |
| Wage / Income Gap ($) | 8,213 | 59.99¢ per $1 |
| Gini / Inequality Index | 8,213 | 0.40 |
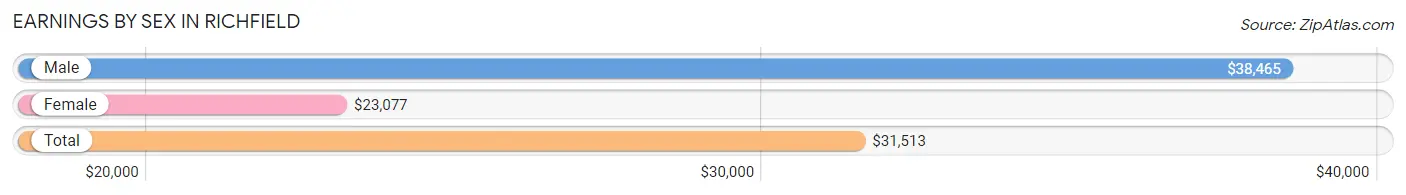
Earnings by Sex in Richfield
Average Earnings in Richfield are $31,513, $38,465 for men and $23,077 for women, a difference of 40.0%.
| Sex | Number | Average Earnings |
| Male | 2,175 (56.3%) | $38,465 |
| Female | 1,690 (43.7%) | $23,077 |
| Total | 3,865 (100.0%) | $31,513 |
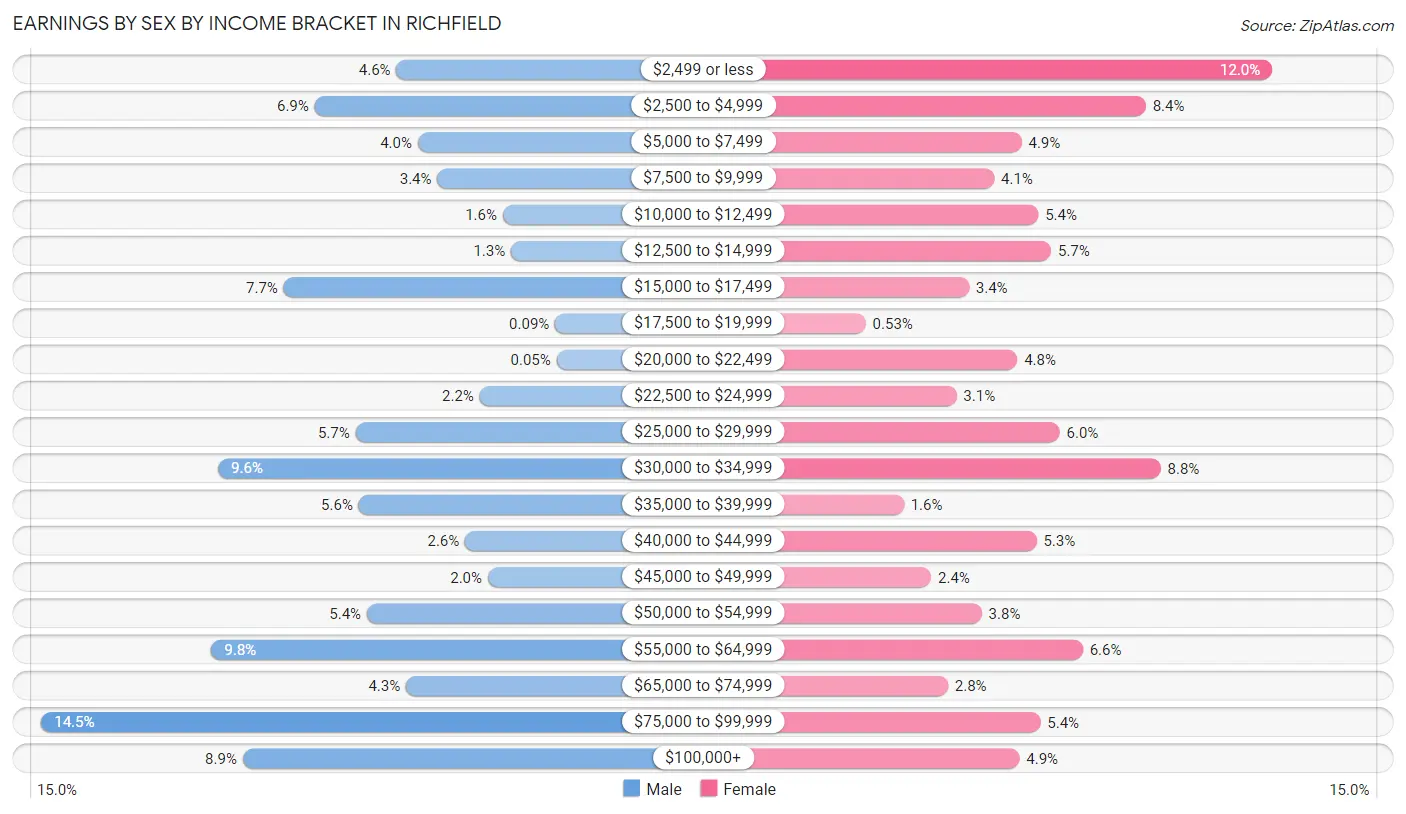
Earnings by Sex by Income Bracket in Richfield
The most common earnings brackets in Richfield are $75,000 to $99,999 for men (316 | 14.5%) and $2,499 or less for women (202 | 11.9%).
| Income | Male | Female |
| $2,499 or less | 99 (4.5%) | 202 (11.9%) |
| $2,500 to $4,999 | 149 (6.9%) | 142 (8.4%) |
| $5,000 to $7,499 | 86 (4.0%) | 83 (4.9%) |
| $7,500 to $9,999 | 74 (3.4%) | 70 (4.1%) |
| $10,000 to $12,499 | 34 (1.6%) | 91 (5.4%) |
| $12,500 to $14,999 | 29 (1.3%) | 97 (5.7%) |
| $15,000 to $17,499 | 168 (7.7%) | 58 (3.4%) |
| $17,500 to $19,999 | 2 (0.1%) | 9 (0.5%) |
| $20,000 to $22,499 | 1 (0.1%) | 81 (4.8%) |
| $22,500 to $24,999 | 48 (2.2%) | 52 (3.1%) |
| $25,000 to $29,999 | 124 (5.7%) | 101 (6.0%) |
| $30,000 to $34,999 | 208 (9.6%) | 149 (8.8%) |
| $35,000 to $39,999 | 122 (5.6%) | 27 (1.6%) |
| $40,000 to $44,999 | 57 (2.6%) | 90 (5.3%) |
| $45,000 to $49,999 | 43 (2.0%) | 40 (2.4%) |
| $50,000 to $54,999 | 117 (5.4%) | 64 (3.8%) |
| $55,000 to $64,999 | 212 (9.8%) | 112 (6.6%) |
| $65,000 to $74,999 | 93 (4.3%) | 48 (2.8%) |
| $75,000 to $99,999 | 316 (14.5%) | 92 (5.4%) |
| $100,000+ | 193 (8.9%) | 82 (4.9%) |
| Total | 2,175 (100.0%) | 1,690 (100.0%) |
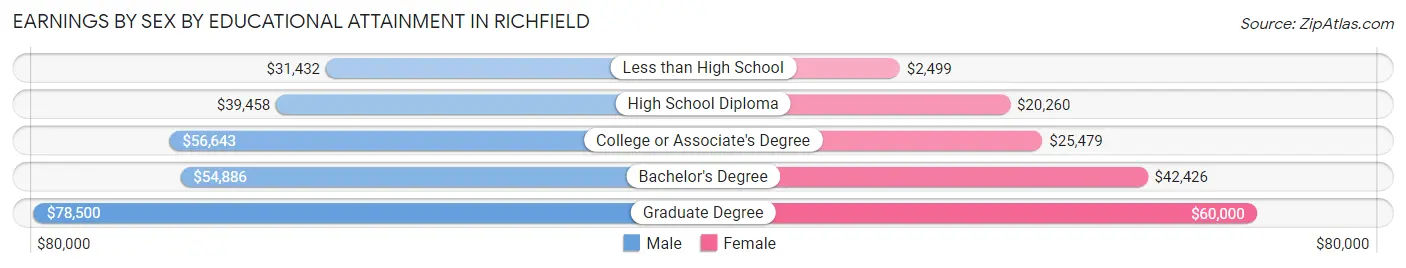
Earnings by Sex by Educational Attainment in Richfield
Average earnings in Richfield are $53,546 for men and $29,659 for women, a difference of 44.6%. Men with an educational attainment of graduate degree enjoy the highest average annual earnings of $78,500, while those with less than high school education earn the least with $31,432. Women with an educational attainment of graduate degree earn the most with the average annual earnings of $60,000, while those with less than high school education have the smallest earnings of $2,499.
| Educational Attainment | Male Income | Female Income |
| Less than High School | $31,432 | $2,499 |
| High School Diploma | $39,458 | $20,260 |
| College or Associate's Degree | $56,643 | $25,479 |
| Bachelor's Degree | $54,886 | $42,426 |
| Graduate Degree | $78,500 | $60,000 |
| Total | $53,546 | $29,659 |
Family Income in Richfield
Family Income Brackets in Richfield
According to the Richfield family income data, there are 404 families falling into the $75,000 to $99,999 income range, which is the most common income bracket and makes up 20.1% of all families. Conversely, the $10,000 to $14,999 income bracket is the least frequent group with only 48 families (2.4%) belonging to this category.
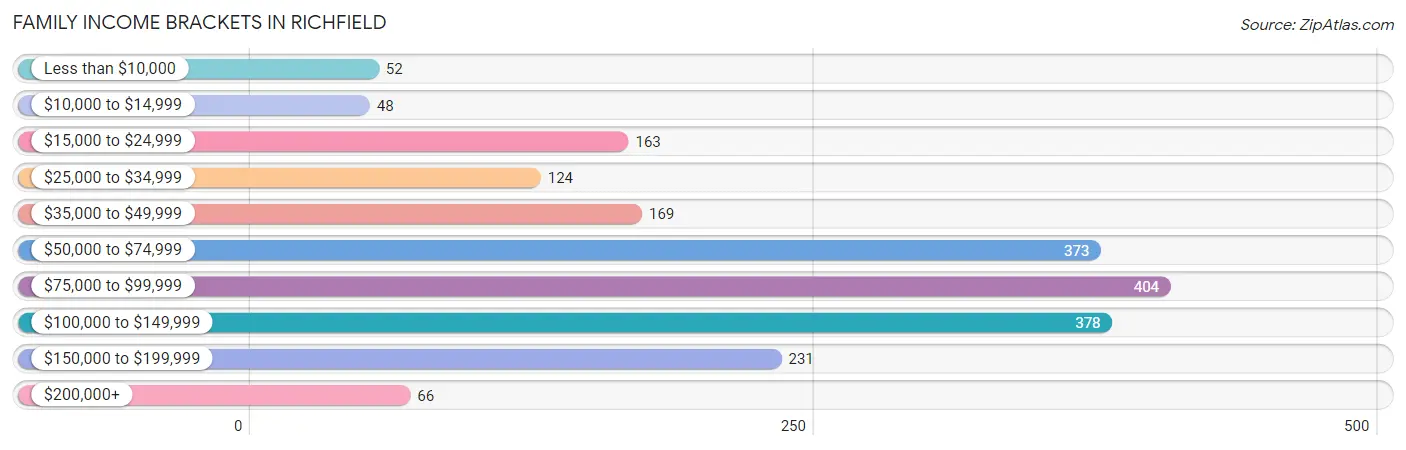
| Income Bracket | # Families | % Families |
| Less than $10,000 | 52 | 2.6% |
| $10,000 to $14,999 | 48 | 2.4% |
| $15,000 to $24,999 | 163 | 8.1% |
| $25,000 to $34,999 | 124 | 6.2% |
| $35,000 to $49,999 | 169 | 8.4% |
| $50,000 to $74,999 | 373 | 18.6% |
| $75,000 to $99,999 | 404 | 20.1% |
| $100,000 to $149,999 | 378 | 18.8% |
| $150,000 to $199,999 | 231 | 11.5% |
| $200,000+ | 66 | 3.3% |
Family Income by Famaliy Size in Richfield
4-person families (213 | 10.6%) account for the highest median family income in Richfield with $106,161 per family, while 2-person families (763 | 38.0%) have the highest median income of $38,577 per family member.
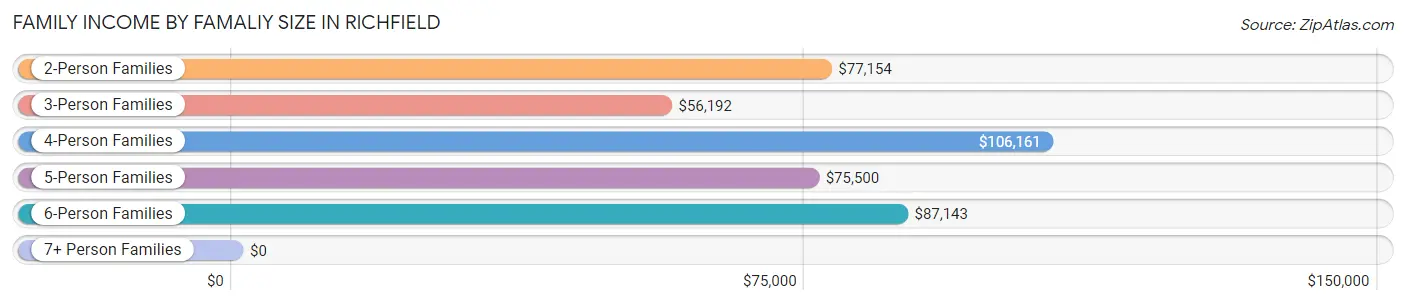
| Income Bracket | # Families | Median Income |
| 2-Person Families | 763 (38.0%) | $77,154 |
| 3-Person Families | 475 (23.7%) | $56,192 |
| 4-Person Families | 213 (10.6%) | $106,161 |
| 5-Person Families | 290 (14.4%) | $75,500 |
| 6-Person Families | 196 (9.8%) | $87,143 |
| 7+ Person Families | 71 (3.5%) | $0 |
| Total | 2,008 (100.0%) | $76,423 |
Family Income by Number of Earners in Richfield
The median family income in Richfield is $76,423, with families comprising 3+ earners (264) having the highest median family income of $130,313, while families with no earners (292) have the lowest median family income of $50,000, accounting for 13.2% and 14.5% of families, respectively.
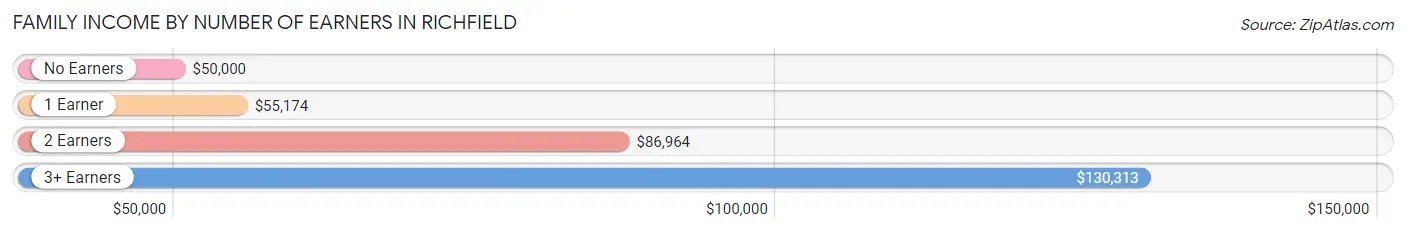
| Number of Earners | # Families | Median Income |
| No Earners | 292 (14.5%) | $50,000 |
| 1 Earner | 546 (27.2%) | $55,174 |
| 2 Earners | 906 (45.1%) | $86,964 |
| 3+ Earners | 264 (13.2%) | $130,313 |
| Total | 2,008 (100.0%) | $76,423 |
Household Income in Richfield
Household Income Brackets in Richfield
With 479 households falling in the category, the $75,000 to $99,999 income range is the most frequent in Richfield, accounting for 18.1% of all households. In contrast, only 66 households (2.5%) fall into the $200,000+ income bracket, making it the least populous group.
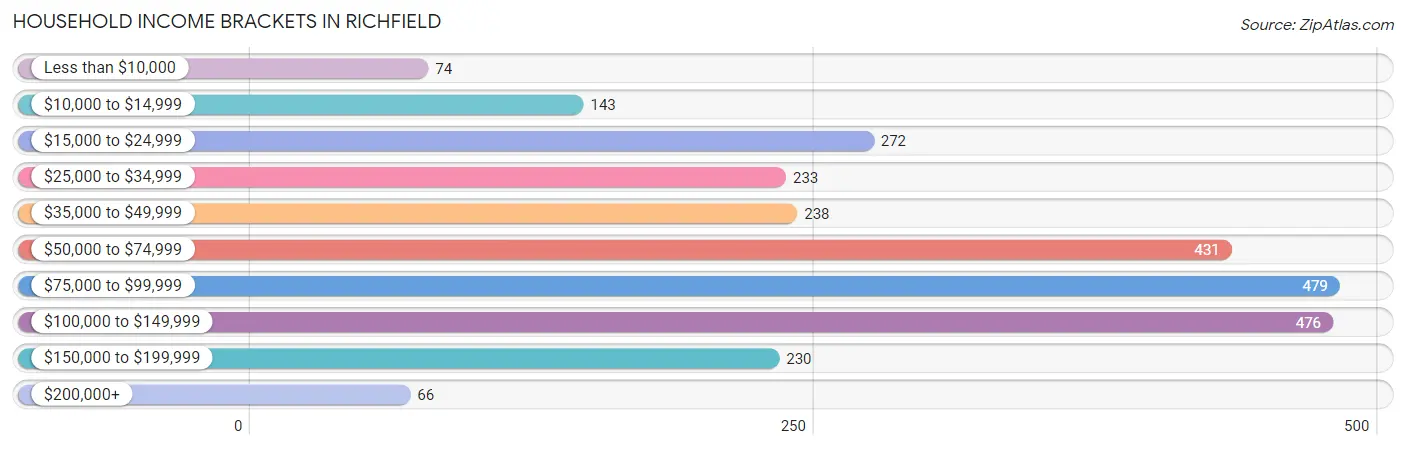
| Income Bracket | # Households | % Households |
| Less than $10,000 | 74 | 2.8% |
| $10,000 to $14,999 | 143 | 5.4% |
| $15,000 to $24,999 | 272 | 10.3% |
| $25,000 to $34,999 | 233 | 8.8% |
| $35,000 to $49,999 | 238 | 9.0% |
| $50,000 to $74,999 | 431 | 16.3% |
| $75,000 to $99,999 | 479 | 18.1% |
| $100,000 to $149,999 | 476 | 18.0% |
| $150,000 to $199,999 | 230 | 8.7% |
| $200,000+ | 66 | 2.5% |
Household Income by Householder Age in Richfield
The median household income in Richfield is $70,477, with the highest median household income of $88,380 found in the 45 to 64 years age bracket for the primary householder. A total of 881 households (33.3%) fall into this category. Meanwhile, the 15 to 24 years age bracket for the primary householder has the lowest median household income of $0, with 160 households (6.0%) in this group.
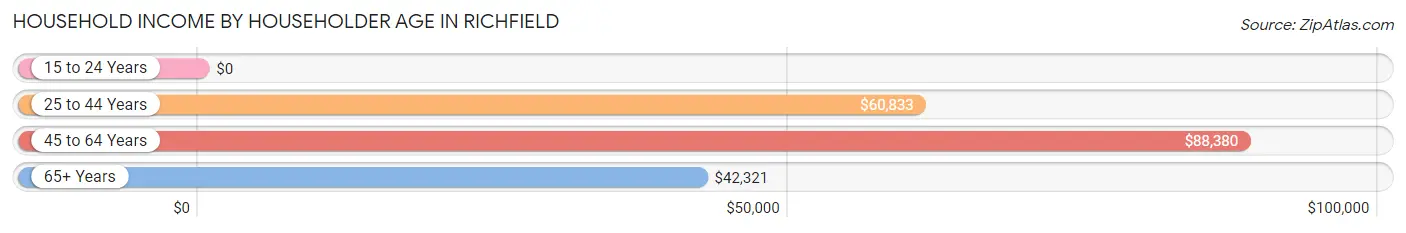
| Income Bracket | # Households | Median Income |
| 15 to 24 Years | 160 (6.0%) | $0 |
| 25 to 44 Years | 1,036 (39.2%) | $60,833 |
| 45 to 64 Years | 881 (33.3%) | $88,380 |
| 65+ Years | 568 (21.5%) | $42,321 |
| Total | 2,645 (100.0%) | $70,477 |
Poverty in Richfield
Income Below Poverty by Sex and Age in Richfield
With 13.7% poverty level for males and 17.3% for females among the residents of Richfield, 25 to 34 year old males and 5 year old females are the most vulnerable to poverty, with 109 males (23.3%) and 34 females (63.0%) in their respective age groups living below the poverty level.
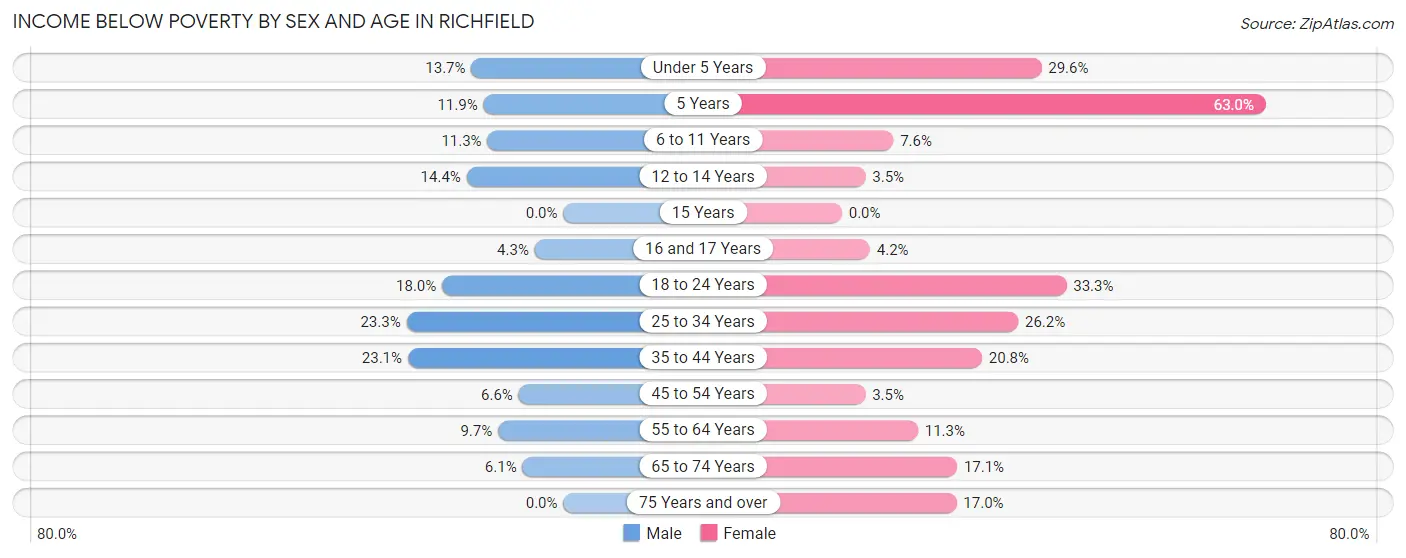
| Age Bracket | Male | Female |
| Under 5 Years | 44 (13.7%) | 101 (29.6%) |
| 5 Years | 7 (11.9%) | 34 (63.0%) |
| 6 to 11 Years | 54 (11.3%) | 44 (7.6%) |
| 12 to 14 Years | 26 (14.4%) | 7 (3.5%) |
| 15 Years | 0 (0.0%) | 0 (0.0%) |
| 16 and 17 Years | 9 (4.3%) | 7 (4.2%) |
| 18 to 24 Years | 63 (18.0%) | 124 (33.3%) |
| 25 to 34 Years | 109 (23.3%) | 134 (26.2%) |
| 35 to 44 Years | 136 (23.1%) | 120 (20.8%) |
| 45 to 54 Years | 24 (6.6%) | 13 (3.5%) |
| 55 to 64 Years | 41 (9.7%) | 41 (11.3%) |
| 65 to 74 Years | 15 (6.1%) | 53 (17.1%) |
| 75 Years and over | 0 (0.0%) | 40 (17.0%) |
| Total | 528 (13.7%) | 718 (17.3%) |
Income Above Poverty by Sex and Age in Richfield
According to the poverty statistics in Richfield, males aged 15 years and females aged 15 years are the age groups that are most secure financially, with 100.0% of males and 100.0% of females in these age groups living above the poverty line.
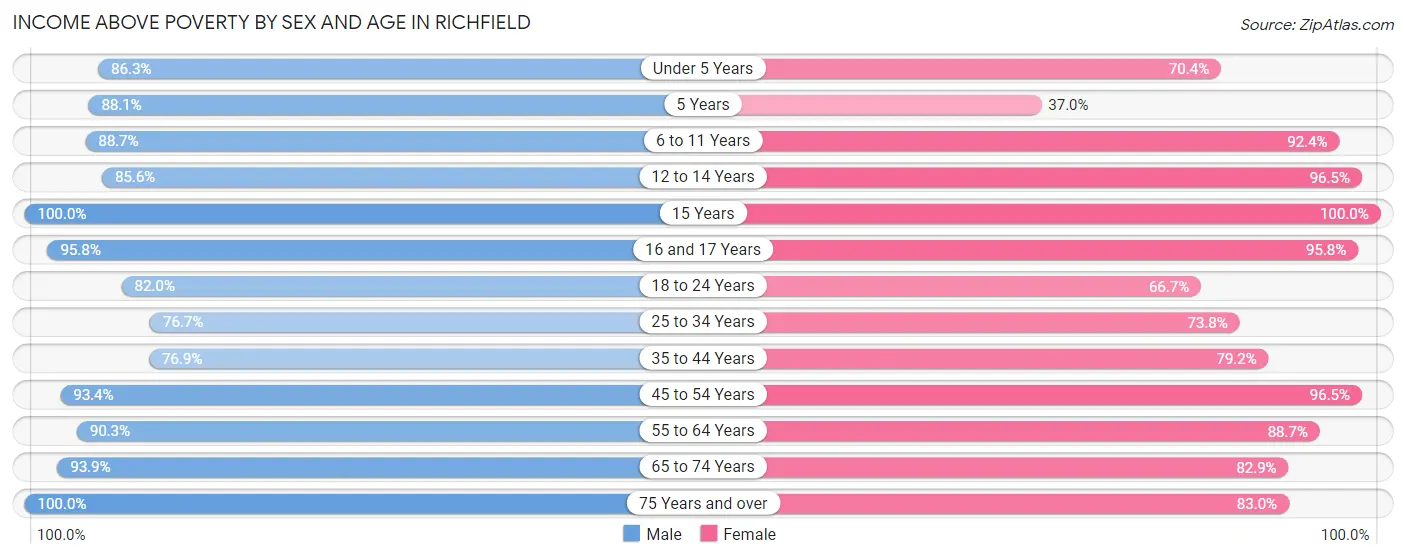
| Age Bracket | Male | Female |
| Under 5 Years | 278 (86.3%) | 240 (70.4%) |
| 5 Years | 52 (88.1%) | 20 (37.0%) |
| 6 to 11 Years | 425 (88.7%) | 532 (92.4%) |
| 12 to 14 Years | 155 (85.6%) | 193 (96.5%) |
| 15 Years | 21 (100.0%) | 63 (100.0%) |
| 16 and 17 Years | 203 (95.8%) | 161 (95.8%) |
| 18 to 24 Years | 287 (82.0%) | 248 (66.7%) |
| 25 to 34 Years | 359 (76.7%) | 378 (73.8%) |
| 35 to 44 Years | 453 (76.9%) | 457 (79.2%) |
| 45 to 54 Years | 338 (93.4%) | 361 (96.5%) |
| 55 to 64 Years | 382 (90.3%) | 322 (88.7%) |
| 65 to 74 Years | 232 (93.9%) | 257 (82.9%) |
| 75 Years and over | 152 (100.0%) | 195 (83.0%) |
| Total | 3,337 (86.3%) | 3,427 (82.7%) |
Income Below Poverty Among Married-Couple Families in Richfield
The poverty statistics for married-couple families in Richfield show that 12.1% or 204 of the total 1,687 families live below the poverty line. Families with 5 or more children have the highest poverty rate of 26.8%, comprising of 19 families. On the other hand, families with no children have the lowest poverty rate of 6.0%, which includes 45 families.
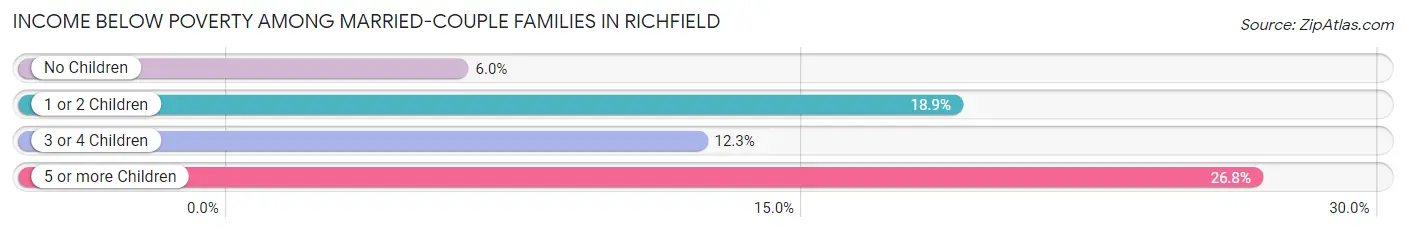
| Children | Above Poverty | Below Poverty |
| No Children | 702 (94.0%) | 45 (6.0%) |
| 1 or 2 Children | 407 (81.1%) | 95 (18.9%) |
| 3 or 4 Children | 322 (87.7%) | 45 (12.3%) |
| 5 or more Children | 52 (73.2%) | 19 (26.8%) |
| Total | 1,483 (87.9%) | 204 (12.1%) |
Income Below Poverty Among Single-Parent Households in Richfield
According to the poverty data in Richfield, 7.2% or 7 single-father households and 17.9% or 40 single-mother households are living below the poverty line. Among single-father households, those with 1 or 2 children have the highest poverty rate, with 7 households (10.6%) experiencing poverty. Likewise, among single-mother households, those with no children have the highest poverty rate, with 9 households (27.3%) falling below the poverty line.
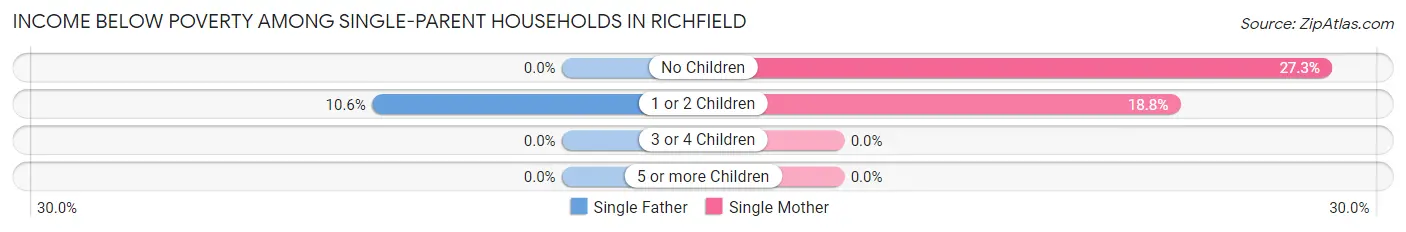
| Children | Single Father | Single Mother |
| No Children | 0 (0.0%) | 9 (27.3%) |
| 1 or 2 Children | 7 (10.6%) | 31 (18.8%) |
| 3 or 4 Children | 0 (0.0%) | 0 (0.0%) |
| 5 or more Children | 0 (0.0%) | 0 (0.0%) |
| Total | 7 (7.2%) | 40 (17.9%) |
Income Below Poverty Among Married-Couple vs Single-Parent Households in Richfield
The poverty data for Richfield shows that 204 of the married-couple family households (12.1%) and 47 of the single-parent households (14.6%) are living below the poverty level. Within the married-couple family households, those with 5 or more children have the highest poverty rate, with 19 households (26.8%) falling below the poverty line. Among the single-parent households, those with no children have the highest poverty rate, with 9 household (22.0%) living below poverty.
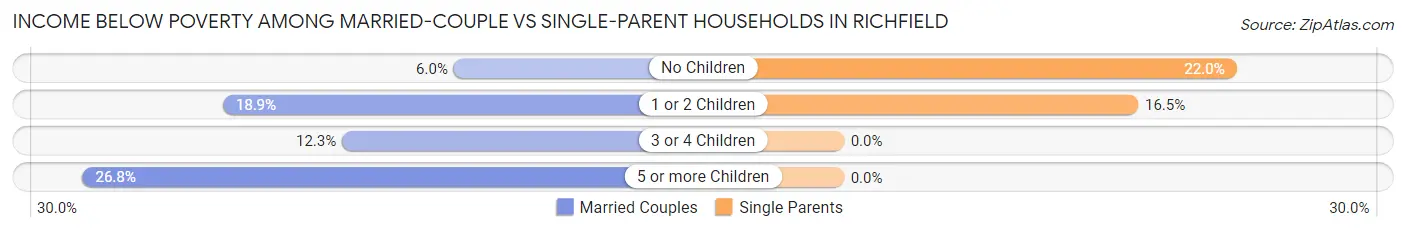
| Children | Married-Couple Families | Single-Parent Households |
| No Children | 45 (6.0%) | 9 (22.0%) |
| 1 or 2 Children | 95 (18.9%) | 38 (16.5%) |
| 3 or 4 Children | 45 (12.3%) | 0 (0.0%) |
| 5 or more Children | 19 (26.8%) | 0 (0.0%) |
| Total | 204 (12.1%) | 47 (14.6%) |
Race in Richfield
The most populous races in Richfield are White / Caucasian (7,661 | 93.3%), Hispanic or Latino (403 | 4.9%), and Two or more Races (329 | 4.0%).
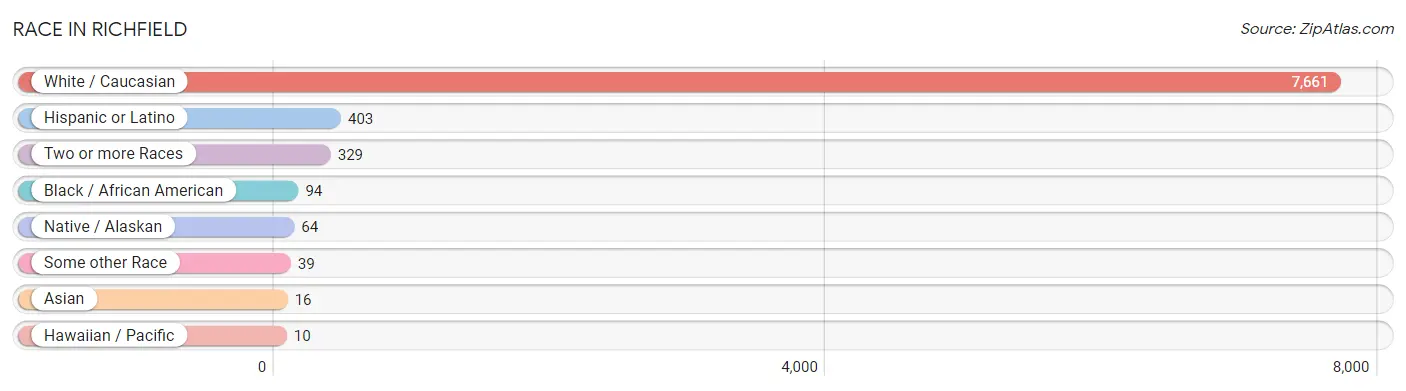
| Race | # Population | % Population |
| Asian | 16 | 0.2% |
| Black / African American | 94 | 1.1% |
| Hawaiian / Pacific | 10 | 0.1% |
| Hispanic or Latino | 403 | 4.9% |
| Native / Alaskan | 64 | 0.8% |
| White / Caucasian | 7,661 | 93.3% |
| Two or more Races | 329 | 4.0% |
| Some other Race | 39 | 0.5% |
| Total | 8,213 | 100.0% |
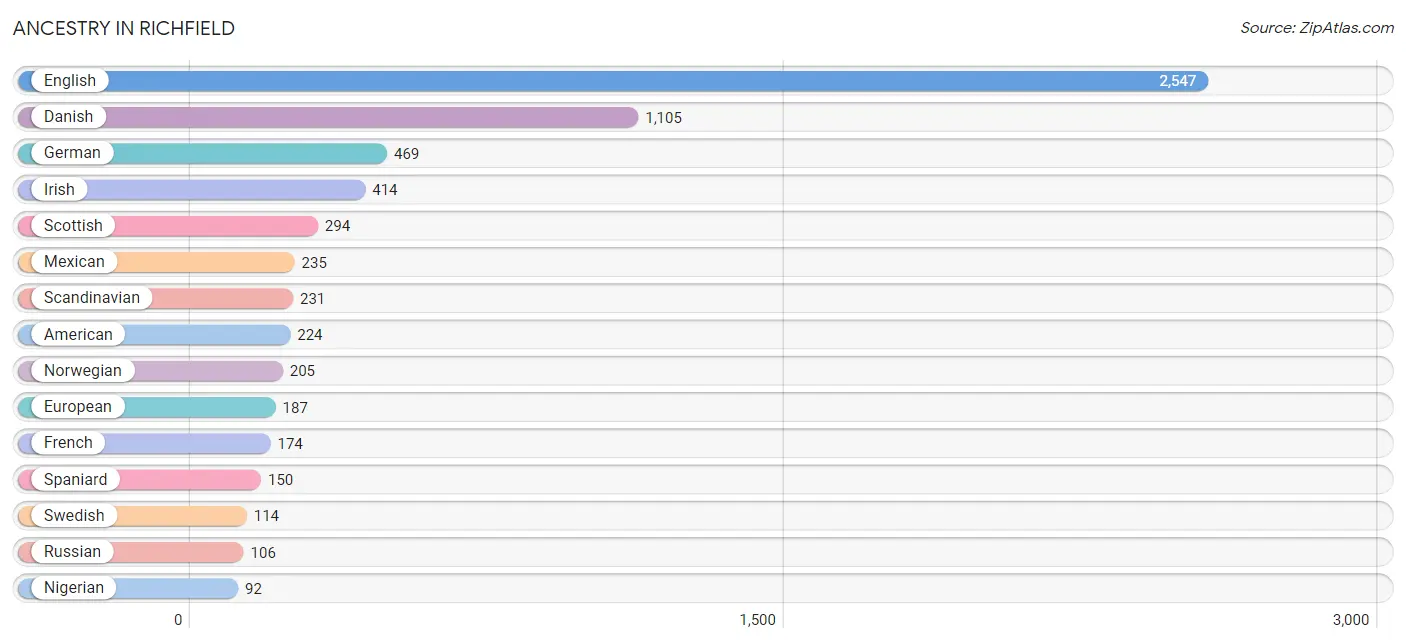
Ancestry in Richfield
The most populous ancestries reported in Richfield are English (2,547 | 31.0%), Danish (1,105 | 13.5%), German (469 | 5.7%), Irish (414 | 5.0%), and Scottish (294 | 3.6%), together accounting for 58.8% of all Richfield residents.
| Ancestry | # Population | % Population |
| American | 224 | 2.7% |
| Austrian | 2 | 0.0% |
| Bhutanese | 55 | 0.7% |
| British | 49 | 0.6% |
| Canadian | 2 | 0.0% |
| Central American | 2 | 0.0% |
| Cherokee | 68 | 0.8% |
| Chickasaw | 1 | 0.0% |
| Cuban | 9 | 0.1% |
| Danish | 1,105 | 13.5% |
| Dutch | 60 | 0.7% |
| Eastern European | 30 | 0.4% |
| English | 2,547 | 31.0% |
| European | 187 | 2.3% |
| French | 174 | 2.1% |
| German | 469 | 5.7% |
| German Russian | 10 | 0.1% |
| Greek | 15 | 0.2% |
| Hopi | 21 | 0.3% |
| Hungarian | 8 | 0.1% |
| Irish | 414 | 5.0% |
| Italian | 91 | 1.1% |
| Korean | 3 | 0.0% |
| Lithuanian | 34 | 0.4% |
| Mexican | 235 | 2.9% |
| Navajo | 70 | 0.9% |
| Nigerian | 92 | 1.1% |
| Northern European | 18 | 0.2% |
| Norwegian | 205 | 2.5% |
| Russian | 106 | 1.3% |
| Salvadoran | 2 | 0.0% |
| Samoan | 10 | 0.1% |
| Scandinavian | 231 | 2.8% |
| Scotch-Irish | 44 | 0.5% |
| Scottish | 294 | 3.6% |
| Slovak | 5 | 0.1% |
| Spaniard | 150 | 1.8% |
| Subsaharan African | 92 | 1.1% |
| Swedish | 114 | 1.4% |
| Swiss | 42 | 0.5% |
| Welsh | 28 | 0.3% | View All 41 Rows |
Immigrants in Richfield
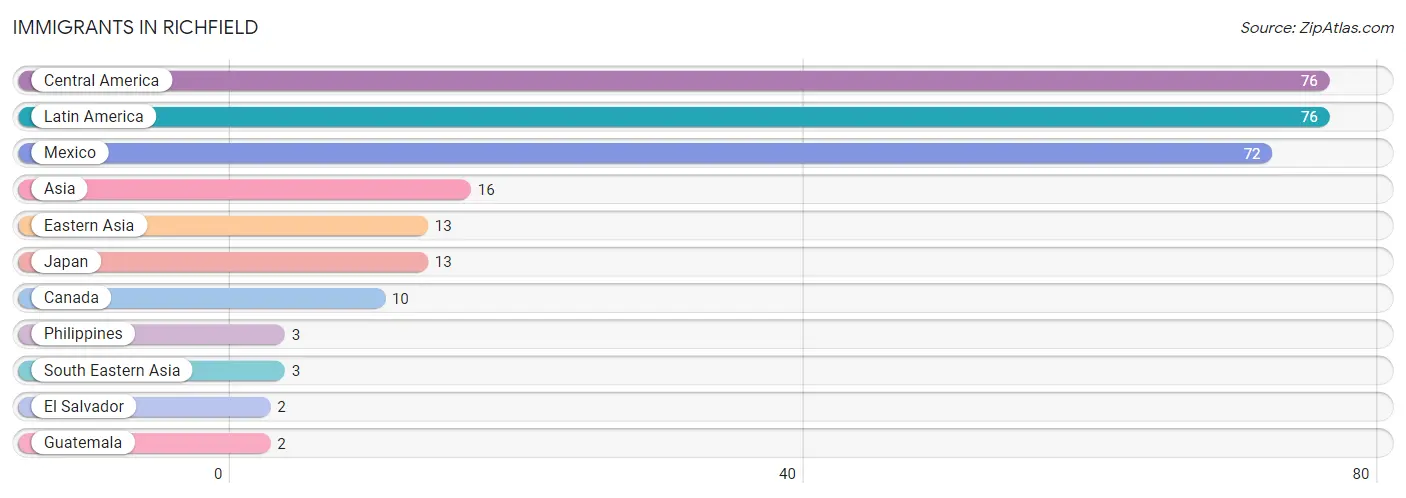
The most numerous immigrant groups reported in Richfield came from Central America (76 | 0.9%), Latin America (76 | 0.9%), Mexico (72 | 0.9%), Asia (16 | 0.2%), and Eastern Asia (13 | 0.2%), together accounting for 3.1% of all Richfield residents.
| Immigration Origin | # Population | % Population |
| Asia | 16 | 0.2% |
| Canada | 10 | 0.1% |
| Central America | 76 | 0.9% |
| Eastern Asia | 13 | 0.2% |
| El Salvador | 2 | 0.0% |
| Guatemala | 2 | 0.0% |
| Japan | 13 | 0.2% |
| Latin America | 76 | 0.9% |
| Mexico | 72 | 0.9% |
| Philippines | 3 | 0.0% |
| South Eastern Asia | 3 | 0.0% | View All 11 Rows |
Sex and Age in Richfield
Sex and Age in Richfield
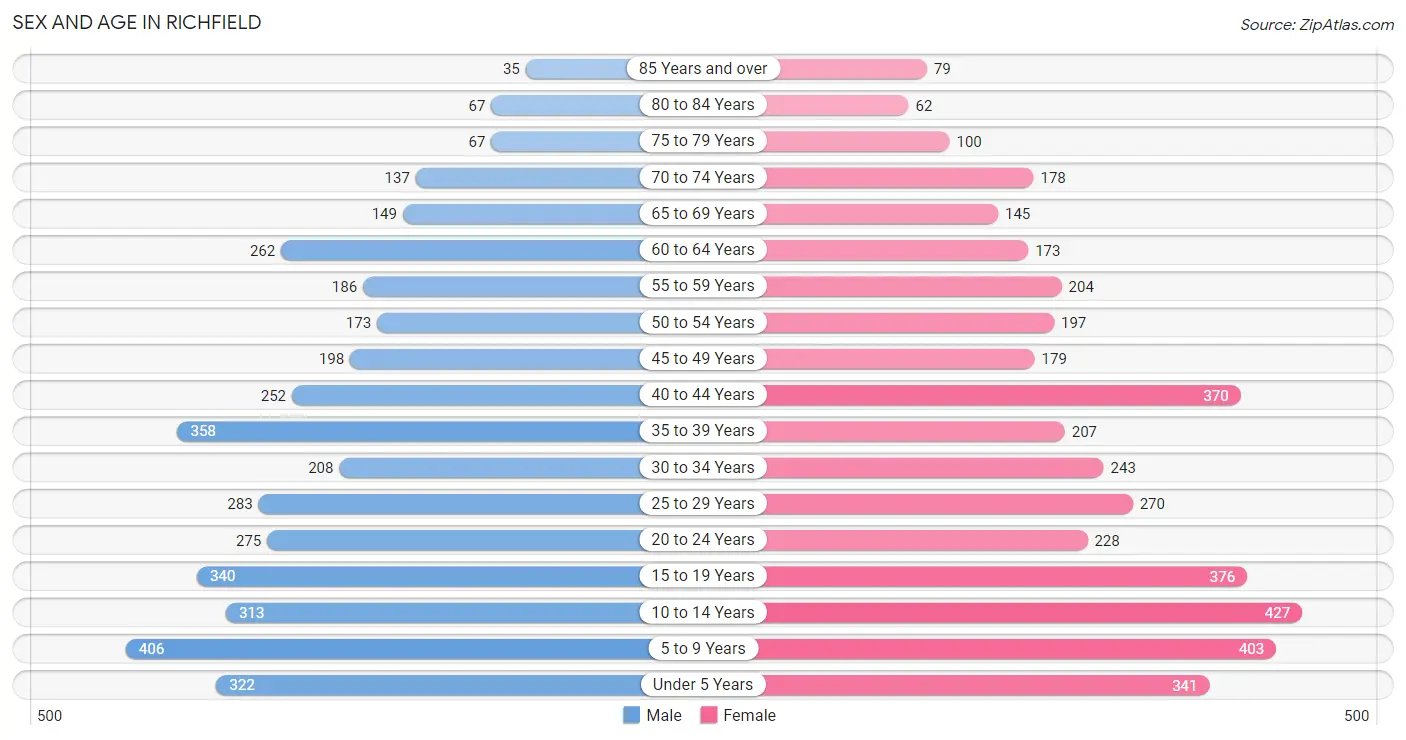
The most populous age groups in Richfield are 5 to 9 Years (406 | 10.1%) for men and 10 to 14 Years (427 | 10.2%) for women.
| Age Bracket | Male | Female |
| Under 5 Years | 322 (8.0%) | 341 (8.2%) |
| 5 to 9 Years | 406 (10.1%) | 403 (9.6%) |
| 10 to 14 Years | 313 (7.8%) | 427 (10.2%) |
| 15 to 19 Years | 340 (8.4%) | 376 (9.0%) |
| 20 to 24 Years | 275 (6.8%) | 228 (5.4%) |
| 25 to 29 Years | 283 (7.0%) | 270 (6.5%) |
| 30 to 34 Years | 208 (5.2%) | 243 (5.8%) |
| 35 to 39 Years | 358 (8.9%) | 207 (5.0%) |
| 40 to 44 Years | 252 (6.2%) | 370 (8.8%) |
| 45 to 49 Years | 198 (4.9%) | 179 (4.3%) |
| 50 to 54 Years | 173 (4.3%) | 197 (4.7%) |
| 55 to 59 Years | 186 (4.6%) | 204 (4.9%) |
| 60 to 64 Years | 262 (6.5%) | 173 (4.1%) |
| 65 to 69 Years | 149 (3.7%) | 145 (3.5%) |
| 70 to 74 Years | 137 (3.4%) | 178 (4.3%) |
| 75 to 79 Years | 67 (1.7%) | 100 (2.4%) |
| 80 to 84 Years | 67 (1.7%) | 62 (1.5%) |
| 85 Years and over | 35 (0.9%) | 79 (1.9%) |
| Total | 4,031 (100.0%) | 4,182 (100.0%) |
Families and Households in Richfield
Median Family Size in Richfield
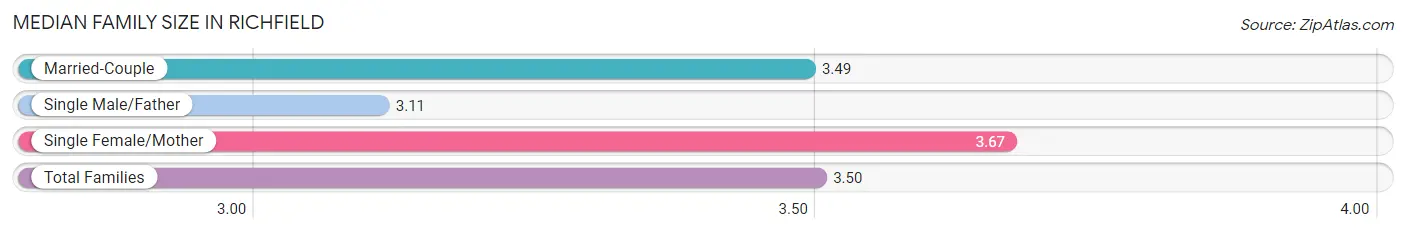
The median family size in Richfield is 3.50 persons per family, with single female/mother families (224 | 11.2%) accounting for the largest median family size of 3.67 persons per family. On the other hand, single male/father families (97 | 4.8%) represent the smallest median family size with 3.11 persons per family.
| Family Type | # Families | Family Size |
| Married-Couple | 1,687 (84.0%) | 3.49 |
| Single Male/Father | 97 (4.8%) | 3.11 |
| Single Female/Mother | 224 (11.2%) | 3.67 |
| Total Families | 2,008 (100.0%) | 3.50 |
Median Household Size in Richfield
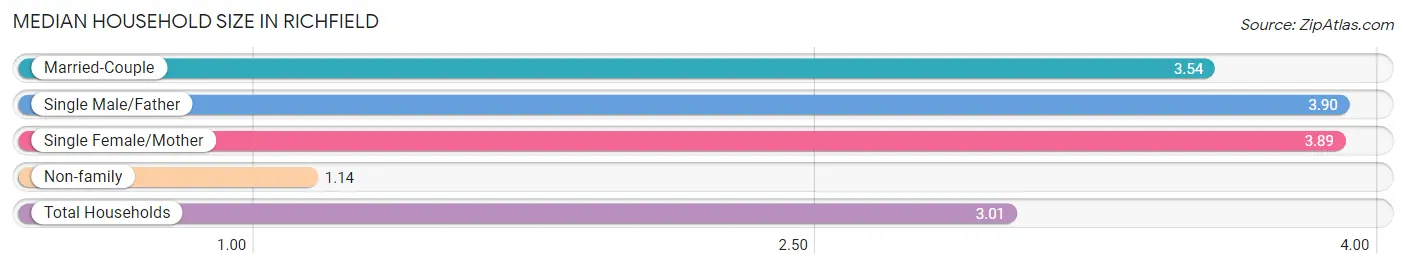
The median household size in Richfield is 3.01 persons per household, with single male/father households (97 | 3.7%) accounting for the largest median household size of 3.9 persons per household. non-family households (637 | 24.1%) represent the smallest median household size with 1.14 persons per household.
| Household Type | # Households | Household Size |
| Married-Couple | 1,687 (63.8%) | 3.54 |
| Single Male/Father | 97 (3.7%) | 3.90 |
| Single Female/Mother | 224 (8.5%) | 3.89 |
| Non-family | 637 (24.1%) | 1.14 |
| Total Households | 2,645 (100.0%) | 3.01 |
Household Size by Marriage Status in Richfield
Out of a total of 2,645 households in Richfield, 2,008 (75.9%) are family households, while 637 (24.1%) are nonfamily households. The most numerous type of family households are 2-person households, comprising 744, and the most common type of nonfamily households are 1-person households, comprising 568.
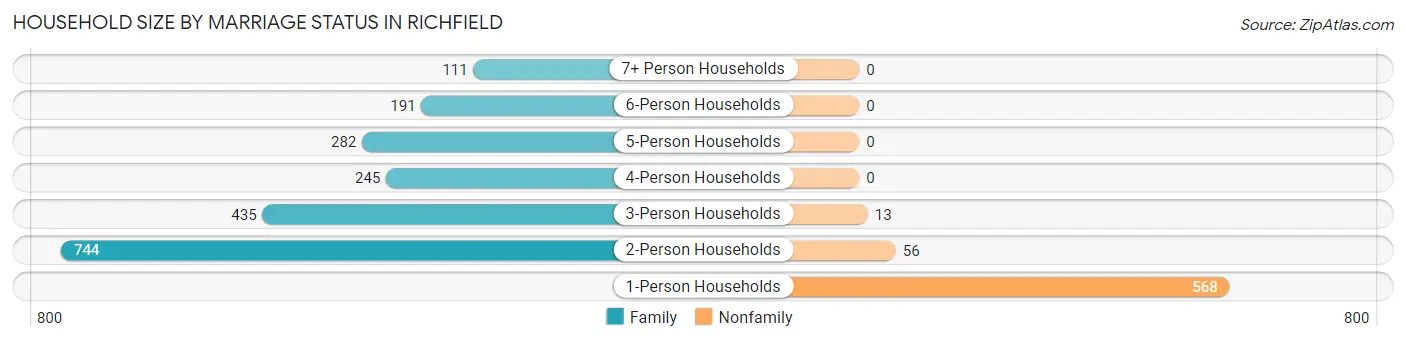
| Household Size | Family Households | Nonfamily Households |
| 1-Person Households | - | 568 (21.5%) |
| 2-Person Households | 744 (28.1%) | 56 (2.1%) |
| 3-Person Households | 435 (16.5%) | 13 (0.5%) |
| 4-Person Households | 245 (9.3%) | 0 (0.0%) |
| 5-Person Households | 282 (10.7%) | 0 (0.0%) |
| 6-Person Households | 191 (7.2%) | 0 (0.0%) |
| 7+ Person Households | 111 (4.2%) | 0 (0.0%) |
| Total | 2,008 (75.9%) | 637 (24.1%) |
Female Fertility in Richfield
Fertility by Age in Richfield
Average fertility rate in Richfield is 125.0 births per 1,000 women. Women in the age bracket of 20 to 34 years have the highest fertility rate with 232.0 births per 1,000 women. Women in the age bracket of 20 to 34 years acount for 72.3% of all women with births.
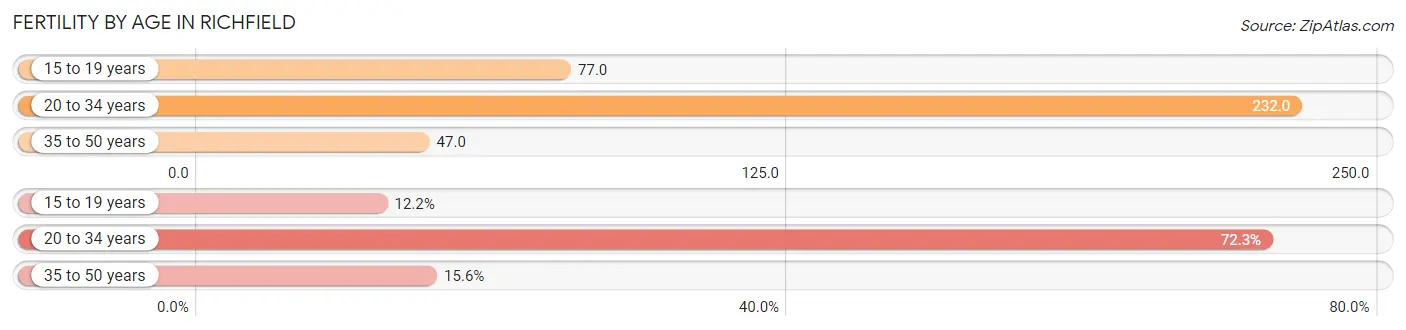
| Age Bracket | Women with Births | Births / 1,000 Women |
| 15 to 19 years | 29 (12.2%) | 77.0 |
| 20 to 34 years | 172 (72.3%) | 232.0 |
| 35 to 50 years | 37 (15.5%) | 47.0 |
| Total | 238 (100.0%) | 125.0 |
Fertility by Age by Marriage Status in Richfield
82.4% of women with births (238) in Richfield are married. The highest percentage of unmarried women with births falls into 20 to 34 years age bracket with 24.4% of them unmarried at the time of birth, while the lowest percentage of unmarried women with births belong to 15 to 19 years age bracket with 0.0% of them unmarried.
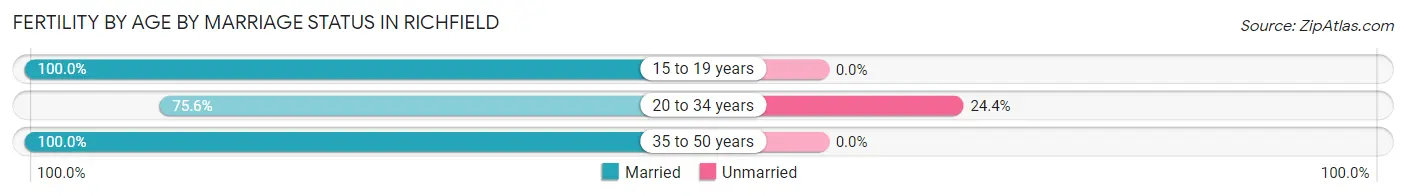
| Age Bracket | Married | Unmarried |
| 15 to 19 years | 29 (100.0%) | 0 (0.0%) |
| 20 to 34 years | 130 (75.6%) | 42 (24.4%) |
| 35 to 50 years | 37 (100.0%) | 0 (0.0%) |
| Total | 196 (82.4%) | 42 (17.6%) |
Fertility by Education in Richfield
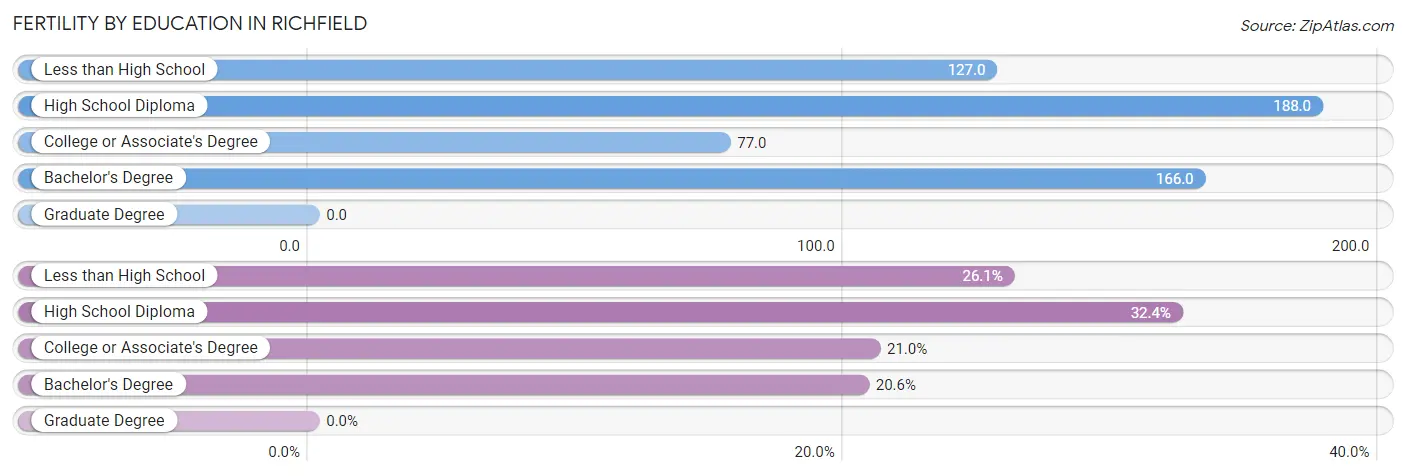
| Educational Attainment | Women with Births | Births / 1,000 Women |
| Less than High School | 62 (26.1%) | 127.0 |
| High School Diploma | 77 (32.4%) | 188.0 |
| College or Associate's Degree | 50 (21.0%) | 77.0 |
| Bachelor's Degree | 49 (20.6%) | 166.0 |
| Graduate Degree | 0 (0.0%) | 0.0 |
| Total | 238 (100.0%) | 125.0 |
Fertility by Education by Marriage Status in Richfield
17.6% of women with births in Richfield are unmarried. Women with the educational attainment of less than high school are most likely to be married with 100.0% of them married at childbirth, while women with the educational attainment of college or associate's degree are least likely to be married with 38.0% of them unmarried at childbirth.
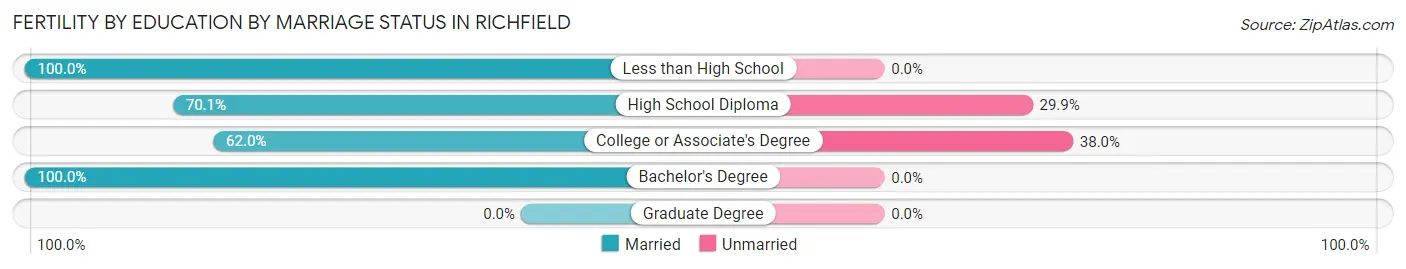
| Educational Attainment | Married | Unmarried |
| Less than High School | 62 (100.0%) | 0 (0.0%) |
| High School Diploma | 54 (70.1%) | 23 (29.9%) |
| College or Associate's Degree | 31 (62.0%) | 19 (38.0%) |
| Bachelor's Degree | 49 (100.0%) | 0 (0.0%) |
| Graduate Degree | 0 (0.0%) | 0 (0.0%) |
| Total | 196 (82.4%) | 42 (17.6%) |
Employment Characteristics in Richfield
Employment by Class of Employer in Richfield
Among the 3,223 employed individuals in Richfield, private company employees (2,134 | 66.2%), state government employees (329 | 10.2%), and self-employed (not incorporated) (212 | 6.6%) make up the most common classes of employment.
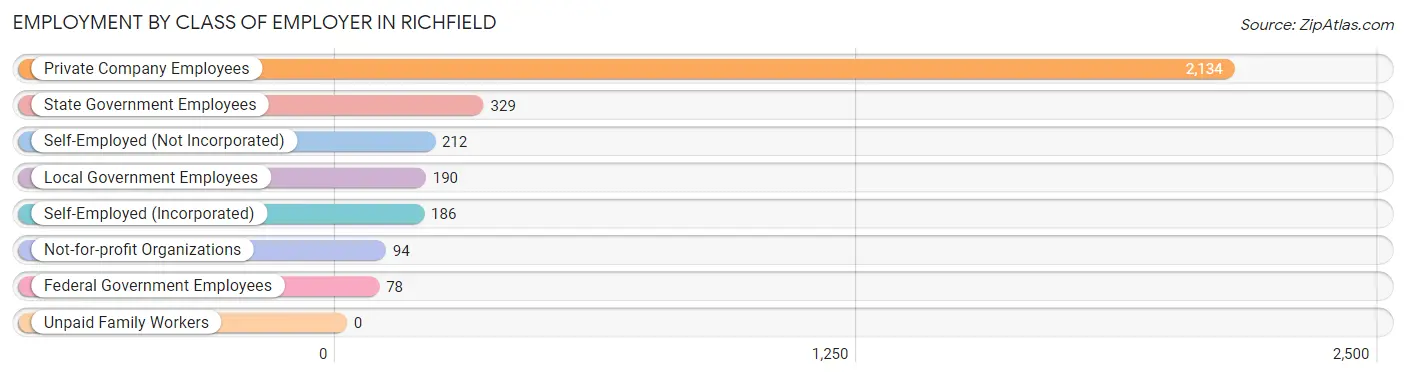
| Employer Class | # Employees | % Employees |
| Private Company Employees | 2,134 | 66.2% |
| Self-Employed (Incorporated) | 186 | 5.8% |
| Self-Employed (Not Incorporated) | 212 | 6.6% |
| Not-for-profit Organizations | 94 | 2.9% |
| Local Government Employees | 190 | 5.9% |
| State Government Employees | 329 | 10.2% |
| Federal Government Employees | 78 | 2.4% |
| Unpaid Family Workers | 0 | 0.0% |
| Total | 3,223 | 100.0% |
Employment Status by Age in Richfield
According to the labor force statistics for Richfield, out of the total population over 16 years of age (5,899), 59.0% or 3,480 individuals are in the labor force, with 5.3% or 184 of them unemployed. The age group with the highest labor force participation rate is 45 to 54 years, with 83.8% or 626 individuals in the labor force. Within the labor force, the 20 to 24 years age range has the highest percentage of unemployed individuals, with 15.3% or 56 of them being unemployed.
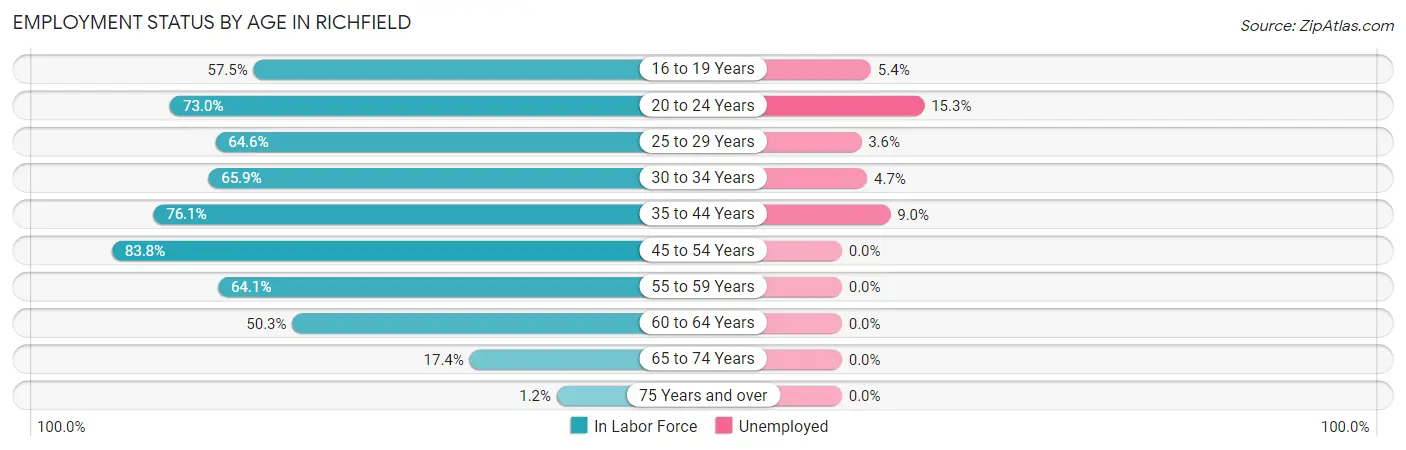
| Age Bracket | In Labor Force | Unemployed |
| 16 to 19 Years | 353 (57.5%) | 19 (5.4%) |
| 20 to 24 Years | 367 (73.0%) | 56 (15.3%) |
| 25 to 29 Years | 357 (64.6%) | 13 (3.6%) |
| 30 to 34 Years | 297 (65.9%) | 14 (4.7%) |
| 35 to 44 Years | 903 (76.1%) | 81 (9.0%) |
| 45 to 54 Years | 626 (83.8%) | 0 (0.0%) |
| 55 to 59 Years | 250 (64.1%) | 0 (0.0%) |
| 60 to 64 Years | 219 (50.3%) | 0 (0.0%) |
| 65 to 74 Years | 106 (17.4%) | 0 (0.0%) |
| 75 Years and over | 5 (1.2%) | 0 (0.0%) |
| Total | 3,480 (59.0%) | 184 (5.3%) |
Employment Status by Educational Attainment in Richfield
According to labor force statistics for Richfield, 70.5% of individuals (2,653) out of the total population between 25 and 64 years of age (3,763) are in the labor force, with 4.1% or 109 of them being unemployed. The group with the highest labor force participation rate are those with the educational attainment of bachelor's degree or higher, with 84.5% or 747 individuals in the labor force. Within the labor force, individuals with less than high school education have the highest percentage of unemployment, with 8.7% or 13 of them being unemployed.
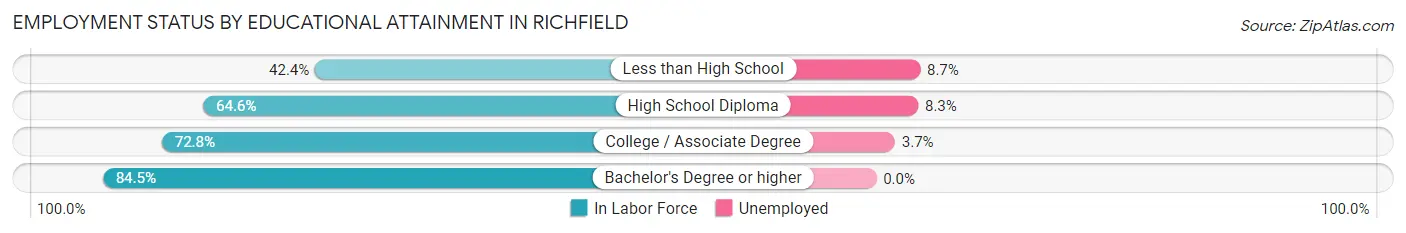
| Educational Attainment | In Labor Force | Unemployed |
| Less than High School | 150 (42.4%) | 31 (8.7%) |
| High School Diploma | 660 (64.6%) | 85 (8.3%) |
| College / Associate Degree | 1,095 (72.8%) | 56 (3.7%) |
| Bachelor's Degree or higher | 747 (84.5%) | 0 (0.0%) |
| Total | 2,653 (70.5%) | 154 (4.1%) |
Employment Occupations by Sex in Richfield
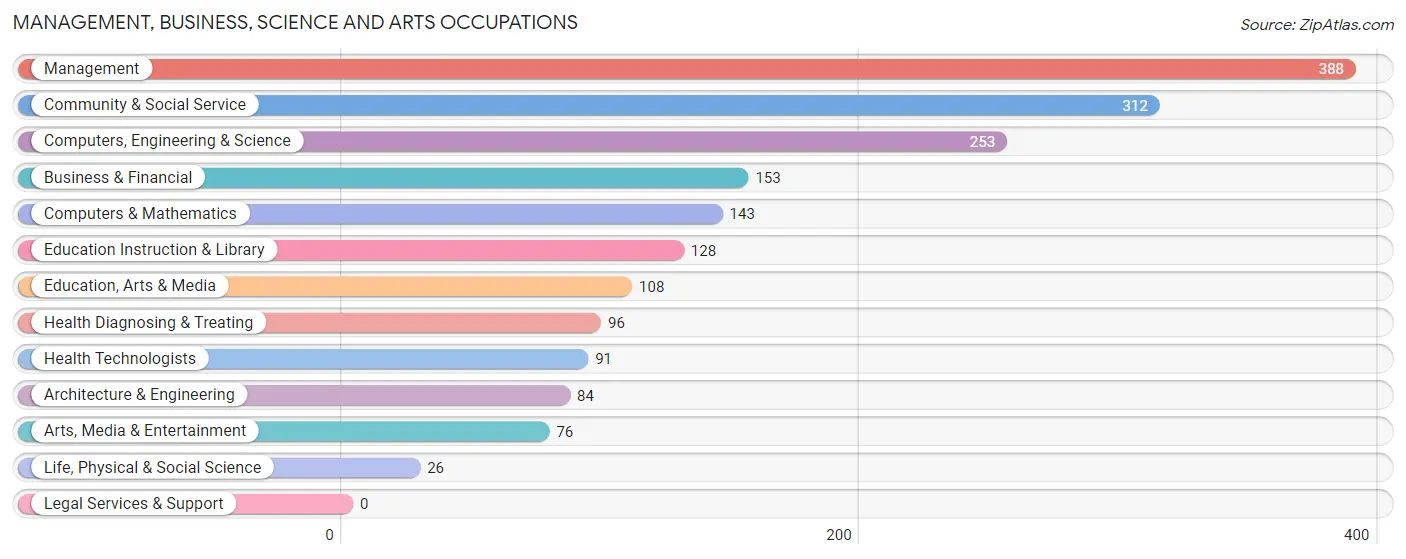
Management, Business, Science and Arts Occupations
The most common Management, Business, Science and Arts occupations in Richfield are Management (388 | 11.8%), Community & Social Service (312 | 9.5%), Computers, Engineering & Science (253 | 7.7%), Business & Financial (153 | 4.6%), and Computers & Mathematics (143 | 4.3%).
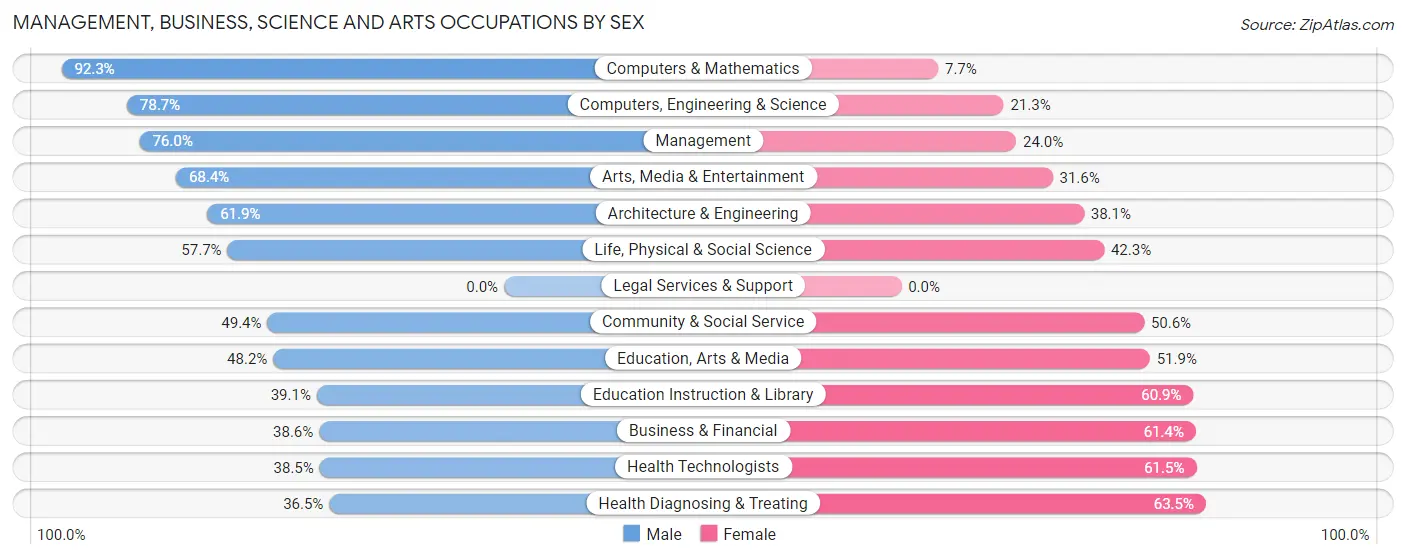
Management, Business, Science and Arts Occupations by Sex
Within the Management, Business, Science and Arts occupations in Richfield, the most male-oriented occupations are Computers & Mathematics (92.3%), Computers, Engineering & Science (78.7%), and Management (76.0%), while the most female-oriented occupations are Health Diagnosing & Treating (63.5%), Health Technologists (61.5%), and Business & Financial (61.4%).
| Occupation | Male | Female |
| Management | 295 (76.0%) | 93 (24.0%) |
| Business & Financial | 59 (38.6%) | 94 (61.4%) |
| Computers, Engineering & Science | 199 (78.7%) | 54 (21.3%) |
| Computers & Mathematics | 132 (92.3%) | 11 (7.7%) |
| Architecture & Engineering | 52 (61.9%) | 32 (38.1%) |
| Life, Physical & Social Science | 15 (57.7%) | 11 (42.3%) |
| Community & Social Service | 154 (49.4%) | 158 (50.6%) |
| Education, Arts & Media | 52 (48.1%) | 56 (51.8%) |
| Legal Services & Support | 0 (0.0%) | 0 (0.0%) |
| Education Instruction & Library | 50 (39.1%) | 78 (60.9%) |
| Arts, Media & Entertainment | 52 (68.4%) | 24 (31.6%) |
| Health Diagnosing & Treating | 35 (36.5%) | 61 (63.5%) |
| Health Technologists | 35 (38.5%) | 56 (61.5%) |
| Total (Category) | 742 (61.7%) | 460 (38.3%) |
| Total (Overall) | 1,956 (59.3%) | 1,344 (40.7%) |
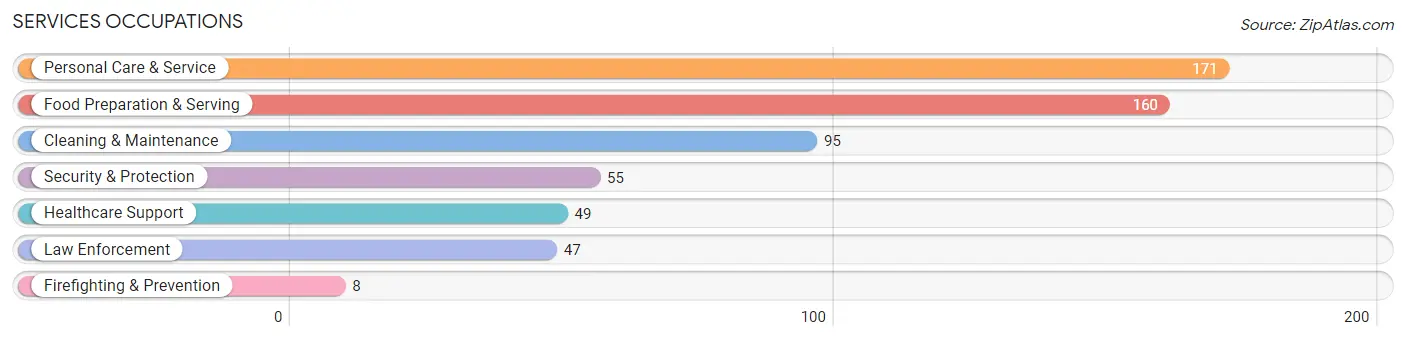
Services Occupations
The most common Services occupations in Richfield are Personal Care & Service (171 | 5.2%), Food Preparation & Serving (160 | 4.9%), Cleaning & Maintenance (95 | 2.9%), Security & Protection (55 | 1.7%), and Healthcare Support (49 | 1.5%).
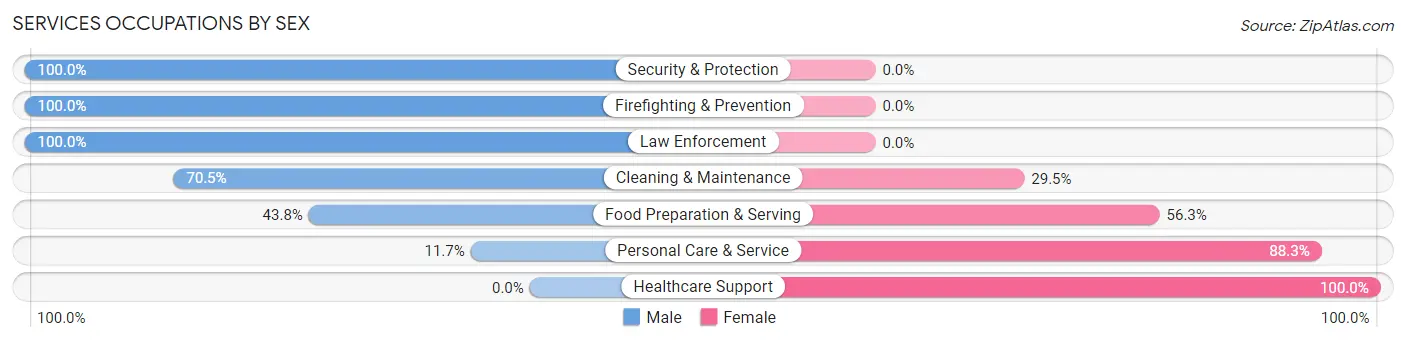
Services Occupations by Sex
Within the Services occupations in Richfield, the most male-oriented occupations are Security & Protection (100.0%), Firefighting & Prevention (100.0%), and Law Enforcement (100.0%), while the most female-oriented occupations are Healthcare Support (100.0%), Personal Care & Service (88.3%), and Food Preparation & Serving (56.2%).
| Occupation | Male | Female |
| Healthcare Support | 0 (0.0%) | 49 (100.0%) |
| Security & Protection | 55 (100.0%) | 0 (0.0%) |
| Firefighting & Prevention | 8 (100.0%) | 0 (0.0%) |
| Law Enforcement | 47 (100.0%) | 0 (0.0%) |
| Food Preparation & Serving | 70 (43.8%) | 90 (56.2%) |
| Cleaning & Maintenance | 67 (70.5%) | 28 (29.5%) |
| Personal Care & Service | 20 (11.7%) | 151 (88.3%) |
| Total (Category) | 212 (40.0%) | 318 (60.0%) |
| Total (Overall) | 1,956 (59.3%) | 1,344 (40.7%) |
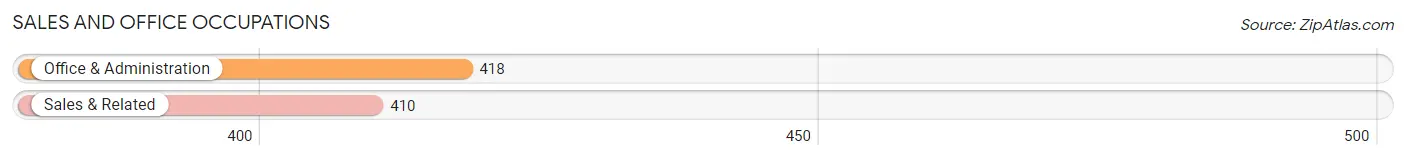
Sales and Office Occupations
The most common Sales and Office occupations in Richfield are Office & Administration (418 | 12.7%), and Sales & Related (410 | 12.4%).
Sales and Office Occupations by Sex
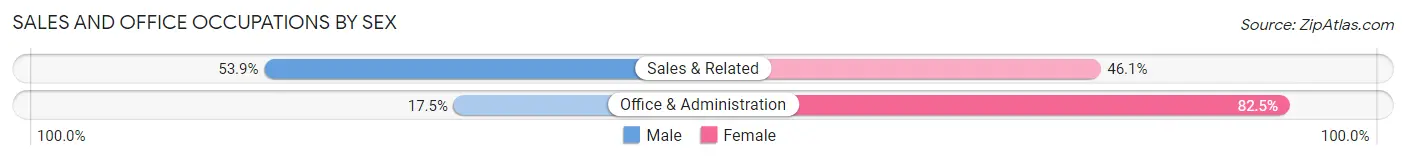
| Occupation | Male | Female |
| Sales & Related | 221 (53.9%) | 189 (46.1%) |
| Office & Administration | 73 (17.5%) | 345 (82.5%) |
| Total (Category) | 294 (35.5%) | 534 (64.5%) |
| Total (Overall) | 1,956 (59.3%) | 1,344 (40.7%) |
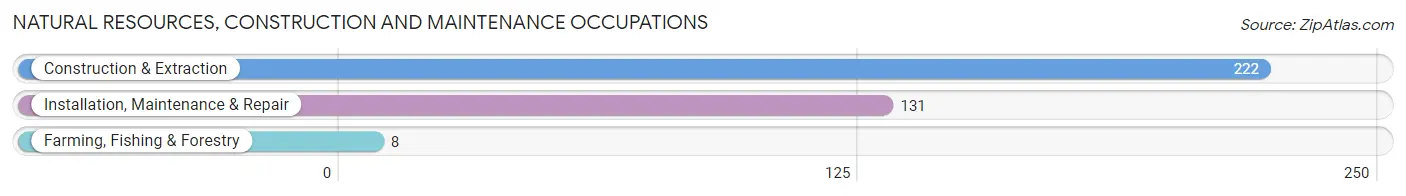
Natural Resources, Construction and Maintenance Occupations
The most common Natural Resources, Construction and Maintenance occupations in Richfield are Construction & Extraction (222 | 6.7%), Installation, Maintenance & Repair (131 | 4.0%), and Farming, Fishing & Forestry (8 | 0.2%).
Natural Resources, Construction and Maintenance Occupations by Sex
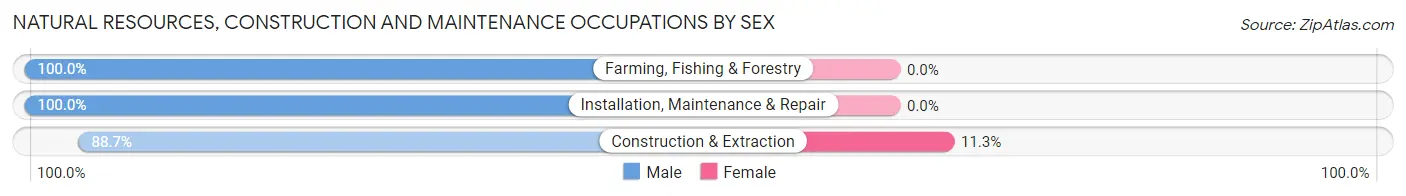
| Occupation | Male | Female |
| Farming, Fishing & Forestry | 8 (100.0%) | 0 (0.0%) |
| Construction & Extraction | 197 (88.7%) | 25 (11.3%) |
| Installation, Maintenance & Repair | 131 (100.0%) | 0 (0.0%) |
| Total (Category) | 336 (93.1%) | 25 (6.9%) |
| Total (Overall) | 1,956 (59.3%) | 1,344 (40.7%) |
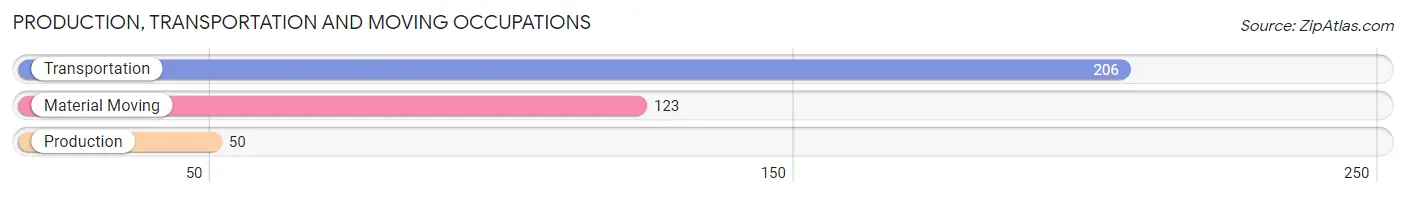
Production, Transportation and Moving Occupations
The most common Production, Transportation and Moving occupations in Richfield are Transportation (206 | 6.2%), Material Moving (123 | 3.7%), and Production (50 | 1.5%).
Production, Transportation and Moving Occupations by Sex
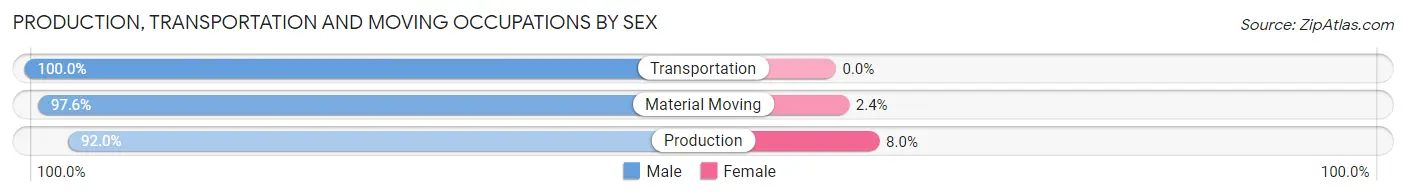
| Occupation | Male | Female |
| Production | 46 (92.0%) | 4 (8.0%) |
| Transportation | 206 (100.0%) | 0 (0.0%) |
| Material Moving | 120 (97.6%) | 3 (2.4%) |
| Total (Category) | 372 (98.2%) | 7 (1.8%) |
| Total (Overall) | 1,956 (59.3%) | 1,344 (40.7%) |
Employment Industries by Sex in Richfield
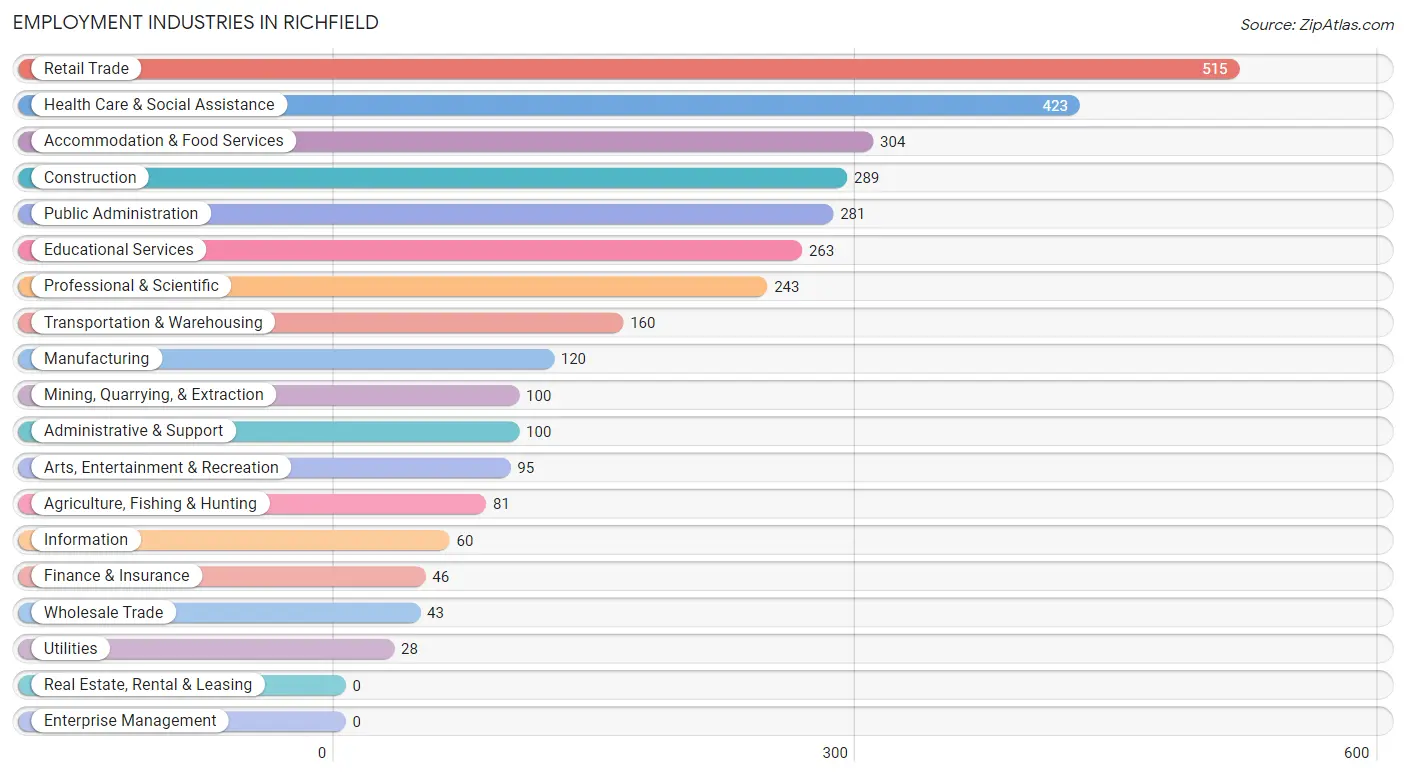
Employment Industries in Richfield
The major employment industries in Richfield include Retail Trade (515 | 15.6%), Health Care & Social Assistance (423 | 12.8%), Accommodation & Food Services (304 | 9.2%), Construction (289 | 8.8%), and Public Administration (281 | 8.5%).
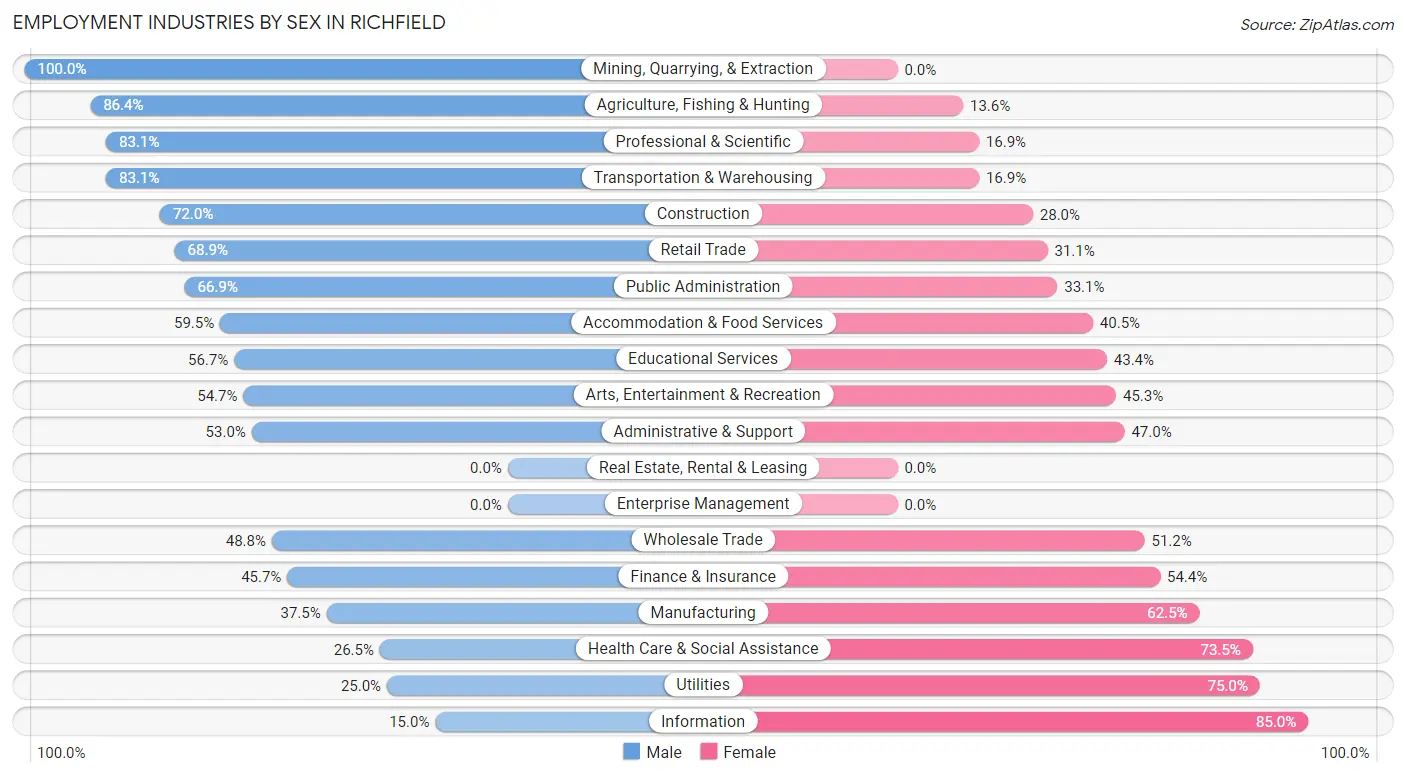
Employment Industries by Sex in Richfield
The Richfield industries that see more men than women are Mining, Quarrying, & Extraction (100.0%), Agriculture, Fishing & Hunting (86.4%), and Professional & Scientific (83.1%), whereas the industries that tend to have a higher number of women are Information (85.0%), Utilities (75.0%), and Health Care & Social Assistance (73.5%).
| Industry | Male | Female |
| Agriculture, Fishing & Hunting | 70 (86.4%) | 11 (13.6%) |
| Mining, Quarrying, & Extraction | 100 (100.0%) | 0 (0.0%) |
| Construction | 208 (72.0%) | 81 (28.0%) |
| Manufacturing | 45 (37.5%) | 75 (62.5%) |
| Wholesale Trade | 21 (48.8%) | 22 (51.2%) |
| Retail Trade | 355 (68.9%) | 160 (31.1%) |
| Transportation & Warehousing | 133 (83.1%) | 27 (16.9%) |
| Utilities | 7 (25.0%) | 21 (75.0%) |
| Information | 9 (15.0%) | 51 (85.0%) |
| Finance & Insurance | 21 (45.7%) | 25 (54.3%) |
| Real Estate, Rental & Leasing | 0 (0.0%) | 0 (0.0%) |
| Professional & Scientific | 202 (83.1%) | 41 (16.9%) |
| Enterprise Management | 0 (0.0%) | 0 (0.0%) |
| Administrative & Support | 53 (53.0%) | 47 (47.0%) |
| Educational Services | 149 (56.7%) | 114 (43.3%) |
| Health Care & Social Assistance | 112 (26.5%) | 311 (73.5%) |
| Arts, Entertainment & Recreation | 52 (54.7%) | 43 (45.3%) |
| Accommodation & Food Services | 181 (59.5%) | 123 (40.5%) |
| Public Administration | 188 (66.9%) | 93 (33.1%) |
| Total | 1,956 (59.3%) | 1,344 (40.7%) |
Education in Richfield
School Enrollment in Richfield
The most common levels of schooling among the 2,634 students in Richfield are elementary school (673 | 25.6%), high school (650 | 24.7%), and middle school (616 | 23.4%).
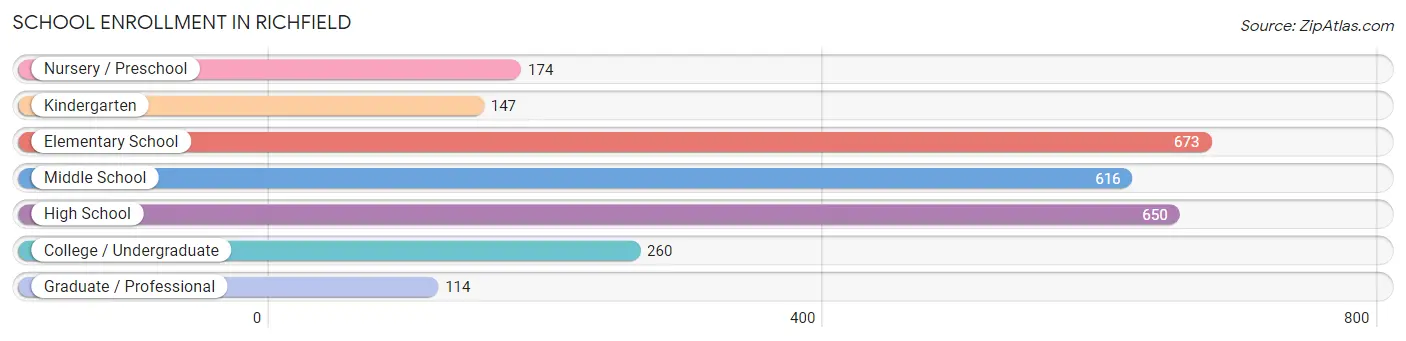
| School Level | # Students | % Students |
| Nursery / Preschool | 174 | 6.6% |
| Kindergarten | 147 | 5.6% |
| Elementary School | 673 | 25.6% |
| Middle School | 616 | 23.4% |
| High School | 650 | 24.7% |
| College / Undergraduate | 260 | 9.9% |
| Graduate / Professional | 114 | 4.3% |
| Total | 2,634 | 100.0% |
School Enrollment by Age by Funding Source in Richfield
Out of a total of 2,634 students who are enrolled in schools in Richfield, 111 (4.2%) attend a private institution, while the remaining 2,523 (95.8%) are enrolled in public schools. The age group of 3 to 4 year olds has the highest likelihood of being enrolled in private schools, with 19 (14.3% in the age bracket) enrolled. Conversely, the age group of 20 to 24 year olds has the lowest likelihood of being enrolled in a private school, with 112 (100.0% in the age bracket) attending a public institution.
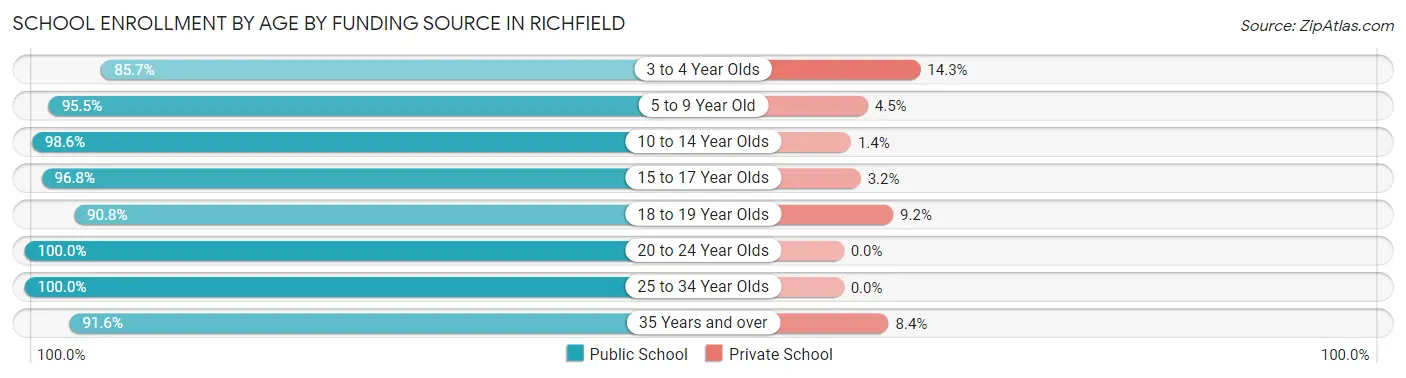
| Age Bracket | Public School | Private School |
| 3 to 4 Year Olds | 114 (85.7%) | 19 (14.3%) |
| 5 to 9 Year Old | 742 (95.5%) | 35 (4.5%) |
| 10 to 14 Year Olds | 724 (98.6%) | 10 (1.4%) |
| 15 to 17 Year Olds | 458 (96.8%) | 15 (3.2%) |
| 18 to 19 Year Olds | 128 (90.8%) | 13 (9.2%) |
| 20 to 24 Year Olds | 112 (100.0%) | 0 (0.0%) |
| 25 to 34 Year Olds | 49 (100.0%) | 0 (0.0%) |
| 35 Years and over | 197 (91.6%) | 18 (8.4%) |
| Total | 2,523 (95.8%) | 111 (4.2%) |
Educational Attainment by Field of Study in Richfield
Education (316 | 25.2%), business (221 | 17.6%), bio, nature & agricultural (145 | 11.6%), arts & humanities (139 | 11.1%), and science & technology (109 | 8.7%) are the most common fields of study among 1,254 individuals in Richfield who have obtained a bachelor's degree or higher.
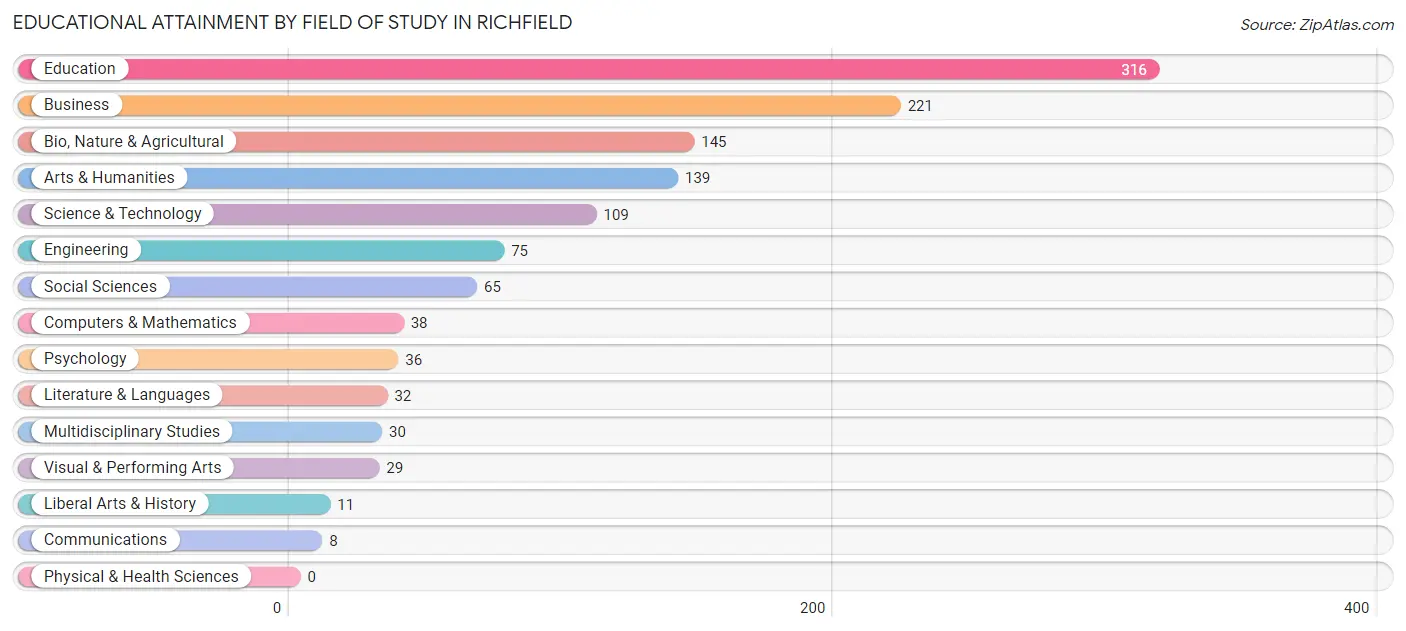
| Field of Study | # Graduates | % Graduates |
| Computers & Mathematics | 38 | 3.0% |
| Bio, Nature & Agricultural | 145 | 11.6% |
| Physical & Health Sciences | 0 | 0.0% |
| Psychology | 36 | 2.9% |
| Social Sciences | 65 | 5.2% |
| Engineering | 75 | 6.0% |
| Multidisciplinary Studies | 30 | 2.4% |
| Science & Technology | 109 | 8.7% |
| Business | 221 | 17.6% |
| Education | 316 | 25.2% |
| Literature & Languages | 32 | 2.5% |
| Liberal Arts & History | 11 | 0.9% |
| Visual & Performing Arts | 29 | 2.3% |
| Communications | 8 | 0.6% |
| Arts & Humanities | 139 | 11.1% |
| Total | 1,254 | 100.0% |
Transportation & Commute in Richfield
Vehicle Availability by Sex in Richfield
The most prevalent vehicle ownership categories in Richfield are males with 2 vehicles (593, accounting for 31.4%) and females with 2 vehicles (517, making up 44.4%).
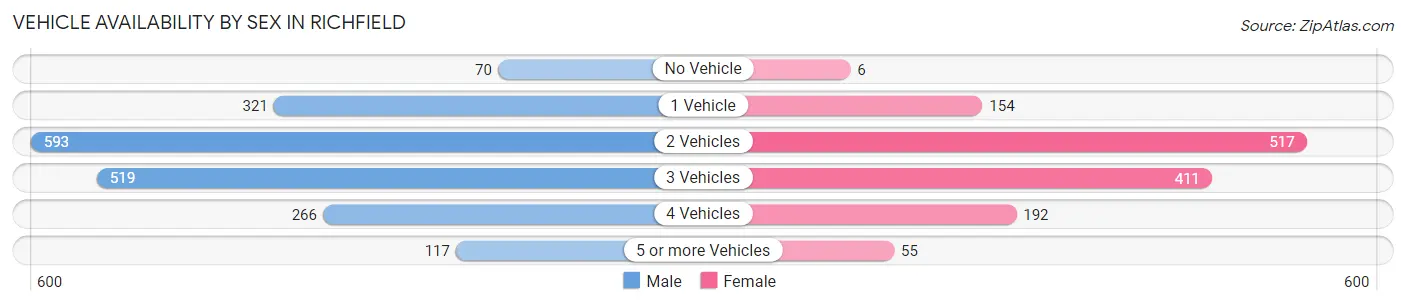
| Vehicles Available | Male | Female |
| No Vehicle | 70 (3.7%) | 6 (0.4%) |
| 1 Vehicle | 321 (17.0%) | 154 (11.5%) |
| 2 Vehicles | 593 (31.4%) | 517 (38.7%) |
| 3 Vehicles | 519 (27.5%) | 411 (30.8%) |
| 4 Vehicles | 266 (14.1%) | 192 (14.4%) |
| 5 or more Vehicles | 117 (6.2%) | 55 (4.1%) |
| Total | 1,886 (100.0%) | 1,335 (100.0%) |
Commute Time in Richfield
The most frequently occuring commute durations in Richfield are 5 to 9 minutes (1,157 commuters, 40.0%), 10 to 14 minutes (514 commuters, 17.8%), and less than 5 minutes (478 commuters, 16.5%).
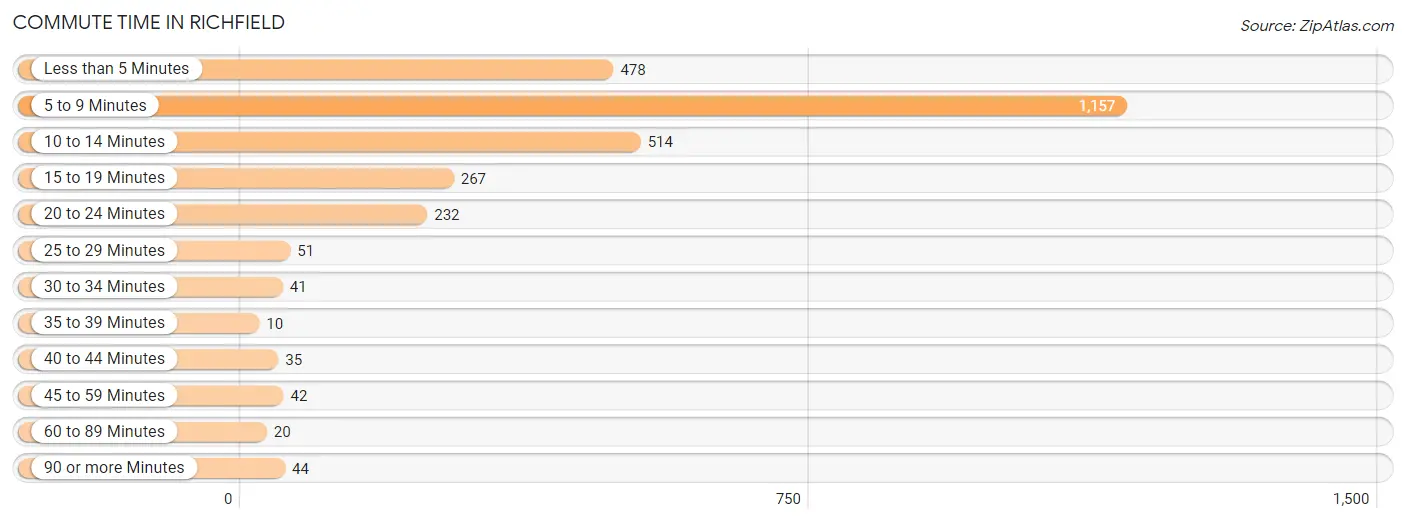
| Commute Time | # Commuters | % Commuters |
| Less than 5 Minutes | 478 | 16.5% |
| 5 to 9 Minutes | 1,157 | 40.0% |
| 10 to 14 Minutes | 514 | 17.8% |
| 15 to 19 Minutes | 267 | 9.2% |
| 20 to 24 Minutes | 232 | 8.0% |
| 25 to 29 Minutes | 51 | 1.8% |
| 30 to 34 Minutes | 41 | 1.4% |
| 35 to 39 Minutes | 10 | 0.4% |
| 40 to 44 Minutes | 35 | 1.2% |
| 45 to 59 Minutes | 42 | 1.5% |
| 60 to 89 Minutes | 20 | 0.7% |
| 90 or more Minutes | 44 | 1.5% |
Commute Time by Sex in Richfield
The most common commute times in Richfield are 5 to 9 minutes (722 commuters, 39.3%) for males and 5 to 9 minutes (435 commuters, 41.3%) for females.
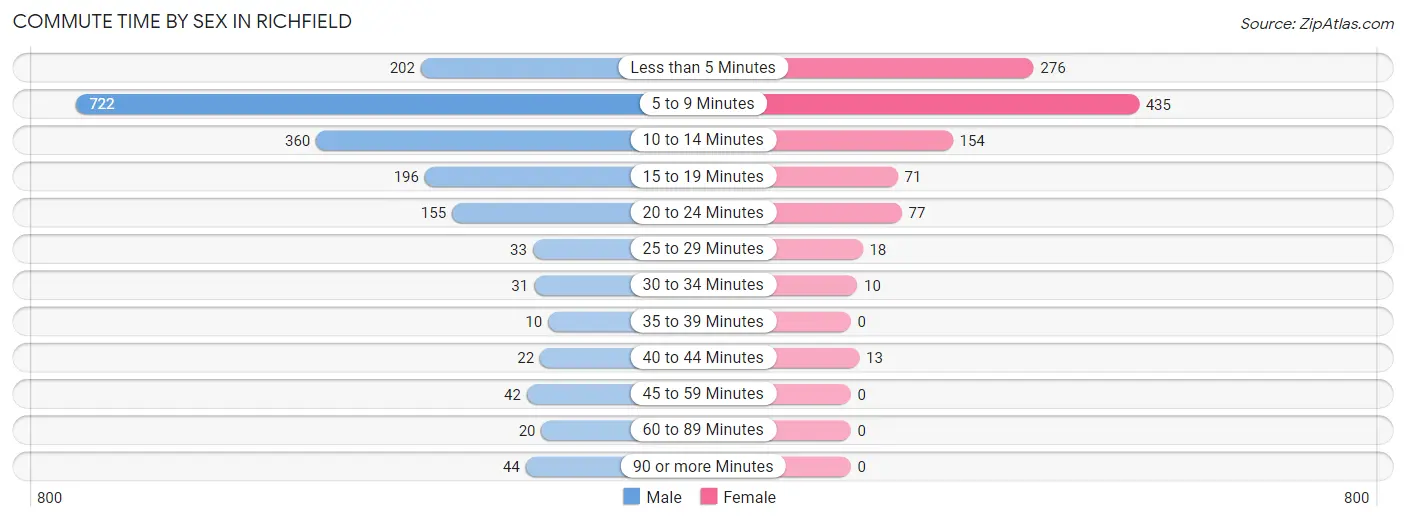
| Commute Time | Male | Female |
| Less than 5 Minutes | 202 (11.0%) | 276 (26.2%) |
| 5 to 9 Minutes | 722 (39.3%) | 435 (41.3%) |
| 10 to 14 Minutes | 360 (19.6%) | 154 (14.6%) |
| 15 to 19 Minutes | 196 (10.7%) | 71 (6.7%) |
| 20 to 24 Minutes | 155 (8.4%) | 77 (7.3%) |
| 25 to 29 Minutes | 33 (1.8%) | 18 (1.7%) |
| 30 to 34 Minutes | 31 (1.7%) | 10 (0.9%) |
| 35 to 39 Minutes | 10 (0.5%) | 0 (0.0%) |
| 40 to 44 Minutes | 22 (1.2%) | 13 (1.2%) |
| 45 to 59 Minutes | 42 (2.3%) | 0 (0.0%) |
| 60 to 89 Minutes | 20 (1.1%) | 0 (0.0%) |
| 90 or more Minutes | 44 (2.4%) | 0 (0.0%) |
Time of Departure to Work by Sex in Richfield
The most frequent times of departure to work in Richfield are 7:30 AM to 7:59 AM (325, 17.7%) for males and 7:30 AM to 7:59 AM (230, 21.8%) for females.
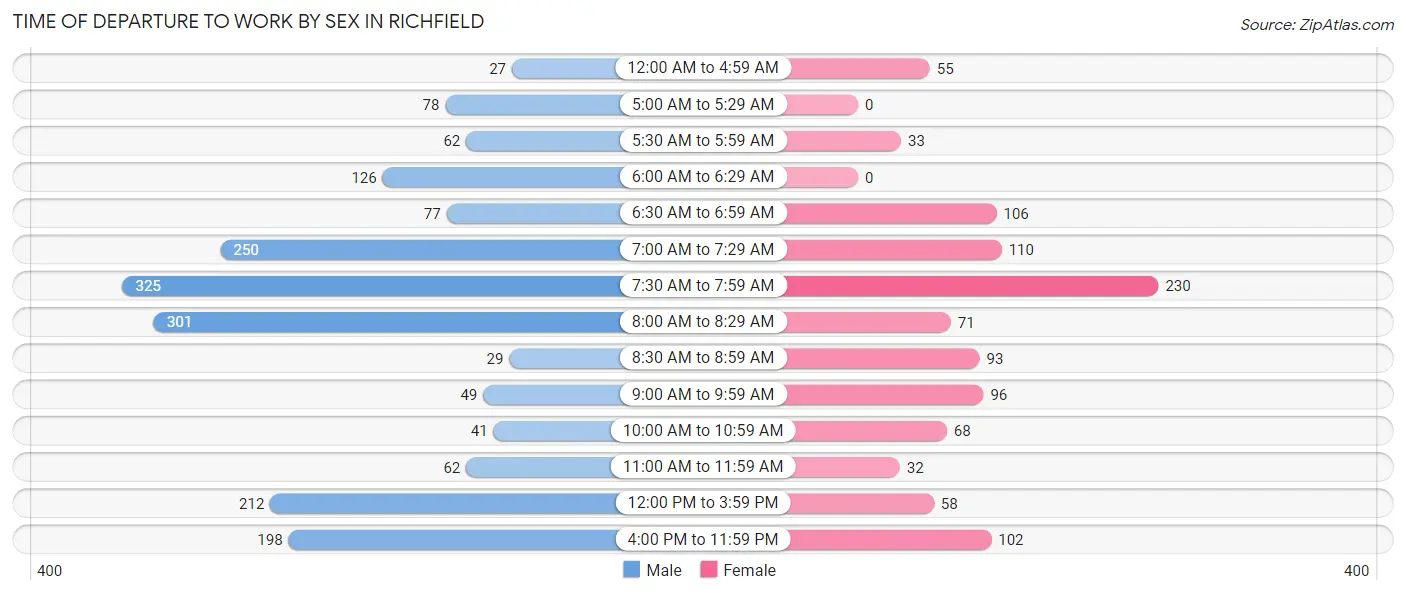
| Time of Departure | Male | Female |
| 12:00 AM to 4:59 AM | 27 (1.5%) | 55 (5.2%) |
| 5:00 AM to 5:29 AM | 78 (4.3%) | 0 (0.0%) |
| 5:30 AM to 5:59 AM | 62 (3.4%) | 33 (3.1%) |
| 6:00 AM to 6:29 AM | 126 (6.9%) | 0 (0.0%) |
| 6:30 AM to 6:59 AM | 77 (4.2%) | 106 (10.1%) |
| 7:00 AM to 7:29 AM | 250 (13.6%) | 110 (10.4%) |
| 7:30 AM to 7:59 AM | 325 (17.7%) | 230 (21.8%) |
| 8:00 AM to 8:29 AM | 301 (16.4%) | 71 (6.7%) |
| 8:30 AM to 8:59 AM | 29 (1.6%) | 93 (8.8%) |
| 9:00 AM to 9:59 AM | 49 (2.7%) | 96 (9.1%) |
| 10:00 AM to 10:59 AM | 41 (2.2%) | 68 (6.5%) |
| 11:00 AM to 11:59 AM | 62 (3.4%) | 32 (3.0%) |
| 12:00 PM to 3:59 PM | 212 (11.5%) | 58 (5.5%) |
| 4:00 PM to 11:59 PM | 198 (10.8%) | 102 (9.7%) |
| Total | 1,837 (100.0%) | 1,054 (100.0%) |
Housing Occupancy in Richfield
Occupancy by Ownership in Richfield
Of the total 2,645 dwellings in Richfield, owner-occupied units account for 1,799 (68.0%), while renter-occupied units make up 846 (32.0%).
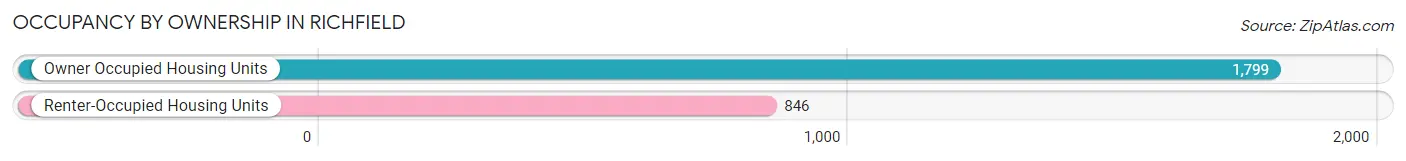
| Occupancy | # Housing Units | % Housing Units |
| Owner Occupied Housing Units | 1,799 | 68.0% |
| Renter-Occupied Housing Units | 846 | 32.0% |
| Total Occupied Housing Units | 2,645 | 100.0% |
Occupancy by Household Size in Richfield
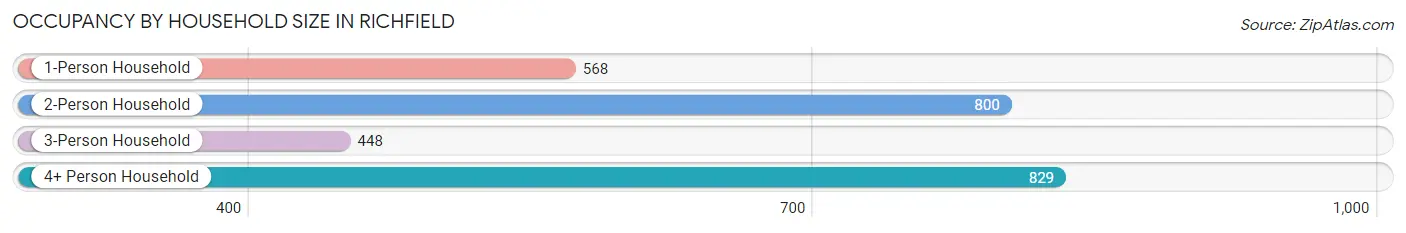
| Household Size | # Housing Units | % Housing Units |
| 1-Person Household | 568 | 21.5% |
| 2-Person Household | 800 | 30.2% |
| 3-Person Household | 448 | 16.9% |
| 4+ Person Household | 829 | 31.3% |
| Total Housing Units | 2,645 | 100.0% |
Occupancy by Ownership by Household Size in Richfield
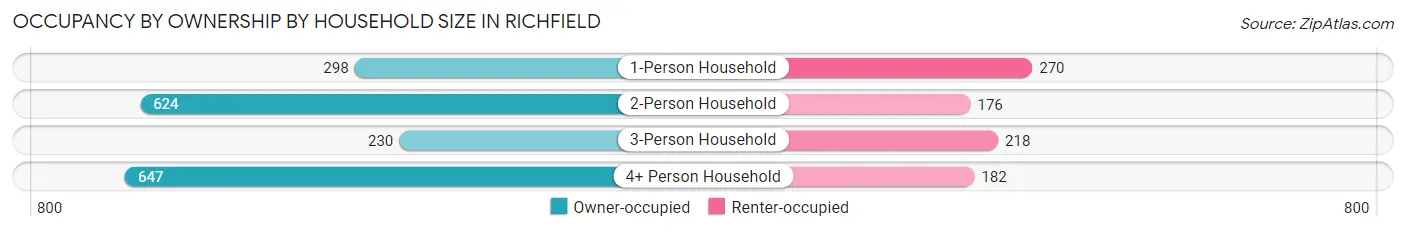
| Household Size | Owner-occupied | Renter-occupied |
| 1-Person Household | 298 (52.5%) | 270 (47.5%) |
| 2-Person Household | 624 (78.0%) | 176 (22.0%) |
| 3-Person Household | 230 (51.3%) | 218 (48.7%) |
| 4+ Person Household | 647 (78.0%) | 182 (22.0%) |
| Total Housing Units | 1,799 (68.0%) | 846 (32.0%) |
Occupancy by Educational Attainment in Richfield
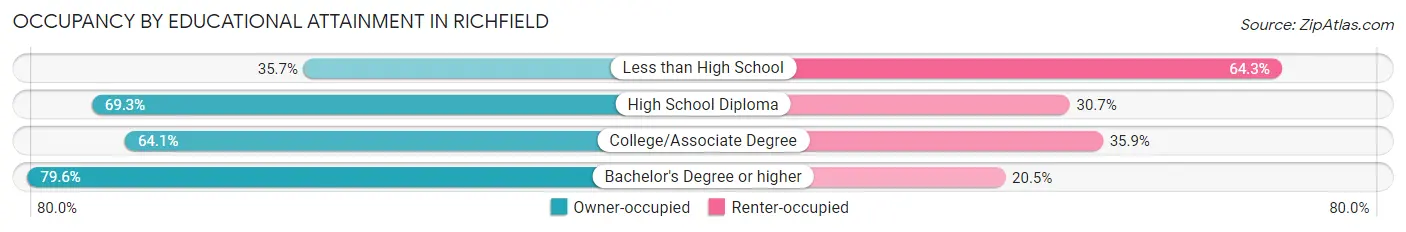
| Household Size | Owner-occupied | Renter-occupied |
| Less than High School | 55 (35.7%) | 99 (64.3%) |
| High School Diploma | 425 (69.3%) | 188 (30.7%) |
| College/Associate Degree | 724 (64.1%) | 406 (35.9%) |
| Bachelor's Degree or higher | 595 (79.5%) | 153 (20.4%) |
Occupancy by Age of Householder in Richfield
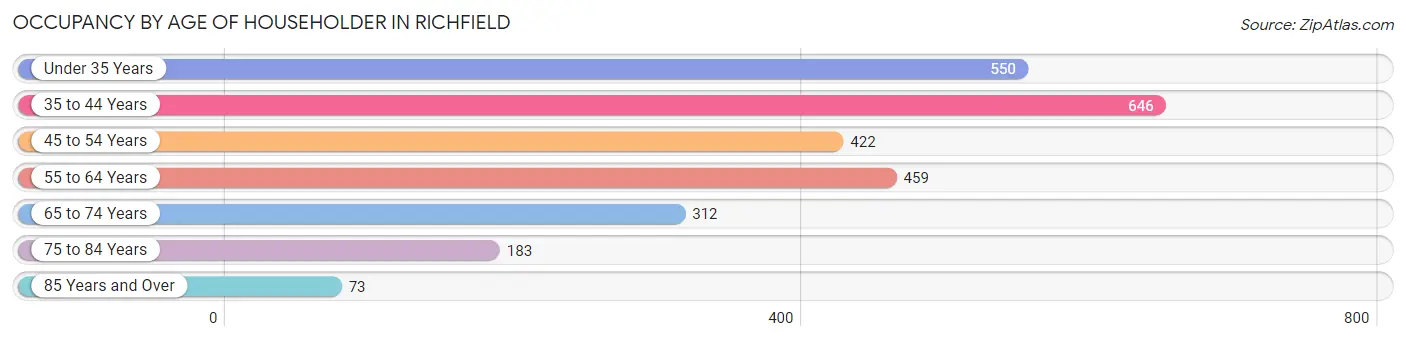
| Age Bracket | # Households | % Households |
| Under 35 Years | 550 | 20.8% |
| 35 to 44 Years | 646 | 24.4% |
| 45 to 54 Years | 422 | 16.0% |
| 55 to 64 Years | 459 | 17.3% |
| 65 to 74 Years | 312 | 11.8% |
| 75 to 84 Years | 183 | 6.9% |
| 85 Years and Over | 73 | 2.8% |
| Total | 2,645 | 100.0% |
Housing Finances in Richfield
Median Income by Occupancy in Richfield
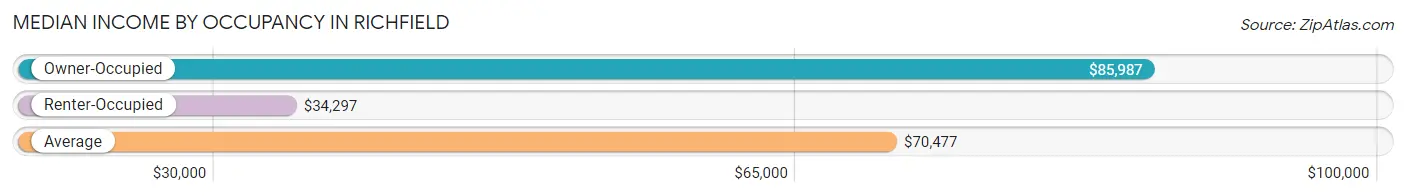
| Occupancy Type | # Households | Median Income |
| Owner-Occupied | 1,799 (68.0%) | $85,987 |
| Renter-Occupied | 846 (32.0%) | $34,297 |
| Average | 2,645 (100.0%) | $70,477 |
Occupancy by Householder Income Bracket in Richfield
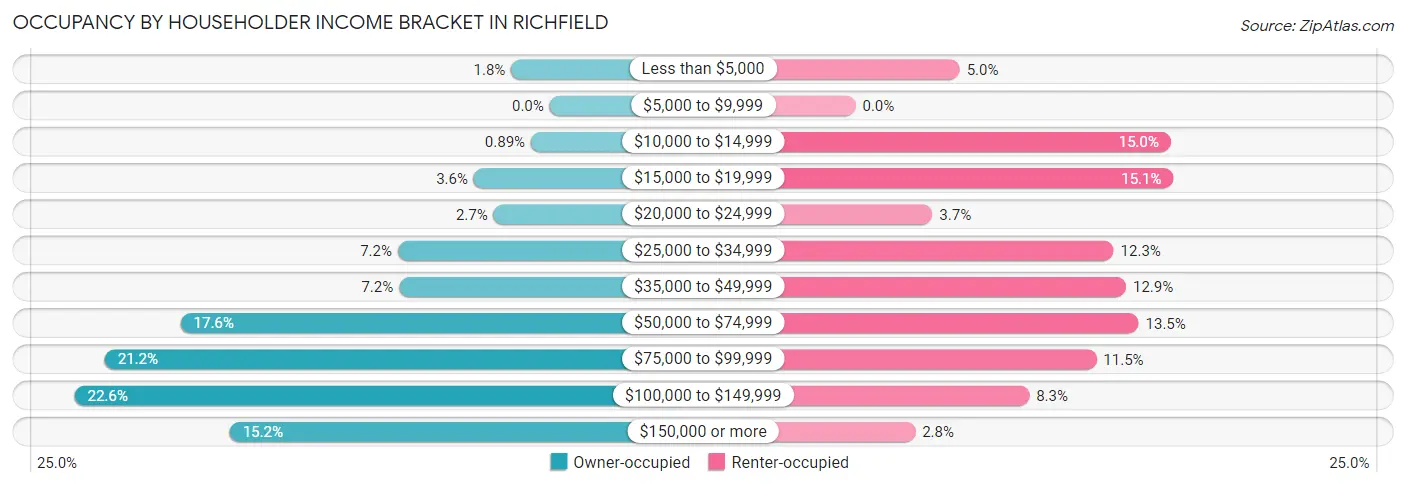
| Income Bracket | Owner-occupied | Renter-occupied |
| Less than $5,000 | 33 (1.8%) | 42 (5.0%) |
| $5,000 to $9,999 | 0 (0.0%) | 0 (0.0%) |
| $10,000 to $14,999 | 16 (0.9%) | 127 (15.0%) |
| $15,000 to $19,999 | 65 (3.6%) | 128 (15.1%) |
| $20,000 to $24,999 | 48 (2.7%) | 31 (3.7%) |
| $25,000 to $34,999 | 130 (7.2%) | 104 (12.3%) |
| $35,000 to $49,999 | 129 (7.2%) | 109 (12.9%) |
| $50,000 to $74,999 | 316 (17.6%) | 114 (13.5%) |
| $75,000 to $99,999 | 381 (21.2%) | 97 (11.5%) |
| $100,000 to $149,999 | 407 (22.6%) | 70 (8.3%) |
| $150,000 or more | 274 (15.2%) | 24 (2.8%) |
| Total | 1,799 (100.0%) | 846 (100.0%) |
Monthly Housing Cost Tiers in Richfield
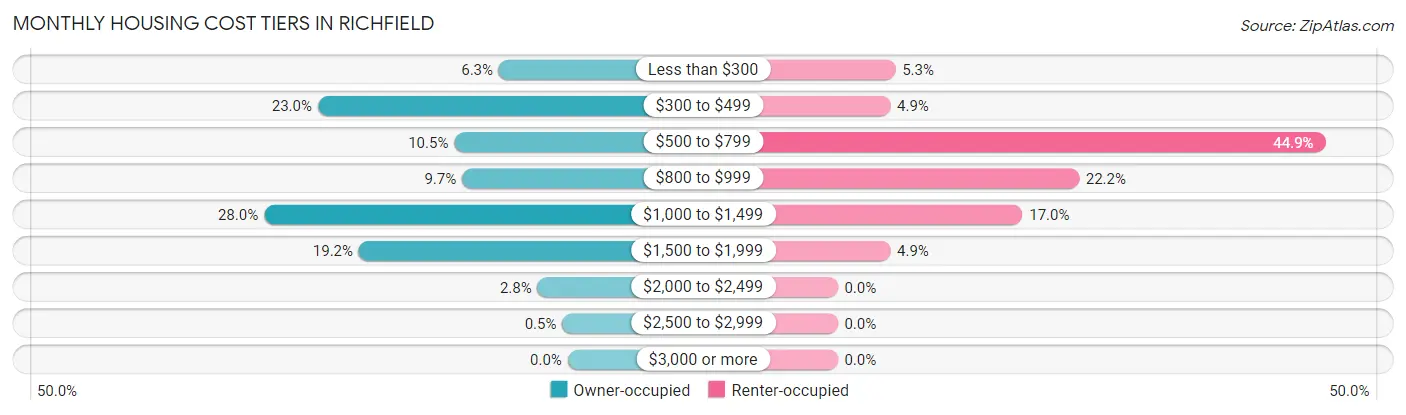
| Monthly Cost | Owner-occupied | Renter-occupied |
| Less than $300 | 114 (6.3%) | 45 (5.3%) |
| $300 to $499 | 414 (23.0%) | 41 (4.9%) |
| $500 to $799 | 188 (10.4%) | 380 (44.9%) |
| $800 to $999 | 175 (9.7%) | 188 (22.2%) |
| $1,000 to $1,499 | 503 (28.0%) | 144 (17.0%) |
| $1,500 to $1,999 | 346 (19.2%) | 41 (4.9%) |
| $2,000 to $2,499 | 50 (2.8%) | 0 (0.0%) |
| $2,500 to $2,999 | 9 (0.5%) | 0 (0.0%) |
| $3,000 or more | 0 (0.0%) | 0 (0.0%) |
| Total | 1,799 (100.0%) | 846 (100.0%) |
Physical Housing Characteristics in Richfield
Housing Structures in Richfield
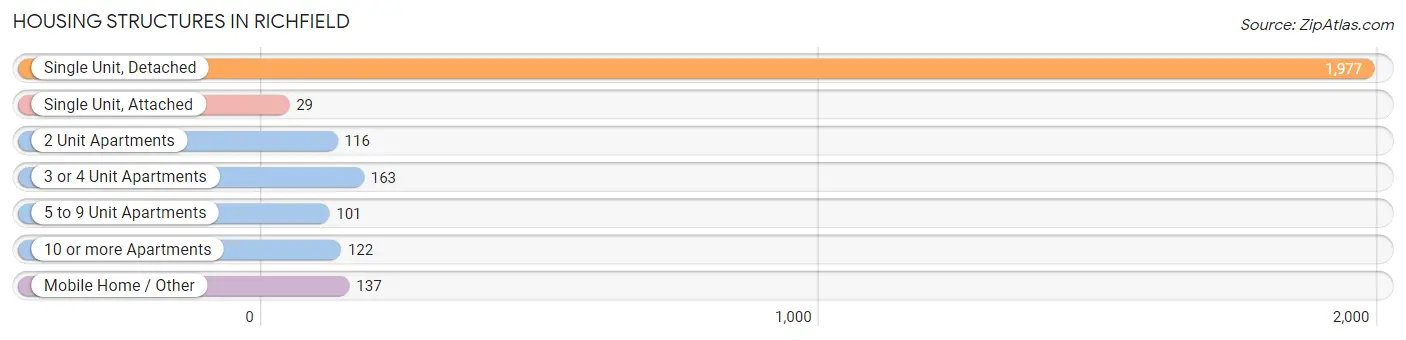
| Structure Type | # Housing Units | % Housing Units |
| Single Unit, Detached | 1,977 | 74.7% |
| Single Unit, Attached | 29 | 1.1% |
| 2 Unit Apartments | 116 | 4.4% |
| 3 or 4 Unit Apartments | 163 | 6.2% |
| 5 to 9 Unit Apartments | 101 | 3.8% |
| 10 or more Apartments | 122 | 4.6% |
| Mobile Home / Other | 137 | 5.2% |
| Total | 2,645 | 100.0% |
Housing Structures by Occupancy in Richfield
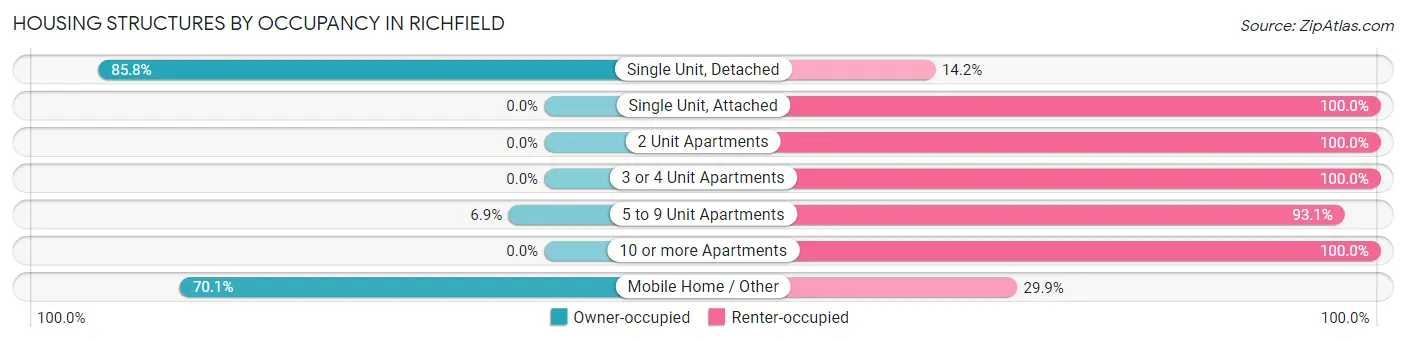
| Structure Type | Owner-occupied | Renter-occupied |
| Single Unit, Detached | 1,696 (85.8%) | 281 (14.2%) |
| Single Unit, Attached | 0 (0.0%) | 29 (100.0%) |
| 2 Unit Apartments | 0 (0.0%) | 116 (100.0%) |
| 3 or 4 Unit Apartments | 0 (0.0%) | 163 (100.0%) |
| 5 to 9 Unit Apartments | 7 (6.9%) | 94 (93.1%) |
| 10 or more Apartments | 0 (0.0%) | 122 (100.0%) |
| Mobile Home / Other | 96 (70.1%) | 41 (29.9%) |
| Total | 1,799 (68.0%) | 846 (32.0%) |
Housing Structures by Number of Rooms in Richfield
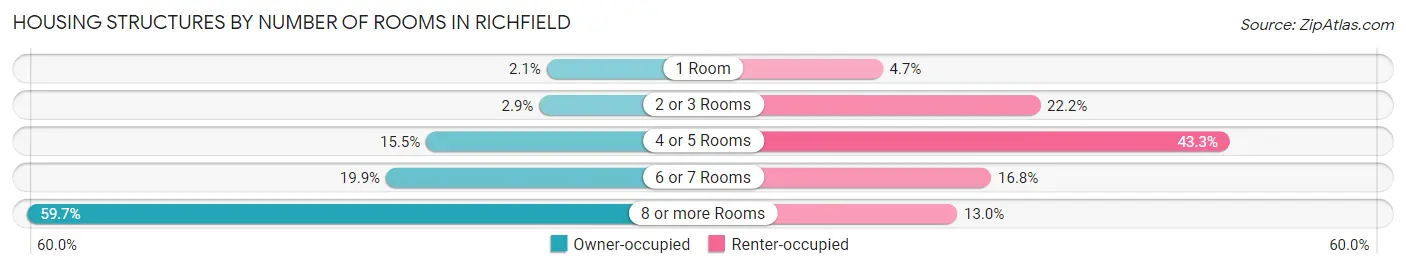
| Number of Rooms | Owner-occupied | Renter-occupied |
| 1 Room | 37 (2.1%) | 40 (4.7%) |
| 2 or 3 Rooms | 52 (2.9%) | 188 (22.2%) |
| 4 or 5 Rooms | 278 (15.4%) | 366 (43.3%) |
| 6 or 7 Rooms | 358 (19.9%) | 142 (16.8%) |
| 8 or more Rooms | 1,074 (59.7%) | 110 (13.0%) |
| Total | 1,799 (100.0%) | 846 (100.0%) |
Housing Structure by Heating Type in Richfield
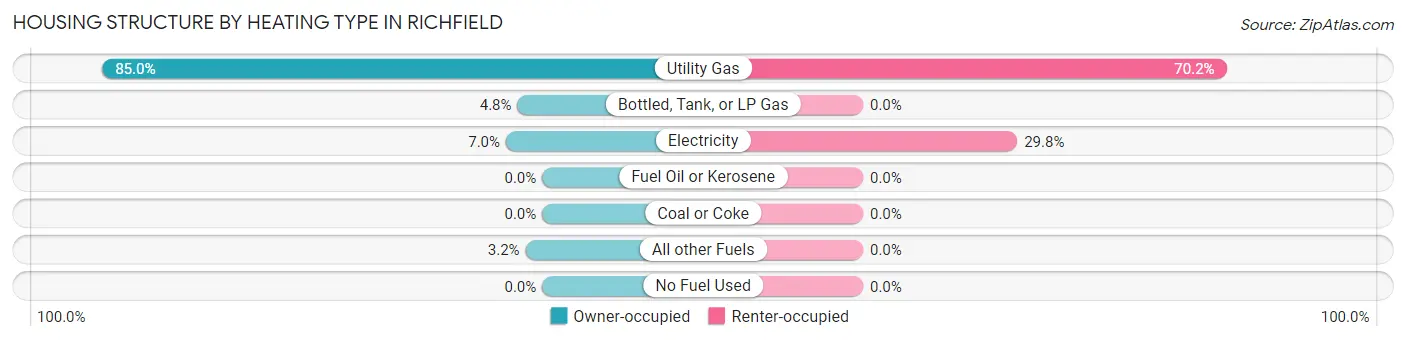
| Heating Type | Owner-occupied | Renter-occupied |
| Utility Gas | 1,529 (85.0%) | 594 (70.2%) |
| Bottled, Tank, or LP Gas | 86 (4.8%) | 0 (0.0%) |
| Electricity | 126 (7.0%) | 252 (29.8%) |
| Fuel Oil or Kerosene | 0 (0.0%) | 0 (0.0%) |
| Coal or Coke | 0 (0.0%) | 0 (0.0%) |
| All other Fuels | 58 (3.2%) | 0 (0.0%) |
| No Fuel Used | 0 (0.0%) | 0 (0.0%) |
| Total | 1,799 (100.0%) | 846 (100.0%) |
Household Vehicle Usage in Richfield
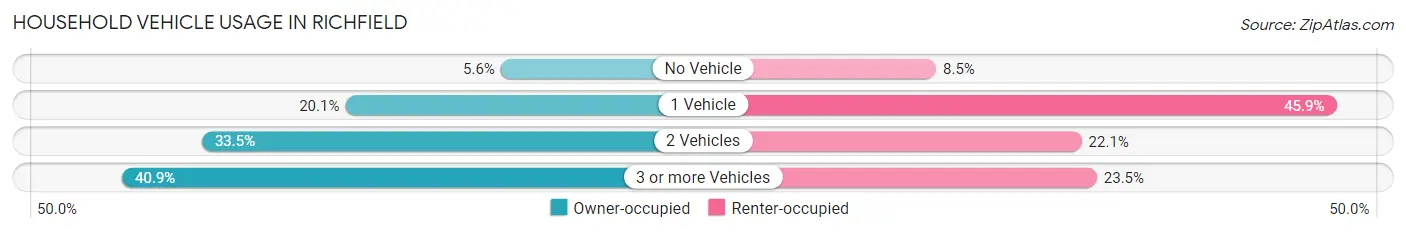
| Vehicles per Household | Owner-occupied | Renter-occupied |
| No Vehicle | 100 (5.6%) | 72 (8.5%) |
| 1 Vehicle | 361 (20.1%) | 388 (45.9%) |
| 2 Vehicles | 602 (33.5%) | 187 (22.1%) |
| 3 or more Vehicles | 736 (40.9%) | 199 (23.5%) |
| Total | 1,799 (100.0%) | 846 (100.0%) |
Real Estate & Mortgages in Richfield
Real Estate and Mortgage Overview in Richfield
| Characteristic | Without Mortgage | With Mortgage |
| Housing Units | 646 | 1,153 |
| Median Property Value | $228,400 | $240,900 |
| Median Household Income | $76,190 | $205 |
| Monthly Housing Costs | $402 | $0 |
| Real Estate Taxes | $1,431 | $58 |
Property Value by Mortgage Status in Richfield
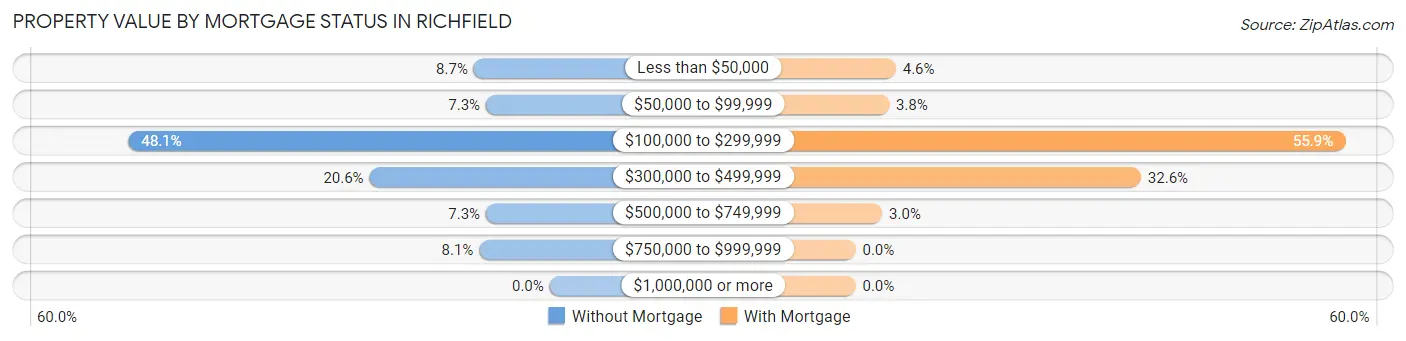
| Property Value | Without Mortgage | With Mortgage |
| Less than $50,000 | 56 (8.7%) | 53 (4.6%) |
| $50,000 to $99,999 | 47 (7.3%) | 44 (3.8%) |
| $100,000 to $299,999 | 311 (48.1%) | 645 (55.9%) |
| $300,000 to $499,999 | 133 (20.6%) | 376 (32.6%) |
| $500,000 to $749,999 | 47 (7.3%) | 35 (3.0%) |
| $750,000 to $999,999 | 52 (8.1%) | 0 (0.0%) |
| $1,000,000 or more | 0 (0.0%) | 0 (0.0%) |
| Total | 646 (100.0%) | 1,153 (100.0%) |
Household Income by Mortgage Status in Richfield
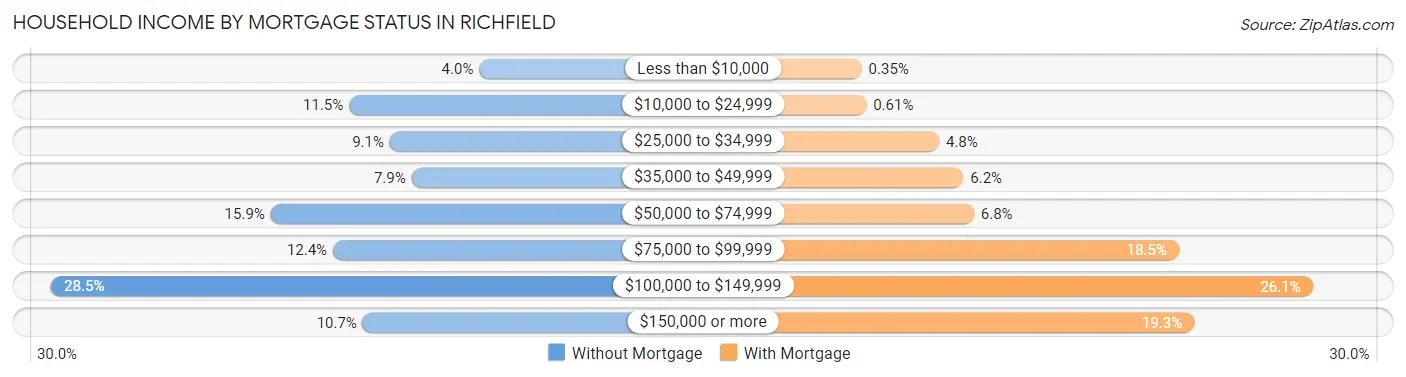
| Household Income | Without Mortgage | With Mortgage |
| Less than $10,000 | 26 (4.0%) | 4 (0.4%) |
| $10,000 to $24,999 | 74 (11.5%) | 7 (0.6%) |
| $25,000 to $34,999 | 59 (9.1%) | 55 (4.8%) |
| $35,000 to $49,999 | 51 (7.9%) | 71 (6.2%) |
| $50,000 to $74,999 | 103 (15.9%) | 78 (6.8%) |
| $75,000 to $99,999 | 80 (12.4%) | 213 (18.5%) |
| $100,000 to $149,999 | 184 (28.5%) | 301 (26.1%) |
| $150,000 or more | 69 (10.7%) | 223 (19.3%) |
| Total | 646 (100.0%) | 1,153 (100.0%) |
Property Value to Household Income Ratio in Richfield
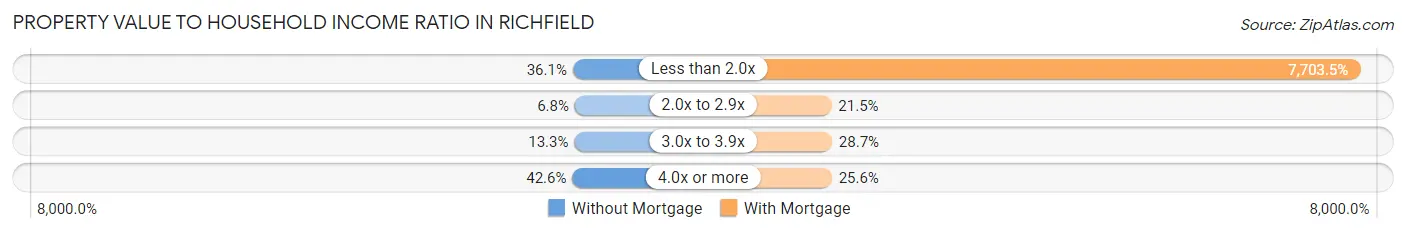
| Value-to-Income Ratio | Without Mortgage | With Mortgage |
| Less than 2.0x | 233 (36.1%) | 88,821 (7,703.5%) |
| 2.0x to 2.9x | 44 (6.8%) | 248 (21.5%) |
| 3.0x to 3.9x | 86 (13.3%) | 331 (28.7%) |
| 4.0x or more | 275 (42.6%) | 295 (25.6%) |
| Total | 646 (100.0%) | 1,153 (100.0%) |
Real Estate Taxes by Mortgage Status in Richfield
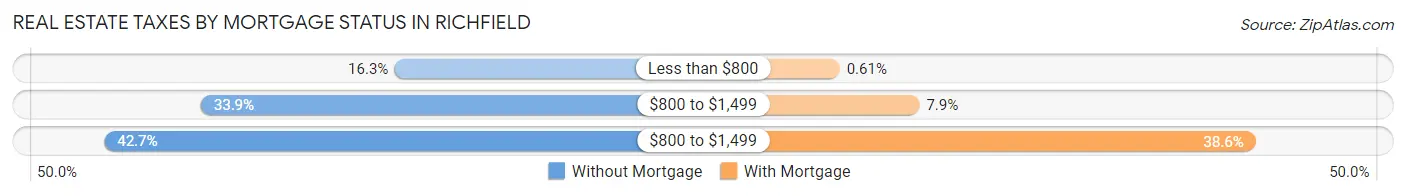
| Property Taxes | Without Mortgage | With Mortgage |
| Less than $800 | 105 (16.3%) | 7 (0.6%) |
| $800 to $1,499 | 219 (33.9%) | 91 (7.9%) |
| $800 to $1,499 | 276 (42.7%) | 445 (38.6%) |
| Total | 646 (100.0%) | 1,153 (100.0%) |
Health & Disability in Richfield
Health Insurance Coverage by Age in Richfield
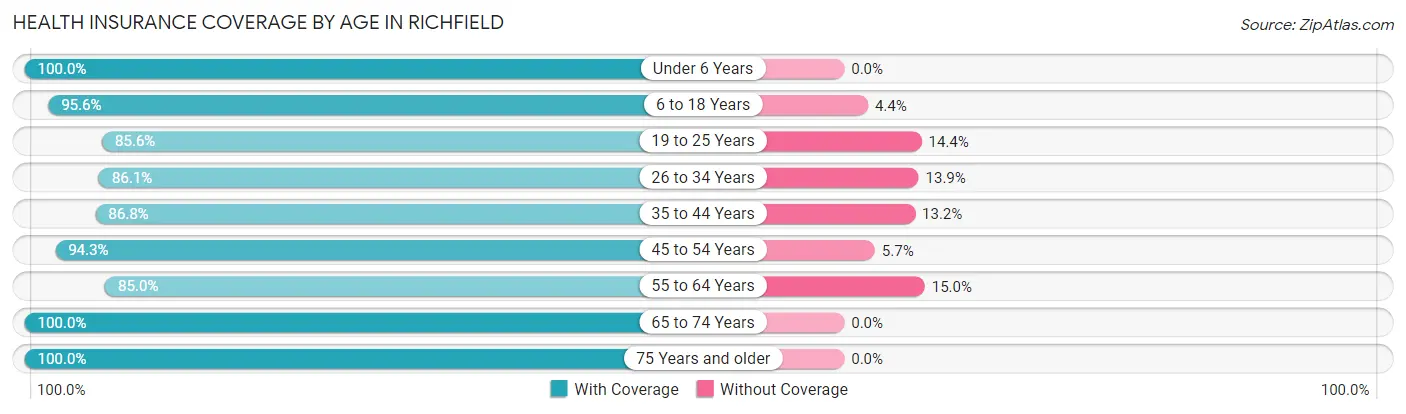
| Age Bracket | With Coverage | Without Coverage |
| Under 6 Years | 776 (100.0%) | 0 (0.0%) |
| 6 to 18 Years | 1,971 (95.6%) | 91 (4.4%) |
| 19 to 25 Years | 546 (85.6%) | 92 (14.4%) |
| 26 to 34 Years | 777 (86.1%) | 125 (13.9%) |
| 35 to 44 Years | 1,012 (86.8%) | 154 (13.2%) |
| 45 to 54 Years | 694 (94.3%) | 42 (5.7%) |
| 55 to 64 Years | 668 (85.0%) | 118 (15.0%) |
| 65 to 74 Years | 557 (100.0%) | 0 (0.0%) |
| 75 Years and older | 387 (100.0%) | 0 (0.0%) |
| Total | 7,388 (92.2%) | 622 (7.8%) |
Health Insurance Coverage by Citizenship Status in Richfield
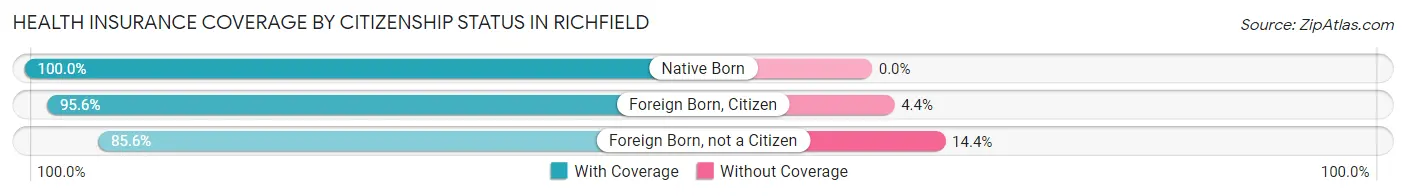
| Citizenship Status | With Coverage | Without Coverage |
| Native Born | 776 (100.0%) | 0 (0.0%) |
| Foreign Born, Citizen | 1,971 (95.6%) | 91 (4.4%) |
| Foreign Born, not a Citizen | 546 (85.6%) | 92 (14.4%) |
Health Insurance Coverage by Household Income in Richfield
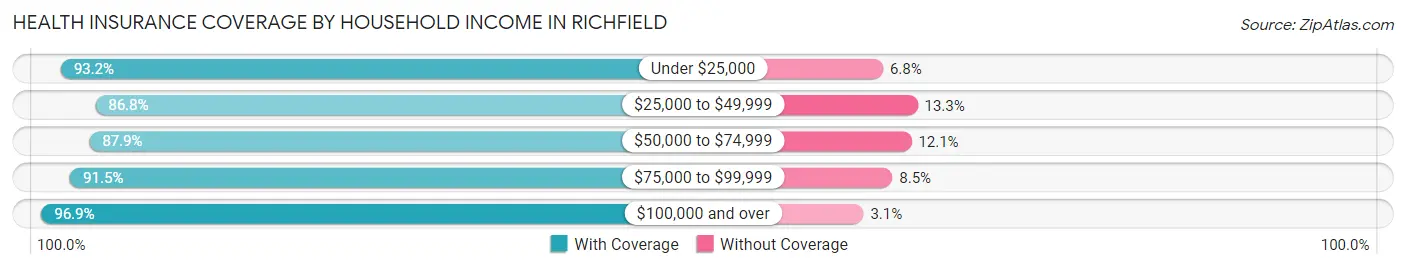
| Household Income | With Coverage | Without Coverage |
| Under $25,000 | 978 (93.2%) | 71 (6.8%) |
| $25,000 to $49,999 | 910 (86.8%) | 139 (13.3%) |
| $50,000 to $74,999 | 1,336 (87.9%) | 184 (12.1%) |
| $75,000 to $99,999 | 1,543 (91.5%) | 144 (8.5%) |
| $100,000 and over | 2,565 (96.9%) | 83 (3.1%) |
Public vs Private Health Insurance Coverage by Age in Richfield
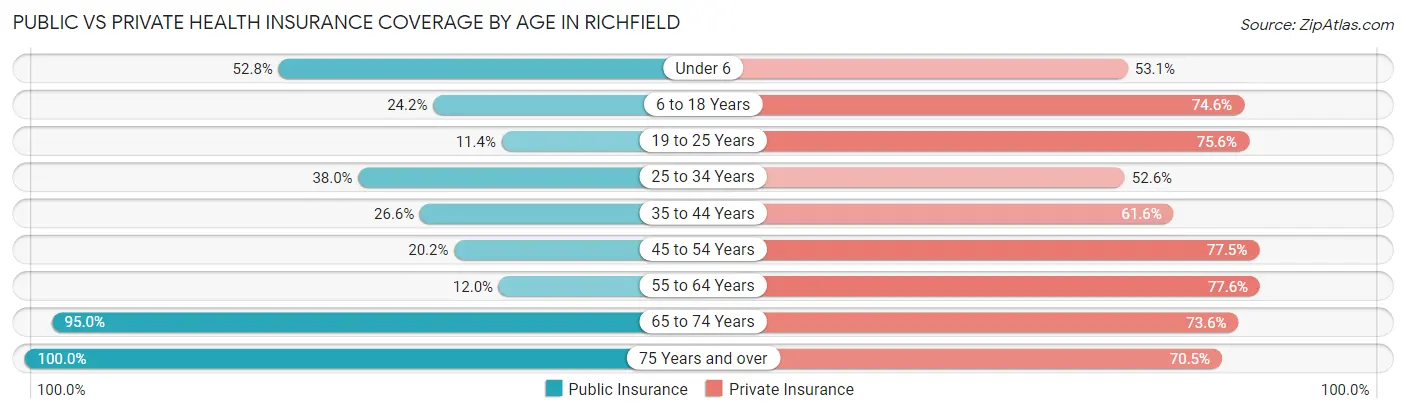
| Age Bracket | Public Insurance | Private Insurance |
| Under 6 | 410 (52.8%) | 412 (53.1%) |
| 6 to 18 Years | 498 (24.1%) | 1,539 (74.6%) |
| 19 to 25 Years | 73 (11.4%) | 482 (75.5%) |
| 25 to 34 Years | 343 (38.0%) | 474 (52.5%) |
| 35 to 44 Years | 310 (26.6%) | 718 (61.6%) |
| 45 to 54 Years | 149 (20.2%) | 570 (77.4%) |
| 55 to 64 Years | 94 (12.0%) | 610 (77.6%) |
| 65 to 74 Years | 529 (95.0%) | 410 (73.6%) |
| 75 Years and over | 387 (100.0%) | 273 (70.5%) |
| Total | 2,793 (34.9%) | 5,488 (68.5%) |
Disability Status by Sex by Age in Richfield
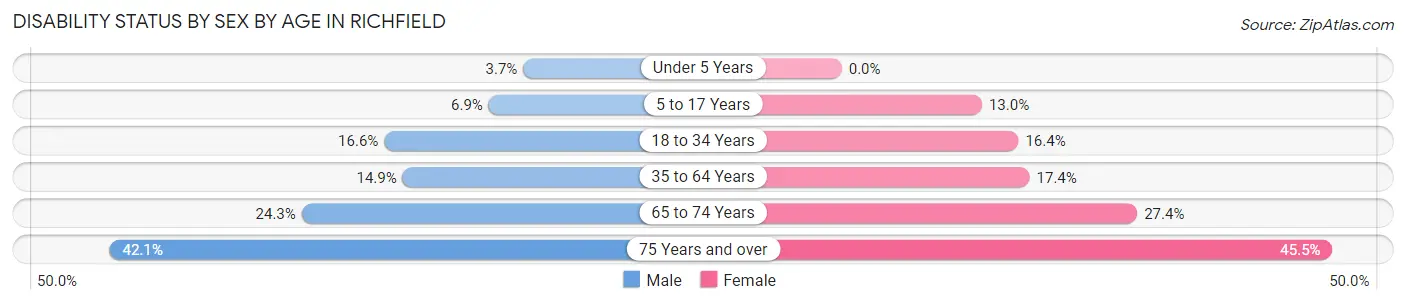
| Age Bracket | Male | Female |
| Under 5 Years | 12 (3.7%) | 0 (0.0%) |
| 5 to 17 Years | 66 (6.9%) | 138 (13.0%) |
| 18 to 34 Years | 136 (16.6%) | 145 (16.4%) |
| 35 to 64 Years | 205 (14.9%) | 229 (17.4%) |
| 65 to 74 Years | 60 (24.3%) | 85 (27.4%) |
| 75 Years and over | 64 (42.1%) | 107 (45.5%) |
Disability Class by Sex by Age in Richfield
Disability Class: Hearing Difficulty
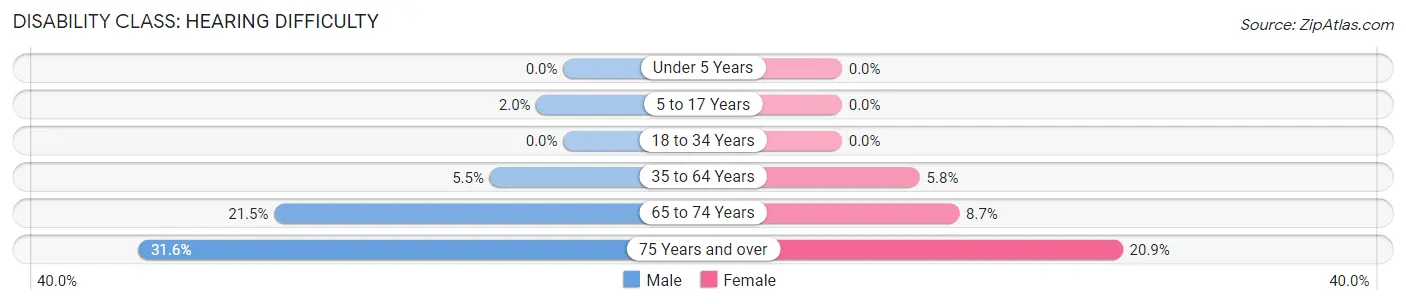
| Age Bracket | Male | Female |
| Under 5 Years | 0 (0.0%) | 0 (0.0%) |
| 5 to 17 Years | 19 (2.0%) | 0 (0.0%) |
| 18 to 34 Years | 0 (0.0%) | 0 (0.0%) |
| 35 to 64 Years | 75 (5.5%) | 76 (5.8%) |
| 65 to 74 Years | 53 (21.5%) | 27 (8.7%) |
| 75 Years and over | 48 (31.6%) | 49 (20.8%) |
Disability Class: Vision Difficulty
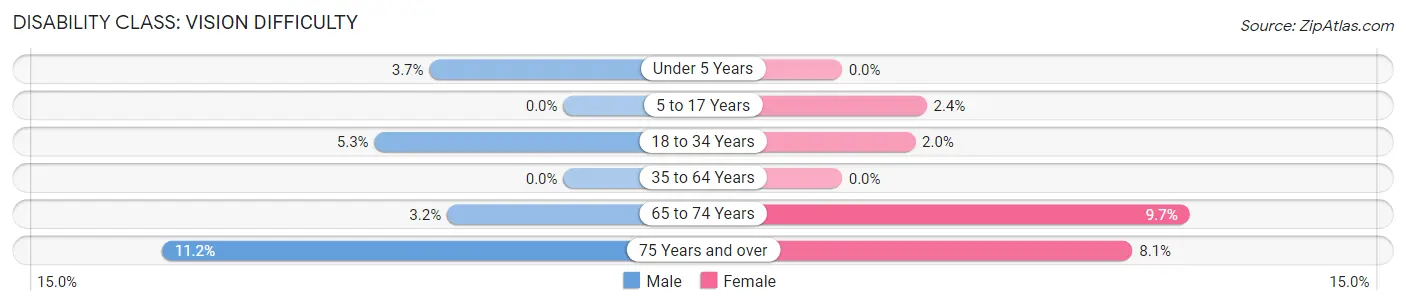
| Age Bracket | Male | Female |
| Under 5 Years | 12 (3.7%) | 0 (0.0%) |
| 5 to 17 Years | 0 (0.0%) | 25 (2.4%) |
| 18 to 34 Years | 43 (5.3%) | 18 (2.0%) |
| 35 to 64 Years | 0 (0.0%) | 0 (0.0%) |
| 65 to 74 Years | 8 (3.2%) | 30 (9.7%) |
| 75 Years and over | 17 (11.2%) | 19 (8.1%) |
Disability Class: Cognitive Difficulty
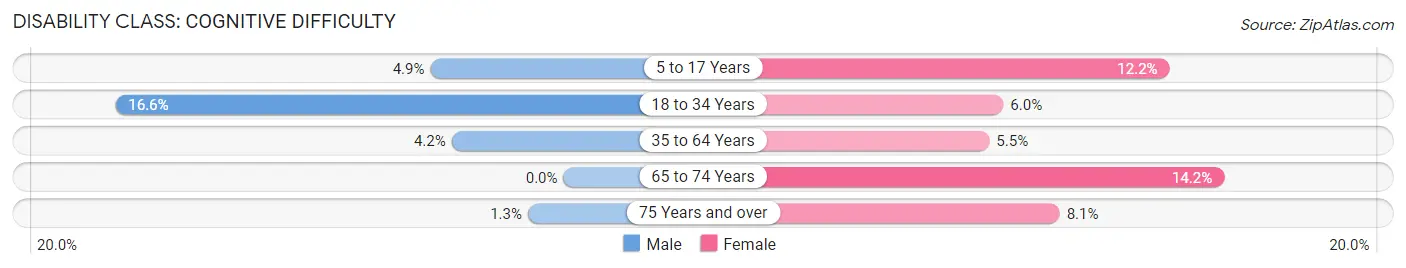
| Age Bracket | Male | Female |
| 5 to 17 Years | 47 (4.9%) | 129 (12.2%) |
| 18 to 34 Years | 136 (16.6%) | 53 (6.0%) |
| 35 to 64 Years | 57 (4.2%) | 72 (5.5%) |
| 65 to 74 Years | 0 (0.0%) | 44 (14.2%) |
| 75 Years and over | 2 (1.3%) | 19 (8.1%) |
Disability Class: Ambulatory Difficulty
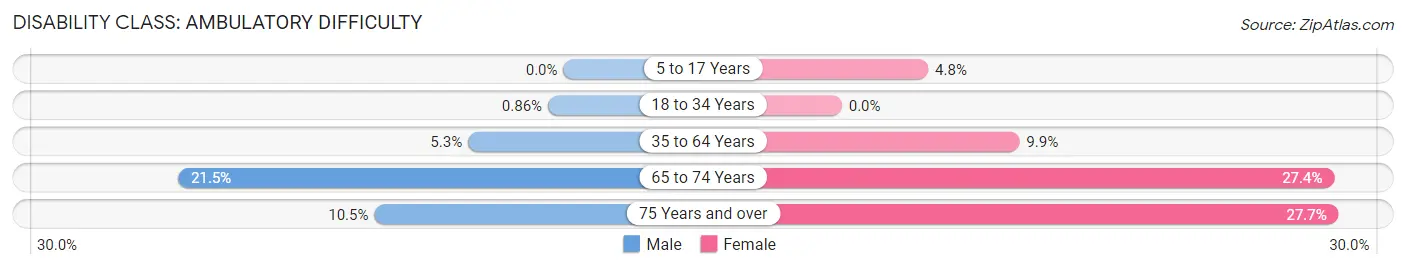
| Age Bracket | Male | Female |
| 5 to 17 Years | 0 (0.0%) | 51 (4.8%) |
| 18 to 34 Years | 7 (0.9%) | 0 (0.0%) |
| 35 to 64 Years | 73 (5.3%) | 130 (9.9%) |
| 65 to 74 Years | 53 (21.5%) | 85 (27.4%) |
| 75 Years and over | 16 (10.5%) | 65 (27.7%) |
Disability Class: Self-Care Difficulty
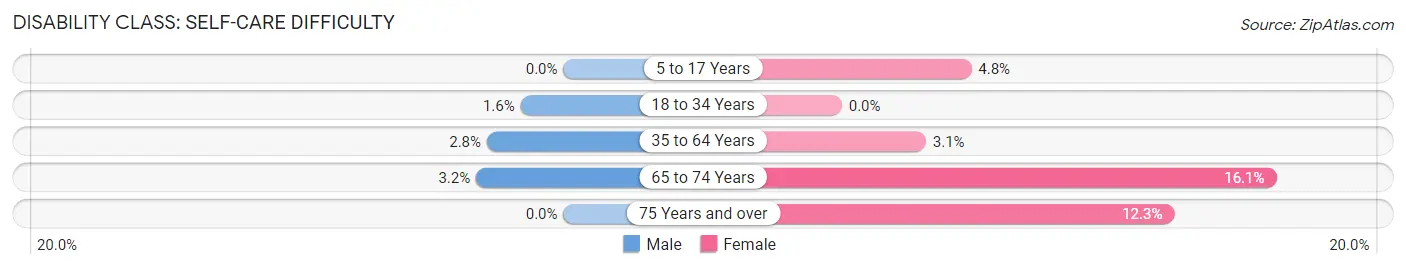
| Age Bracket | Male | Female |
| 5 to 17 Years | 0 (0.0%) | 51 (4.8%) |
| 18 to 34 Years | 13 (1.6%) | 0 (0.0%) |
| 35 to 64 Years | 39 (2.8%) | 41 (3.1%) |
| 65 to 74 Years | 8 (3.2%) | 50 (16.1%) |
| 75 Years and over | 0 (0.0%) | 29 (12.3%) |
Technology Access in Richfield
Computing Device Access in Richfield
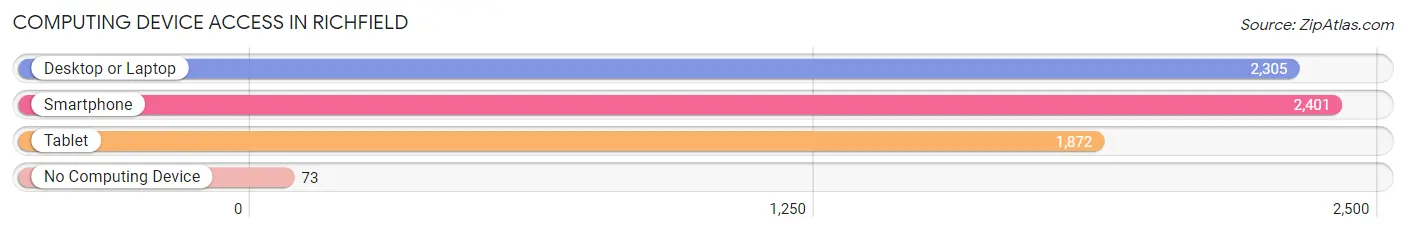
| Device Type | # Households | % Households |
| Desktop or Laptop | 2,305 | 87.2% |
| Smartphone | 2,401 | 90.8% |
| Tablet | 1,872 | 70.8% |
| No Computing Device | 73 | 2.8% |
| Total | 2,645 | 100.0% |
Internet Access in Richfield
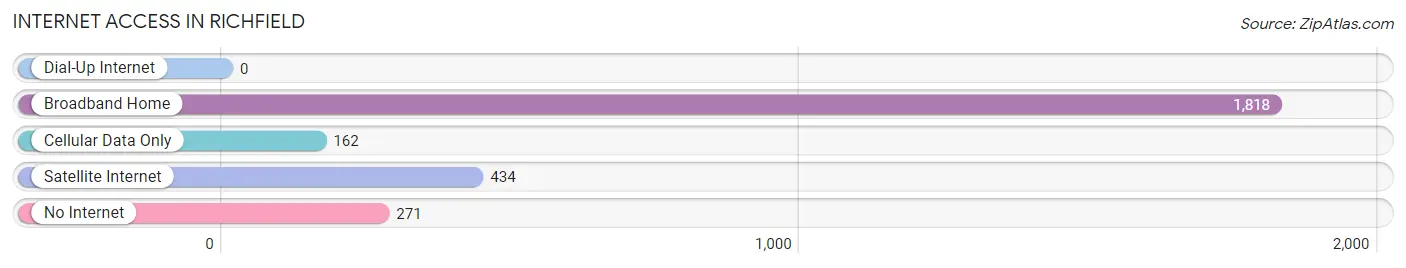
| Internet Type | # Households | % Households |
| Dial-Up Internet | 0 | 0.0% |
| Broadband Home | 1,818 | 68.7% |
| Cellular Data Only | 162 | 6.1% |
| Satellite Internet | 434 | 16.4% |
| No Internet | 271 | 10.2% |
| Total | 2,645 | 100.0% |
Richfield Summary
Richfield is a city located in the south-central region of Utah, United States. It is the county seat of Sevier County and is located in the Sevier Valley, which is part of the Great Basin region. The city is situated at the base of the Wasatch Mountains and is surrounded by the Fishlake National Forest. Richfield has a population of 7,551 as of the 2010 census, making it the largest city in Sevier County.
History
Richfield was first settled in 1864 by a group of Mormon pioneers led by Charles C. Rich. The pioneers were sent to the area by Brigham Young to establish a settlement in the Sevier Valley. The settlement was originally called Richville, but the name was changed to Richfield in 1868. The city was incorporated in 1892 and has since grown to become the largest city in Sevier County.
Geography
Richfield is located in the Sevier Valley, which is part of the Great Basin region. The city is situated at the base of the Wasatch Mountains and is surrounded by the Fishlake National Forest. The city has a total area of 5.3 square miles, all of which is land.
Climate
Richfield has a semi-arid climate, with hot summers and cold winters. The average annual temperature is 48.3°F, with an average high of 79.2°F in July and an average low of 17.2°F in January. The average annual precipitation is 11.2 inches, with an average of 1.7 inches of snowfall per year.
Economy
Richfield’s economy is largely based on agriculture and tourism. The city is home to several large agricultural operations, including dairy farms, beef cattle ranches, and fruit orchards. Richfield is also a popular tourist destination, with attractions such as the Fishlake National Forest, the Sevier Valley Center, and the Richfield City Park.
Demographics
As of the 2010 census, Richfield had a population of 7,551. The racial makeup of the city was 91.2% White, 0.7% African American, 0.7% Native American, 0.7% Asian, 0.2% Pacific Islander, 4.7% from other races, and 2.0% from two or more races. Hispanic or Latino of any race were 8.7% of the population.
The median income for a household in Richfield was $37,917, and the median income for a family was $45,917. The per capita income for the city was $17,845. About 11.2% of families and 14.2% of the population were below the poverty line, including 17.2% of those under age 18 and 8.2% of those age 65 or over.
Common Questions
What is Per Capita Income in Richfield?
Per Capita income in Richfield is $26,407.
What is the Median Family Income in Richfield?
Median Family Income in Richfield is $76,423.
What is the Median Household income in Richfield?
Median Household Income in Richfield is $70,477.
What is Income or Wage Gap in Richfield?
Income or Wage Gap in Richfield is 40.0%.
Women in Richfield earn 60.0 cents for every dollar earned by a man.
What is Inequality or Gini Index in Richfield?
Inequality or Gini Index in Richfield is 0.40.
What is the Total Population of Richfield?
Total Population of Richfield is 8,213.
What is the Total Male Population of Richfield?
Total Male Population of Richfield is 4,031.
What is the Total Female Population of Richfield?
Total Female Population of Richfield is 4,182.
What is the Ratio of Males per 100 Females in Richfield?
There are 96.39 Males per 100 Females in Richfield.
What is the Ratio of Females per 100 Males in Richfield?
There are 103.75 Females per 100 Males in Richfield.
What is the Median Population Age in Richfield?
Median Population Age in Richfield is 31.5 Years.
What is the Average Family Size in Richfield
Average Family Size in Richfield is 3.5 People.
What is the Average Household Size in Richfield
Average Household Size in Richfield is 3.0 People.
How Large is the Labor Force in Richfield?
There are 3,480 People in the Labor Forcein in Richfield.
What is the Percentage of People in the Labor Force in Richfield?
59.0% of People are in the Labor Force in Richfield.
What is the Unemployment Rate in Richfield?
Unemployment Rate in Richfield is 5.3%.