Clearfield, UT Map & Demographics
Clearfield Map
Clearfield Overview
$28,203
PER CAPITA INCOME
$81,162
AVG FAMILY INCOME
$69,889
AVG HOUSEHOLD INCOME
40.1%
WAGE / INCOME GAP [ % ]
59.9¢/ $1
WAGE / INCOME GAP [ $ ]
$10,769
FAMILY INCOME DEFICIT
0.37
INEQUALITY / GINI INDEX
32,369
TOTAL POPULATION
16,752
MALE POPULATION
15,617
FEMALE POPULATION
107.27
MALES / 100 FEMALES
93.22
FEMALES / 100 MALES
29.8
MEDIAN AGE
3.6
AVG FAMILY SIZE
3.0
AVG HOUSEHOLD SIZE
16,479
LABOR FORCE [ PEOPLE ]
69.9%
PERCENT IN LABOR FORCE
3.0%
UNEMPLOYMENT RATE
Clearfield Zip Codes
Income in Clearfield
Income Overview in Clearfield
Per Capita Income in Clearfield is $28,203, while median incomes of families and households are $81,162 and $69,889 respectively.
| Characteristic | Number | Measure |
| Per Capita Income | 32,369 | $28,203 |
| Median Family Income | 7,501 | $81,162 |
| Mean Family Income | 7,501 | $90,976 |
| Median Household Income | 10,672 | $69,889 |
| Mean Household Income | 10,672 | $81,789 |
| Income Deficit | 7,501 | $10,769 |
| Wage / Income Gap (%) | 32,369 | 40.05% |
| Wage / Income Gap ($) | 32,369 | 59.95¢ per $1 |
| Gini / Inequality Index | 32,369 | 0.37 |
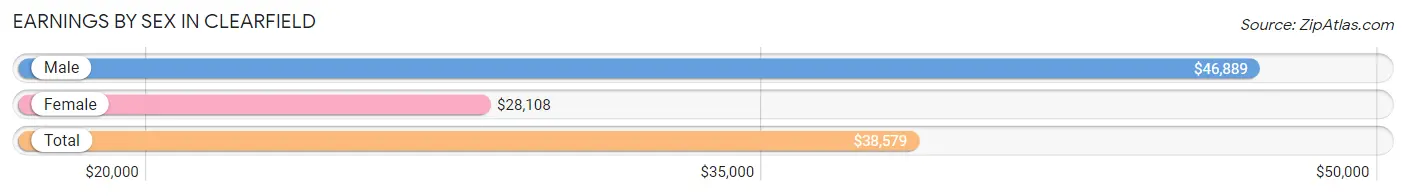
Earnings by Sex in Clearfield
Average Earnings in Clearfield are $38,579, $46,889 for men and $28,108 for women, a difference of 40.1%.
| Sex | Number | Average Earnings |
| Male | 9,820 (56.3%) | $46,889 |
| Female | 7,611 (43.7%) | $28,108 |
| Total | 17,431 (100.0%) | $38,579 |
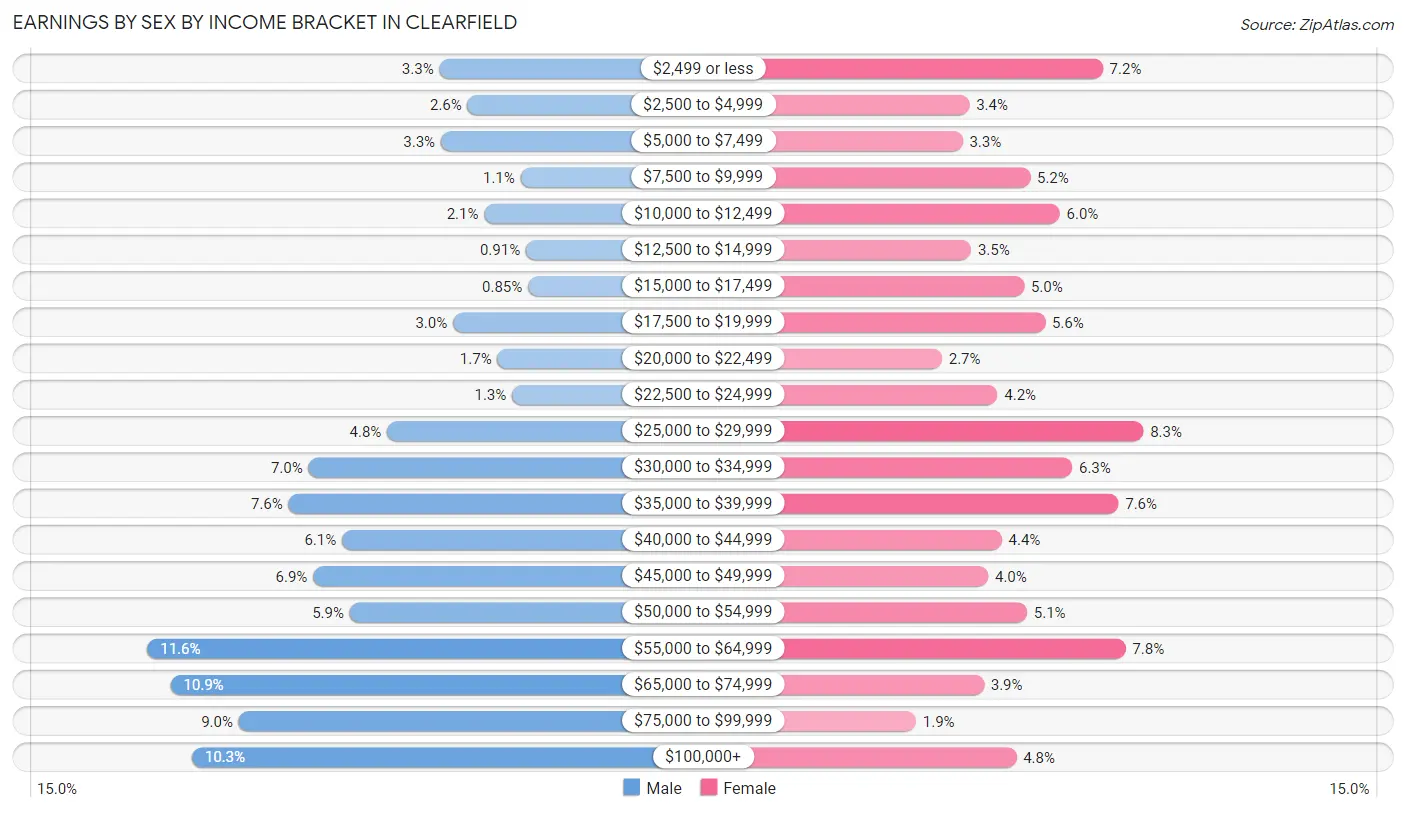
Earnings by Sex by Income Bracket in Clearfield
The most common earnings brackets in Clearfield are $55,000 to $64,999 for men (1,134 | 11.6%) and $25,000 to $29,999 for women (634 | 8.3%).
| Income | Male | Female |
| $2,499 or less | 328 (3.3%) | 547 (7.2%) |
| $2,500 to $4,999 | 250 (2.5%) | 262 (3.4%) |
| $5,000 to $7,499 | 324 (3.3%) | 247 (3.3%) |
| $7,500 to $9,999 | 104 (1.1%) | 392 (5.1%) |
| $10,000 to $12,499 | 204 (2.1%) | 455 (6.0%) |
| $12,500 to $14,999 | 89 (0.9%) | 266 (3.5%) |
| $15,000 to $17,499 | 83 (0.9%) | 379 (5.0%) |
| $17,500 to $19,999 | 291 (3.0%) | 424 (5.6%) |
| $20,000 to $22,499 | 168 (1.7%) | 203 (2.7%) |
| $22,500 to $24,999 | 128 (1.3%) | 322 (4.2%) |
| $25,000 to $29,999 | 472 (4.8%) | 634 (8.3%) |
| $30,000 to $34,999 | 689 (7.0%) | 482 (6.3%) |
| $35,000 to $39,999 | 744 (7.6%) | 581 (7.6%) |
| $40,000 to $44,999 | 597 (6.1%) | 331 (4.3%) |
| $45,000 to $49,999 | 677 (6.9%) | 302 (4.0%) |
| $50,000 to $54,999 | 575 (5.9%) | 385 (5.1%) |
| $55,000 to $64,999 | 1,134 (11.6%) | 596 (7.8%) |
| $65,000 to $74,999 | 1,070 (10.9%) | 293 (3.8%) |
| $75,000 to $99,999 | 882 (9.0%) | 148 (1.9%) |
| $100,000+ | 1,011 (10.3%) | 362 (4.8%) |
| Total | 9,820 (100.0%) | 7,611 (100.0%) |
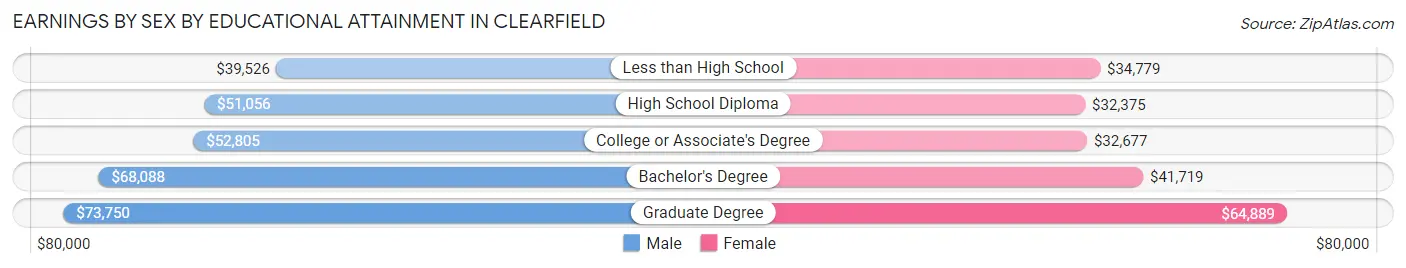
Earnings by Sex by Educational Attainment in Clearfield
Average earnings in Clearfield are $54,873 for men and $34,287 for women, a difference of 37.5%. Men with an educational attainment of graduate degree enjoy the highest average annual earnings of $73,750, while those with less than high school education earn the least with $39,526. Women with an educational attainment of graduate degree earn the most with the average annual earnings of $64,889, while those with high school diploma education have the smallest earnings of $32,375.
| Educational Attainment | Male Income | Female Income |
| Less than High School | $39,526 | $34,779 |
| High School Diploma | $51,056 | $32,375 |
| College or Associate's Degree | $52,805 | $32,677 |
| Bachelor's Degree | $68,088 | $41,719 |
| Graduate Degree | $73,750 | $64,889 |
| Total | $54,873 | $34,287 |
Family Income in Clearfield
Family Income Brackets in Clearfield
According to the Clearfield family income data, there are 1,598 families falling into the $50,000 to $74,999 income range, which is the most common income bracket and makes up 21.3% of all families. Conversely, the $10,000 to $14,999 income bracket is the least frequent group with only 30 families (0.4%) belonging to this category.
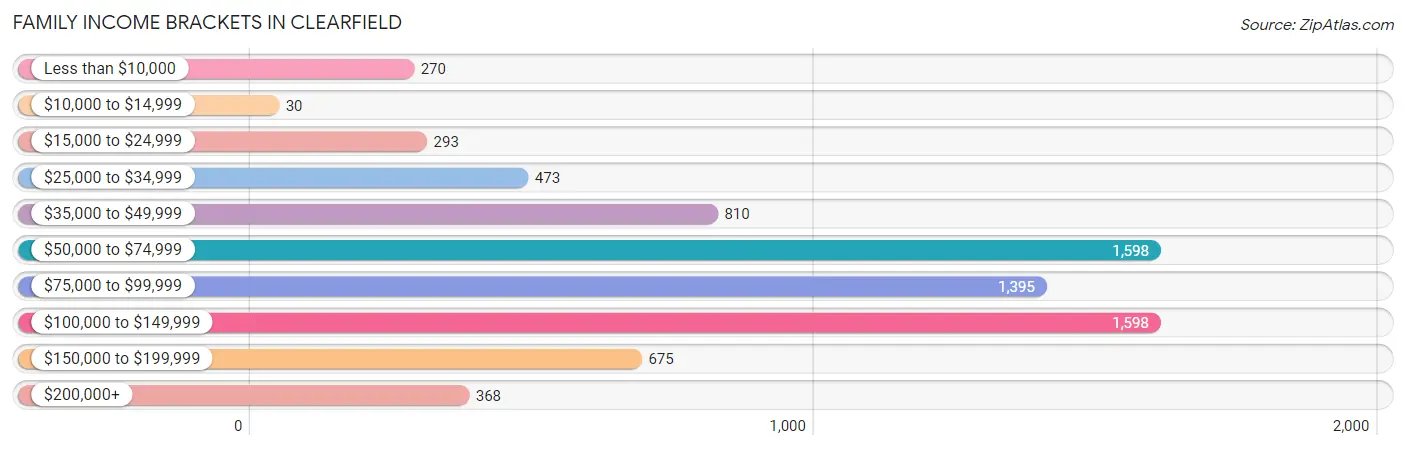
| Income Bracket | # Families | % Families |
| Less than $10,000 | 270 | 3.6% |
| $10,000 to $14,999 | 30 | 0.4% |
| $15,000 to $24,999 | 293 | 3.9% |
| $25,000 to $34,999 | 473 | 6.3% |
| $35,000 to $49,999 | 810 | 10.8% |
| $50,000 to $74,999 | 1,598 | 21.3% |
| $75,000 to $99,999 | 1,395 | 18.6% |
| $100,000 to $149,999 | 1,598 | 21.3% |
| $150,000 to $199,999 | 675 | 9.0% |
| $200,000+ | 368 | 4.9% |
Family Income by Famaliy Size in Clearfield
6-person families (476 | 6.4%) account for the highest median family income in Clearfield with $109,219 per family, while 2-person families (2,143 | 28.6%) have the highest median income of $36,854 per family member.
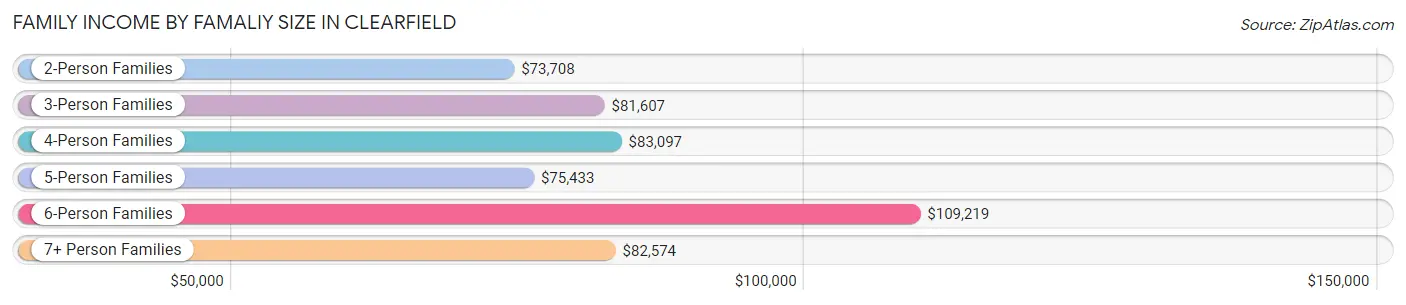
| Income Bracket | # Families | Median Income |
| 2-Person Families | 2,143 (28.6%) | $73,708 |
| 3-Person Families | 2,224 (29.6%) | $81,607 |
| 4-Person Families | 1,492 (19.9%) | $83,097 |
| 5-Person Families | 981 (13.1%) | $75,433 |
| 6-Person Families | 476 (6.4%) | $109,219 |
| 7+ Person Families | 185 (2.5%) | $82,574 |
| Total | 7,501 (100.0%) | $81,162 |
Family Income by Number of Earners in Clearfield
The median family income in Clearfield is $81,162, with families comprising 3+ earners (1,281) having the highest median family income of $122,066, while families with 1 earner (2,569) have the lowest median family income of $54,927, accounting for 17.1% and 34.3% of families, respectively.
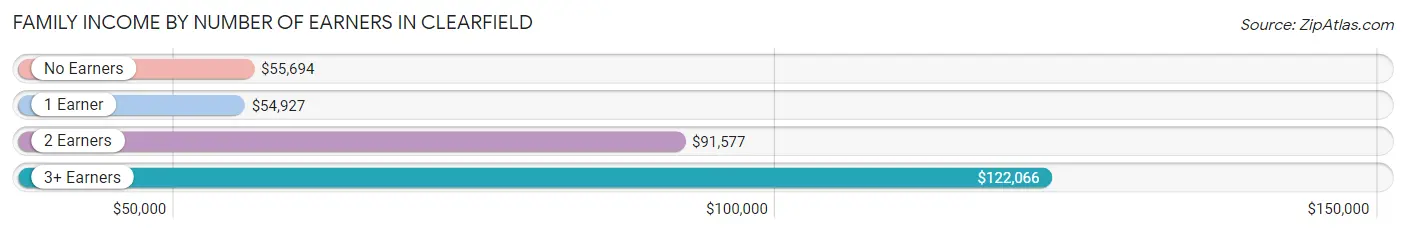
| Number of Earners | # Families | Median Income |
| No Earners | 435 (5.8%) | $55,694 |
| 1 Earner | 2,569 (34.3%) | $54,927 |
| 2 Earners | 3,216 (42.9%) | $91,577 |
| 3+ Earners | 1,281 (17.1%) | $122,066 |
| Total | 7,501 (100.0%) | $81,162 |
Household Income in Clearfield
Household Income Brackets in Clearfield
With 2,508 households falling in the category, the $50,000 to $74,999 income range is the most frequent in Clearfield, accounting for 23.5% of all households. In contrast, only 299 households (2.8%) fall into the $10,000 to $14,999 income bracket, making it the least populous group.
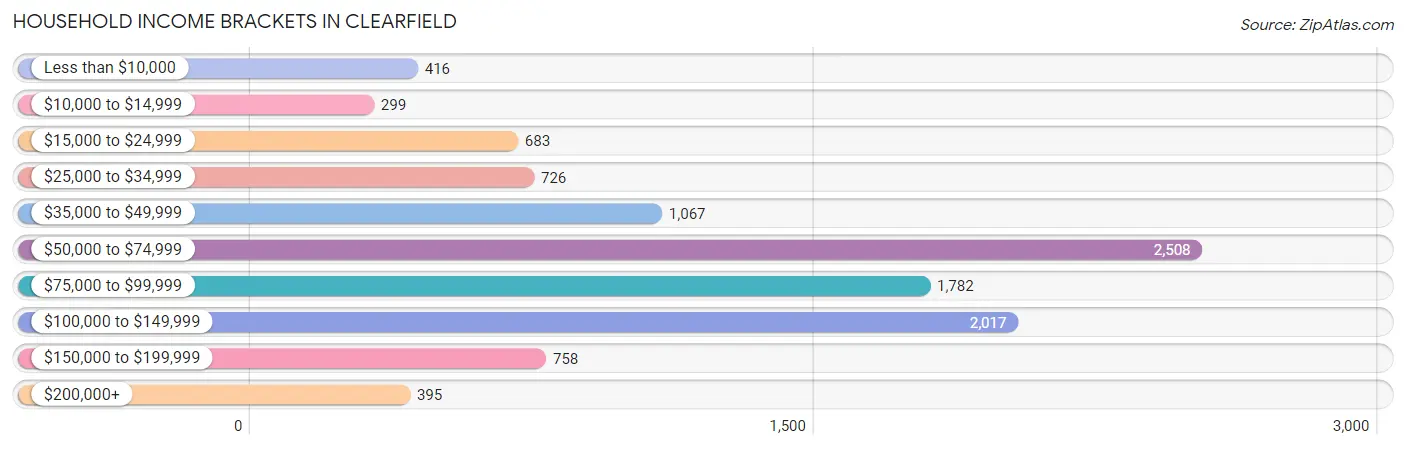
| Income Bracket | # Households | % Households |
| Less than $10,000 | 416 | 3.9% |
| $10,000 to $14,999 | 299 | 2.8% |
| $15,000 to $24,999 | 683 | 6.4% |
| $25,000 to $34,999 | 726 | 6.8% |
| $35,000 to $49,999 | 1,067 | 10.0% |
| $50,000 to $74,999 | 2,508 | 23.5% |
| $75,000 to $99,999 | 1,782 | 16.7% |
| $100,000 to $149,999 | 2,017 | 18.9% |
| $150,000 to $199,999 | 758 | 7.1% |
| $200,000+ | 395 | 3.7% |
Household Income by Householder Age in Clearfield
The median household income in Clearfield is $69,889, with the highest median household income of $78,102 found in the 45 to 64 years age bracket for the primary householder. A total of 3,393 households (31.8%) fall into this category. Meanwhile, the 65+ years age bracket for the primary householder has the lowest median household income of $58,362, with 1,400 households (13.1%) in this group.
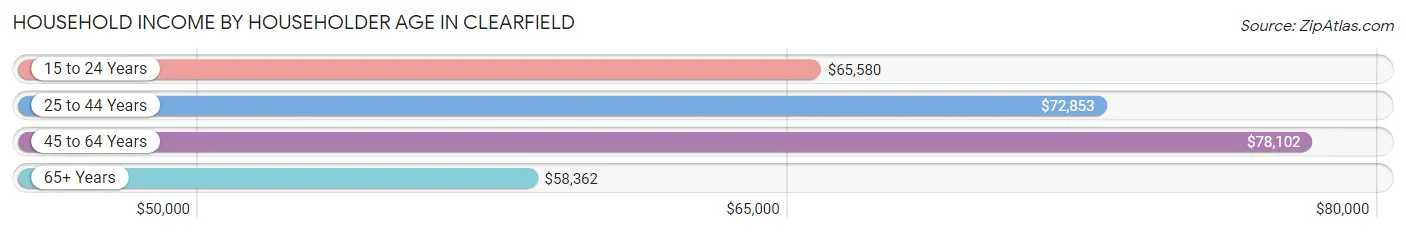
| Income Bracket | # Households | Median Income |
| 15 to 24 Years | 988 (9.3%) | $65,580 |
| 25 to 44 Years | 4,891 (45.8%) | $72,853 |
| 45 to 64 Years | 3,393 (31.8%) | $78,102 |
| 65+ Years | 1,400 (13.1%) | $58,362 |
| Total | 10,672 (100.0%) | $69,889 |
Poverty in Clearfield
Income Below Poverty by Sex and Age in Clearfield
With 11.3% poverty level for males and 14.3% for females among the residents of Clearfield, under 5 year old males and 15 year old females are the most vulnerable to poverty, with 482 males (27.3%) and 66 females (27.7%) in their respective age groups living below the poverty level.
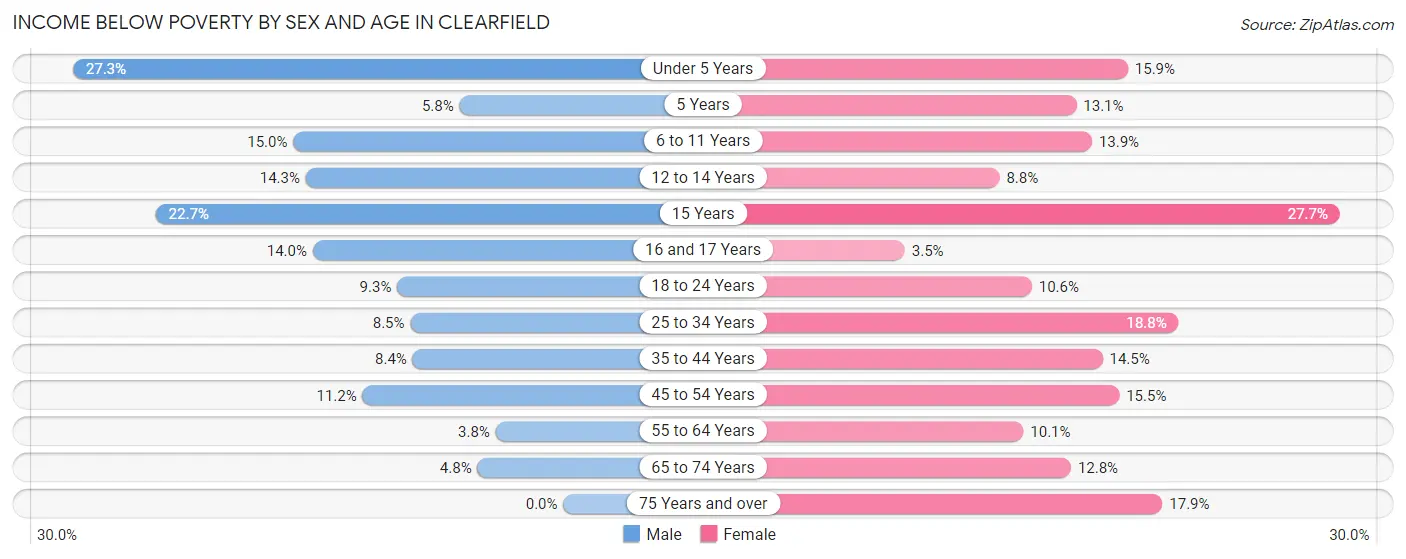
| Age Bracket | Male | Female |
| Under 5 Years | 482 (27.3%) | 256 (15.9%) |
| 5 Years | 13 (5.8%) | 38 (13.1%) |
| 6 to 11 Years | 214 (15.0%) | 200 (13.9%) |
| 12 to 14 Years | 82 (14.3%) | 59 (8.8%) |
| 15 Years | 69 (22.7%) | 66 (27.7%) |
| 16 and 17 Years | 48 (14.0%) | 11 (3.5%) |
| 18 to 24 Years | 184 (9.2%) | 225 (10.6%) |
| 25 to 34 Years | 275 (8.5%) | 496 (18.8%) |
| 35 to 44 Years | 206 (8.4%) | 335 (14.5%) |
| 45 to 54 Years | 202 (11.2%) | 228 (15.4%) |
| 55 to 64 Years | 50 (3.8%) | 130 (10.1%) |
| 65 to 74 Years | 34 (4.8%) | 79 (12.8%) |
| 75 Years and over | 0 (0.0%) | 88 (17.8%) |
| Total | 1,859 (11.3%) | 2,211 (14.3%) |
Income Above Poverty by Sex and Age in Clearfield
According to the poverty statistics in Clearfield, males aged 75 years and over and females aged 16 and 17 years are the age groups that are most secure financially, with 100.0% of males and 96.5% of females in these age groups living above the poverty line.
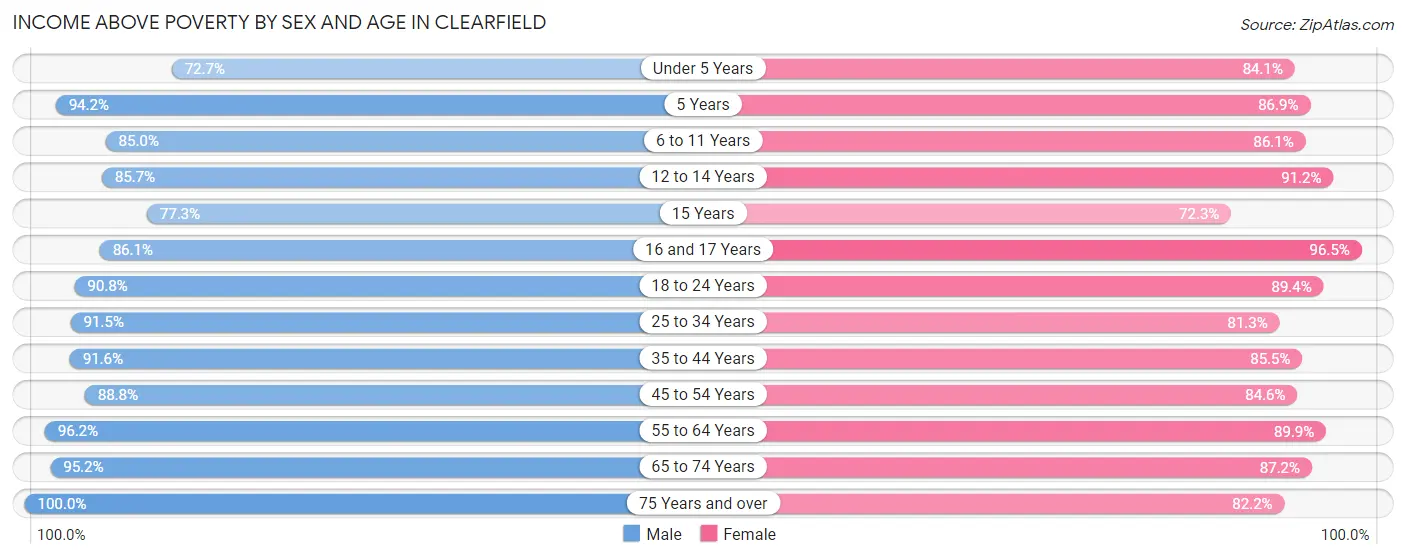
| Age Bracket | Male | Female |
| Under 5 Years | 1,283 (72.7%) | 1,351 (84.1%) |
| 5 Years | 212 (94.2%) | 253 (86.9%) |
| 6 to 11 Years | 1,209 (85.0%) | 1,236 (86.1%) |
| 12 to 14 Years | 490 (85.7%) | 613 (91.2%) |
| 15 Years | 235 (77.3%) | 172 (72.3%) |
| 16 and 17 Years | 296 (86.1%) | 302 (96.5%) |
| 18 to 24 Years | 1,806 (90.7%) | 1,901 (89.4%) |
| 25 to 34 Years | 2,952 (91.5%) | 2,149 (81.2%) |
| 35 to 44 Years | 2,249 (91.6%) | 1,972 (85.5%) |
| 45 to 54 Years | 1,604 (88.8%) | 1,248 (84.6%) |
| 55 to 64 Years | 1,276 (96.2%) | 1,156 (89.9%) |
| 65 to 74 Years | 678 (95.2%) | 540 (87.2%) |
| 75 Years and over | 318 (100.0%) | 405 (82.2%) |
| Total | 14,608 (88.7%) | 13,298 (85.7%) |
Income Below Poverty Among Married-Couple Families in Clearfield
The poverty statistics for married-couple families in Clearfield show that 6.9% or 373 of the total 5,387 families live below the poverty line. Families with 5 or more children have the highest poverty rate of 31.9%, comprising of 29 families. On the other hand, families with no children have the lowest poverty rate of 0.4%, which includes 8 families.
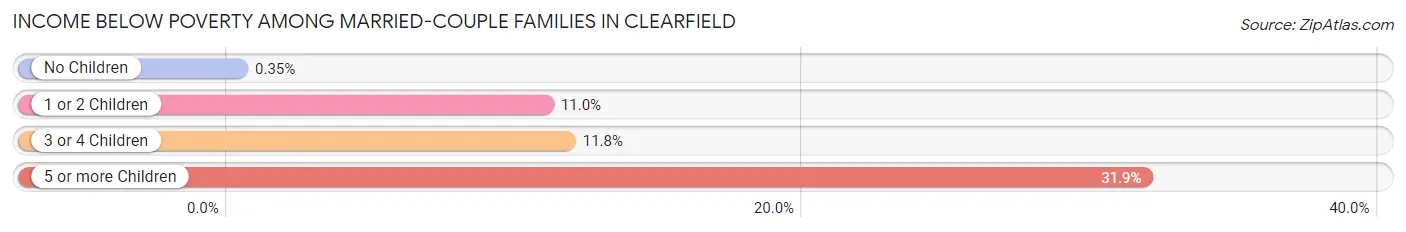
| Children | Above Poverty | Below Poverty |
| No Children | 2,287 (99.7%) | 8 (0.4%) |
| 1 or 2 Children | 1,982 (89.0%) | 245 (11.0%) |
| 3 or 4 Children | 683 (88.2%) | 91 (11.8%) |
| 5 or more Children | 62 (68.1%) | 29 (31.9%) |
| Total | 5,014 (93.1%) | 373 (6.9%) |
Income Below Poverty Among Single-Parent Households in Clearfield
According to the poverty data in Clearfield, 11.7% or 94 single-father households and 25.3% or 331 single-mother households are living below the poverty line. Among single-father households, those with 1 or 2 children have the highest poverty rate, with 94 households (17.6%) experiencing poverty. Likewise, among single-mother households, those with 5 or more children have the highest poverty rate, with 11 households (100.0%) falling below the poverty line.
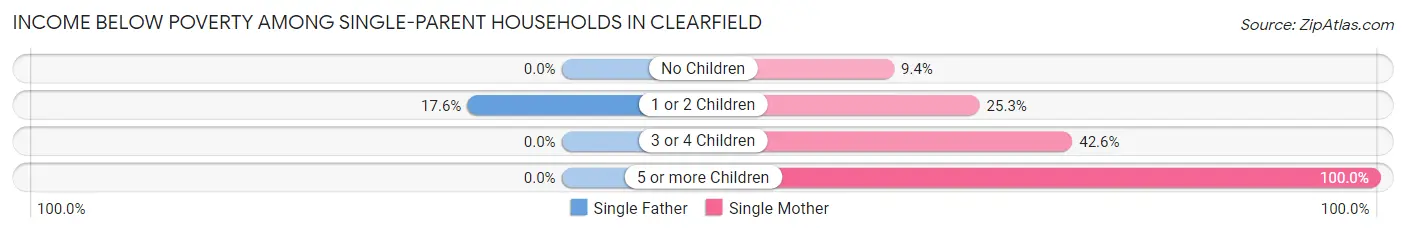
| Children | Single Father | Single Mother |
| No Children | 0 (0.0%) | 33 (9.4%) |
| 1 or 2 Children | 94 (17.6%) | 172 (25.3%) |
| 3 or 4 Children | 0 (0.0%) | 115 (42.6%) |
| 5 or more Children | 0 (0.0%) | 11 (100.0%) |
| Total | 94 (11.7%) | 331 (25.3%) |
Income Below Poverty Among Married-Couple vs Single-Parent Households in Clearfield
The poverty data for Clearfield shows that 373 of the married-couple family households (6.9%) and 425 of the single-parent households (20.1%) are living below the poverty level. Within the married-couple family households, those with 5 or more children have the highest poverty rate, with 29 households (31.9%) falling below the poverty line. Among the single-parent households, those with 5 or more children have the highest poverty rate, with 11 household (100.0%) living below poverty.
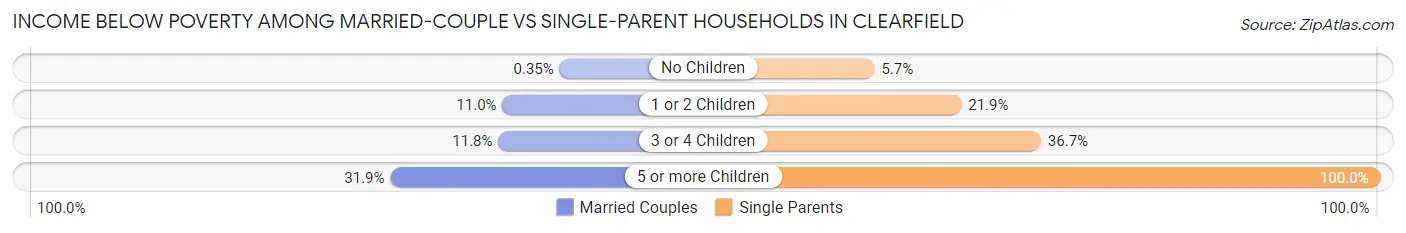
| Children | Married-Couple Families | Single-Parent Households |
| No Children | 8 (0.4%) | 33 (5.7%) |
| 1 or 2 Children | 245 (11.0%) | 266 (21.9%) |
| 3 or 4 Children | 91 (11.8%) | 115 (36.7%) |
| 5 or more Children | 29 (31.9%) | 11 (100.0%) |
| Total | 373 (6.9%) | 425 (20.1%) |
Race in Clearfield
The most populous races in Clearfield are White / Caucasian (25,378 | 78.4%), Hispanic or Latino (5,772 | 17.8%), and Two or more Races (2,748 | 8.5%).
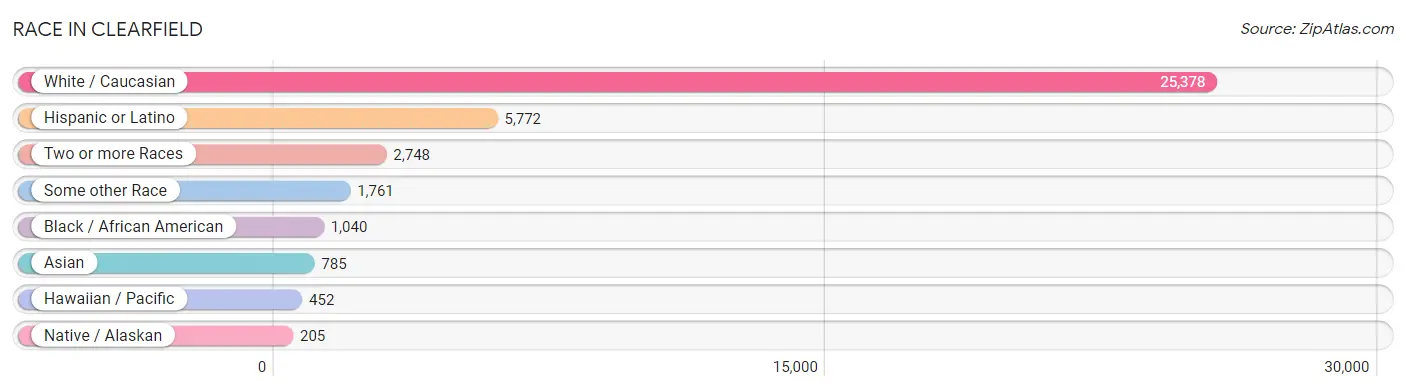
| Race | # Population | % Population |
| Asian | 785 | 2.4% |
| Black / African American | 1,040 | 3.2% |
| Hawaiian / Pacific | 452 | 1.4% |
| Hispanic or Latino | 5,772 | 17.8% |
| Native / Alaskan | 205 | 0.6% |
| White / Caucasian | 25,378 | 78.4% |
| Two or more Races | 2,748 | 8.5% |
| Some other Race | 1,761 | 5.4% |
| Total | 32,369 | 100.0% |
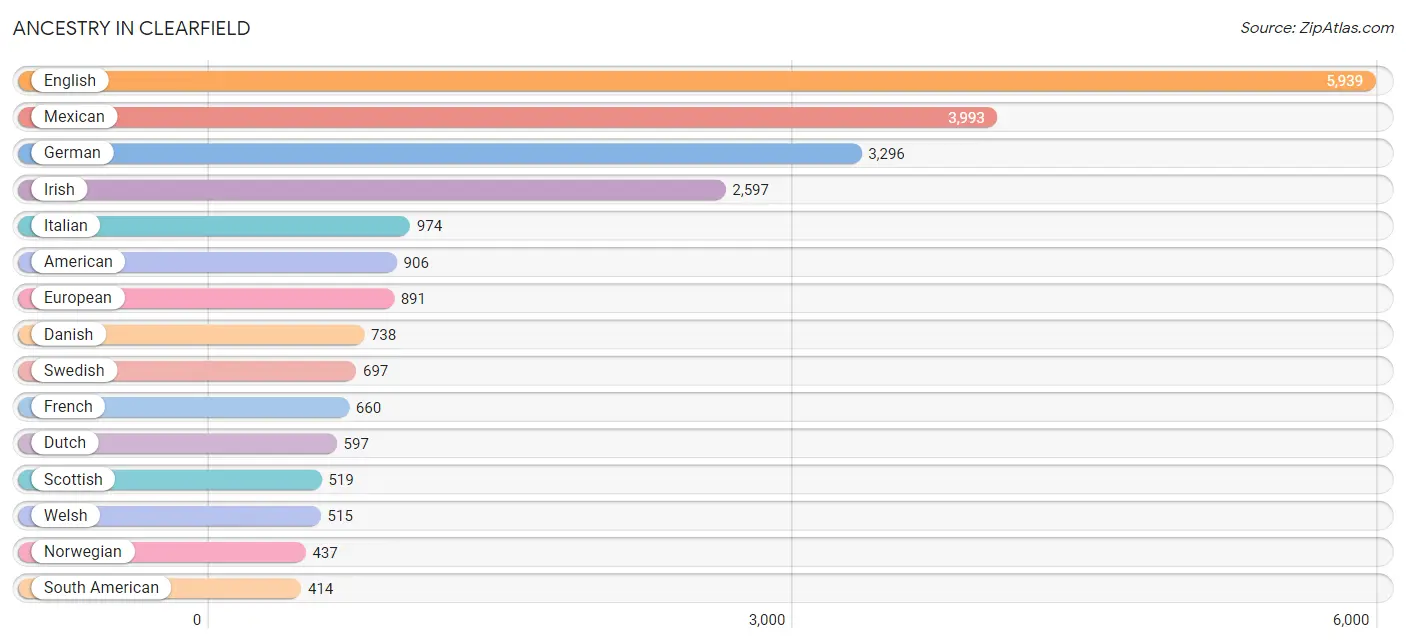
Ancestry in Clearfield
The most populous ancestries reported in Clearfield are English (5,939 | 18.3%), Mexican (3,993 | 12.3%), German (3,296 | 10.2%), Irish (2,597 | 8.0%), and Italian (974 | 3.0%), together accounting for 51.9% of all Clearfield residents.
| Ancestry | # Population | % Population |
| African | 46 | 0.1% |
| American | 906 | 2.8% |
| Armenian | 9 | 0.0% |
| Austrian | 23 | 0.1% |
| Bhutanese | 146 | 0.4% |
| Blackfeet | 28 | 0.1% |
| Brazilian | 23 | 0.1% |
| British | 355 | 1.1% |
| Burmese | 90 | 0.3% |
| Central American | 184 | 0.6% |
| Cherokee | 33 | 0.1% |
| Chilean | 73 | 0.2% |
| Choctaw | 55 | 0.2% |
| Colombian | 43 | 0.1% |
| Creek | 18 | 0.1% |
| Croatian | 341 | 1.1% |
| Czech | 67 | 0.2% |
| Czechoslovakian | 19 | 0.1% |
| Danish | 738 | 2.3% |
| Dominican | 145 | 0.4% |
| Dutch | 597 | 1.8% |
| Eastern European | 41 | 0.1% |
| Ecuadorian | 17 | 0.1% |
| English | 5,939 | 18.3% |
| European | 891 | 2.8% |
| French | 660 | 2.0% |
| French American Indian | 35 | 0.1% |
| German | 3,296 | 10.2% |
| Greek | 64 | 0.2% |
| Guamanian / Chamorro | 36 | 0.1% |
| Guyanese | 24 | 0.1% |
| Hungarian | 22 | 0.1% |
| Icelander | 19 | 0.1% |
| Indian (Asian) | 112 | 0.4% |
| Irish | 2,597 | 8.0% |
| Iroquois | 8 | 0.0% |
| Israeli | 17 | 0.1% |
| Italian | 974 | 3.0% |
| Jamaican | 37 | 0.1% |
| Korean | 410 | 1.3% |
| Lithuanian | 4 | 0.0% |
| Mexican | 3,993 | 12.3% |
| Mexican American Indian | 61 | 0.2% |
| Native Hawaiian | 246 | 0.8% |
| Navajo | 145 | 0.4% |
| Nicaraguan | 8 | 0.0% |
| Nigerian | 19 | 0.1% |
| Northern European | 91 | 0.3% |
| Norwegian | 437 | 1.3% |
| Pakistani | 188 | 0.6% |
| Peruvian | 237 | 0.7% |
| Polish | 302 | 0.9% |
| Portuguese | 43 | 0.1% |
| Puerto Rican | 187 | 0.6% |
| Romanian | 27 | 0.1% |
| Russian | 39 | 0.1% |
| Salvadoran | 176 | 0.5% |
| Samoan | 201 | 0.6% |
| Scandinavian | 198 | 0.6% |
| Scotch-Irish | 335 | 1.0% |
| Scottish | 519 | 1.6% |
| Serbian | 4 | 0.0% |
| Shoshone | 3 | 0.0% |
| South American | 414 | 1.3% |
| Spaniard | 379 | 1.2% |
| Spanish | 243 | 0.7% |
| Sri Lankan | 333 | 1.0% |
| Subsaharan African | 77 | 0.2% |
| Swedish | 697 | 2.1% |
| Swiss | 104 | 0.3% |
| Thai | 8 | 0.0% |
| Tongan | 212 | 0.6% |
| Trinidadian and Tobagonian | 24 | 0.1% |
| Ukrainian | 65 | 0.2% |
| Ute | 13 | 0.0% |
| Venezuelan | 44 | 0.1% |
| Welsh | 515 | 1.6% | View All 77 Rows |
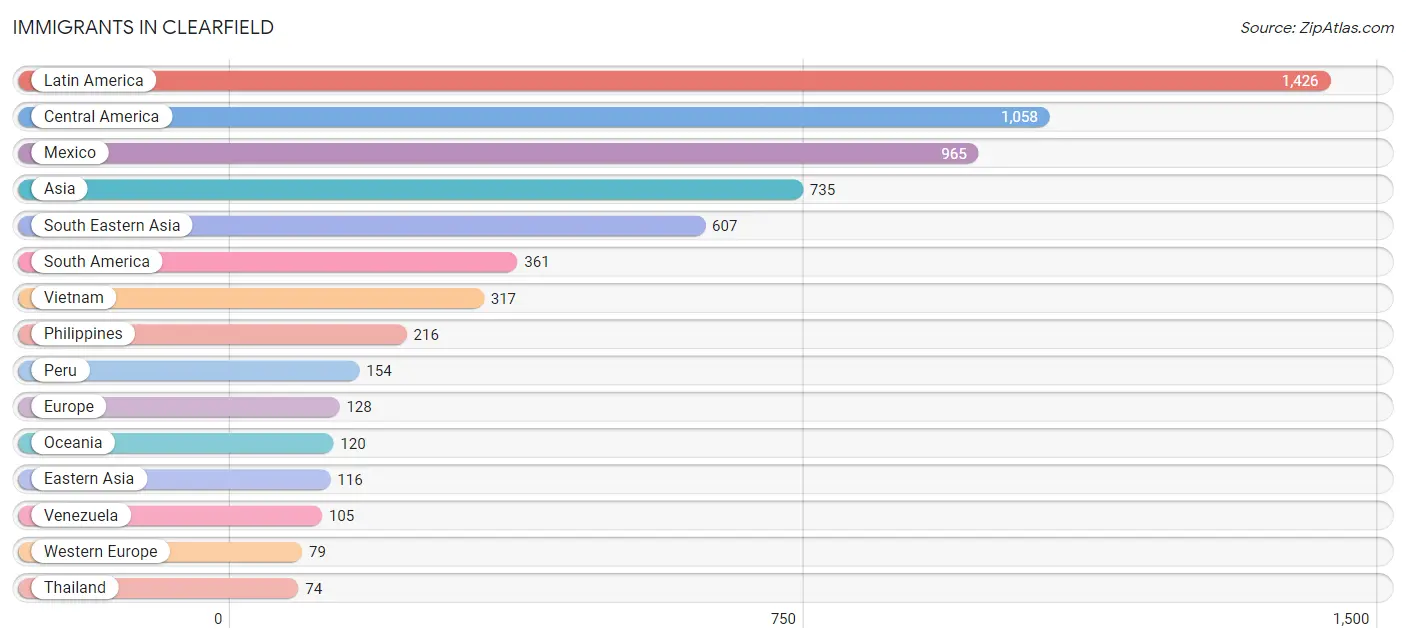
Immigrants in Clearfield
The most numerous immigrant groups reported in Clearfield came from Latin America (1,426 | 4.4%), Central America (1,058 | 3.3%), Mexico (965 | 3.0%), Asia (735 | 2.3%), and South Eastern Asia (607 | 1.9%), together accounting for 14.8% of all Clearfield residents.
| Immigration Origin | # Population | % Population |
| Asia | 735 | 2.3% |
| Bolivia | 10 | 0.0% |
| Brazil | 35 | 0.1% |
| Canada | 43 | 0.1% |
| Caribbean | 7 | 0.0% |
| Central America | 1,058 | 3.3% |
| Chile | 14 | 0.0% |
| China | 12 | 0.0% |
| Colombia | 43 | 0.1% |
| Dominican Republic | 7 | 0.0% |
| Eastern Asia | 116 | 0.4% |
| Eastern Europe | 34 | 0.1% |
| El Salvador | 25 | 0.1% |
| Europe | 128 | 0.4% |
| France | 12 | 0.0% |
| Germany | 67 | 0.2% |
| Honduras | 23 | 0.1% |
| Italy | 4 | 0.0% |
| Japan | 38 | 0.1% |
| Kazakhstan | 3 | 0.0% |
| Korea | 66 | 0.2% |
| Latin America | 1,426 | 4.4% |
| Mexico | 965 | 3.0% |
| Nicaragua | 8 | 0.0% |
| Northern Europe | 11 | 0.0% |
| Oceania | 120 | 0.4% |
| Panama | 37 | 0.1% |
| Peru | 154 | 0.5% |
| Philippines | 216 | 0.7% |
| Scotland | 11 | 0.0% |
| South America | 361 | 1.1% |
| South Central Asia | 12 | 0.0% |
| South Eastern Asia | 607 | 1.9% |
| Southern Europe | 4 | 0.0% |
| Taiwan | 12 | 0.0% |
| Thailand | 74 | 0.2% |
| Ukraine | 34 | 0.1% |
| Uzbekistan | 9 | 0.0% |
| Venezuela | 105 | 0.3% |
| Vietnam | 317 | 1.0% |
| Western Europe | 79 | 0.2% | View All 41 Rows |
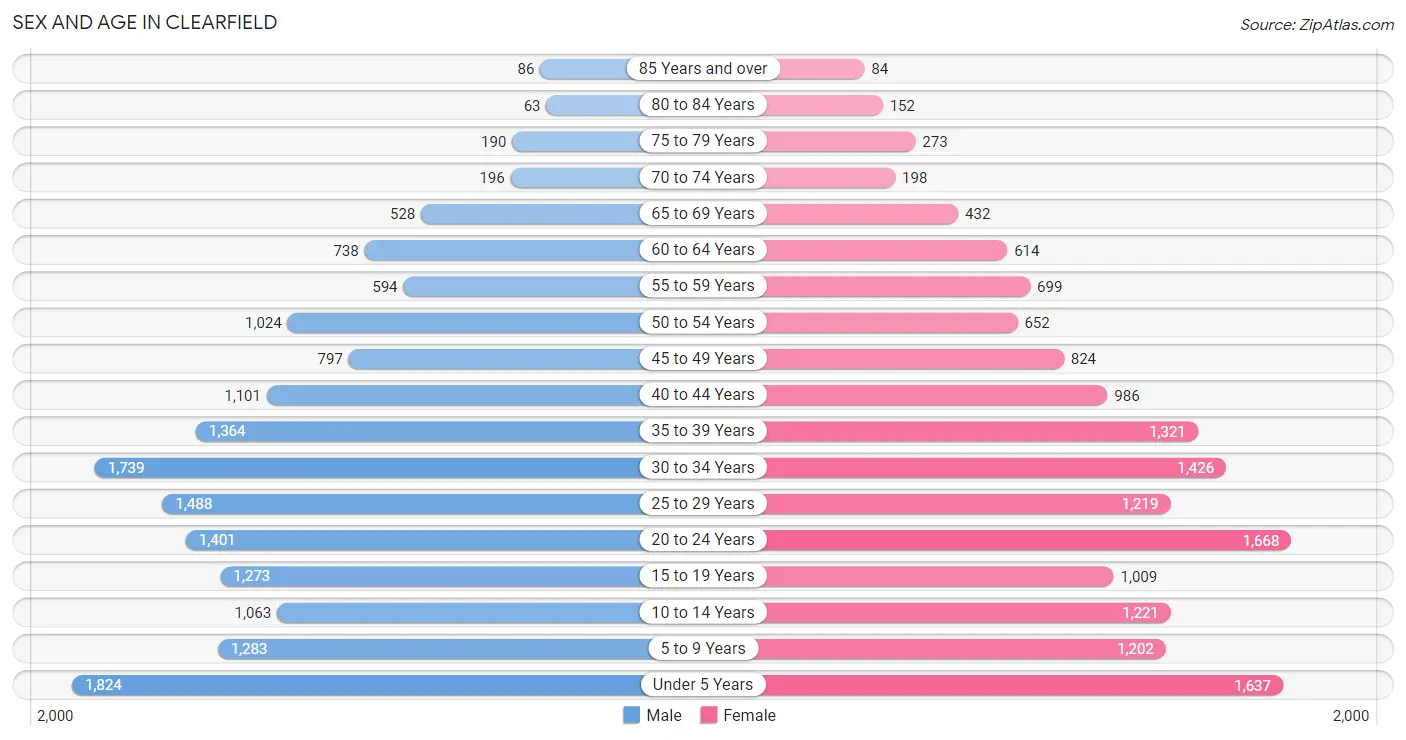
Sex and Age in Clearfield
Sex and Age in Clearfield
The most populous age groups in Clearfield are Under 5 Years (1,824 | 10.9%) for men and 20 to 24 Years (1,668 | 10.7%) for women.
| Age Bracket | Male | Female |
| Under 5 Years | 1,824 (10.9%) | 1,637 (10.5%) |
| 5 to 9 Years | 1,283 (7.7%) | 1,202 (7.7%) |
| 10 to 14 Years | 1,063 (6.4%) | 1,221 (7.8%) |
| 15 to 19 Years | 1,273 (7.6%) | 1,009 (6.5%) |
| 20 to 24 Years | 1,401 (8.4%) | 1,668 (10.7%) |
| 25 to 29 Years | 1,488 (8.9%) | 1,219 (7.8%) |
| 30 to 34 Years | 1,739 (10.4%) | 1,426 (9.1%) |
| 35 to 39 Years | 1,364 (8.1%) | 1,321 (8.5%) |
| 40 to 44 Years | 1,101 (6.6%) | 986 (6.3%) |
| 45 to 49 Years | 797 (4.8%) | 824 (5.3%) |
| 50 to 54 Years | 1,024 (6.1%) | 652 (4.2%) |
| 55 to 59 Years | 594 (3.5%) | 699 (4.5%) |
| 60 to 64 Years | 738 (4.4%) | 614 (3.9%) |
| 65 to 69 Years | 528 (3.2%) | 432 (2.8%) |
| 70 to 74 Years | 196 (1.2%) | 198 (1.3%) |
| 75 to 79 Years | 190 (1.1%) | 273 (1.8%) |
| 80 to 84 Years | 63 (0.4%) | 152 (1.0%) |
| 85 Years and over | 86 (0.5%) | 84 (0.5%) |
| Total | 16,752 (100.0%) | 15,617 (100.0%) |
Families and Households in Clearfield
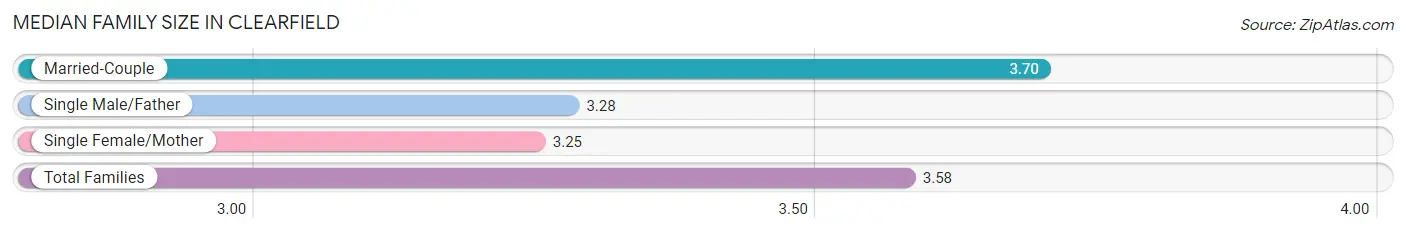
Median Family Size in Clearfield
The median family size in Clearfield is 3.58 persons per family, with married-couple families (5,387 | 71.8%) accounting for the largest median family size of 3.7 persons per family. On the other hand, single female/mother families (1,311 | 17.5%) represent the smallest median family size with 3.25 persons per family.
| Family Type | # Families | Family Size |
| Married-Couple | 5,387 (71.8%) | 3.70 |
| Single Male/Father | 803 (10.7%) | 3.28 |
| Single Female/Mother | 1,311 (17.5%) | 3.25 |
| Total Families | 7,501 (100.0%) | 3.58 |
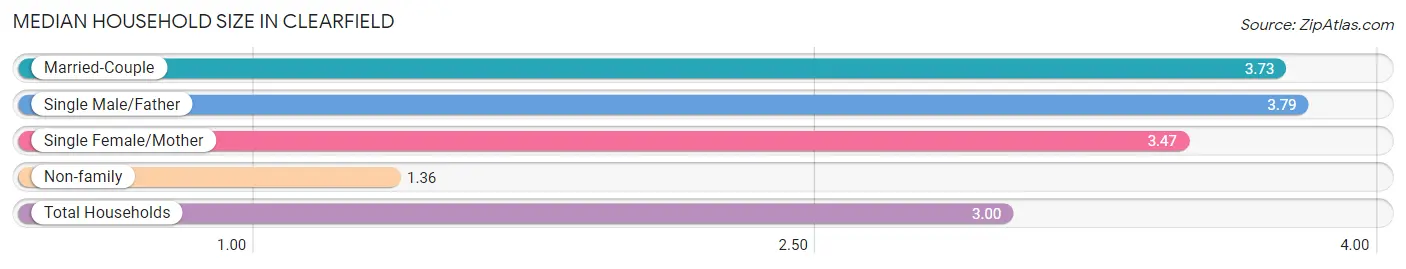
Median Household Size in Clearfield
The median household size in Clearfield is 3.00 persons per household, with single male/father households (803 | 7.5%) accounting for the largest median household size of 3.79 persons per household. non-family households (3,171 | 29.7%) represent the smallest median household size with 1.36 persons per household.
| Household Type | # Households | Household Size |
| Married-Couple | 5,387 (50.5%) | 3.73 |
| Single Male/Father | 803 (7.5%) | 3.79 |
| Single Female/Mother | 1,311 (12.3%) | 3.47 |
| Non-family | 3,171 (29.7%) | 1.36 |
| Total Households | 10,672 (100.0%) | 3.00 |
Household Size by Marriage Status in Clearfield
Out of a total of 10,672 households in Clearfield, 7,501 (70.3%) are family households, while 3,171 (29.7%) are nonfamily households. The most numerous type of family households are 3-person households, comprising 2,200, and the most common type of nonfamily households are 1-person households, comprising 2,416.
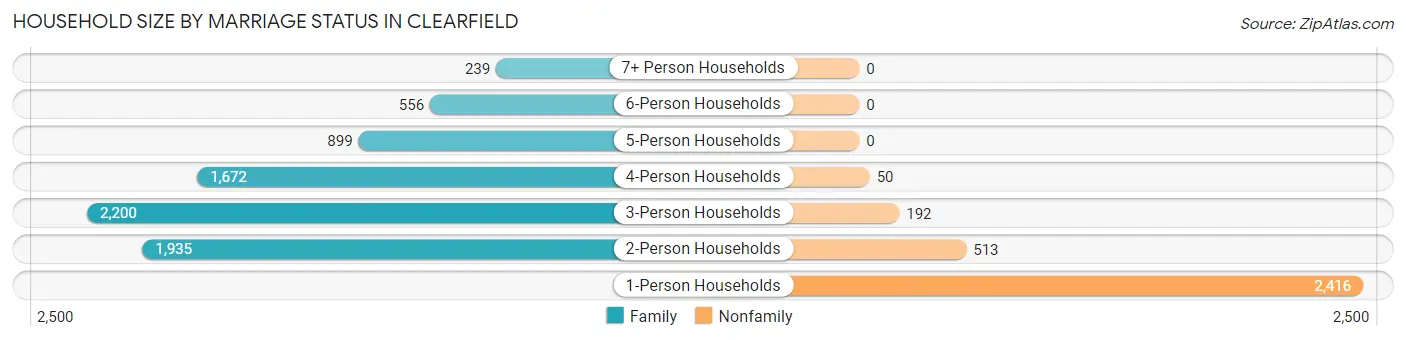
| Household Size | Family Households | Nonfamily Households |
| 1-Person Households | - | 2,416 (22.6%) |
| 2-Person Households | 1,935 (18.1%) | 513 (4.8%) |
| 3-Person Households | 2,200 (20.6%) | 192 (1.8%) |
| 4-Person Households | 1,672 (15.7%) | 50 (0.5%) |
| 5-Person Households | 899 (8.4%) | 0 (0.0%) |
| 6-Person Households | 556 (5.2%) | 0 (0.0%) |
| 7+ Person Households | 239 (2.2%) | 0 (0.0%) |
| Total | 7,501 (70.3%) | 3,171 (29.7%) |
Female Fertility in Clearfield
Fertility by Age in Clearfield
Average fertility rate in Clearfield is 92.0 births per 1,000 women. Women in the age bracket of 20 to 34 years have the highest fertility rate with 139.0 births per 1,000 women. Women in the age bracket of 20 to 34 years acount for 75.8% of all women with births.
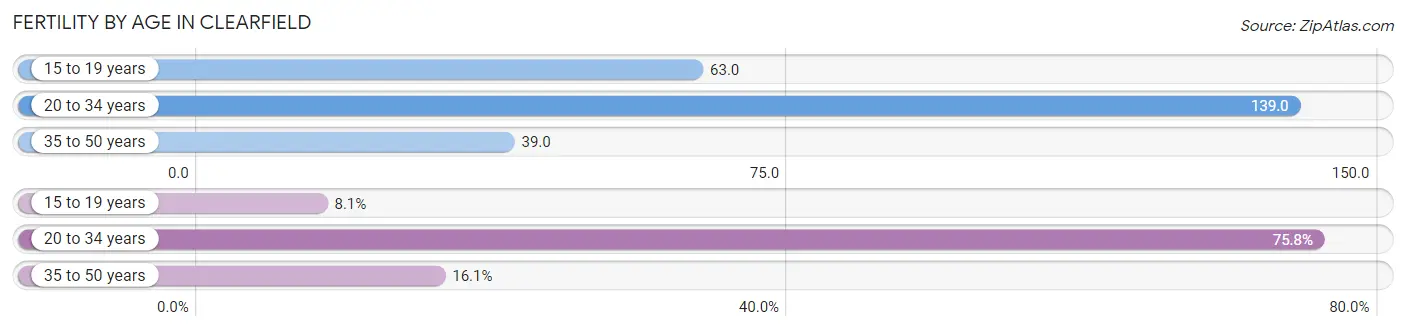
| Age Bracket | Women with Births | Births / 1,000 Women |
| 15 to 19 years | 64 (8.1%) | 63.0 |
| 20 to 34 years | 598 (75.8%) | 139.0 |
| 35 to 50 years | 127 (16.1%) | 39.0 |
| Total | 789 (100.0%) | 92.0 |
Fertility by Age by Marriage Status in Clearfield
82.6% of women with births (789) in Clearfield are married. The highest percentage of unmarried women with births falls into 15 to 19 years age bracket with 100.0% of them unmarried at the time of birth, while the lowest percentage of unmarried women with births belong to 20 to 34 years age bracket with 10.0% of them unmarried.
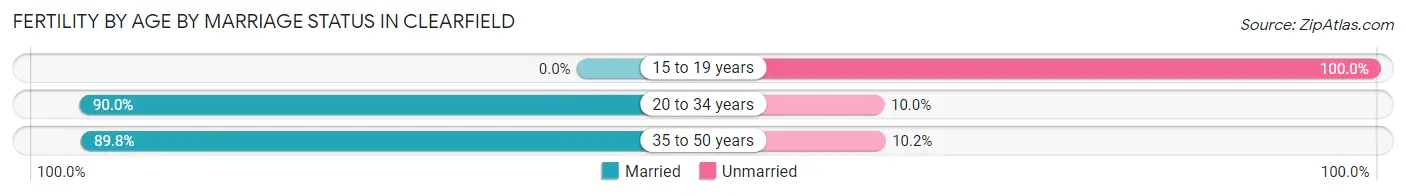
| Age Bracket | Married | Unmarried |
| 15 to 19 years | 0 (0.0%) | 64 (100.0%) |
| 20 to 34 years | 538 (90.0%) | 60 (10.0%) |
| 35 to 50 years | 114 (89.8%) | 13 (10.2%) |
| Total | 652 (82.6%) | 137 (17.4%) |
Fertility by Education in Clearfield
Average fertility rate in Clearfield is 92.0 births per 1,000 women. Women with the education attainment of graduate degree have the highest fertility rate of 144.0 births per 1,000 women, while women with the education attainment of college or associate's degree have the lowest fertility at 71.0 births per 1,000 women. Women with the education attainment of high school diploma represent 31.4% of all women with births.
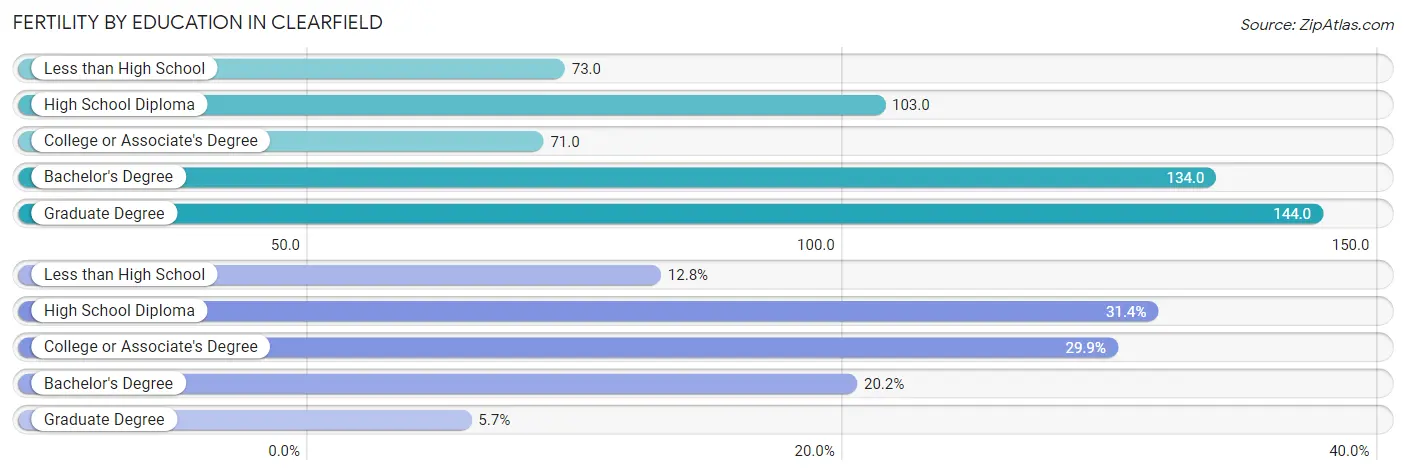
| Educational Attainment | Women with Births | Births / 1,000 Women |
| Less than High School | 101 (12.8%) | 73.0 |
| High School Diploma | 248 (31.4%) | 103.0 |
| College or Associate's Degree | 236 (29.9%) | 71.0 |
| Bachelor's Degree | 159 (20.2%) | 134.0 |
| Graduate Degree | 45 (5.7%) | 144.0 |
| Total | 789 (100.0%) | 92.0 |
Fertility by Education by Marriage Status in Clearfield
17.4% of women with births in Clearfield are unmarried. Women with the educational attainment of bachelor's degree are most likely to be married with 100.0% of them married at childbirth, while women with the educational attainment of less than high school are least likely to be married with 75.2% of them unmarried at childbirth.
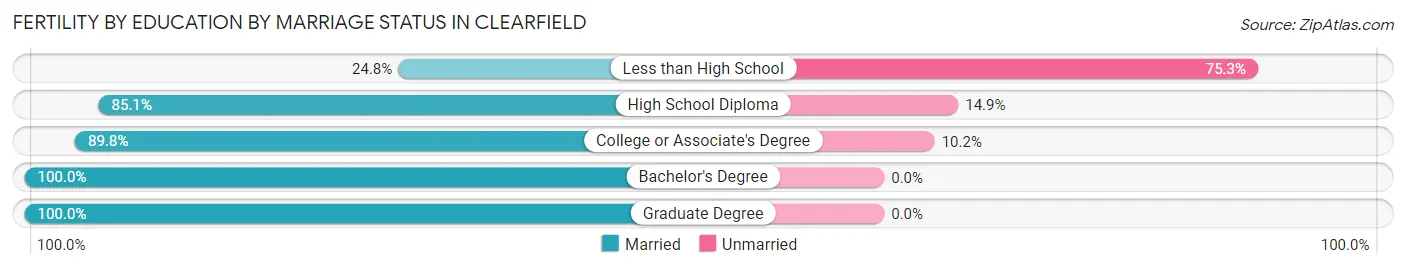
| Educational Attainment | Married | Unmarried |
| Less than High School | 25 (24.7%) | 76 (75.2%) |
| High School Diploma | 211 (85.1%) | 37 (14.9%) |
| College or Associate's Degree | 212 (89.8%) | 24 (10.2%) |
| Bachelor's Degree | 159 (100.0%) | 0 (0.0%) |
| Graduate Degree | 45 (100.0%) | 0 (0.0%) |
| Total | 652 (82.6%) | 137 (17.4%) |
Employment Characteristics in Clearfield
Employment by Class of Employer in Clearfield
Among the 15,820 employed individuals in Clearfield, private company employees (10,257 | 64.8%), federal government employees (2,277 | 14.4%), and local government employees (1,115 | 7.0%) make up the most common classes of employment.
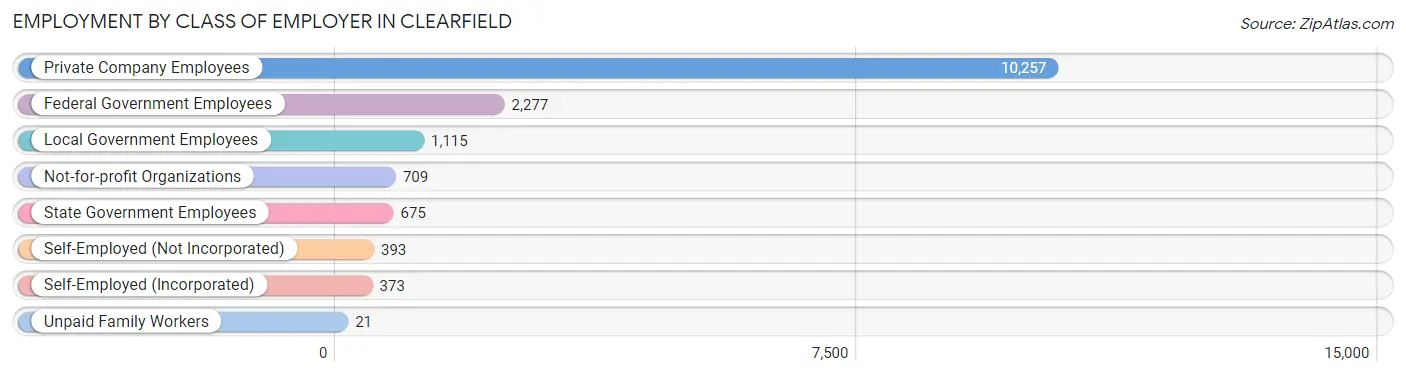
| Employer Class | # Employees | % Employees |
| Private Company Employees | 10,257 | 64.8% |
| Self-Employed (Incorporated) | 373 | 2.4% |
| Self-Employed (Not Incorporated) | 393 | 2.5% |
| Not-for-profit Organizations | 709 | 4.5% |
| Local Government Employees | 1,115 | 7.0% |
| State Government Employees | 675 | 4.3% |
| Federal Government Employees | 2,277 | 14.4% |
| Unpaid Family Workers | 21 | 0.1% |
| Total | 15,820 | 100.0% |
Employment Status by Age in Clearfield
According to the labor force statistics for Clearfield, out of the total population over 16 years of age (23,575), 69.9% or 16,479 individuals are in the labor force, with 3.0% or 494 of them unemployed. The age group with the highest labor force participation rate is 35 to 44 years, with 82.1% or 3,918 individuals in the labor force. Within the labor force, the 20 to 24 years age range has the highest percentage of unemployed individuals, with 6.8% or 167 of them being unemployed.
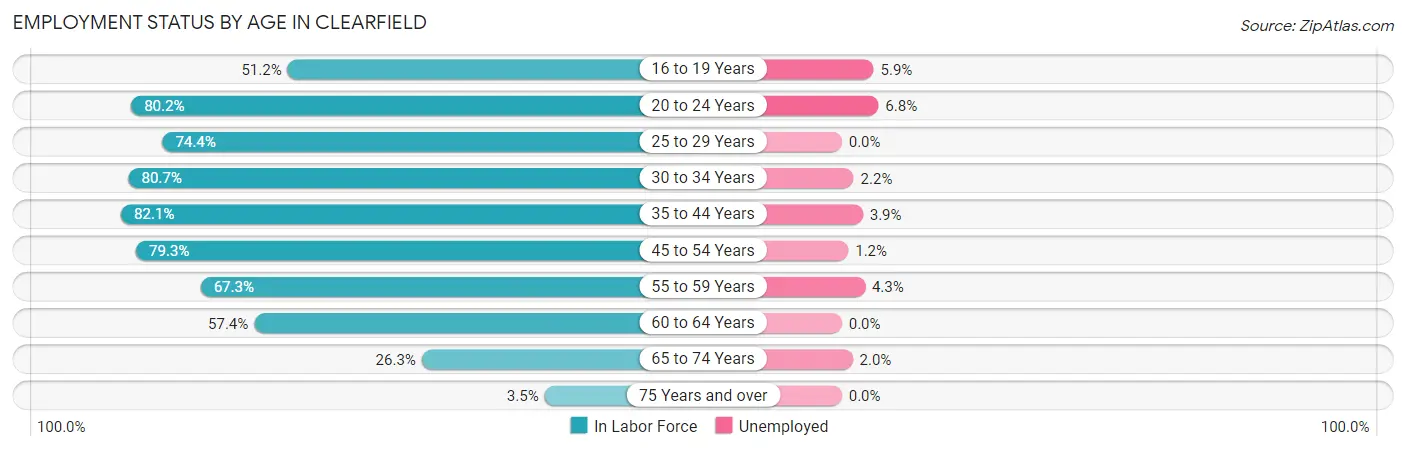
| Age Bracket | In Labor Force | Unemployed |
| 16 to 19 Years | 880 (51.2%) | 52 (5.9%) |
| 20 to 24 Years | 2,461 (80.2%) | 167 (6.8%) |
| 25 to 29 Years | 2,014 (74.4%) | 0 (0.0%) |
| 30 to 34 Years | 2,554 (80.7%) | 56 (2.2%) |
| 35 to 44 Years | 3,918 (82.1%) | 153 (3.9%) |
| 45 to 54 Years | 2,615 (79.3%) | 31 (1.2%) |
| 55 to 59 Years | 870 (67.3%) | 37 (4.3%) |
| 60 to 64 Years | 776 (57.4%) | 0 (0.0%) |
| 65 to 74 Years | 356 (26.3%) | 7 (2.0%) |
| 75 Years and over | 30 (3.5%) | 0 (0.0%) |
| Total | 16,479 (69.9%) | 494 (3.0%) |
Employment Status by Educational Attainment in Clearfield
According to labor force statistics for Clearfield, 76.9% of individuals (12,755) out of the total population between 25 and 64 years of age (16,586) are in the labor force, with 2.2% or 281 of them being unemployed. The group with the highest labor force participation rate are those with the educational attainment of bachelor's degree or higher, with 87.4% or 3,372 individuals in the labor force. Within the labor force, individuals with high school diploma education have the highest percentage of unemployment, with 4.4% or 152 of them being unemployed.
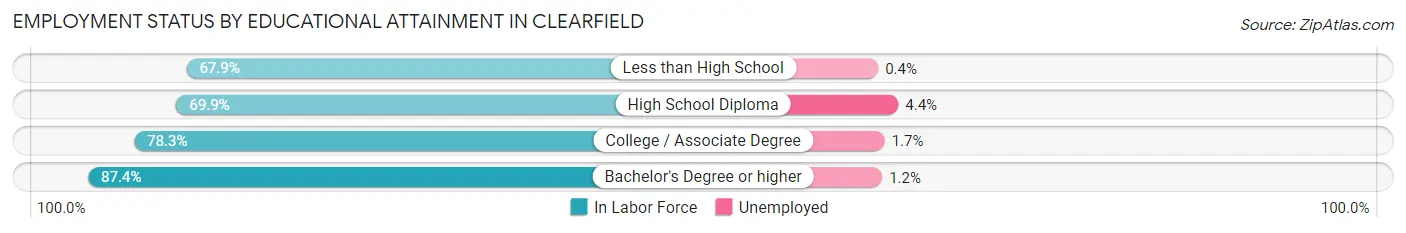
| Educational Attainment | In Labor Force | Unemployed |
| Less than High School | 1,137 (67.9%) | 7 (0.4%) |
| High School Diploma | 3,450 (69.9%) | 217 (4.4%) |
| College / Associate Degree | 4,790 (78.3%) | 104 (1.7%) |
| Bachelor's Degree or higher | 3,372 (87.4%) | 46 (1.2%) |
| Total | 12,755 (76.9%) | 365 (2.2%) |
Employment Occupations by Sex in Clearfield
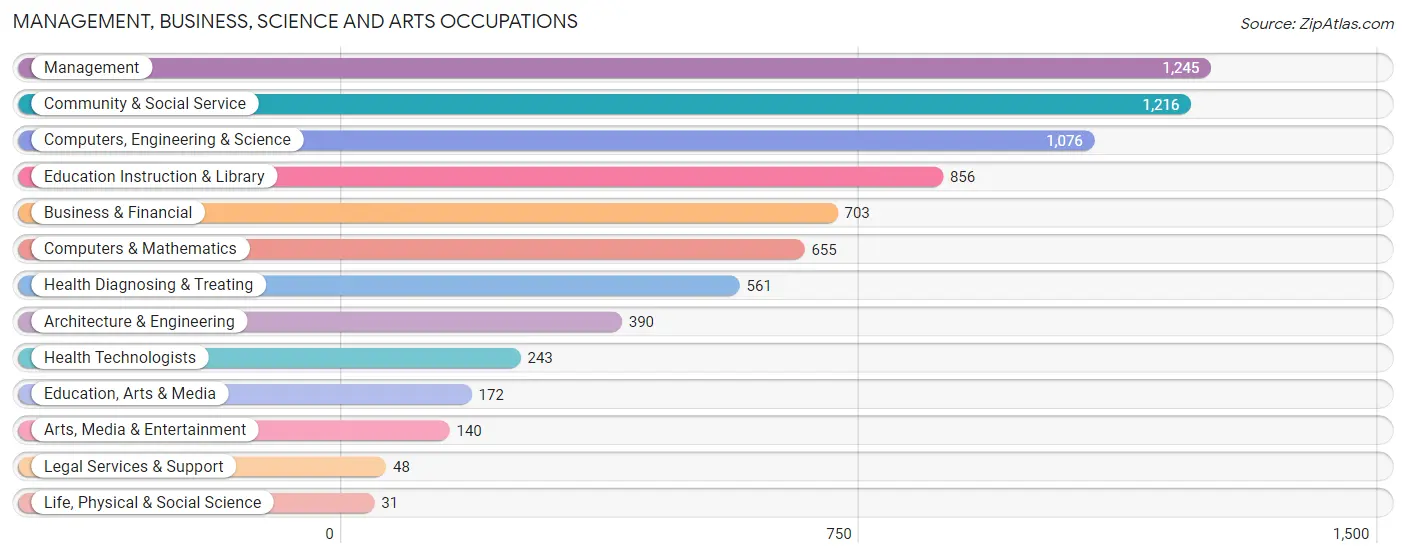
Management, Business, Science and Arts Occupations
The most common Management, Business, Science and Arts occupations in Clearfield are Management (1,245 | 8.3%), Community & Social Service (1,216 | 8.1%), Computers, Engineering & Science (1,076 | 7.2%), Education Instruction & Library (856 | 5.7%), and Business & Financial (703 | 4.7%).
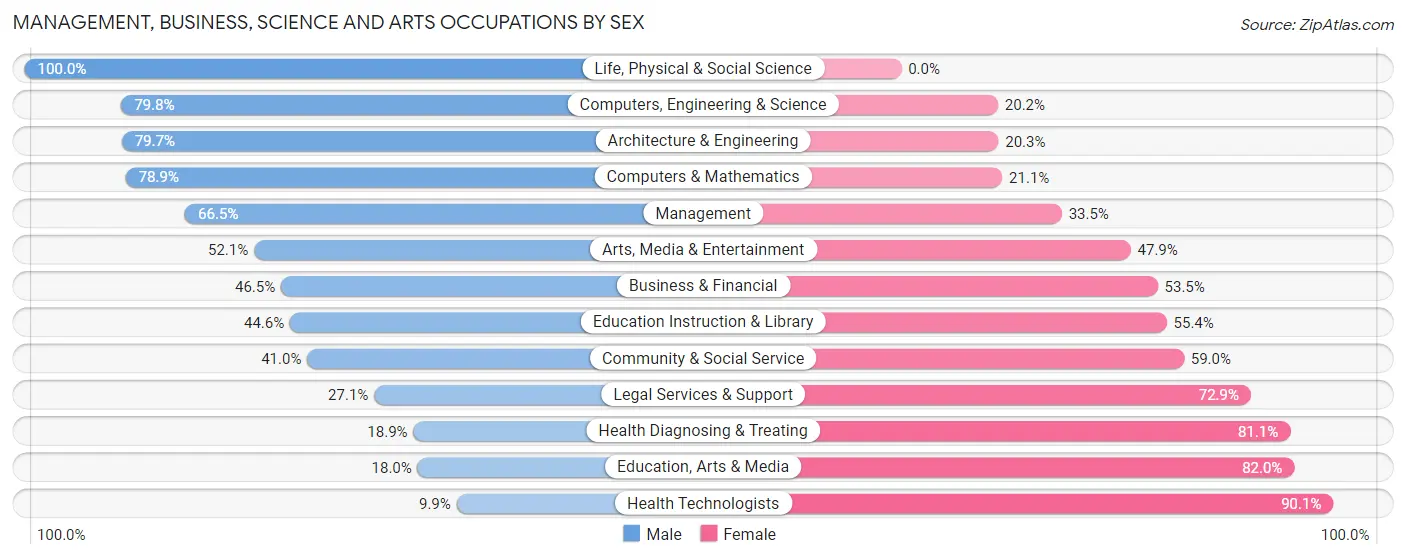
Management, Business, Science and Arts Occupations by Sex
Within the Management, Business, Science and Arts occupations in Clearfield, the most male-oriented occupations are Life, Physical & Social Science (100.0%), Computers, Engineering & Science (79.8%), and Architecture & Engineering (79.7%), while the most female-oriented occupations are Health Technologists (90.1%), Education, Arts & Media (82.0%), and Health Diagnosing & Treating (81.1%).
| Occupation | Male | Female |
| Management | 828 (66.5%) | 417 (33.5%) |
| Business & Financial | 327 (46.5%) | 376 (53.5%) |
| Computers, Engineering & Science | 859 (79.8%) | 217 (20.2%) |
| Computers & Mathematics | 517 (78.9%) | 138 (21.1%) |
| Architecture & Engineering | 311 (79.7%) | 79 (20.3%) |
| Life, Physical & Social Science | 31 (100.0%) | 0 (0.0%) |
| Community & Social Service | 499 (41.0%) | 717 (59.0%) |
| Education, Arts & Media | 31 (18.0%) | 141 (82.0%) |
| Legal Services & Support | 13 (27.1%) | 35 (72.9%) |
| Education Instruction & Library | 382 (44.6%) | 474 (55.4%) |
| Arts, Media & Entertainment | 73 (52.1%) | 67 (47.9%) |
| Health Diagnosing & Treating | 106 (18.9%) | 455 (81.1%) |
| Health Technologists | 24 (9.9%) | 219 (90.1%) |
| Total (Category) | 2,619 (54.5%) | 2,182 (45.5%) |
| Total (Overall) | 8,413 (56.1%) | 6,572 (43.9%) |
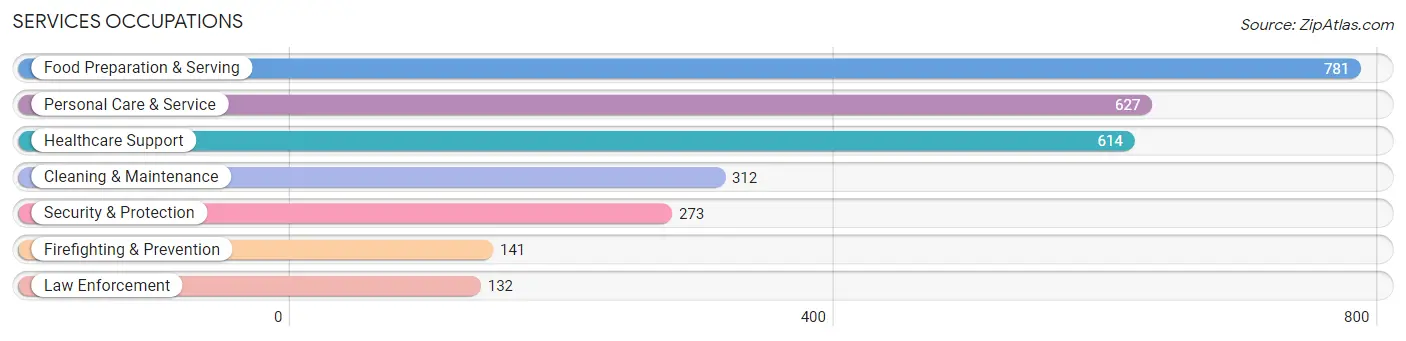
Services Occupations
The most common Services occupations in Clearfield are Food Preparation & Serving (781 | 5.2%), Personal Care & Service (627 | 4.2%), Healthcare Support (614 | 4.1%), Cleaning & Maintenance (312 | 2.1%), and Security & Protection (273 | 1.8%).
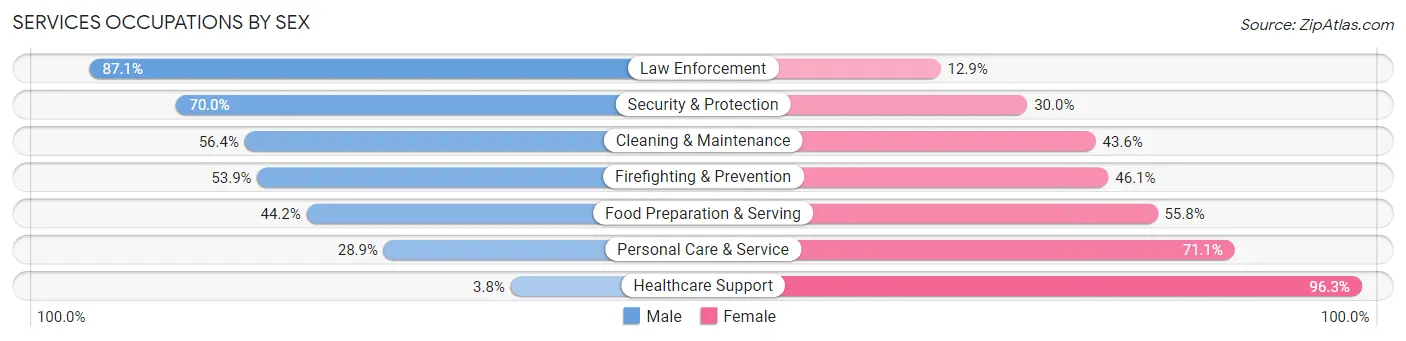
Services Occupations by Sex
Within the Services occupations in Clearfield, the most male-oriented occupations are Law Enforcement (87.1%), Security & Protection (70.0%), and Cleaning & Maintenance (56.4%), while the most female-oriented occupations are Healthcare Support (96.3%), Personal Care & Service (71.1%), and Food Preparation & Serving (55.8%).
| Occupation | Male | Female |
| Healthcare Support | 23 (3.7%) | 591 (96.3%) |
| Security & Protection | 191 (70.0%) | 82 (30.0%) |
| Firefighting & Prevention | 76 (53.9%) | 65 (46.1%) |
| Law Enforcement | 115 (87.1%) | 17 (12.9%) |
| Food Preparation & Serving | 345 (44.2%) | 436 (55.8%) |
| Cleaning & Maintenance | 176 (56.4%) | 136 (43.6%) |
| Personal Care & Service | 181 (28.9%) | 446 (71.1%) |
| Total (Category) | 916 (35.1%) | 1,691 (64.9%) |
| Total (Overall) | 8,413 (56.1%) | 6,572 (43.9%) |
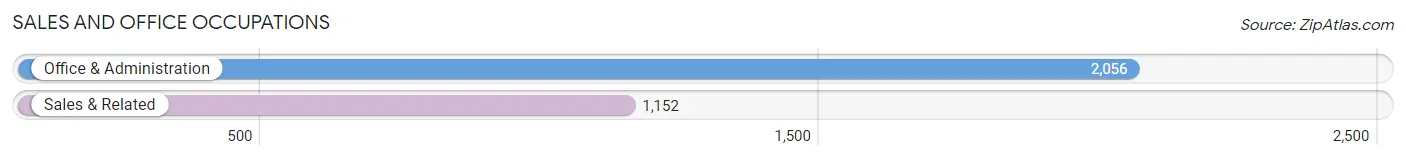
Sales and Office Occupations
The most common Sales and Office occupations in Clearfield are Office & Administration (2,056 | 13.7%), and Sales & Related (1,152 | 7.7%).
Sales and Office Occupations by Sex
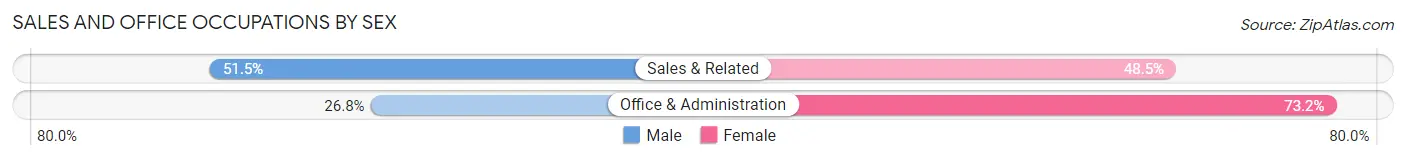
| Occupation | Male | Female |
| Sales & Related | 593 (51.5%) | 559 (48.5%) |
| Office & Administration | 551 (26.8%) | 1,505 (73.2%) |
| Total (Category) | 1,144 (35.7%) | 2,064 (64.3%) |
| Total (Overall) | 8,413 (56.1%) | 6,572 (43.9%) |
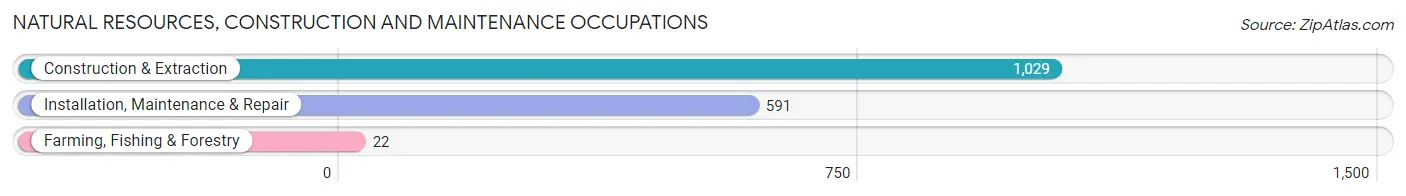
Natural Resources, Construction and Maintenance Occupations
The most common Natural Resources, Construction and Maintenance occupations in Clearfield are Construction & Extraction (1,029 | 6.9%), Installation, Maintenance & Repair (591 | 3.9%), and Farming, Fishing & Forestry (22 | 0.2%).
Natural Resources, Construction and Maintenance Occupations by Sex
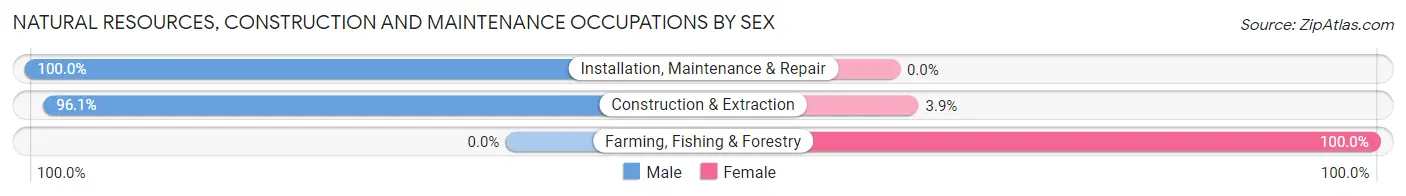
| Occupation | Male | Female |
| Farming, Fishing & Forestry | 0 (0.0%) | 22 (100.0%) |
| Construction & Extraction | 989 (96.1%) | 40 (3.9%) |
| Installation, Maintenance & Repair | 591 (100.0%) | 0 (0.0%) |
| Total (Category) | 1,580 (96.2%) | 62 (3.8%) |
| Total (Overall) | 8,413 (56.1%) | 6,572 (43.9%) |
Production, Transportation and Moving Occupations
The most common Production, Transportation and Moving occupations in Clearfield are Production (1,217 | 8.1%), Transportation (854 | 5.7%), and Material Moving (656 | 4.4%).
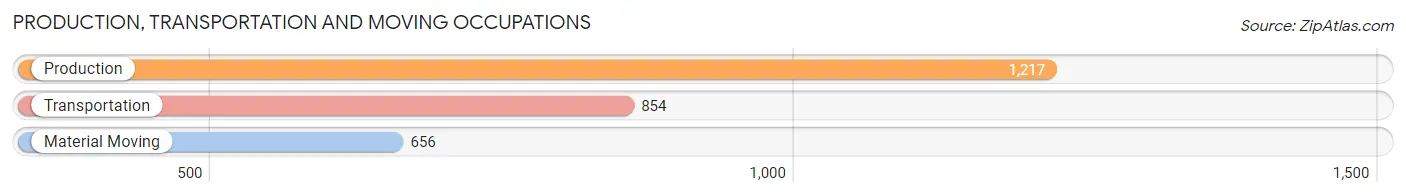
Production, Transportation and Moving Occupations by Sex
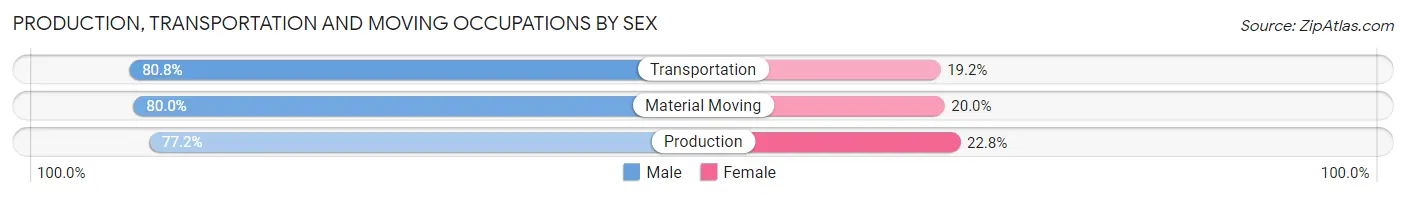
| Occupation | Male | Female |
| Production | 939 (77.2%) | 278 (22.8%) |
| Transportation | 690 (80.8%) | 164 (19.2%) |
| Material Moving | 525 (80.0%) | 131 (20.0%) |
| Total (Category) | 2,154 (79.0%) | 573 (21.0%) |
| Total (Overall) | 8,413 (56.1%) | 6,572 (43.9%) |
Employment Industries by Sex in Clearfield
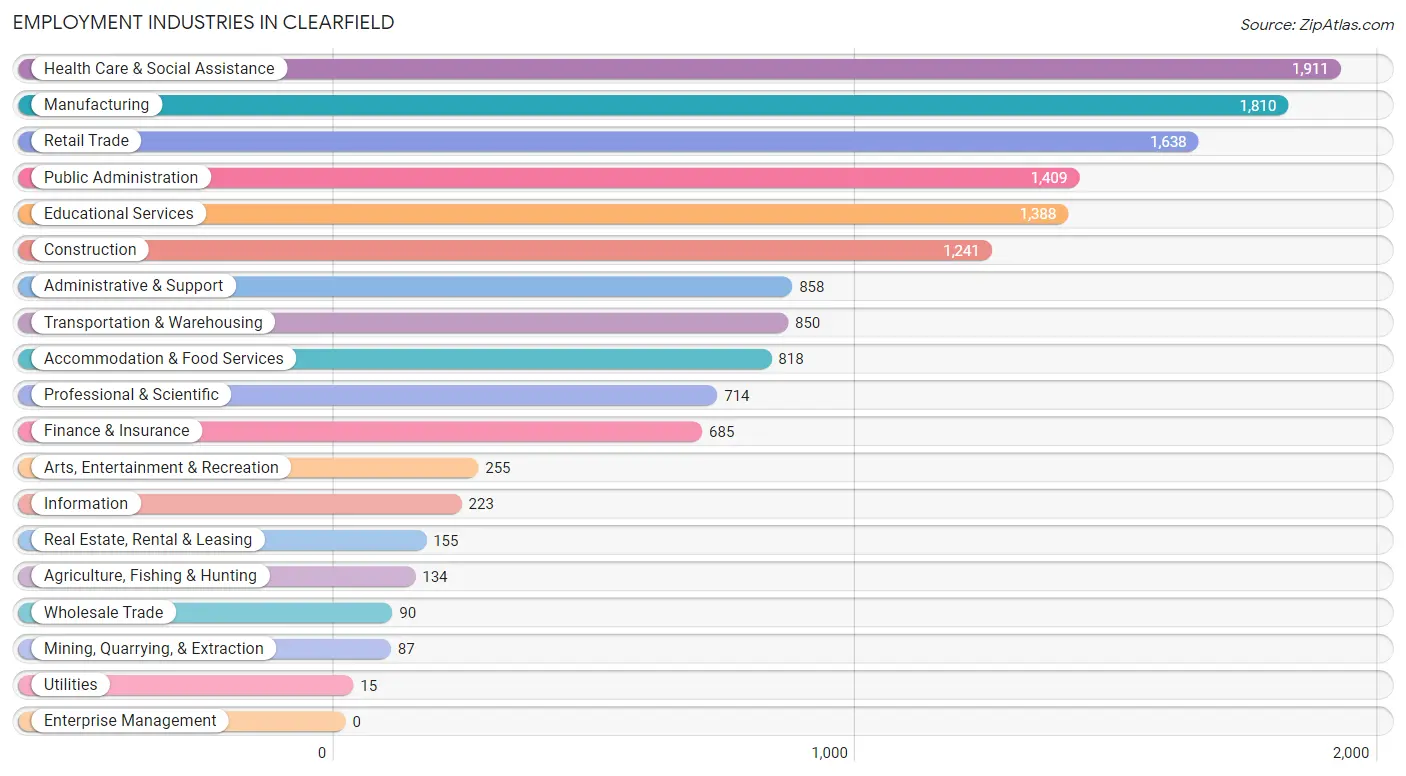
Employment Industries in Clearfield
The major employment industries in Clearfield include Health Care & Social Assistance (1,911 | 12.8%), Manufacturing (1,810 | 12.1%), Retail Trade (1,638 | 10.9%), Public Administration (1,409 | 9.4%), and Educational Services (1,388 | 9.3%).
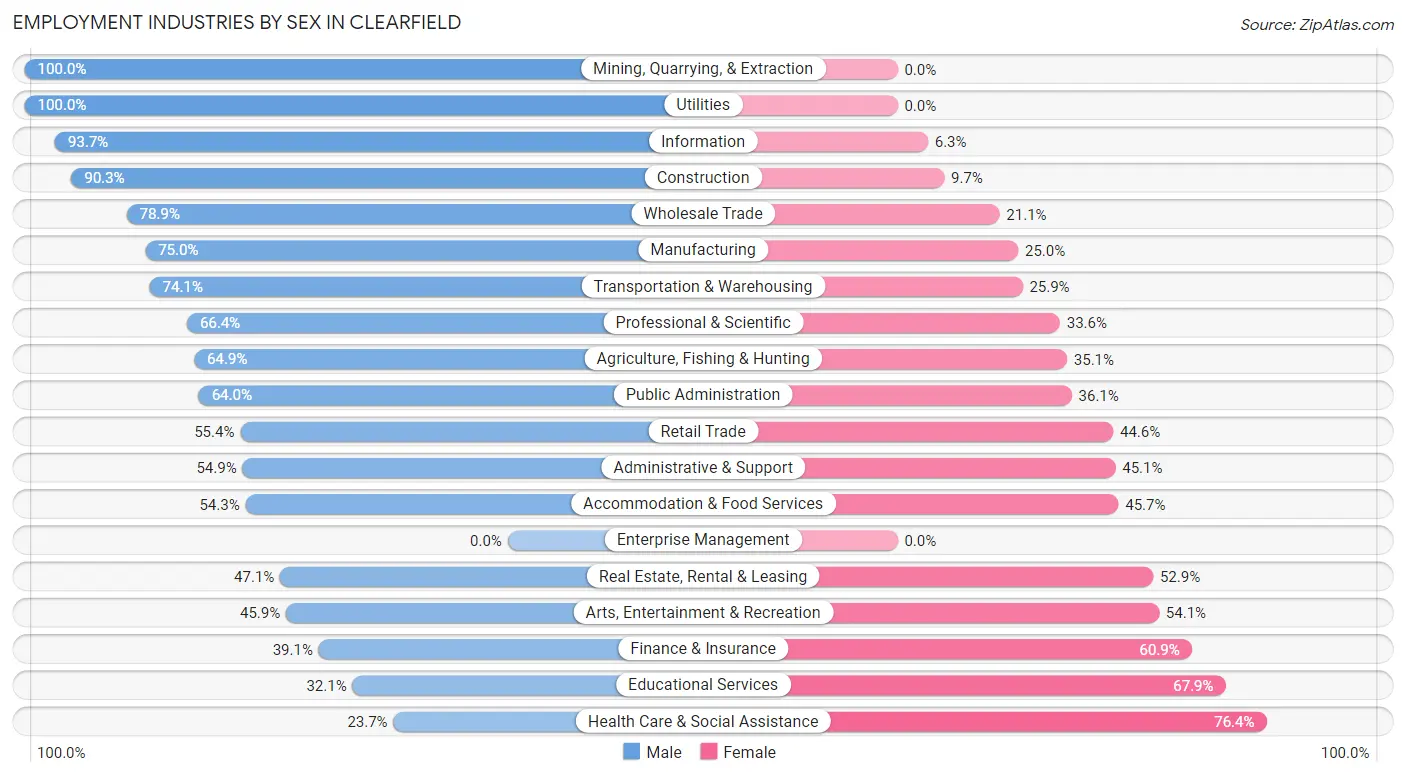
Employment Industries by Sex in Clearfield
The Clearfield industries that see more men than women are Mining, Quarrying, & Extraction (100.0%), Utilities (100.0%), and Information (93.7%), whereas the industries that tend to have a higher number of women are Health Care & Social Assistance (76.3%), Educational Services (67.9%), and Finance & Insurance (60.9%).
| Industry | Male | Female |
| Agriculture, Fishing & Hunting | 87 (64.9%) | 47 (35.1%) |
| Mining, Quarrying, & Extraction | 87 (100.0%) | 0 (0.0%) |
| Construction | 1,121 (90.3%) | 120 (9.7%) |
| Manufacturing | 1,358 (75.0%) | 452 (25.0%) |
| Wholesale Trade | 71 (78.9%) | 19 (21.1%) |
| Retail Trade | 907 (55.4%) | 731 (44.6%) |
| Transportation & Warehousing | 630 (74.1%) | 220 (25.9%) |
| Utilities | 15 (100.0%) | 0 (0.0%) |
| Information | 209 (93.7%) | 14 (6.3%) |
| Finance & Insurance | 268 (39.1%) | 417 (60.9%) |
| Real Estate, Rental & Leasing | 73 (47.1%) | 82 (52.9%) |
| Professional & Scientific | 474 (66.4%) | 240 (33.6%) |
| Enterprise Management | 0 (0.0%) | 0 (0.0%) |
| Administrative & Support | 471 (54.9%) | 387 (45.1%) |
| Educational Services | 446 (32.1%) | 942 (67.9%) |
| Health Care & Social Assistance | 452 (23.6%) | 1,459 (76.3%) |
| Arts, Entertainment & Recreation | 117 (45.9%) | 138 (54.1%) |
| Accommodation & Food Services | 444 (54.3%) | 374 (45.7%) |
| Public Administration | 901 (63.9%) | 508 (36.0%) |
| Total | 8,413 (56.1%) | 6,572 (43.9%) |
Education in Clearfield
School Enrollment in Clearfield
The most common levels of schooling among the 9,072 students in Clearfield are elementary school (1,903 | 21.0%), college / undergraduate (1,891 | 20.8%), and middle school (1,850 | 20.4%).
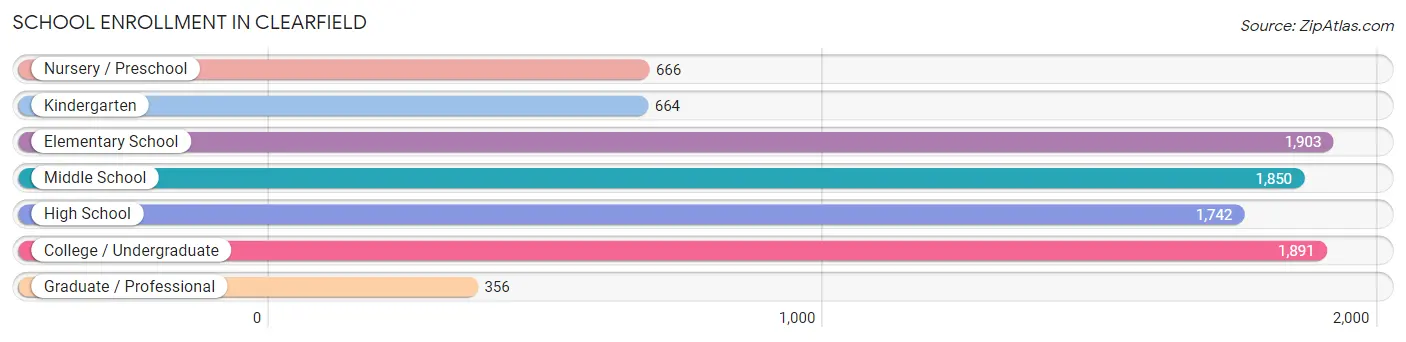
| School Level | # Students | % Students |
| Nursery / Preschool | 666 | 7.3% |
| Kindergarten | 664 | 7.3% |
| Elementary School | 1,903 | 21.0% |
| Middle School | 1,850 | 20.4% |
| High School | 1,742 | 19.2% |
| College / Undergraduate | 1,891 | 20.8% |
| Graduate / Professional | 356 | 3.9% |
| Total | 9,072 | 100.0% |
School Enrollment by Age by Funding Source in Clearfield
Out of a total of 9,072 students who are enrolled in schools in Clearfield, 853 (9.4%) attend a private institution, while the remaining 8,219 (90.6%) are enrolled in public schools. The age group of 35 years and over has the highest likelihood of being enrolled in private schools, with 232 (36.3% in the age bracket) enrolled. Conversely, the age group of 18 to 19 year olds has the lowest likelihood of being enrolled in a private school, with 656 (97.5% in the age bracket) attending a public institution.
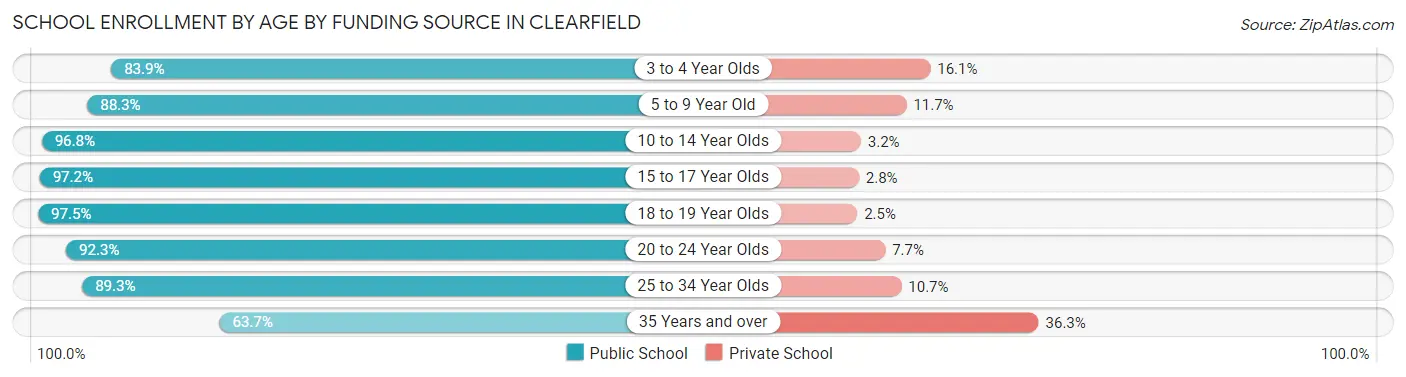
| Age Bracket | Public School | Private School |
| 3 to 4 Year Olds | 509 (83.9%) | 98 (16.1%) |
| 5 to 9 Year Old | 2,047 (88.3%) | 271 (11.7%) |
| 10 to 14 Year Olds | 2,211 (96.8%) | 73 (3.2%) |
| 15 to 17 Year Olds | 1,167 (97.2%) | 34 (2.8%) |
| 18 to 19 Year Olds | 656 (97.5%) | 17 (2.5%) |
| 20 to 24 Year Olds | 644 (92.3%) | 54 (7.7%) |
| 25 to 34 Year Olds | 582 (89.3%) | 70 (10.7%) |
| 35 Years and over | 407 (63.7%) | 232 (36.3%) |
| Total | 8,219 (90.6%) | 853 (9.4%) |
Educational Attainment by Field of Study in Clearfield
Business (1,036 | 22.4%), education (606 | 13.1%), arts & humanities (552 | 11.9%), science & technology (457 | 9.9%), and computers & mathematics (392 | 8.5%) are the most common fields of study among 4,636 individuals in Clearfield who have obtained a bachelor's degree or higher.
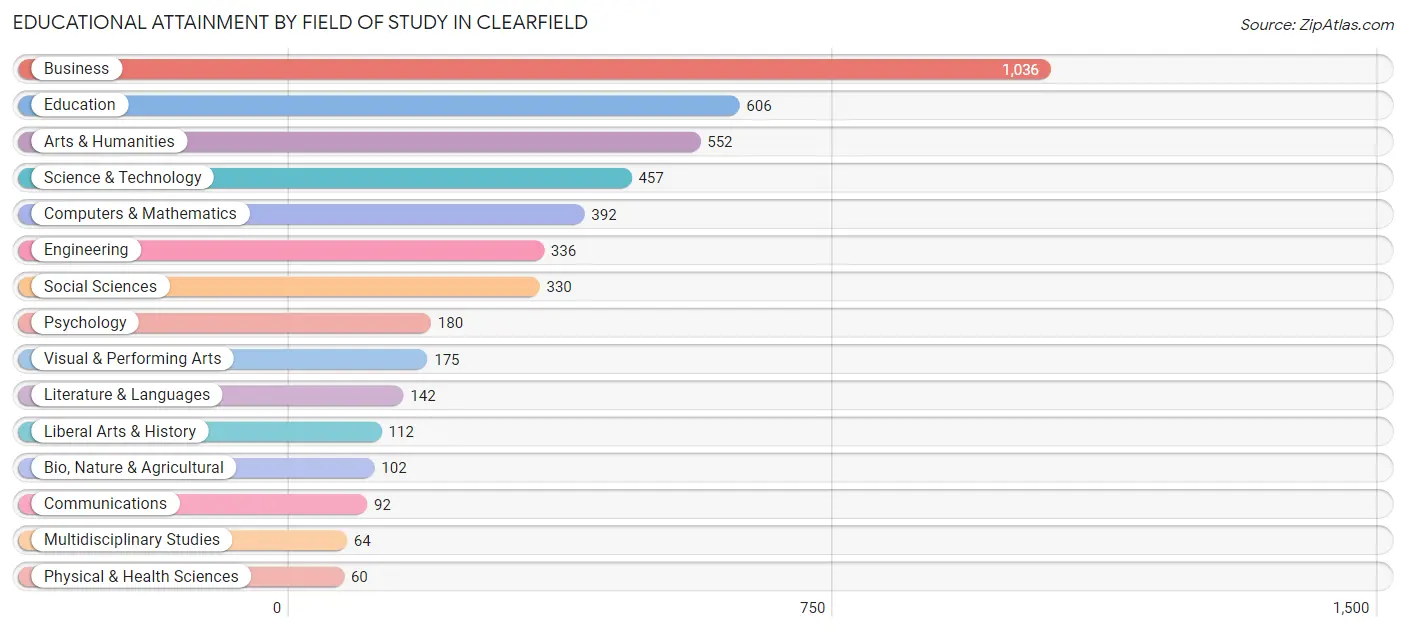
| Field of Study | # Graduates | % Graduates |
| Computers & Mathematics | 392 | 8.5% |
| Bio, Nature & Agricultural | 102 | 2.2% |
| Physical & Health Sciences | 60 | 1.3% |
| Psychology | 180 | 3.9% |
| Social Sciences | 330 | 7.1% |
| Engineering | 336 | 7.2% |
| Multidisciplinary Studies | 64 | 1.4% |
| Science & Technology | 457 | 9.9% |
| Business | 1,036 | 22.4% |
| Education | 606 | 13.1% |
| Literature & Languages | 142 | 3.1% |
| Liberal Arts & History | 112 | 2.4% |
| Visual & Performing Arts | 175 | 3.8% |
| Communications | 92 | 2.0% |
| Arts & Humanities | 552 | 11.9% |
| Total | 4,636 | 100.0% |
Transportation & Commute in Clearfield
Vehicle Availability by Sex in Clearfield
The most prevalent vehicle ownership categories in Clearfield are males with 2 vehicles (3,318, accounting for 36.4%) and females with 2 vehicles (2,739, making up 50.0%).
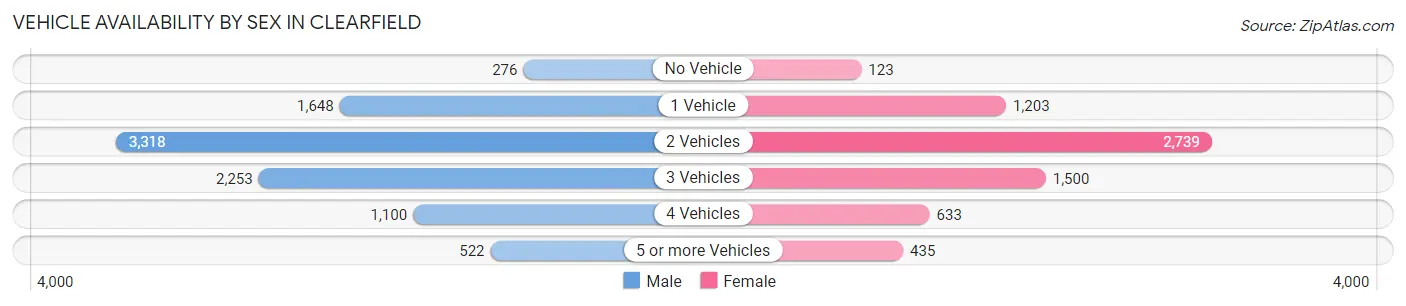
| Vehicles Available | Male | Female |
| No Vehicle | 276 (3.0%) | 123 (1.8%) |
| 1 Vehicle | 1,648 (18.1%) | 1,203 (18.1%) |
| 2 Vehicles | 3,318 (36.4%) | 2,739 (41.3%) |
| 3 Vehicles | 2,253 (24.7%) | 1,500 (22.6%) |
| 4 Vehicles | 1,100 (12.1%) | 633 (9.5%) |
| 5 or more Vehicles | 522 (5.7%) | 435 (6.6%) |
| Total | 9,117 (100.0%) | 6,633 (100.0%) |
Commute Time in Clearfield
The most frequently occuring commute durations in Clearfield are 15 to 19 minutes (2,804 commuters, 19.3%), 10 to 14 minutes (2,565 commuters, 17.6%), and 5 to 9 minutes (2,032 commuters, 14.0%).
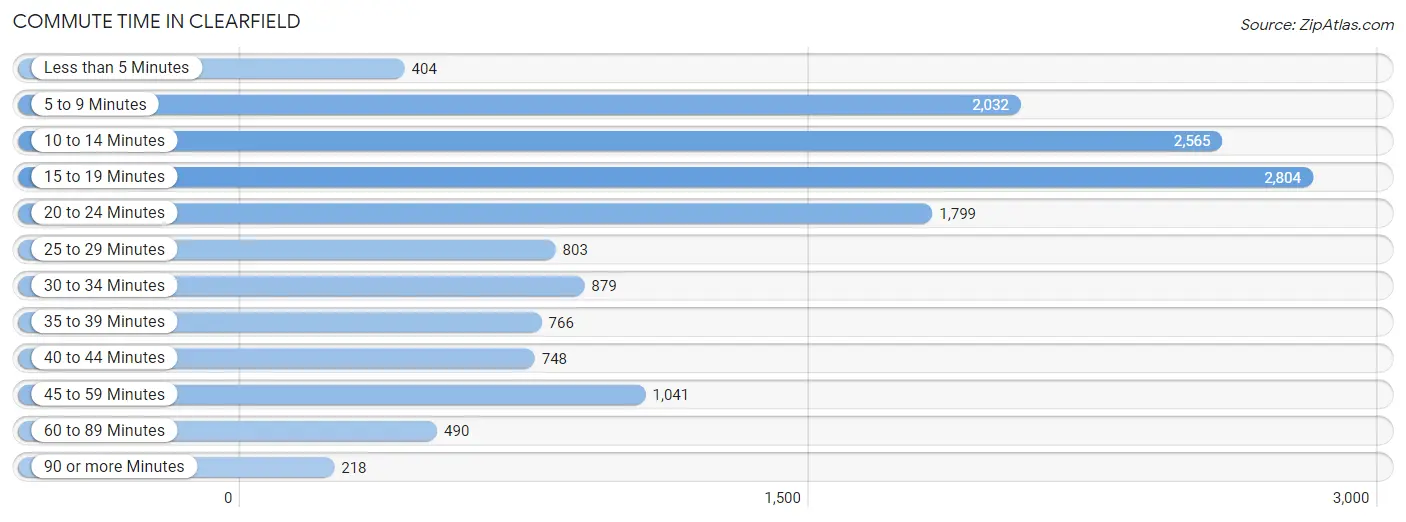
| Commute Time | # Commuters | % Commuters |
| Less than 5 Minutes | 404 | 2.8% |
| 5 to 9 Minutes | 2,032 | 14.0% |
| 10 to 14 Minutes | 2,565 | 17.6% |
| 15 to 19 Minutes | 2,804 | 19.3% |
| 20 to 24 Minutes | 1,799 | 12.4% |
| 25 to 29 Minutes | 803 | 5.5% |
| 30 to 34 Minutes | 879 | 6.0% |
| 35 to 39 Minutes | 766 | 5.3% |
| 40 to 44 Minutes | 748 | 5.1% |
| 45 to 59 Minutes | 1,041 | 7.2% |
| 60 to 89 Minutes | 490 | 3.4% |
| 90 or more Minutes | 218 | 1.5% |
Commute Time by Sex in Clearfield
The most common commute times in Clearfield are 10 to 14 minutes (1,417 commuters, 16.6%) for males and 15 to 19 minutes (1,409 commuters, 23.5%) for females.
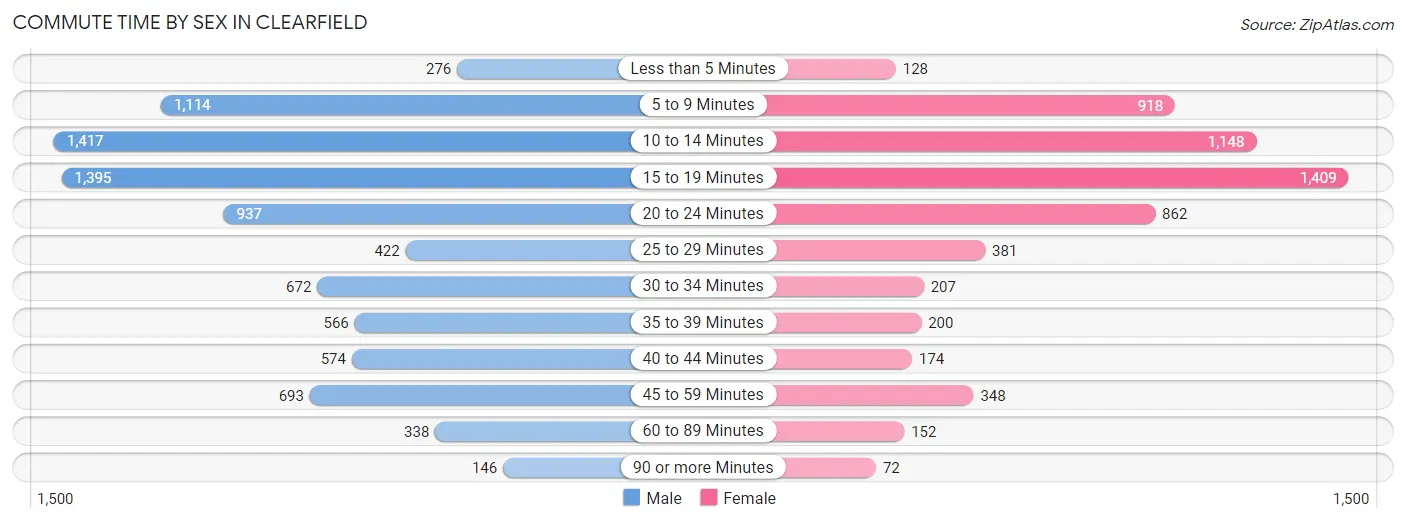
| Commute Time | Male | Female |
| Less than 5 Minutes | 276 (3.2%) | 128 (2.1%) |
| 5 to 9 Minutes | 1,114 (13.0%) | 918 (15.3%) |
| 10 to 14 Minutes | 1,417 (16.6%) | 1,148 (19.1%) |
| 15 to 19 Minutes | 1,395 (16.3%) | 1,409 (23.5%) |
| 20 to 24 Minutes | 937 (11.0%) | 862 (14.4%) |
| 25 to 29 Minutes | 422 (4.9%) | 381 (6.4%) |
| 30 to 34 Minutes | 672 (7.9%) | 207 (3.5%) |
| 35 to 39 Minutes | 566 (6.6%) | 200 (3.3%) |
| 40 to 44 Minutes | 574 (6.7%) | 174 (2.9%) |
| 45 to 59 Minutes | 693 (8.1%) | 348 (5.8%) |
| 60 to 89 Minutes | 338 (4.0%) | 152 (2.5%) |
| 90 or more Minutes | 146 (1.7%) | 72 (1.2%) |
Time of Departure to Work by Sex in Clearfield
The most frequent times of departure to work in Clearfield are 7:00 AM to 7:29 AM (1,309, 15.3%) for males and 7:00 AM to 7:29 AM (767, 12.8%) for females.
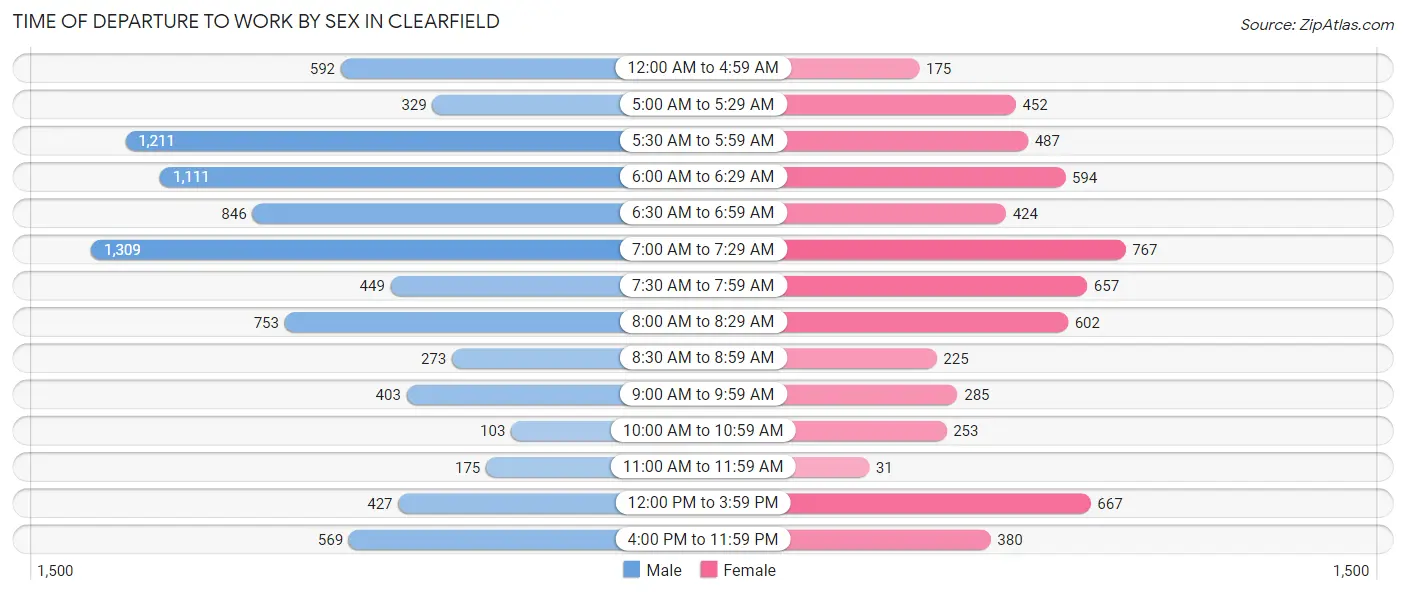
| Time of Departure | Male | Female |
| 12:00 AM to 4:59 AM | 592 (6.9%) | 175 (2.9%) |
| 5:00 AM to 5:29 AM | 329 (3.8%) | 452 (7.5%) |
| 5:30 AM to 5:59 AM | 1,211 (14.2%) | 487 (8.1%) |
| 6:00 AM to 6:29 AM | 1,111 (13.0%) | 594 (9.9%) |
| 6:30 AM to 6:59 AM | 846 (9.9%) | 424 (7.1%) |
| 7:00 AM to 7:29 AM | 1,309 (15.3%) | 767 (12.8%) |
| 7:30 AM to 7:59 AM | 449 (5.2%) | 657 (11.0%) |
| 8:00 AM to 8:29 AM | 753 (8.8%) | 602 (10.0%) |
| 8:30 AM to 8:59 AM | 273 (3.2%) | 225 (3.7%) |
| 9:00 AM to 9:59 AM | 403 (4.7%) | 285 (4.8%) |
| 10:00 AM to 10:59 AM | 103 (1.2%) | 253 (4.2%) |
| 11:00 AM to 11:59 AM | 175 (2.1%) | 31 (0.5%) |
| 12:00 PM to 3:59 PM | 427 (5.0%) | 667 (11.1%) |
| 4:00 PM to 11:59 PM | 569 (6.7%) | 380 (6.3%) |
| Total | 8,550 (100.0%) | 5,999 (100.0%) |
Housing Occupancy in Clearfield
Occupancy by Ownership in Clearfield
Of the total 10,672 dwellings in Clearfield, owner-occupied units account for 6,232 (58.4%), while renter-occupied units make up 4,440 (41.6%).
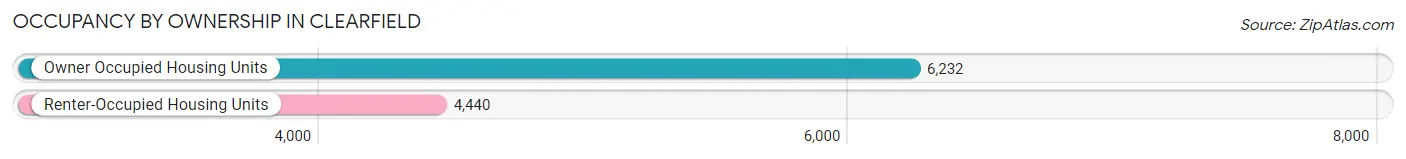
| Occupancy | # Housing Units | % Housing Units |
| Owner Occupied Housing Units | 6,232 | 58.4% |
| Renter-Occupied Housing Units | 4,440 | 41.6% |
| Total Occupied Housing Units | 10,672 | 100.0% |
Occupancy by Household Size in Clearfield
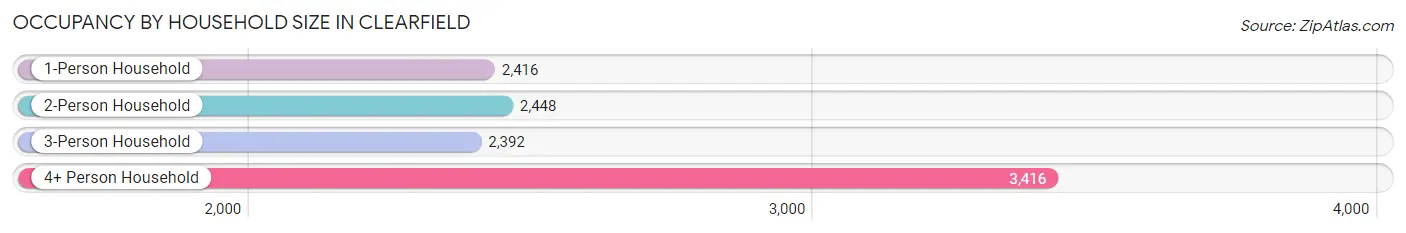
| Household Size | # Housing Units | % Housing Units |
| 1-Person Household | 2,416 | 22.6% |
| 2-Person Household | 2,448 | 22.9% |
| 3-Person Household | 2,392 | 22.4% |
| 4+ Person Household | 3,416 | 32.0% |
| Total Housing Units | 10,672 | 100.0% |
Occupancy by Ownership by Household Size in Clearfield
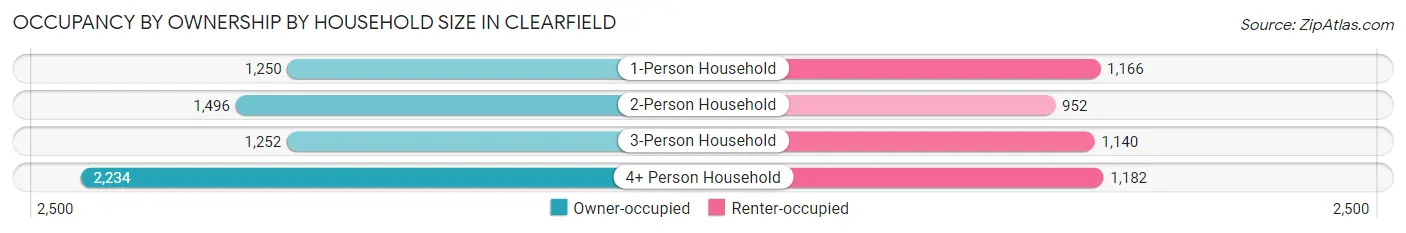
| Household Size | Owner-occupied | Renter-occupied |
| 1-Person Household | 1,250 (51.7%) | 1,166 (48.3%) |
| 2-Person Household | 1,496 (61.1%) | 952 (38.9%) |
| 3-Person Household | 1,252 (52.3%) | 1,140 (47.7%) |
| 4+ Person Household | 2,234 (65.4%) | 1,182 (34.6%) |
| Total Housing Units | 6,232 (58.4%) | 4,440 (41.6%) |
Occupancy by Educational Attainment in Clearfield
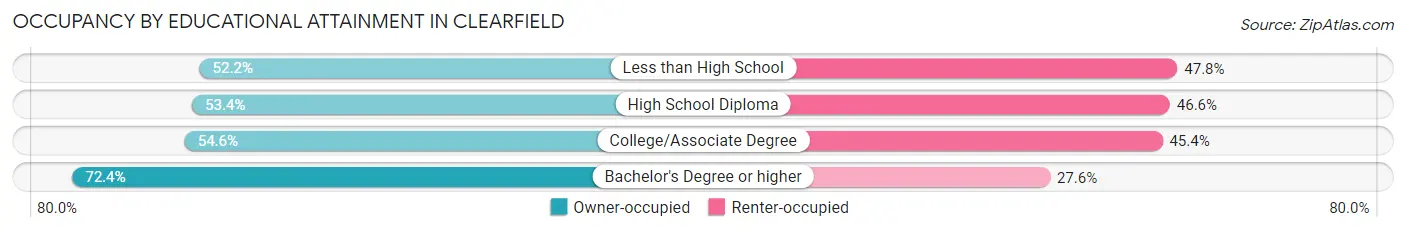
| Household Size | Owner-occupied | Renter-occupied |
| Less than High School | 516 (52.2%) | 472 (47.8%) |
| High School Diploma | 1,631 (53.4%) | 1,422 (46.6%) |
| College/Associate Degree | 2,196 (54.6%) | 1,827 (45.4%) |
| Bachelor's Degree or higher | 1,889 (72.4%) | 719 (27.6%) |
Occupancy by Age of Householder in Clearfield
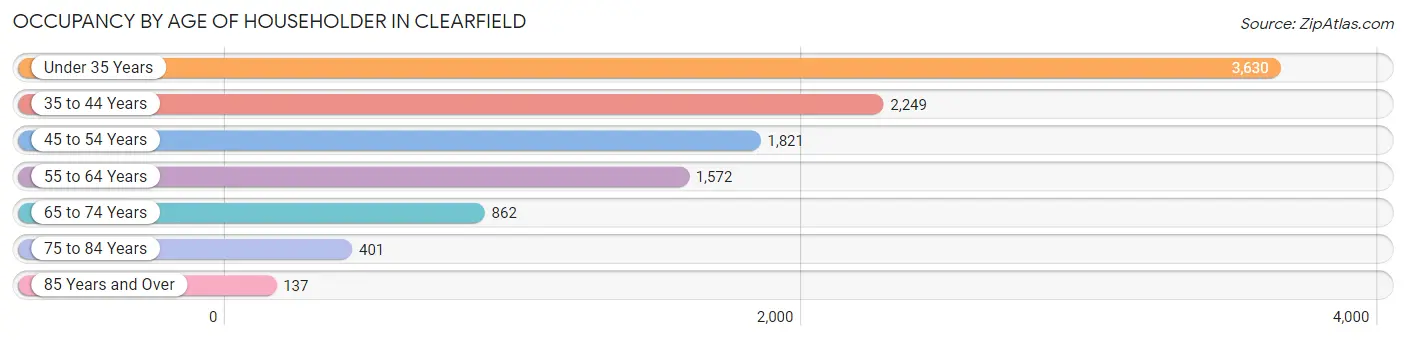
| Age Bracket | # Households | % Households |
| Under 35 Years | 3,630 | 34.0% |
| 35 to 44 Years | 2,249 | 21.1% |
| 45 to 54 Years | 1,821 | 17.1% |
| 55 to 64 Years | 1,572 | 14.7% |
| 65 to 74 Years | 862 | 8.1% |
| 75 to 84 Years | 401 | 3.8% |
| 85 Years and Over | 137 | 1.3% |
| Total | 10,672 | 100.0% |
Housing Finances in Clearfield
Median Income by Occupancy in Clearfield
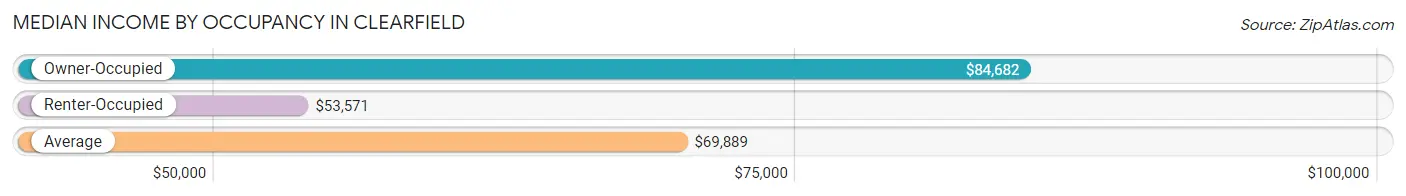
| Occupancy Type | # Households | Median Income |
| Owner-Occupied | 6,232 (58.4%) | $84,682 |
| Renter-Occupied | 4,440 (41.6%) | $53,571 |
| Average | 10,672 (100.0%) | $69,889 |
Occupancy by Householder Income Bracket in Clearfield
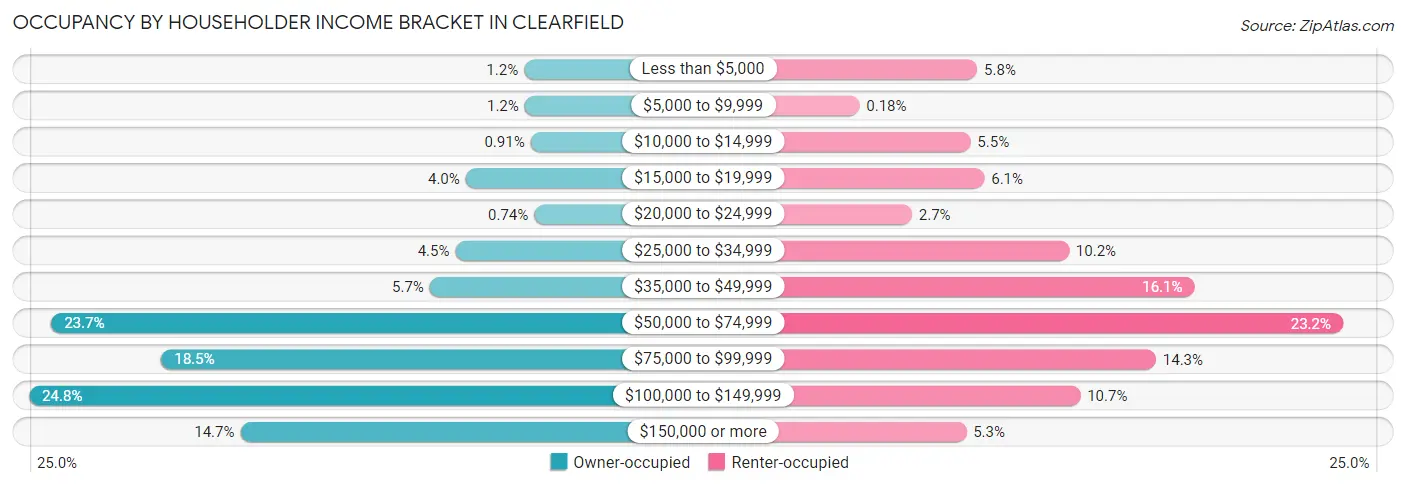
| Income Bracket | Owner-occupied | Renter-occupied |
| Less than $5,000 | 76 (1.2%) | 257 (5.8%) |
| $5,000 to $9,999 | 74 (1.2%) | 8 (0.2%) |
| $10,000 to $14,999 | 57 (0.9%) | 243 (5.5%) |
| $15,000 to $19,999 | 249 (4.0%) | 272 (6.1%) |
| $20,000 to $24,999 | 46 (0.7%) | 119 (2.7%) |
| $25,000 to $34,999 | 280 (4.5%) | 451 (10.2%) |
| $35,000 to $49,999 | 356 (5.7%) | 716 (16.1%) |
| $50,000 to $74,999 | 1,479 (23.7%) | 1,030 (23.2%) |
| $75,000 to $99,999 | 1,152 (18.5%) | 635 (14.3%) |
| $100,000 to $149,999 | 1,545 (24.8%) | 475 (10.7%) |
| $150,000 or more | 918 (14.7%) | 234 (5.3%) |
| Total | 6,232 (100.0%) | 4,440 (100.0%) |
Monthly Housing Cost Tiers in Clearfield
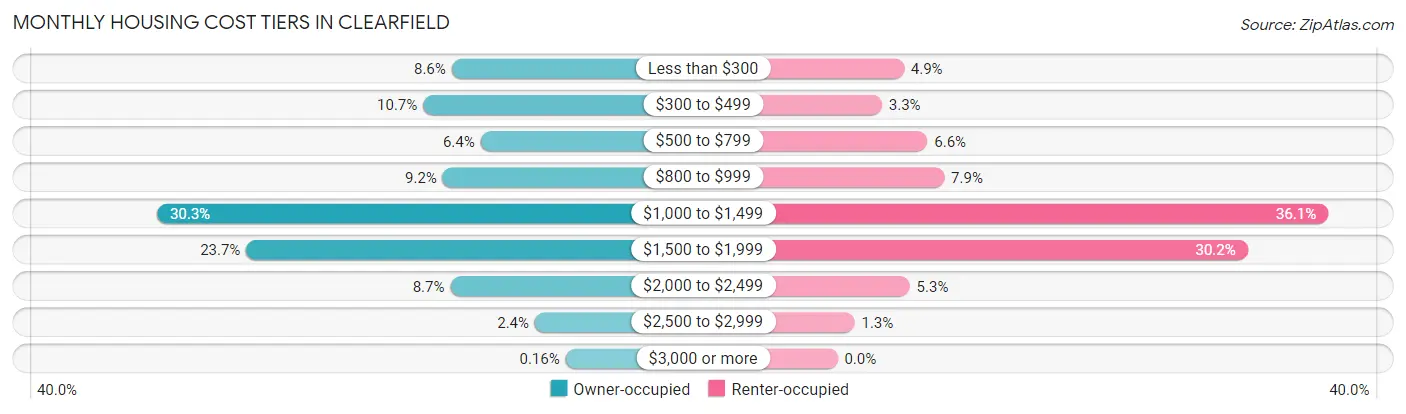
| Monthly Cost | Owner-occupied | Renter-occupied |
| Less than $300 | 533 (8.6%) | 217 (4.9%) |
| $300 to $499 | 664 (10.6%) | 145 (3.3%) |
| $500 to $799 | 400 (6.4%) | 294 (6.6%) |
| $800 to $999 | 574 (9.2%) | 349 (7.9%) |
| $1,000 to $1,499 | 1,885 (30.2%) | 1,604 (36.1%) |
| $1,500 to $1,999 | 1,476 (23.7%) | 1,341 (30.2%) |
| $2,000 to $2,499 | 539 (8.6%) | 236 (5.3%) |
| $2,500 to $2,999 | 151 (2.4%) | 56 (1.3%) |
| $3,000 or more | 10 (0.2%) | 0 (0.0%) |
| Total | 6,232 (100.0%) | 4,440 (100.0%) |
Physical Housing Characteristics in Clearfield
Housing Structures in Clearfield
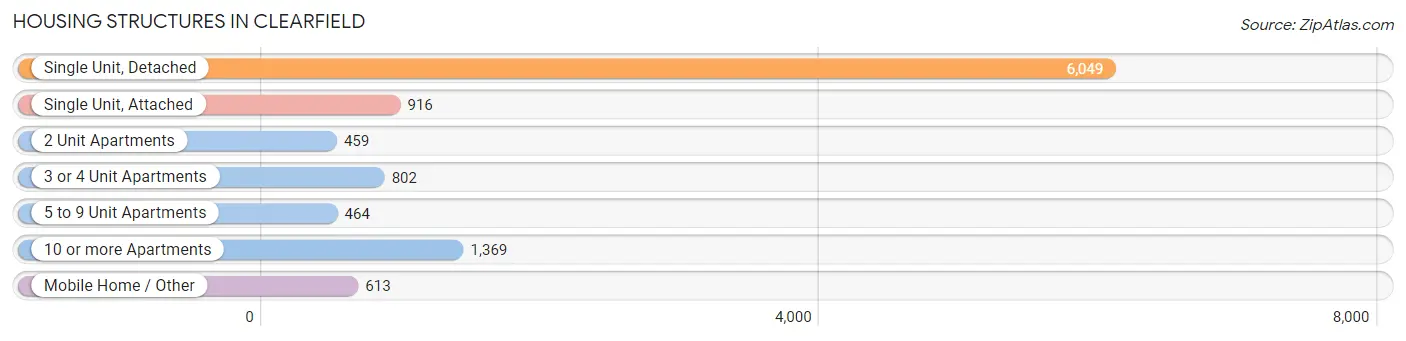
| Structure Type | # Housing Units | % Housing Units |
| Single Unit, Detached | 6,049 | 56.7% |
| Single Unit, Attached | 916 | 8.6% |
| 2 Unit Apartments | 459 | 4.3% |
| 3 or 4 Unit Apartments | 802 | 7.5% |
| 5 to 9 Unit Apartments | 464 | 4.3% |
| 10 or more Apartments | 1,369 | 12.8% |
| Mobile Home / Other | 613 | 5.7% |
| Total | 10,672 | 100.0% |
Housing Structures by Occupancy in Clearfield
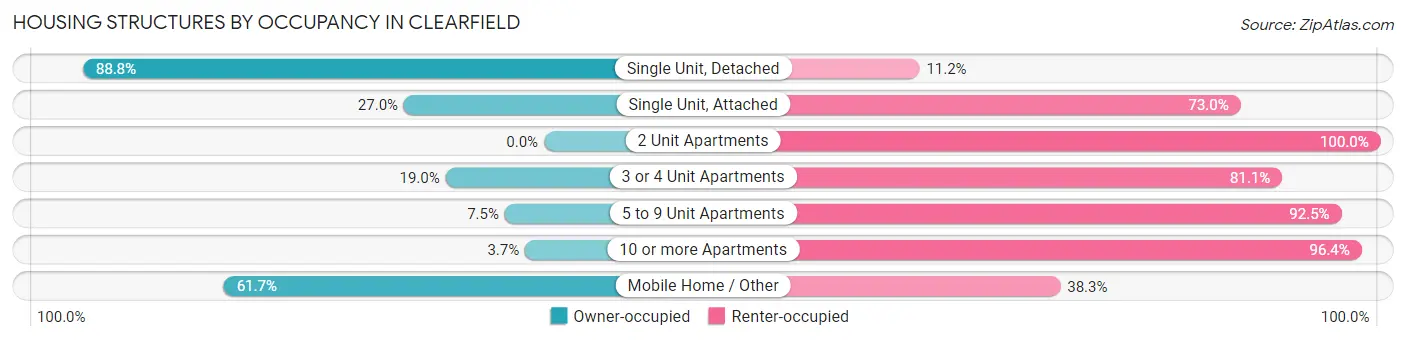
| Structure Type | Owner-occupied | Renter-occupied |
| Single Unit, Detached | 5,370 (88.8%) | 679 (11.2%) |
| Single Unit, Attached | 247 (27.0%) | 669 (73.0%) |
| 2 Unit Apartments | 0 (0.0%) | 459 (100.0%) |
| 3 or 4 Unit Apartments | 152 (19.0%) | 650 (81.0%) |
| 5 to 9 Unit Apartments | 35 (7.5%) | 429 (92.5%) |
| 10 or more Apartments | 50 (3.6%) | 1,319 (96.4%) |
| Mobile Home / Other | 378 (61.7%) | 235 (38.3%) |
| Total | 6,232 (58.4%) | 4,440 (41.6%) |
Housing Structures by Number of Rooms in Clearfield
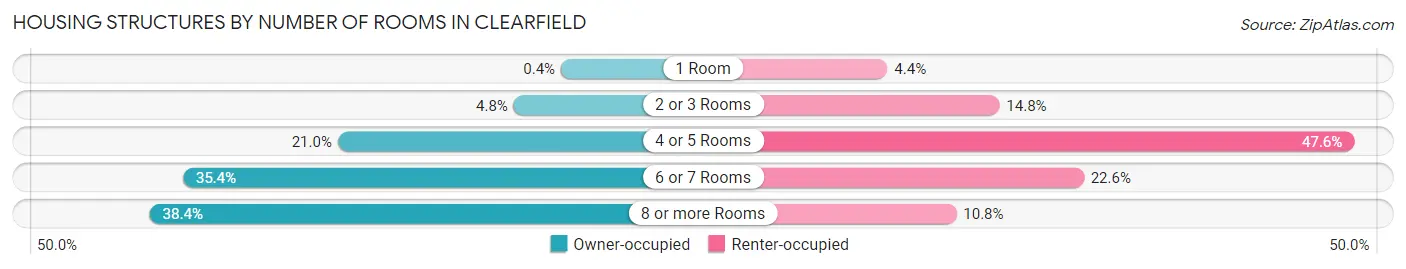
| Number of Rooms | Owner-occupied | Renter-occupied |
| 1 Room | 25 (0.4%) | 195 (4.4%) |
| 2 or 3 Rooms | 297 (4.8%) | 655 (14.7%) |
| 4 or 5 Rooms | 1,311 (21.0%) | 2,111 (47.5%) |
| 6 or 7 Rooms | 2,204 (35.4%) | 1,001 (22.6%) |
| 8 or more Rooms | 2,395 (38.4%) | 478 (10.8%) |
| Total | 6,232 (100.0%) | 4,440 (100.0%) |
Housing Structure by Heating Type in Clearfield
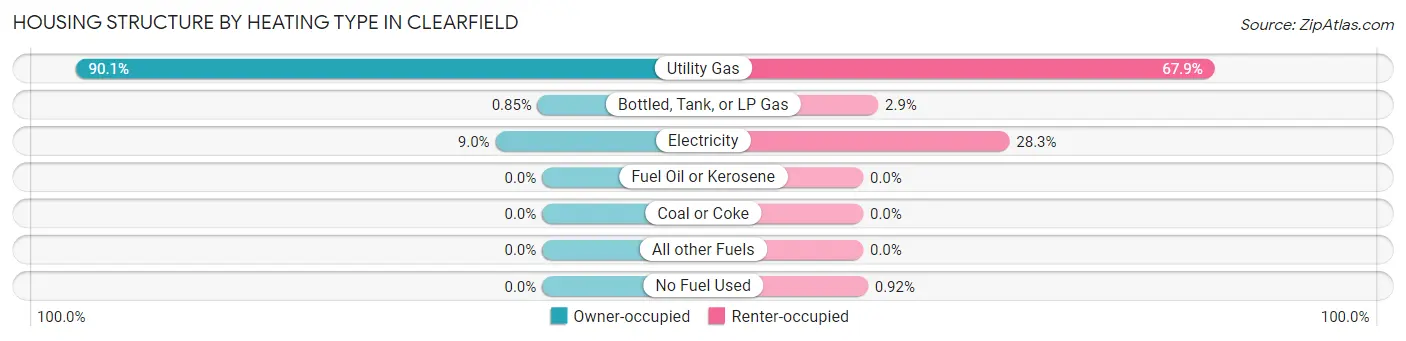
| Heating Type | Owner-occupied | Renter-occupied |
| Utility Gas | 5,617 (90.1%) | 3,015 (67.9%) |
| Bottled, Tank, or LP Gas | 53 (0.9%) | 129 (2.9%) |
| Electricity | 562 (9.0%) | 1,255 (28.3%) |
| Fuel Oil or Kerosene | 0 (0.0%) | 0 (0.0%) |
| Coal or Coke | 0 (0.0%) | 0 (0.0%) |
| All other Fuels | 0 (0.0%) | 0 (0.0%) |
| No Fuel Used | 0 (0.0%) | 41 (0.9%) |
| Total | 6,232 (100.0%) | 4,440 (100.0%) |
Household Vehicle Usage in Clearfield
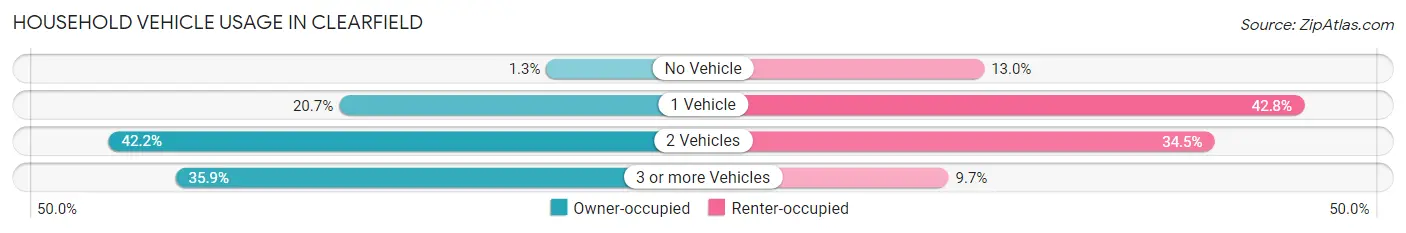
| Vehicles per Household | Owner-occupied | Renter-occupied |
| No Vehicle | 81 (1.3%) | 577 (13.0%) |
| 1 Vehicle | 1,287 (20.6%) | 1,902 (42.8%) |
| 2 Vehicles | 2,627 (42.1%) | 1,531 (34.5%) |
| 3 or more Vehicles | 2,237 (35.9%) | 430 (9.7%) |
| Total | 6,232 (100.0%) | 4,440 (100.0%) |
Real Estate & Mortgages in Clearfield
Real Estate and Mortgage Overview in Clearfield
| Characteristic | Without Mortgage | With Mortgage |
| Housing Units | 1,475 | 4,757 |
| Median Property Value | $220,900 | $318,400 |
| Median Household Income | $57,623 | $844 |
| Monthly Housing Costs | $361 | $10 |
| Real Estate Taxes | $1,317 | $234 |
Property Value by Mortgage Status in Clearfield
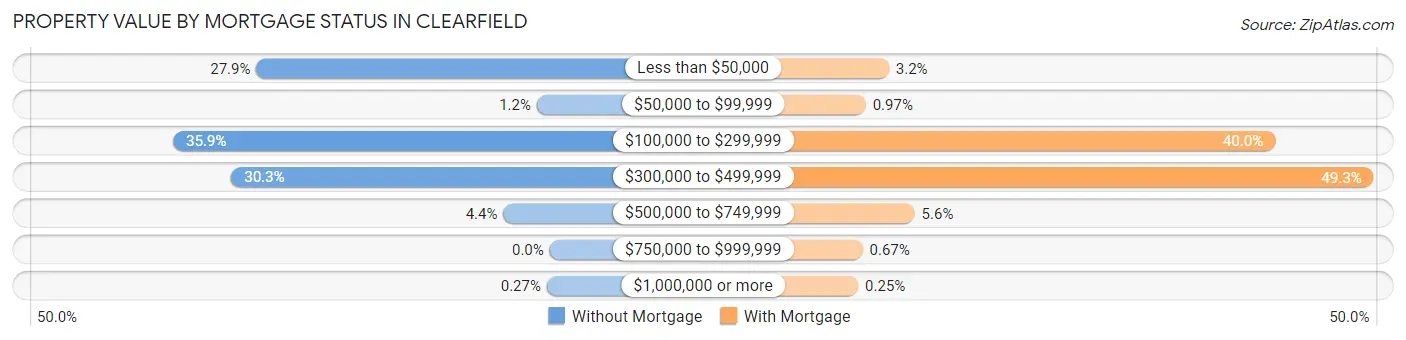
| Property Value | Without Mortgage | With Mortgage |
| Less than $50,000 | 412 (27.9%) | 151 (3.2%) |
| $50,000 to $99,999 | 18 (1.2%) | 46 (1.0%) |
| $100,000 to $299,999 | 529 (35.9%) | 1,901 (40.0%) |
| $300,000 to $499,999 | 447 (30.3%) | 2,347 (49.3%) |
| $500,000 to $749,999 | 65 (4.4%) | 268 (5.6%) |
| $750,000 to $999,999 | 0 (0.0%) | 32 (0.7%) |
| $1,000,000 or more | 4 (0.3%) | 12 (0.3%) |
| Total | 1,475 (100.0%) | 4,757 (100.0%) |
Household Income by Mortgage Status in Clearfield
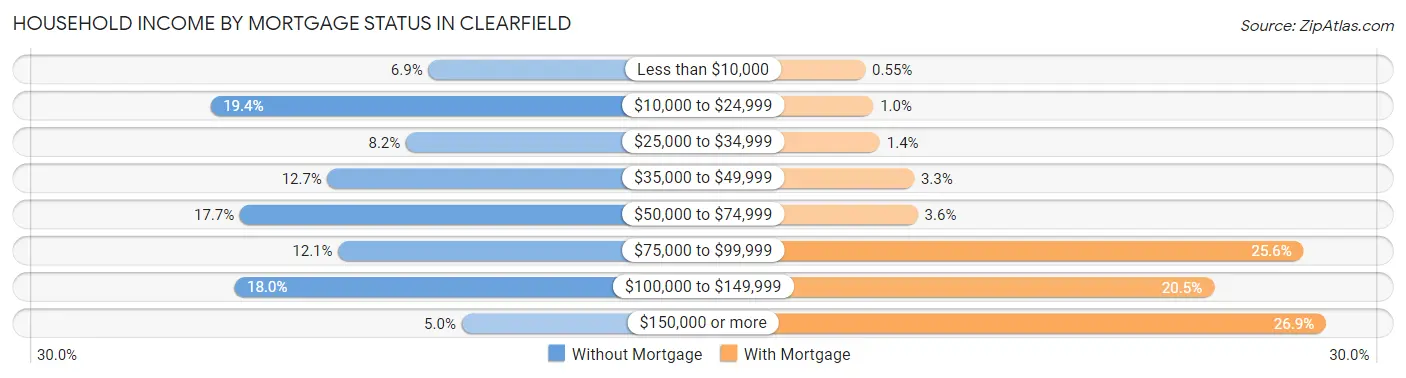
| Household Income | Without Mortgage | With Mortgage |
| Less than $10,000 | 102 (6.9%) | 26 (0.5%) |
| $10,000 to $24,999 | 286 (19.4%) | 48 (1.0%) |
| $25,000 to $34,999 | 121 (8.2%) | 66 (1.4%) |
| $35,000 to $49,999 | 187 (12.7%) | 159 (3.3%) |
| $50,000 to $74,999 | 261 (17.7%) | 169 (3.5%) |
| $75,000 to $99,999 | 178 (12.1%) | 1,218 (25.6%) |
| $100,000 to $149,999 | 266 (18.0%) | 974 (20.5%) |
| $150,000 or more | 74 (5.0%) | 1,279 (26.9%) |
| Total | 1,475 (100.0%) | 4,757 (100.0%) |
Property Value to Household Income Ratio in Clearfield
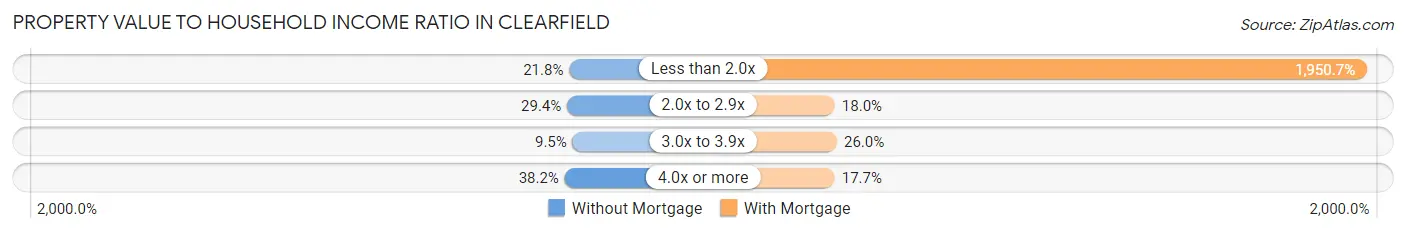
| Value-to-Income Ratio | Without Mortgage | With Mortgage |
| Less than 2.0x | 322 (21.8%) | 92,794 (1,950.7%) |
| 2.0x to 2.9x | 434 (29.4%) | 857 (18.0%) |
| 3.0x to 3.9x | 140 (9.5%) | 1,235 (26.0%) |
| 4.0x or more | 563 (38.2%) | 844 (17.7%) |
| Total | 1,475 (100.0%) | 4,757 (100.0%) |
Real Estate Taxes by Mortgage Status in Clearfield
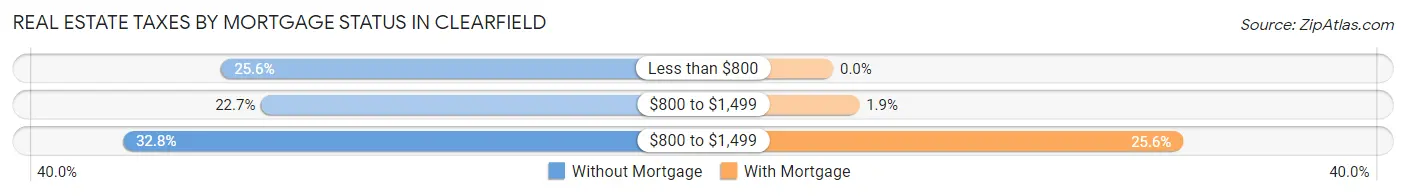
| Property Taxes | Without Mortgage | With Mortgage |
| Less than $800 | 378 (25.6%) | 0 (0.0%) |
| $800 to $1,499 | 335 (22.7%) | 91 (1.9%) |
| $800 to $1,499 | 484 (32.8%) | 1,217 (25.6%) |
| Total | 1,475 (100.0%) | 4,757 (100.0%) |
Health & Disability in Clearfield
Health Insurance Coverage by Age in Clearfield
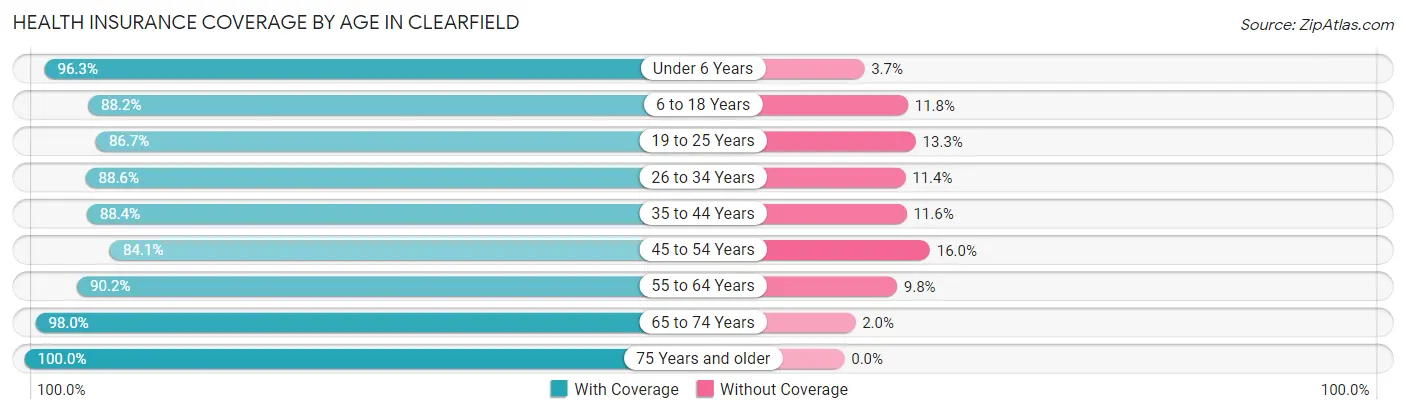
| Age Bracket | With Coverage | Without Coverage |
| Under 6 Years | 3,829 (96.3%) | 148 (3.7%) |
| 6 to 18 Years | 5,430 (88.2%) | 729 (11.8%) |
| 19 to 25 Years | 3,047 (86.7%) | 468 (13.3%) |
| 26 to 34 Years | 4,393 (88.6%) | 564 (11.4%) |
| 35 to 44 Years | 4,048 (88.4%) | 531 (11.6%) |
| 45 to 54 Years | 2,729 (84.1%) | 518 (16.0%) |
| 55 to 64 Years | 2,356 (90.2%) | 256 (9.8%) |
| 65 to 74 Years | 1,304 (98.0%) | 27 (2.0%) |
| 75 Years and older | 811 (100.0%) | 0 (0.0%) |
| Total | 27,947 (89.6%) | 3,241 (10.4%) |
Health Insurance Coverage by Citizenship Status in Clearfield
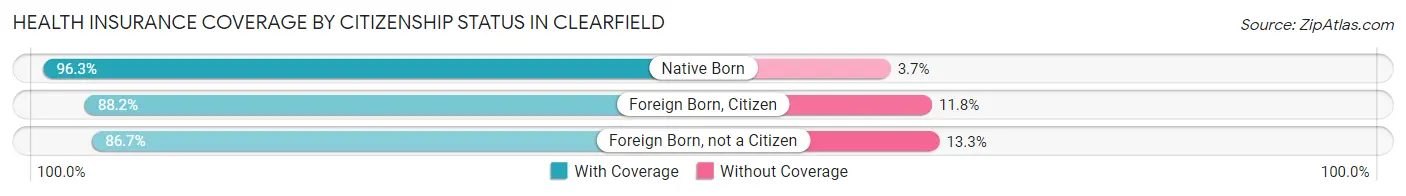
| Citizenship Status | With Coverage | Without Coverage |
| Native Born | 3,829 (96.3%) | 148 (3.7%) |
| Foreign Born, Citizen | 5,430 (88.2%) | 729 (11.8%) |
| Foreign Born, not a Citizen | 3,047 (86.7%) | 468 (13.3%) |
Health Insurance Coverage by Household Income in Clearfield
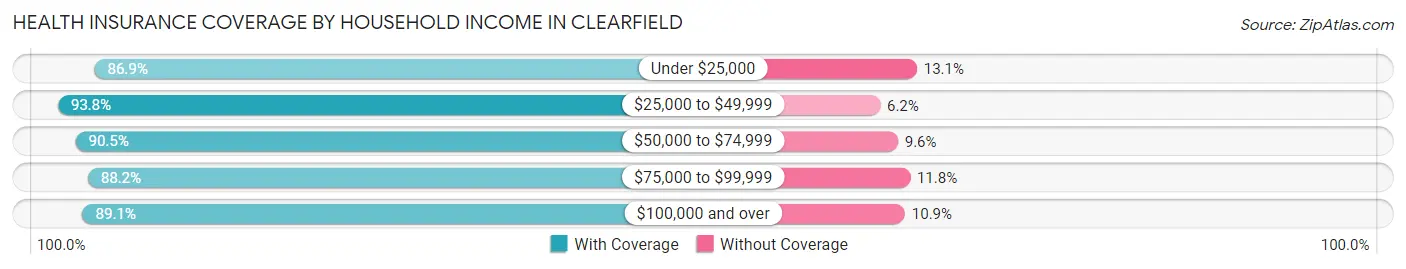
| Household Income | With Coverage | Without Coverage |
| Under $25,000 | 2,485 (86.9%) | 375 (13.1%) |
| $25,000 to $49,999 | 4,016 (93.8%) | 267 (6.2%) |
| $50,000 to $74,999 | 5,787 (90.4%) | 611 (9.6%) |
| $75,000 to $99,999 | 5,251 (88.2%) | 705 (11.8%) |
| $100,000 and over | 10,213 (89.1%) | 1,247 (10.9%) |
Public vs Private Health Insurance Coverage by Age in Clearfield
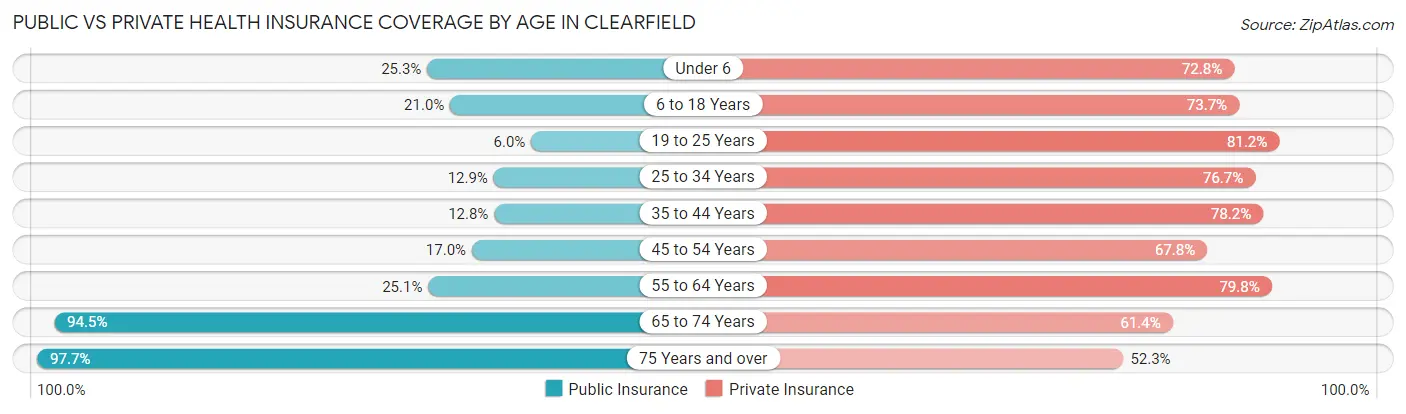
| Age Bracket | Public Insurance | Private Insurance |
| Under 6 | 1,005 (25.3%) | 2,895 (72.8%) |
| 6 to 18 Years | 1,294 (21.0%) | 4,539 (73.7%) |
| 19 to 25 Years | 210 (6.0%) | 2,853 (81.2%) |
| 25 to 34 Years | 641 (12.9%) | 3,802 (76.7%) |
| 35 to 44 Years | 588 (12.8%) | 3,580 (78.2%) |
| 45 to 54 Years | 551 (17.0%) | 2,201 (67.8%) |
| 55 to 64 Years | 655 (25.1%) | 2,083 (79.7%) |
| 65 to 74 Years | 1,258 (94.5%) | 817 (61.4%) |
| 75 Years and over | 792 (97.7%) | 424 (52.3%) |
| Total | 6,994 (22.4%) | 23,194 (74.4%) |
Disability Status by Sex by Age in Clearfield
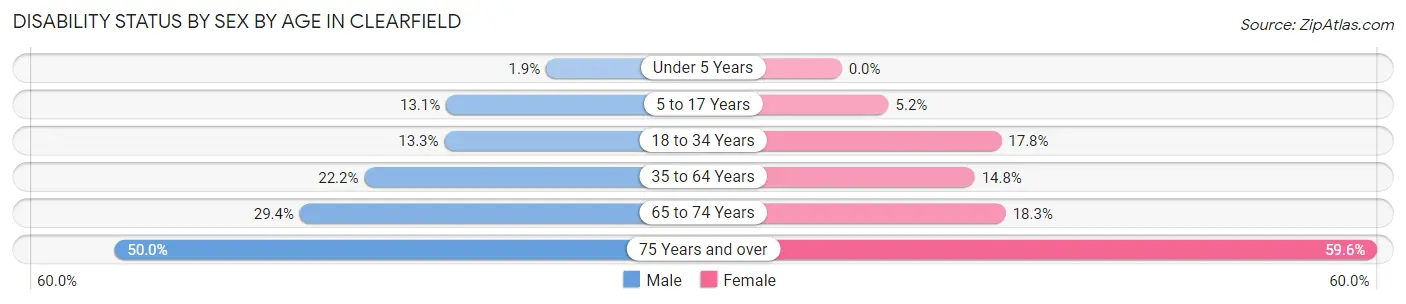
| Age Bracket | Male | Female |
| Under 5 Years | 35 (1.9%) | 0 (0.0%) |
| 5 to 17 Years | 391 (13.1%) | 155 (5.2%) |
| 18 to 34 Years | 608 (13.3%) | 816 (17.8%) |
| 35 to 64 Years | 1,195 (22.2%) | 747 (14.8%) |
| 65 to 74 Years | 209 (29.3%) | 113 (18.3%) |
| 75 Years and over | 159 (50.0%) | 294 (59.6%) |
Disability Class by Sex by Age in Clearfield
Disability Class: Hearing Difficulty
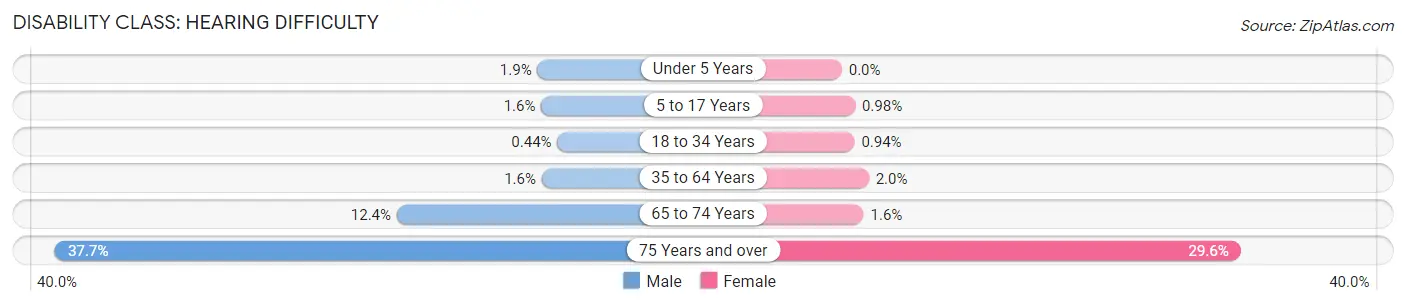
| Age Bracket | Male | Female |
| Under 5 Years | 35 (1.9%) | 0 (0.0%) |
| 5 to 17 Years | 49 (1.6%) | 29 (1.0%) |
| 18 to 34 Years | 20 (0.4%) | 43 (0.9%) |
| 35 to 64 Years | 86 (1.6%) | 101 (2.0%) |
| 65 to 74 Years | 88 (12.4%) | 10 (1.6%) |
| 75 Years and over | 120 (37.7%) | 146 (29.6%) |
Disability Class: Vision Difficulty
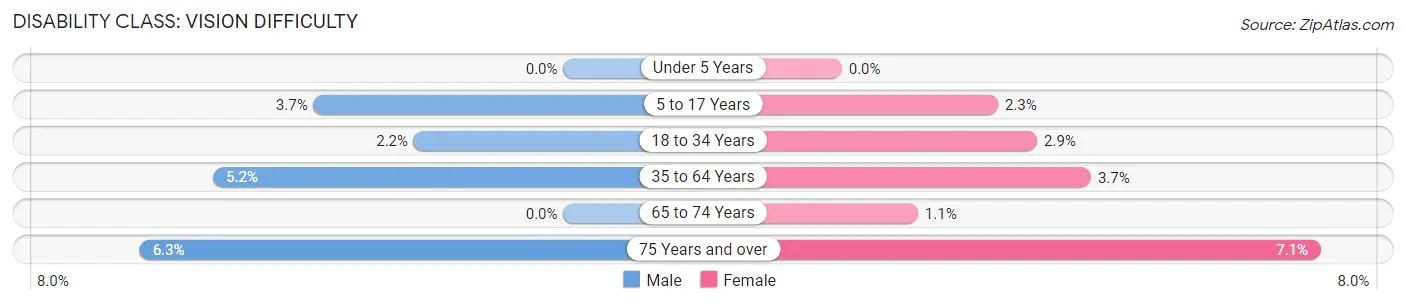
| Age Bracket | Male | Female |
| Under 5 Years | 0 (0.0%) | 0 (0.0%) |
| 5 to 17 Years | 111 (3.7%) | 69 (2.3%) |
| 18 to 34 Years | 102 (2.2%) | 133 (2.9%) |
| 35 to 64 Years | 280 (5.2%) | 187 (3.7%) |
| 65 to 74 Years | 0 (0.0%) | 7 (1.1%) |
| 75 Years and over | 20 (6.3%) | 35 (7.1%) |
Disability Class: Cognitive Difficulty
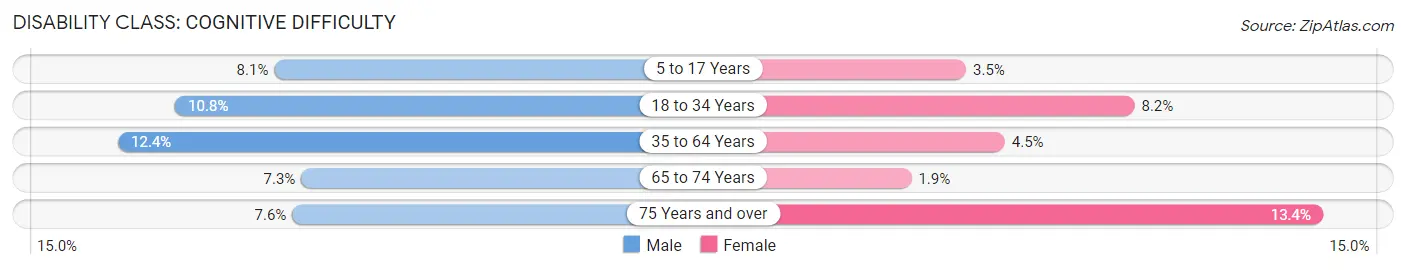
| Age Bracket | Male | Female |
| 5 to 17 Years | 241 (8.1%) | 103 (3.5%) |
| 18 to 34 Years | 496 (10.8%) | 374 (8.2%) |
| 35 to 64 Years | 668 (12.4%) | 229 (4.5%) |
| 65 to 74 Years | 52 (7.3%) | 12 (1.9%) |
| 75 Years and over | 24 (7.5%) | 66 (13.4%) |
Disability Class: Ambulatory Difficulty
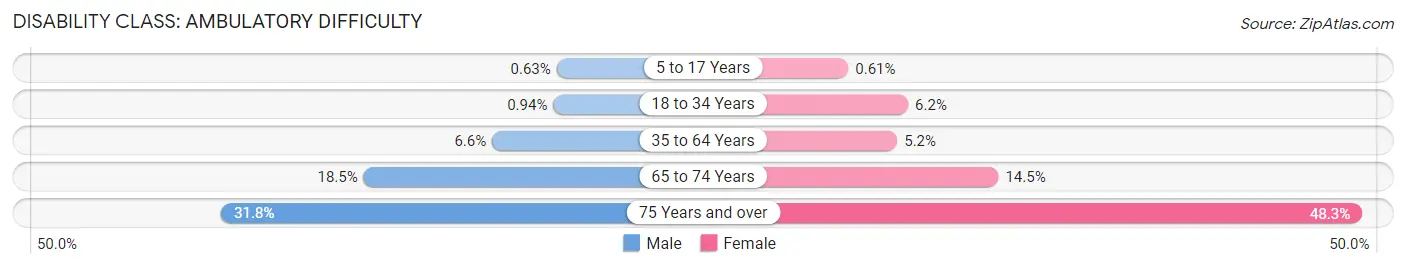
| Age Bracket | Male | Female |
| 5 to 17 Years | 19 (0.6%) | 18 (0.6%) |
| 18 to 34 Years | 43 (0.9%) | 283 (6.2%) |
| 35 to 64 Years | 357 (6.6%) | 260 (5.1%) |
| 65 to 74 Years | 132 (18.5%) | 90 (14.5%) |
| 75 Years and over | 101 (31.8%) | 238 (48.3%) |
Disability Class: Self-Care Difficulty
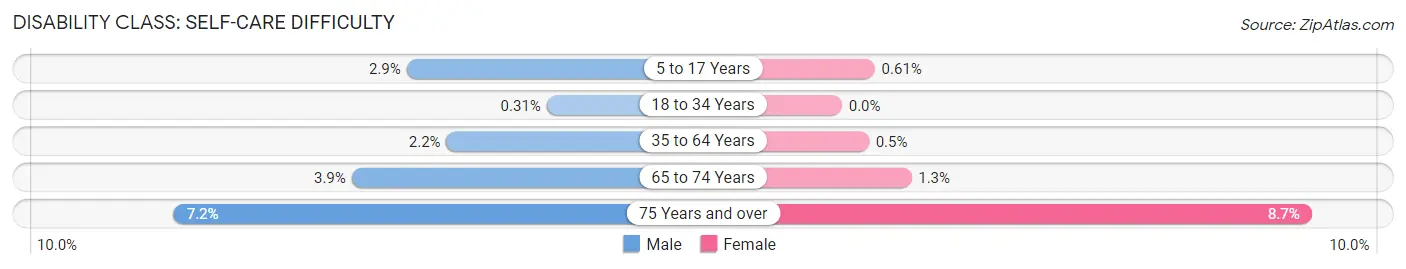
| Age Bracket | Male | Female |
| 5 to 17 Years | 87 (2.9%) | 18 (0.6%) |
| 18 to 34 Years | 14 (0.3%) | 0 (0.0%) |
| 35 to 64 Years | 117 (2.2%) | 25 (0.5%) |
| 65 to 74 Years | 28 (3.9%) | 8 (1.3%) |
| 75 Years and over | 23 (7.2%) | 43 (8.7%) |
Technology Access in Clearfield
Computing Device Access in Clearfield
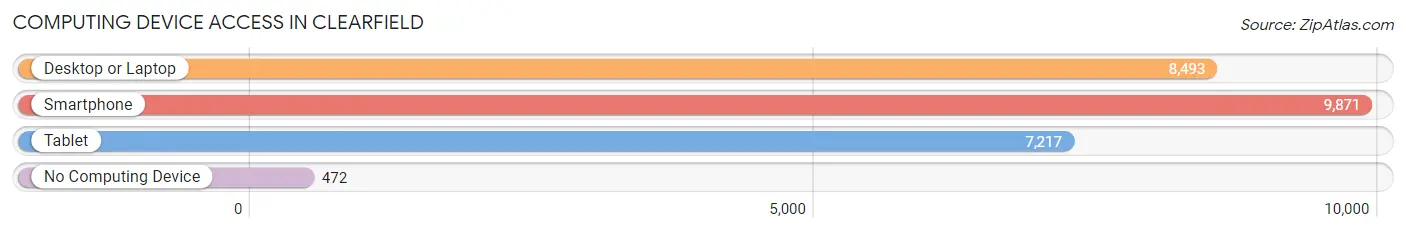
| Device Type | # Households | % Households |
| Desktop or Laptop | 8,493 | 79.6% |
| Smartphone | 9,871 | 92.5% |
| Tablet | 7,217 | 67.6% |
| No Computing Device | 472 | 4.4% |
| Total | 10,672 | 100.0% |
Internet Access in Clearfield
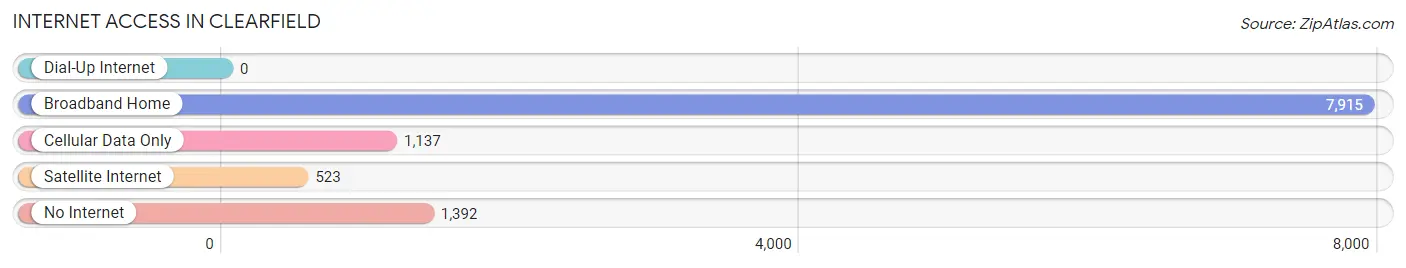
| Internet Type | # Households | % Households |
| Dial-Up Internet | 0 | 0.0% |
| Broadband Home | 7,915 | 74.2% |
| Cellular Data Only | 1,137 | 10.6% |
| Satellite Internet | 523 | 4.9% |
| No Internet | 1,392 | 13.0% |
| Total | 10,672 | 100.0% |
Clearfield Summary
History
The area now known as Clearfield, Utah was first inhabited by the Shoshone and Ute Native American tribes. The first non-Native American settlers arrived in the area in 1851, when a group of Mormon pioneers led by James Brown established a settlement in the area. The settlement was originally known as Brownsville, but was later renamed Clearfield in 1877.
The town of Clearfield was officially incorporated in 1891. During the early years of its existence, Clearfield was primarily an agricultural community, with the majority of its residents working in the farming and ranching industries. The town also had a thriving lumber industry, with several sawmills located in the area.
In the early 20th century, Clearfield began to experience a period of rapid growth and development. The town was connected to the rest of the state by the Utah Central Railroad in 1910, and the Clearfield Naval Supply Depot was established in 1942. The depot was a major employer in the area, and it helped to spur the growth of the local economy.
Geography
Clearfield is located in northern Utah, approximately 30 miles north of Salt Lake City. The city is situated in Davis County, and it is bordered by the cities of Layton, West Point, and Sunset. Clearfield is located at an elevation of 4,400 feet, and it covers an area of approximately 10 square miles.
The city is situated in a semi-arid climate zone, and it experiences hot summers and cold winters. The average annual temperature in Clearfield is approximately 50 degrees Fahrenheit, and the average annual precipitation is approximately 15 inches.
Economy
Clearfield’s economy is largely based on the military and defense industries. The city is home to the Clearfield Naval Supply Depot, which is a major employer in the area. The depot is responsible for supplying the US Navy with a variety of goods and services, including food, fuel, and ammunition.
In addition to the military and defense industries, Clearfield is also home to a variety of other businesses and industries. The city is home to several manufacturing companies, as well as a number of retail stores and restaurants. The city is also home to several technology companies, including the software development firm Novell.
Demographics
As of the 2010 census, the population of Clearfield was 30,112. The city has a population density of approximately 3,000 people per square mile. The median age in Clearfield is 28.7 years, and the median household income is $60,945.
The racial makeup of Clearfield is predominantly white, with approximately 83.3% of the population identifying as white. Other racial groups include African American (4.2%), Asian (3.2%), and Hispanic or Latino (7.3%). The city also has a large Mormon population, with approximately 60% of the population identifying as members of the Church of Jesus Christ of Latter-day Saints.
Common Questions
What is Per Capita Income in Clearfield?
Per Capita income in Clearfield is $28,203.
What is the Median Family Income in Clearfield?
Median Family Income in Clearfield is $81,162.
What is the Median Household income in Clearfield?
Median Household Income in Clearfield is $69,889.
What is Income or Wage Gap in Clearfield?
Income or Wage Gap in Clearfield is 40.1%.
Women in Clearfield earn 59.9 cents for every dollar earned by a man.
What is Family Income Deficit in Clearfield?
Family Income Deficit in Clearfield is $10,769.
Families that are below poverty line in Clearfield earn $10,769 less on average than the poverty threshold level.
What is Inequality or Gini Index in Clearfield?
Inequality or Gini Index in Clearfield is 0.37.
What is the Total Population of Clearfield?
Total Population of Clearfield is 32,369.
What is the Total Male Population of Clearfield?
Total Male Population of Clearfield is 16,752.
What is the Total Female Population of Clearfield?
Total Female Population of Clearfield is 15,617.
What is the Ratio of Males per 100 Females in Clearfield?
There are 107.27 Males per 100 Females in Clearfield.
What is the Ratio of Females per 100 Males in Clearfield?
There are 93.22 Females per 100 Males in Clearfield.
What is the Median Population Age in Clearfield?
Median Population Age in Clearfield is 29.8 Years.
What is the Average Family Size in Clearfield
Average Family Size in Clearfield is 3.6 People.
What is the Average Household Size in Clearfield
Average Household Size in Clearfield is 3.0 People.
How Large is the Labor Force in Clearfield?
There are 16,479 People in the Labor Forcein in Clearfield.
What is the Percentage of People in the Labor Force in Clearfield?
69.9% of People are in the Labor Force in Clearfield.
What is the Unemployment Rate in Clearfield?
Unemployment Rate in Clearfield is 3.0%.