Roosevelt, UT Map & Demographics
Roosevelt Map
Roosevelt Overview
$28,828
PER CAPITA INCOME
$78,287
AVG FAMILY INCOME
$66,552
AVG HOUSEHOLD INCOME
62.8%
WAGE / INCOME GAP [ % ]
37.2¢/ $1
WAGE / INCOME GAP [ $ ]
$13,208
FAMILY INCOME DEFICIT
0.46
INEQUALITY / GINI INDEX
6,884
TOTAL POPULATION
3,494
MALE POPULATION
3,390
FEMALE POPULATION
103.07
MALES / 100 FEMALES
97.02
FEMALES / 100 MALES
28.7
MEDIAN AGE
3.6
AVG FAMILY SIZE
3.0
AVG HOUSEHOLD SIZE
3,044
LABOR FORCE [ PEOPLE ]
65.1%
PERCENT IN LABOR FORCE
6.8%
UNEMPLOYMENT RATE
Roosevelt Zip Codes
Roosevelt Area Codes
Income in Roosevelt
Income Overview in Roosevelt
Per Capita Income in Roosevelt is $28,828, while median incomes of families and households are $78,287 and $66,552 respectively.
| Characteristic | Number | Measure |
| Per Capita Income | 6,884 | $28,828 |
| Median Family Income | 1,669 | $78,287 |
| Mean Family Income | 1,669 | $95,476 |
| Median Household Income | 2,245 | $66,552 |
| Mean Household Income | 2,245 | $86,582 |
| Income Deficit | 1,669 | $13,208 |
| Wage / Income Gap (%) | 6,884 | 62.83% |
| Wage / Income Gap ($) | 6,884 | 37.17¢ per $1 |
| Gini / Inequality Index | 6,884 | 0.46 |
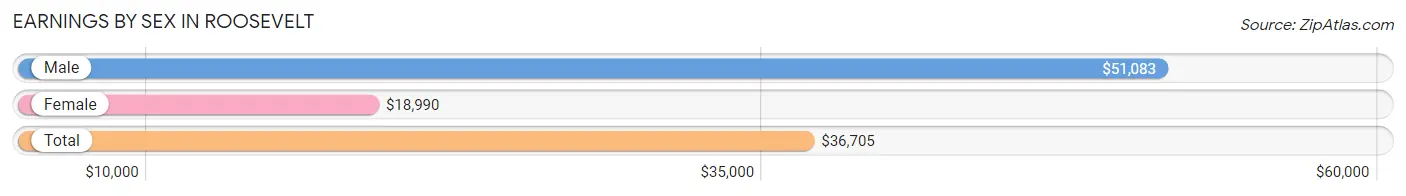
Earnings by Sex in Roosevelt
Average Earnings in Roosevelt are $36,705, $51,083 for men and $18,990 for women, a difference of 62.8%.
| Sex | Number | Average Earnings |
| Male | 1,936 (60.1%) | $51,083 |
| Female | 1,284 (39.9%) | $18,990 |
| Total | 3,220 (100.0%) | $36,705 |
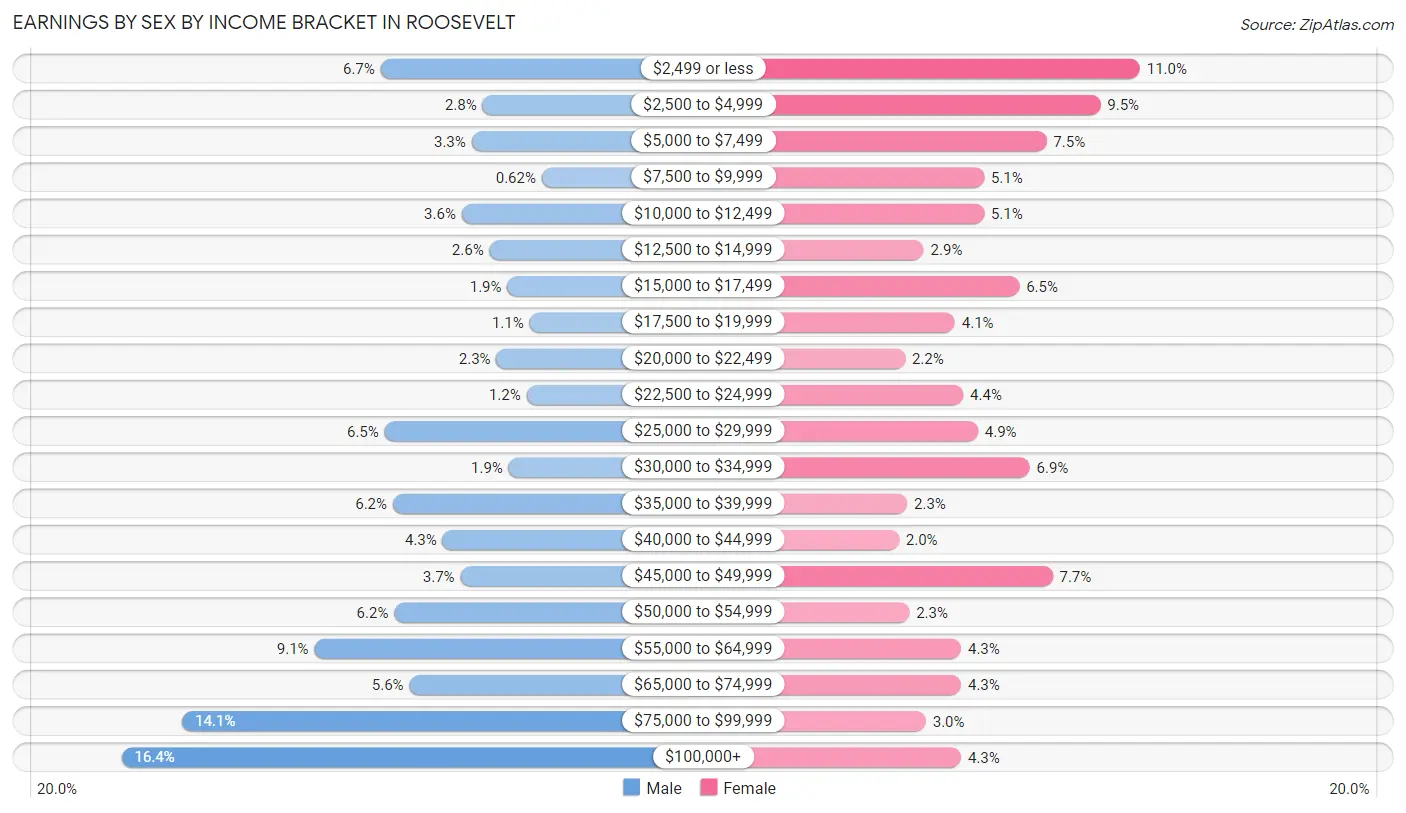
Earnings by Sex by Income Bracket in Roosevelt
The most common earnings brackets in Roosevelt are $100,000+ for men (317 | 16.4%) and $2,499 or less for women (141 | 11.0%).
| Income | Male | Female |
| $2,499 or less | 129 (6.7%) | 141 (11.0%) |
| $2,500 to $4,999 | 55 (2.8%) | 122 (9.5%) |
| $5,000 to $7,499 | 63 (3.3%) | 96 (7.5%) |
| $7,500 to $9,999 | 12 (0.6%) | 66 (5.1%) |
| $10,000 to $12,499 | 70 (3.6%) | 66 (5.1%) |
| $12,500 to $14,999 | 50 (2.6%) | 37 (2.9%) |
| $15,000 to $17,499 | 37 (1.9%) | 83 (6.5%) |
| $17,500 to $19,999 | 21 (1.1%) | 52 (4.1%) |
| $20,000 to $22,499 | 45 (2.3%) | 28 (2.2%) |
| $22,500 to $24,999 | 23 (1.2%) | 56 (4.4%) |
| $25,000 to $29,999 | 126 (6.5%) | 63 (4.9%) |
| $30,000 to $34,999 | 36 (1.9%) | 88 (6.9%) |
| $35,000 to $39,999 | 120 (6.2%) | 29 (2.3%) |
| $40,000 to $44,999 | 84 (4.3%) | 25 (1.9%) |
| $45,000 to $49,999 | 71 (3.7%) | 99 (7.7%) |
| $50,000 to $54,999 | 119 (6.1%) | 30 (2.3%) |
| $55,000 to $64,999 | 177 (9.1%) | 55 (4.3%) |
| $65,000 to $74,999 | 108 (5.6%) | 55 (4.3%) |
| $75,000 to $99,999 | 273 (14.1%) | 38 (3.0%) |
| $100,000+ | 317 (16.4%) | 55 (4.3%) |
| Total | 1,936 (100.0%) | 1,284 (100.0%) |
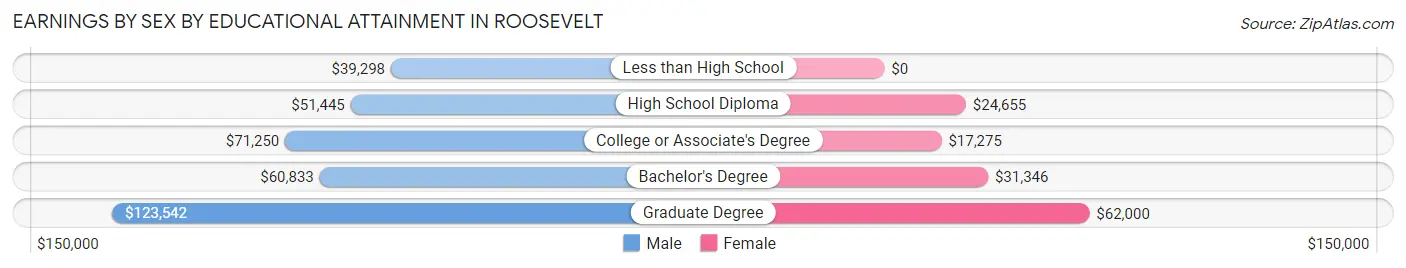
Earnings by Sex by Educational Attainment in Roosevelt
Average earnings in Roosevelt are $59,732 for men and $24,421 for women, a difference of 59.1%. Men with an educational attainment of graduate degree enjoy the highest average annual earnings of $123,542, while those with less than high school education earn the least with $39,298. Women with an educational attainment of graduate degree earn the most with the average annual earnings of $62,000, while those with college or associate's degree education have the smallest earnings of $17,275.
| Educational Attainment | Male Income | Female Income |
| Less than High School | $39,298 | $0 |
| High School Diploma | $51,445 | $24,655 |
| College or Associate's Degree | $71,250 | $17,275 |
| Bachelor's Degree | $60,833 | $31,346 |
| Graduate Degree | $123,542 | $62,000 |
| Total | $59,732 | $24,421 |
Family Income in Roosevelt
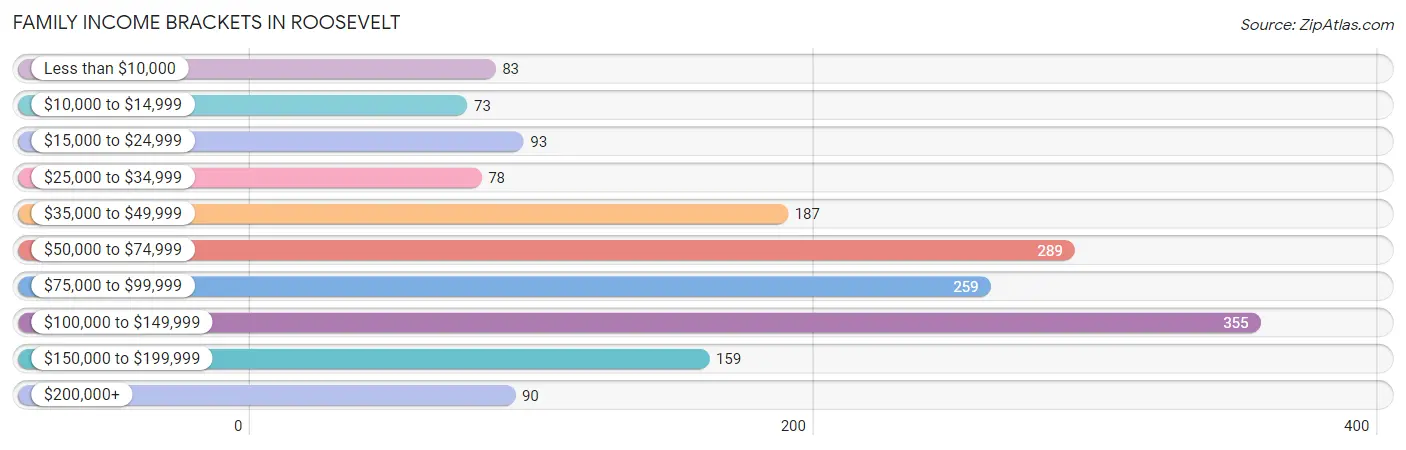
Family Income Brackets in Roosevelt
According to the Roosevelt family income data, there are 355 families falling into the $100,000 to $149,999 income range, which is the most common income bracket and makes up 21.3% of all families. Conversely, the $10,000 to $14,999 income bracket is the least frequent group with only 73 families (4.4%) belonging to this category.
| Income Bracket | # Families | % Families |
| Less than $10,000 | 83 | 5.0% |
| $10,000 to $14,999 | 73 | 4.4% |
| $15,000 to $24,999 | 93 | 5.6% |
| $25,000 to $34,999 | 78 | 4.7% |
| $35,000 to $49,999 | 187 | 11.2% |
| $50,000 to $74,999 | 289 | 17.3% |
| $75,000 to $99,999 | 259 | 15.5% |
| $100,000 to $149,999 | 355 | 21.3% |
| $150,000 to $199,999 | 159 | 9.5% |
| $200,000+ | 90 | 5.4% |
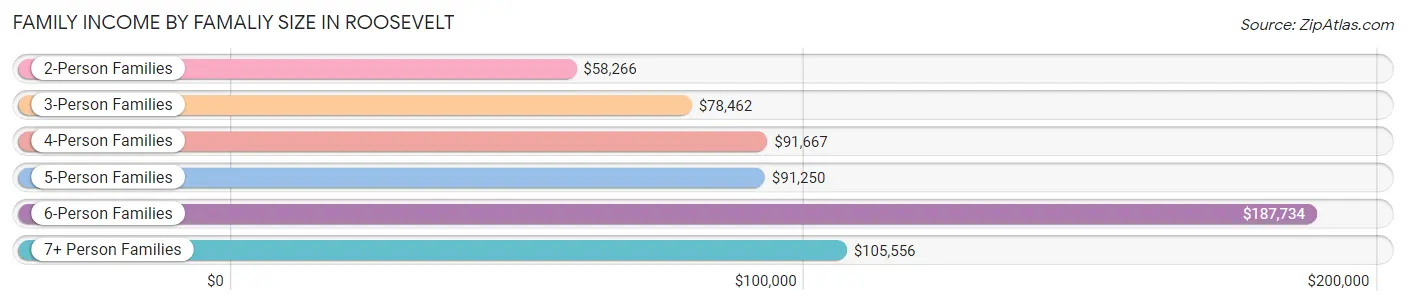
Family Income by Famaliy Size in Roosevelt
6-person families (87 | 5.2%) account for the highest median family income in Roosevelt with $187,734 per family, while 6-person families (87 | 5.2%) have the highest median income of $31,289 per family member.
| Income Bracket | # Families | Median Income |
| 2-Person Families | 601 (36.0%) | $58,266 |
| 3-Person Families | 294 (17.6%) | $78,462 |
| 4-Person Families | 360 (21.6%) | $91,667 |
| 5-Person Families | 207 (12.4%) | $91,250 |
| 6-Person Families | 87 (5.2%) | $187,734 |
| 7+ Person Families | 120 (7.2%) | $105,556 |
| Total | 1,669 (100.0%) | $78,287 |
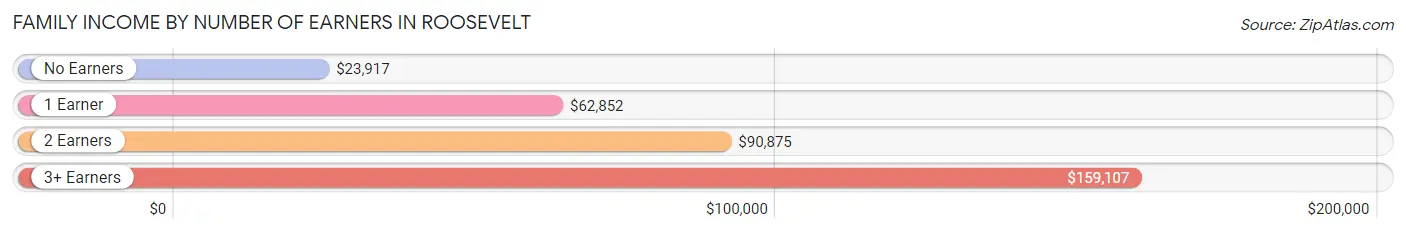
Family Income by Number of Earners in Roosevelt
The median family income in Roosevelt is $78,287, with families comprising 3+ earners (151) having the highest median family income of $159,107, while families with no earners (179) have the lowest median family income of $23,917, accounting for 9.0% and 10.7% of families, respectively.
| Number of Earners | # Families | Median Income |
| No Earners | 179 (10.7%) | $23,917 |
| 1 Earner | 559 (33.5%) | $62,852 |
| 2 Earners | 780 (46.7%) | $90,875 |
| 3+ Earners | 151 (9.0%) | $159,107 |
| Total | 1,669 (100.0%) | $78,287 |
Household Income in Roosevelt
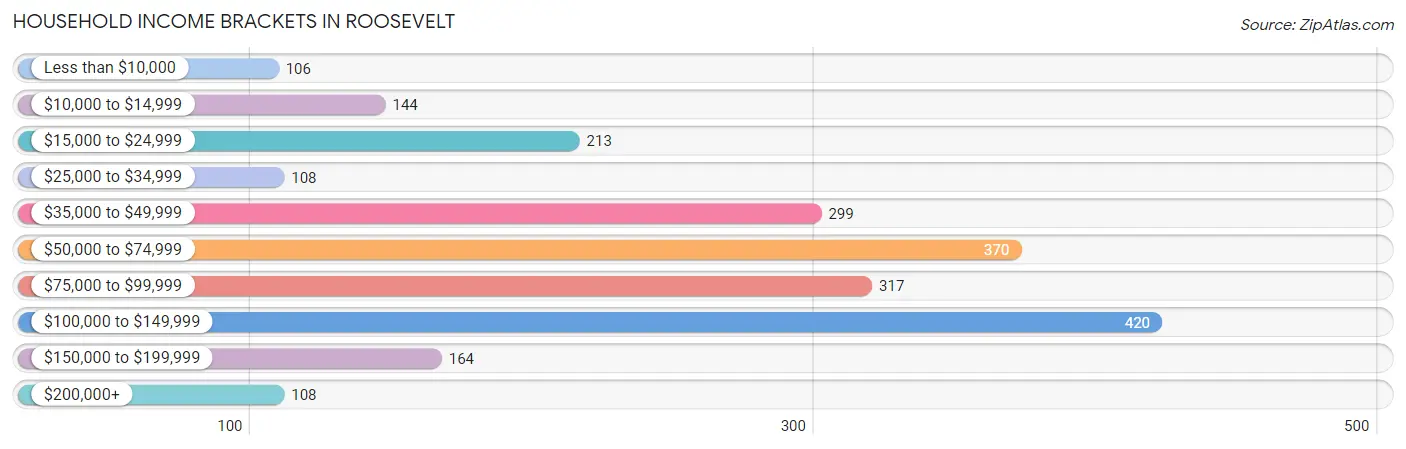
Household Income Brackets in Roosevelt
With 420 households falling in the category, the $100,000 to $149,999 income range is the most frequent in Roosevelt, accounting for 18.7% of all households. In contrast, only 106 households (4.7%) fall into the less than $10,000 income bracket, making it the least populous group.
| Income Bracket | # Households | % Households |
| Less than $10,000 | 106 | 4.7% |
| $10,000 to $14,999 | 144 | 6.4% |
| $15,000 to $24,999 | 213 | 9.5% |
| $25,000 to $34,999 | 108 | 4.8% |
| $35,000 to $49,999 | 299 | 13.3% |
| $50,000 to $74,999 | 370 | 16.5% |
| $75,000 to $99,999 | 317 | 14.1% |
| $100,000 to $149,999 | 420 | 18.7% |
| $150,000 to $199,999 | 164 | 7.3% |
| $200,000+ | 108 | 4.8% |
Household Income by Householder Age in Roosevelt
The median household income in Roosevelt is $66,552, with the highest median household income of $81,087 found in the 45 to 64 years age bracket for the primary householder. A total of 648 households (28.9%) fall into this category. Meanwhile, the 65+ years age bracket for the primary householder has the lowest median household income of $48,877, with 385 households (17.2%) in this group.
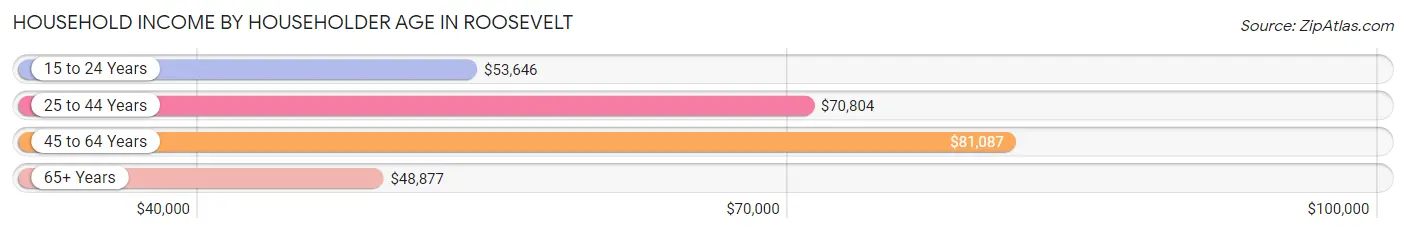
| Income Bracket | # Households | Median Income |
| 15 to 24 Years | 171 (7.6%) | $53,646 |
| 25 to 44 Years | 1,041 (46.4%) | $70,804 |
| 45 to 64 Years | 648 (28.9%) | $81,087 |
| 65+ Years | 385 (17.2%) | $48,877 |
| Total | 2,245 (100.0%) | $66,552 |
Poverty in Roosevelt
Income Below Poverty by Sex and Age in Roosevelt
With 16.2% poverty level for males and 20.2% for females among the residents of Roosevelt, under 5 year old males and 18 to 24 year old females are the most vulnerable to poverty, with 103 males (29.8%) and 124 females (33.0%) in their respective age groups living below the poverty level.
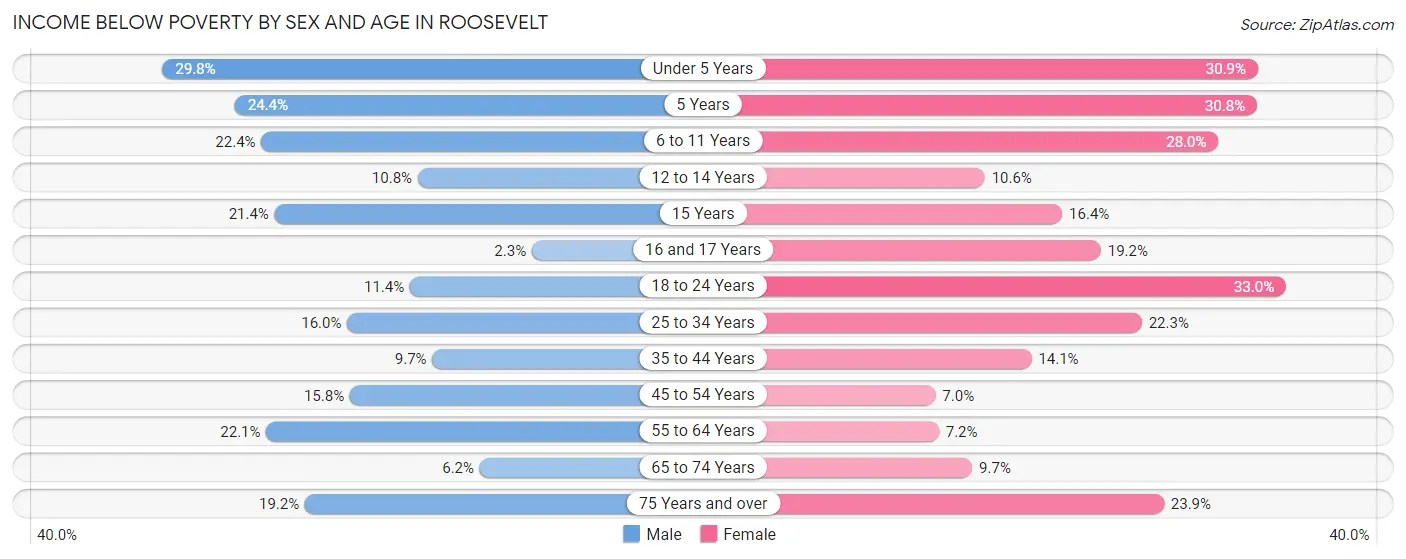
| Age Bracket | Male | Female |
| Under 5 Years | 103 (29.8%) | 97 (30.9%) |
| 5 Years | 20 (24.4%) | 37 (30.8%) |
| 6 to 11 Years | 89 (22.4%) | 123 (28.0%) |
| 12 to 14 Years | 23 (10.8%) | 19 (10.6%) |
| 15 Years | 6 (21.4%) | 9 (16.4%) |
| 16 and 17 Years | 2 (2.3%) | 15 (19.2%) |
| 18 to 24 Years | 38 (11.4%) | 124 (33.0%) |
| 25 to 34 Years | 102 (16.0%) | 104 (22.3%) |
| 35 to 44 Years | 45 (9.7%) | 68 (14.1%) |
| 45 to 54 Years | 51 (15.8%) | 21 (7.0%) |
| 55 to 64 Years | 58 (22.1%) | 19 (7.2%) |
| 65 to 74 Years | 15 (6.2%) | 15 (9.7%) |
| 75 Years and over | 14 (19.2%) | 22 (23.9%) |
| Total | 566 (16.2%) | 673 (20.2%) |
Income Above Poverty by Sex and Age in Roosevelt
According to the poverty statistics in Roosevelt, males aged 16 and 17 years and females aged 45 to 54 years are the age groups that are most secure financially, with 97.7% of males and 93.0% of females in these age groups living above the poverty line.
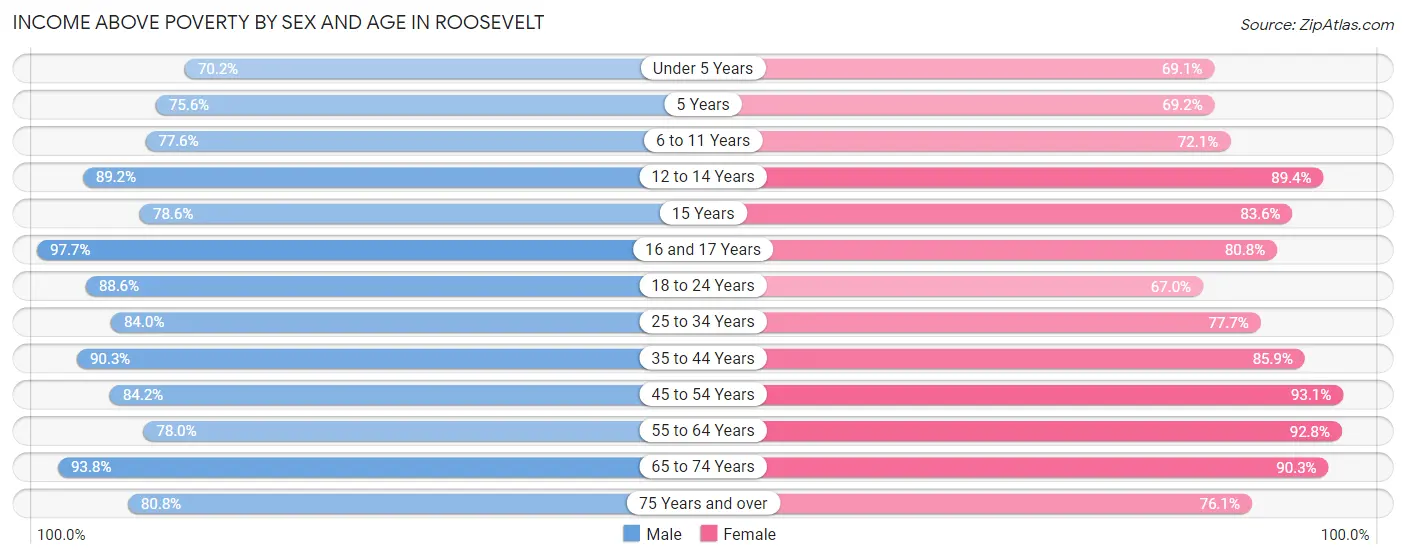
| Age Bracket | Male | Female |
| Under 5 Years | 243 (70.2%) | 217 (69.1%) |
| 5 Years | 62 (75.6%) | 83 (69.2%) |
| 6 to 11 Years | 308 (77.6%) | 317 (72.1%) |
| 12 to 14 Years | 190 (89.2%) | 160 (89.4%) |
| 15 Years | 22 (78.6%) | 46 (83.6%) |
| 16 and 17 Years | 84 (97.7%) | 63 (80.8%) |
| 18 to 24 Years | 296 (88.6%) | 252 (67.0%) |
| 25 to 34 Years | 534 (84.0%) | 363 (77.7%) |
| 35 to 44 Years | 418 (90.3%) | 415 (85.9%) |
| 45 to 54 Years | 271 (84.2%) | 281 (93.0%) |
| 55 to 64 Years | 205 (77.9%) | 245 (92.8%) |
| 65 to 74 Years | 227 (93.8%) | 140 (90.3%) |
| 75 Years and over | 59 (80.8%) | 70 (76.1%) |
| Total | 2,919 (83.8%) | 2,652 (79.8%) |
Income Below Poverty Among Married-Couple Families in Roosevelt
The poverty statistics for married-couple families in Roosevelt show that 8.3% or 105 of the total 1,272 families live below the poverty line. Families with 5 or more children have the highest poverty rate of 36.3%, comprising of 37 families. On the other hand, families with no children have the lowest poverty rate of 4.1%, which includes 20 families.
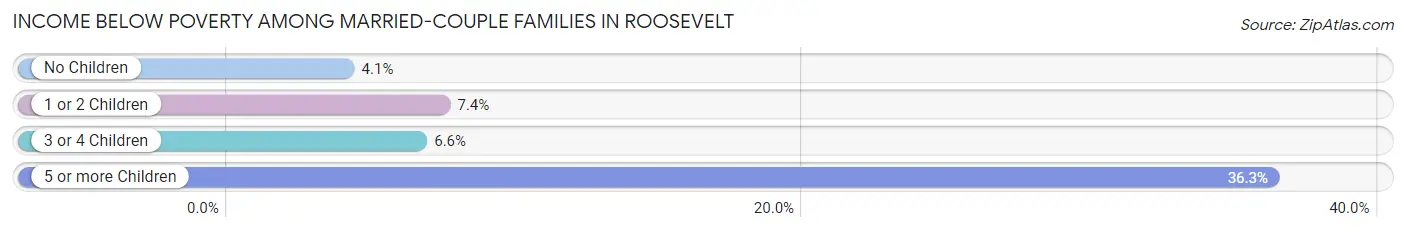
| Children | Above Poverty | Below Poverty |
| No Children | 473 (95.9%) | 20 (4.1%) |
| 1 or 2 Children | 388 (92.6%) | 31 (7.4%) |
| 3 or 4 Children | 241 (93.4%) | 17 (6.6%) |
| 5 or more Children | 65 (63.7%) | 37 (36.3%) |
| Total | 1,167 (91.7%) | 105 (8.3%) |
Income Below Poverty Among Single-Parent Households in Roosevelt
According to the poverty data in Roosevelt, 36.8% or 68 single-father households and 42.0% or 89 single-mother households are living below the poverty line. Among single-father households, those with 3 or 4 children have the highest poverty rate, with 23 households (85.2%) experiencing poverty. Likewise, among single-mother households, those with 3 or 4 children have the highest poverty rate, with 8 households (100.0%) falling below the poverty line.
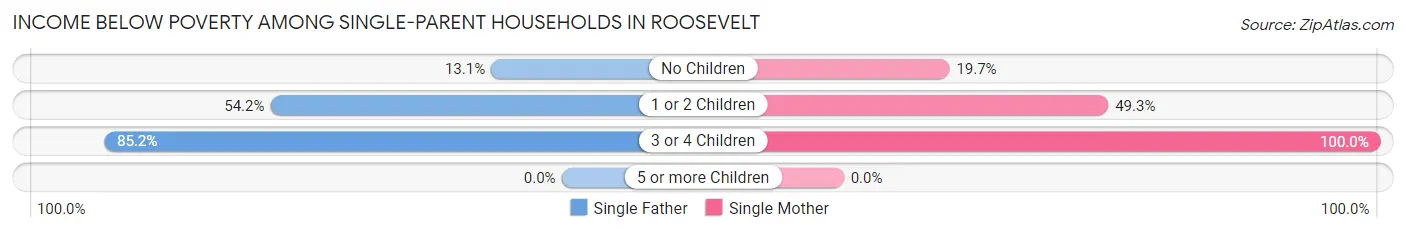
| Children | Single Father | Single Mother |
| No Children | 13 (13.1%) | 13 (19.7%) |
| 1 or 2 Children | 32 (54.2%) | 68 (49.3%) |
| 3 or 4 Children | 23 (85.2%) | 8 (100.0%) |
| 5 or more Children | 0 (0.0%) | 0 (0.0%) |
| Total | 68 (36.8%) | 89 (42.0%) |
Income Below Poverty Among Married-Couple vs Single-Parent Households in Roosevelt
The poverty data for Roosevelt shows that 105 of the married-couple family households (8.3%) and 157 of the single-parent households (39.6%) are living below the poverty level. Within the married-couple family households, those with 5 or more children have the highest poverty rate, with 37 households (36.3%) falling below the poverty line. Among the single-parent households, those with 3 or 4 children have the highest poverty rate, with 31 household (88.6%) living below poverty.
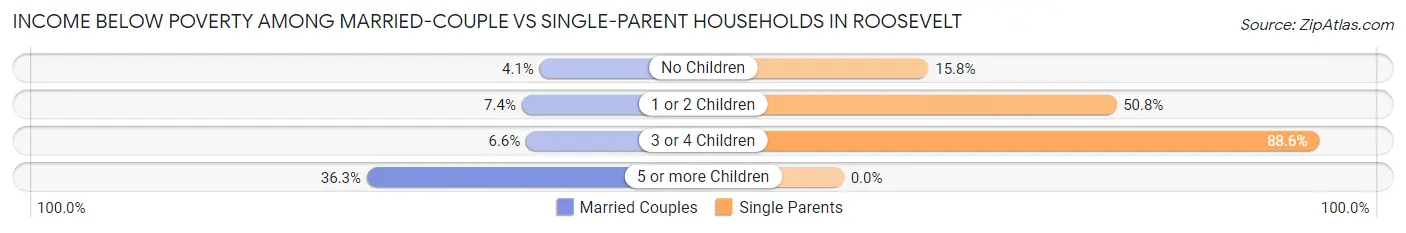
| Children | Married-Couple Families | Single-Parent Households |
| No Children | 20 (4.1%) | 26 (15.8%) |
| 1 or 2 Children | 31 (7.4%) | 100 (50.8%) |
| 3 or 4 Children | 17 (6.6%) | 31 (88.6%) |
| 5 or more Children | 37 (36.3%) | 0 (0.0%) |
| Total | 105 (8.3%) | 157 (39.6%) |
Race in Roosevelt
The most populous races in Roosevelt are White / Caucasian (5,562 | 80.8%), Hispanic or Latino (935 | 13.6%), and Two or more Races (502 | 7.3%).
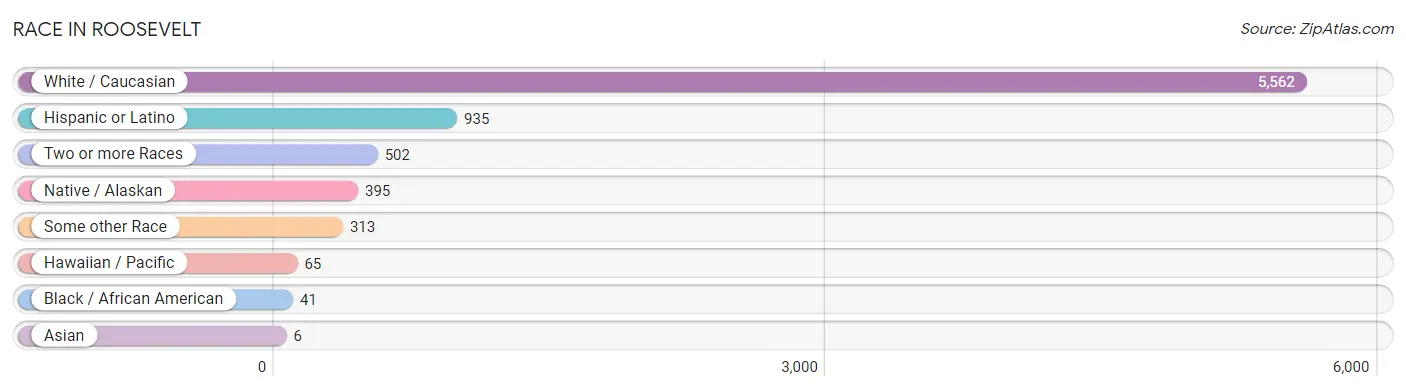
| Race | # Population | % Population |
| Asian | 6 | 0.1% |
| Black / African American | 41 | 0.6% |
| Hawaiian / Pacific | 65 | 0.9% |
| Hispanic or Latino | 935 | 13.6% |
| Native / Alaskan | 395 | 5.7% |
| White / Caucasian | 5,562 | 80.8% |
| Two or more Races | 502 | 7.3% |
| Some other Race | 313 | 4.5% |
| Total | 6,884 | 100.0% |
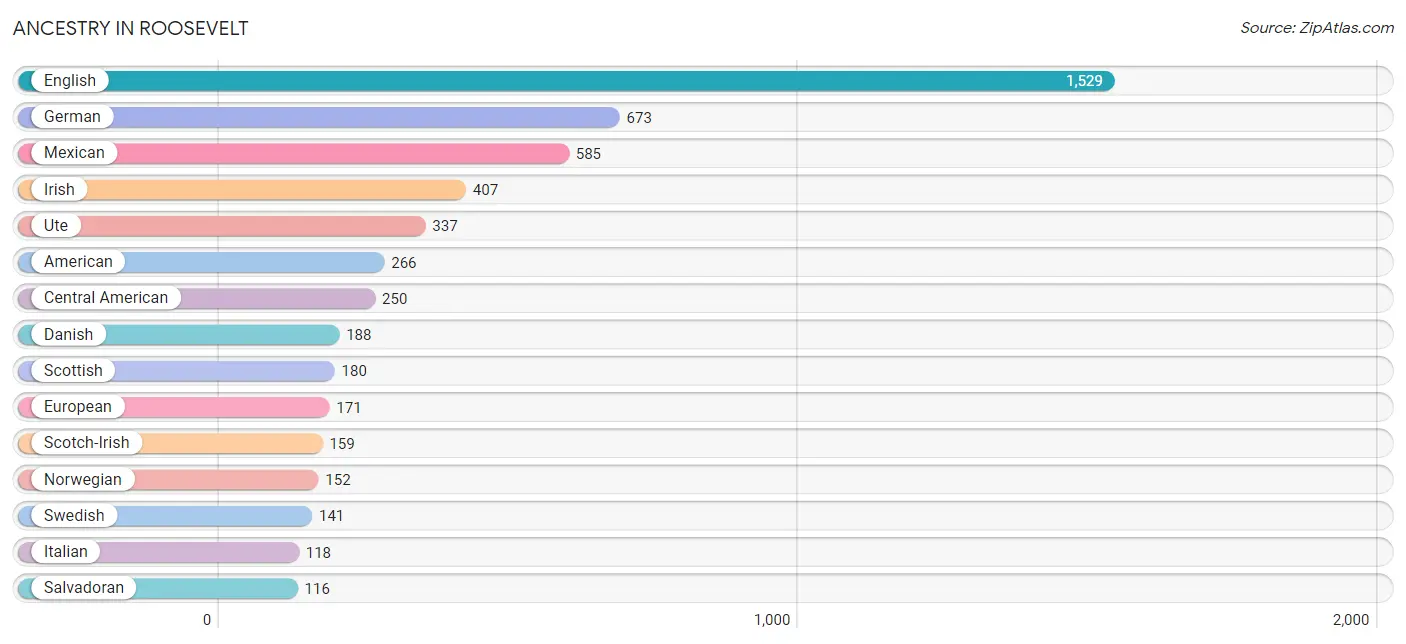
Ancestry in Roosevelt
The most populous ancestries reported in Roosevelt are English (1,529 | 22.2%), German (673 | 9.8%), Mexican (585 | 8.5%), Irish (407 | 5.9%), and Ute (337 | 4.9%), together accounting for 51.3% of all Roosevelt residents.
| Ancestry | # Population | % Population |
| Alaska Native | 6 | 0.1% |
| American | 266 | 3.9% |
| Blackfeet | 8 | 0.1% |
| Brazilian | 39 | 0.6% |
| British | 35 | 0.5% |
| Burmese | 19 | 0.3% |
| Central American | 250 | 3.6% |
| Cherokee | 51 | 0.7% |
| Chilean | 2 | 0.0% |
| Cree | 11 | 0.2% |
| Cuban | 27 | 0.4% |
| Danish | 188 | 2.7% |
| Dutch | 67 | 1.0% |
| English | 1,529 | 22.2% |
| European | 171 | 2.5% |
| Finnish | 14 | 0.2% |
| French | 66 | 1.0% |
| French Canadian | 10 | 0.2% |
| German | 673 | 9.8% |
| Greek | 7 | 0.1% |
| Guatemalan | 102 | 1.5% |
| Honduran | 32 | 0.5% |
| Hungarian | 22 | 0.3% |
| Indian (Asian) | 45 | 0.6% |
| Irish | 407 | 5.9% |
| Italian | 118 | 1.7% |
| Mexican | 585 | 8.5% |
| Native Hawaiian | 45 | 0.6% |
| Navajo | 57 | 0.8% |
| Northern European | 41 | 0.6% |
| Norwegian | 152 | 2.2% |
| Paiute | 59 | 0.9% |
| Peruvian | 5 | 0.1% |
| Pima | 22 | 0.3% |
| Polish | 66 | 1.0% |
| Puerto Rican | 16 | 0.2% |
| Russian | 10 | 0.2% |
| Salvadoran | 116 | 1.7% |
| Samoan | 2 | 0.0% |
| Scandinavian | 7 | 0.1% |
| Scotch-Irish | 159 | 2.3% |
| Scottish | 180 | 2.6% |
| South American | 7 | 0.1% |
| South American Indian | 2 | 0.0% |
| Spanish | 11 | 0.2% |
| Swedish | 141 | 2.1% |
| Swiss | 20 | 0.3% |
| Tohono O'Odham | 6 | 0.1% |
| Tongan | 58 | 0.8% |
| Ukrainian | 7 | 0.1% |
| Ute | 337 | 4.9% |
| Welsh | 115 | 1.7% |
| Yuman | 4 | 0.1% | View All 53 Rows |
Immigrants in Roosevelt
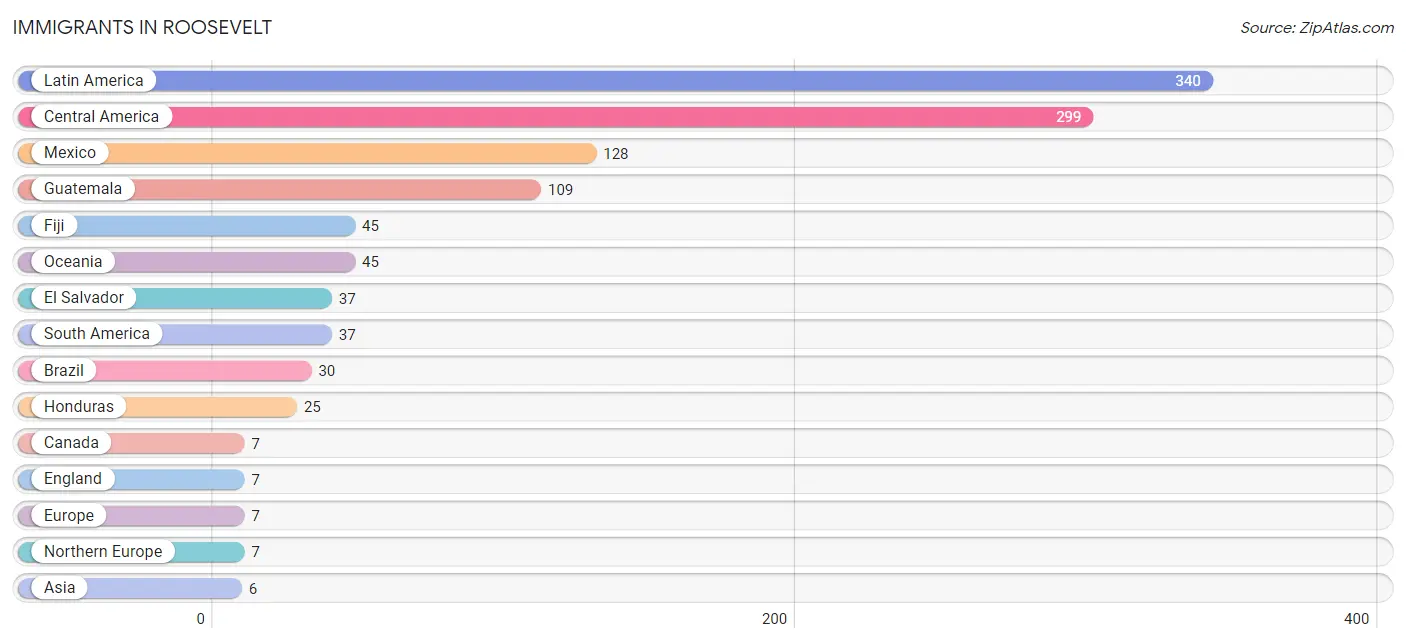
The most numerous immigrant groups reported in Roosevelt came from Latin America (340 | 4.9%), Central America (299 | 4.3%), Mexico (128 | 1.9%), Guatemala (109 | 1.6%), and Fiji (45 | 0.6%), together accounting for 13.4% of all Roosevelt residents.
| Immigration Origin | # Population | % Population |
| Asia | 6 | 0.1% |
| Brazil | 30 | 0.4% |
| Canada | 7 | 0.1% |
| Caribbean | 4 | 0.1% |
| Central America | 299 | 4.3% |
| Chile | 2 | 0.0% |
| Cuba | 4 | 0.1% |
| Eastern Asia | 6 | 0.1% |
| El Salvador | 37 | 0.5% |
| England | 7 | 0.1% |
| Europe | 7 | 0.1% |
| Fiji | 45 | 0.6% |
| Guatemala | 109 | 1.6% |
| Honduras | 25 | 0.4% |
| Korea | 6 | 0.1% |
| Latin America | 340 | 4.9% |
| Mexico | 128 | 1.9% |
| Northern Europe | 7 | 0.1% |
| Oceania | 45 | 0.6% |
| Peru | 5 | 0.1% |
| South America | 37 | 0.5% | View All 21 Rows |
Sex and Age in Roosevelt
Sex and Age in Roosevelt
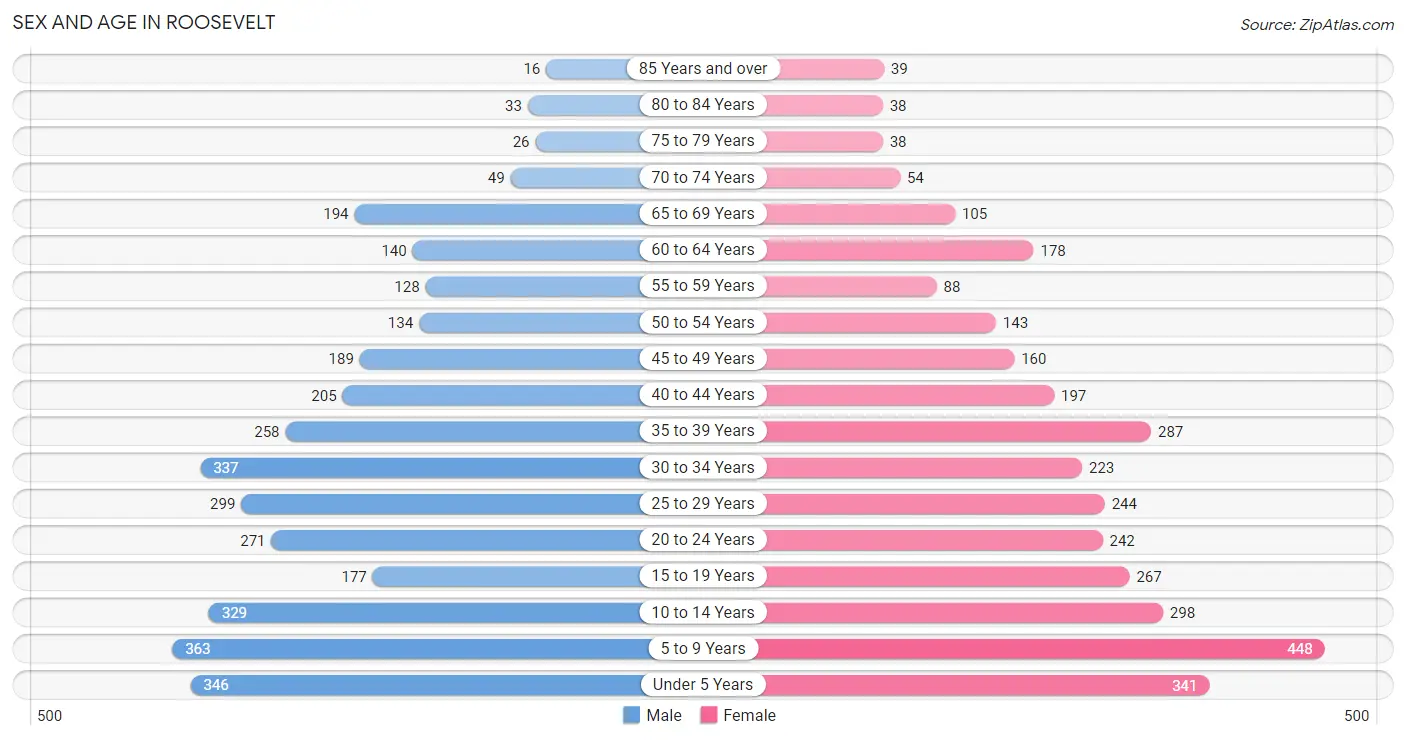
The most populous age groups in Roosevelt are 5 to 9 Years (363 | 10.4%) for men and 5 to 9 Years (448 | 13.2%) for women.
| Age Bracket | Male | Female |
| Under 5 Years | 346 (9.9%) | 341 (10.1%) |
| 5 to 9 Years | 363 (10.4%) | 448 (13.2%) |
| 10 to 14 Years | 329 (9.4%) | 298 (8.8%) |
| 15 to 19 Years | 177 (5.1%) | 267 (7.9%) |
| 20 to 24 Years | 271 (7.8%) | 242 (7.1%) |
| 25 to 29 Years | 299 (8.6%) | 244 (7.2%) |
| 30 to 34 Years | 337 (9.7%) | 223 (6.6%) |
| 35 to 39 Years | 258 (7.4%) | 287 (8.5%) |
| 40 to 44 Years | 205 (5.9%) | 197 (5.8%) |
| 45 to 49 Years | 189 (5.4%) | 160 (4.7%) |
| 50 to 54 Years | 134 (3.8%) | 143 (4.2%) |
| 55 to 59 Years | 128 (3.7%) | 88 (2.6%) |
| 60 to 64 Years | 140 (4.0%) | 178 (5.2%) |
| 65 to 69 Years | 194 (5.6%) | 105 (3.1%) |
| 70 to 74 Years | 49 (1.4%) | 54 (1.6%) |
| 75 to 79 Years | 26 (0.7%) | 38 (1.1%) |
| 80 to 84 Years | 33 (0.9%) | 38 (1.1%) |
| 85 Years and over | 16 (0.5%) | 39 (1.1%) |
| Total | 3,494 (100.0%) | 3,390 (100.0%) |
Families and Households in Roosevelt
Median Family Size in Roosevelt
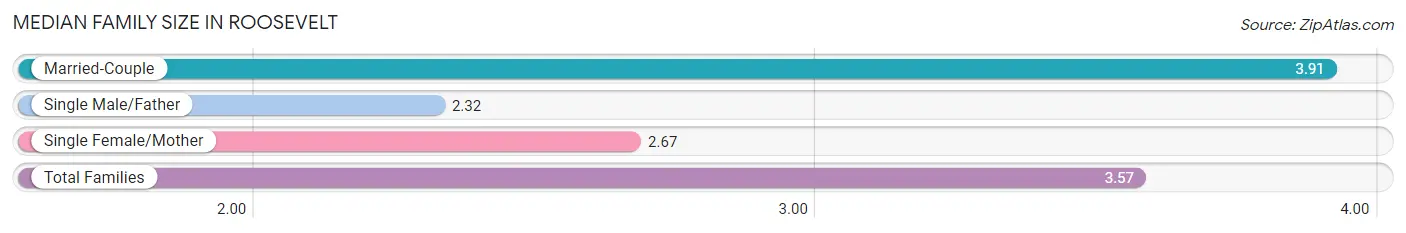
The median family size in Roosevelt is 3.57 persons per family, with married-couple families (1,272 | 76.2%) accounting for the largest median family size of 3.91 persons per family. On the other hand, single male/father families (185 | 11.1%) represent the smallest median family size with 2.32 persons per family.
| Family Type | # Families | Family Size |
| Married-Couple | 1,272 (76.2%) | 3.91 |
| Single Male/Father | 185 (11.1%) | 2.32 |
| Single Female/Mother | 212 (12.7%) | 2.67 |
| Total Families | 1,669 (100.0%) | 3.57 |
Median Household Size in Roosevelt
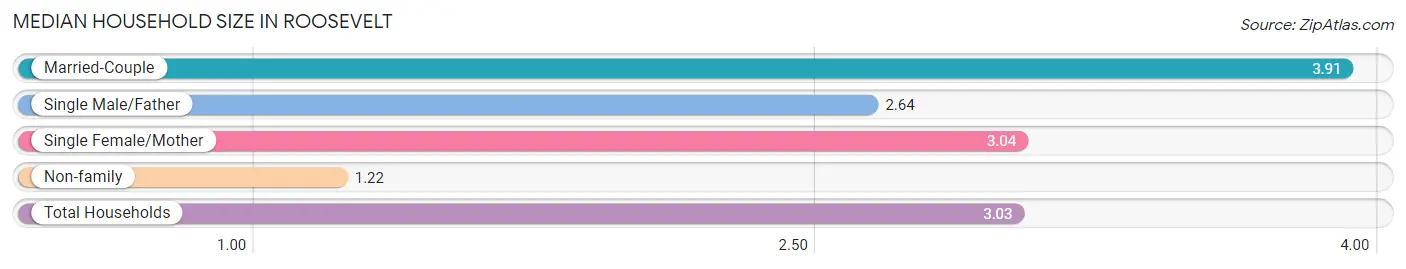
The median household size in Roosevelt is 3.03 persons per household, with married-couple households (1,272 | 56.7%) accounting for the largest median household size of 3.91 persons per household. non-family households (576 | 25.7%) represent the smallest median household size with 1.22 persons per household.
| Household Type | # Households | Household Size |
| Married-Couple | 1,272 (56.7%) | 3.91 |
| Single Male/Father | 185 (8.2%) | 2.64 |
| Single Female/Mother | 212 (9.4%) | 3.04 |
| Non-family | 576 (25.7%) | 1.22 |
| Total Households | 2,245 (100.0%) | 3.03 |
Household Size by Marriage Status in Roosevelt
Out of a total of 2,245 households in Roosevelt, 1,669 (74.3%) are family households, while 576 (25.7%) are nonfamily households. The most numerous type of family households are 2-person households, comprising 540, and the most common type of nonfamily households are 1-person households, comprising 492.
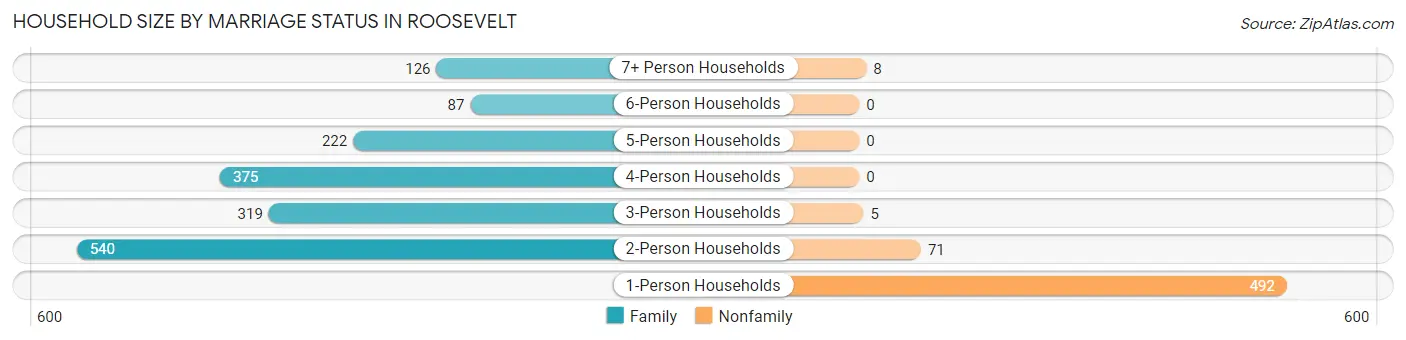
| Household Size | Family Households | Nonfamily Households |
| 1-Person Households | - | 492 (21.9%) |
| 2-Person Households | 540 (24.0%) | 71 (3.2%) |
| 3-Person Households | 319 (14.2%) | 5 (0.2%) |
| 4-Person Households | 375 (16.7%) | 0 (0.0%) |
| 5-Person Households | 222 (9.9%) | 0 (0.0%) |
| 6-Person Households | 87 (3.9%) | 0 (0.0%) |
| 7+ Person Households | 126 (5.6%) | 8 (0.4%) |
| Total | 1,669 (74.3%) | 576 (25.7%) |
Female Fertility in Roosevelt
Fertility by Age in Roosevelt
Average fertility rate in Roosevelt is 106.0 births per 1,000 women. Women in the age bracket of 20 to 34 years have the highest fertility rate with 223.0 births per 1,000 women. Women in the age bracket of 20 to 34 years acount for 89.3% of all women with births.
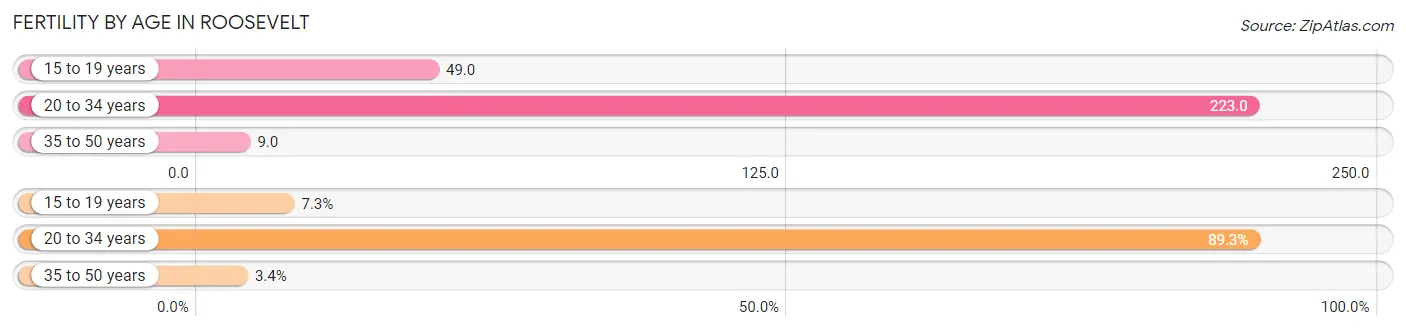
| Age Bracket | Women with Births | Births / 1,000 Women |
| 15 to 19 years | 13 (7.3%) | 49.0 |
| 20 to 34 years | 158 (89.3%) | 223.0 |
| 35 to 50 years | 6 (3.4%) | 9.0 |
| Total | 177 (100.0%) | 106.0 |
Fertility by Age by Marriage Status in Roosevelt
71.2% of women with births (177) in Roosevelt are married. The highest percentage of unmarried women with births falls into 15 to 19 years age bracket with 53.8% of them unmarried at the time of birth, while the lowest percentage of unmarried women with births belong to 35 to 50 years age bracket with 0.0% of them unmarried.
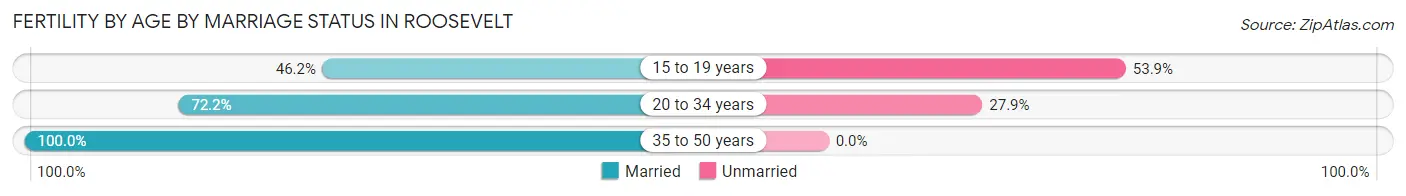
| Age Bracket | Married | Unmarried |
| 15 to 19 years | 6 (46.2%) | 7 (53.8%) |
| 20 to 34 years | 114 (72.2%) | 44 (27.9%) |
| 35 to 50 years | 6 (100.0%) | 0 (0.0%) |
| Total | 126 (71.2%) | 51 (28.8%) |
Fertility by Education in Roosevelt
Average fertility rate in Roosevelt is 106.0 births per 1,000 women. Women with the education attainment of less than high school have the highest fertility rate of 149.0 births per 1,000 women, while women with the education attainment of bachelor's degree have the lowest fertility at 43.0 births per 1,000 women. Women with the education attainment of college or associate's degree represent 35.0% of all women with births.
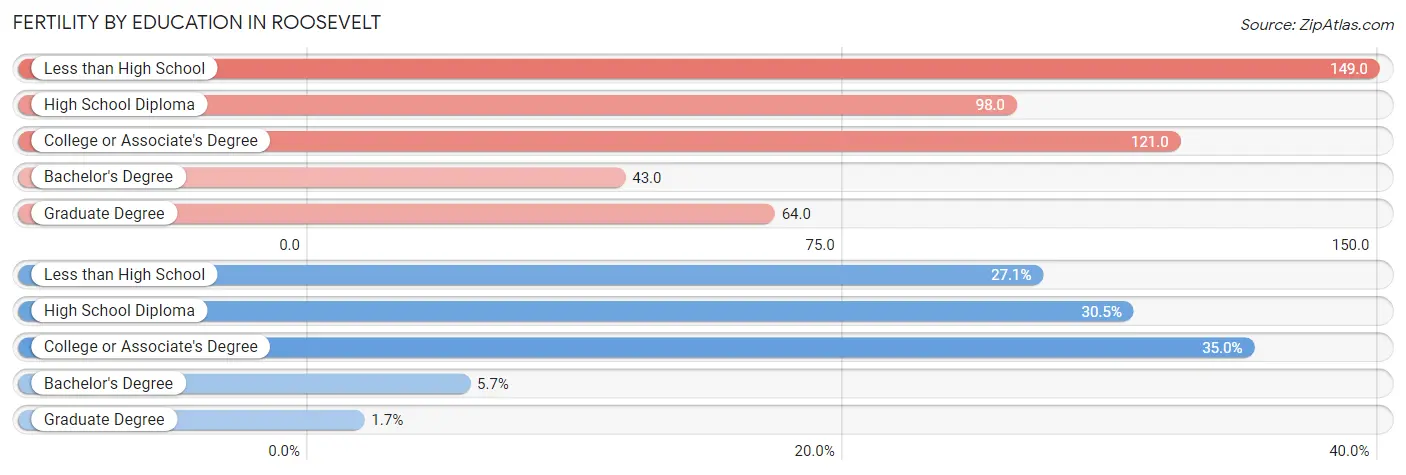
| Educational Attainment | Women with Births | Births / 1,000 Women |
| Less than High School | 48 (27.1%) | 149.0 |
| High School Diploma | 54 (30.5%) | 98.0 |
| College or Associate's Degree | 62 (35.0%) | 121.0 |
| Bachelor's Degree | 10 (5.7%) | 43.0 |
| Graduate Degree | 3 (1.7%) | 64.0 |
| Total | 177 (100.0%) | 106.0 |
Fertility by Education by Marriage Status in Roosevelt
28.8% of women with births in Roosevelt are unmarried. Women with the educational attainment of bachelor's degree are most likely to be married with 100.0% of them married at childbirth, while women with the educational attainment of less than high school are least likely to be married with 77.1% of them unmarried at childbirth.
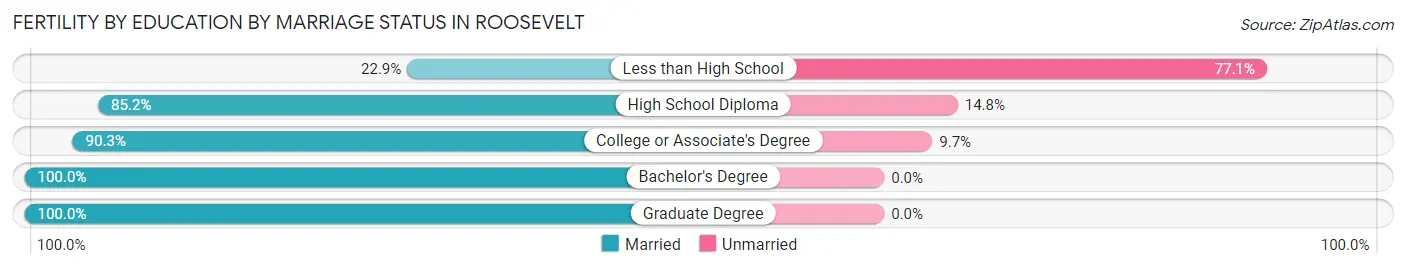
| Educational Attainment | Married | Unmarried |
| Less than High School | 11 (22.9%) | 37 (77.1%) |
| High School Diploma | 46 (85.2%) | 8 (14.8%) |
| College or Associate's Degree | 56 (90.3%) | 6 (9.7%) |
| Bachelor's Degree | 10 (100.0%) | 0 (0.0%) |
| Graduate Degree | 3 (100.0%) | 0 (0.0%) |
| Total | 126 (71.2%) | 51 (28.8%) |
Employment Characteristics in Roosevelt
Employment by Class of Employer in Roosevelt
Among the 2,790 employed individuals in Roosevelt, private company employees (1,832 | 65.7%), local government employees (357 | 12.8%), and not-for-profit organizations (166 | 5.9%) make up the most common classes of employment.
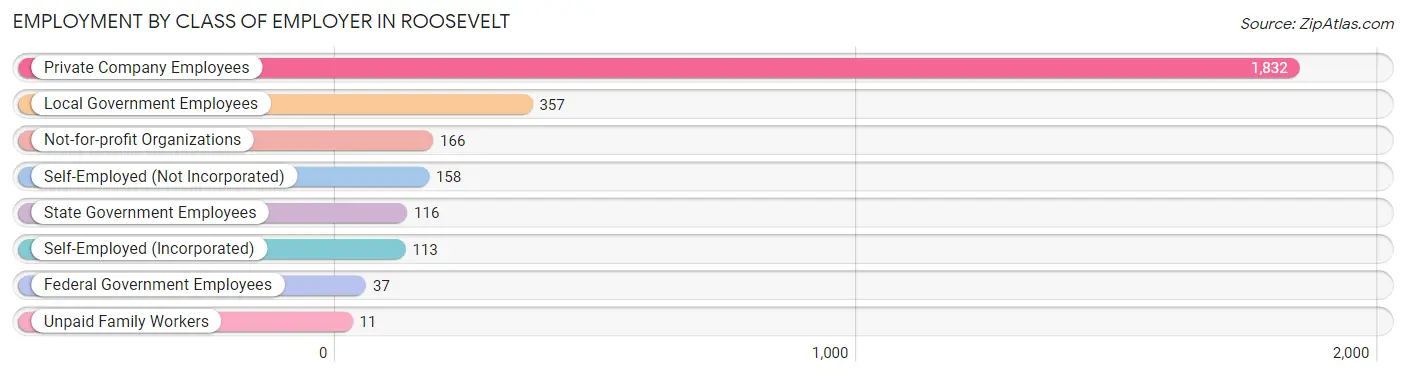
| Employer Class | # Employees | % Employees |
| Private Company Employees | 1,832 | 65.7% |
| Self-Employed (Incorporated) | 113 | 4.1% |
| Self-Employed (Not Incorporated) | 158 | 5.7% |
| Not-for-profit Organizations | 166 | 5.9% |
| Local Government Employees | 357 | 12.8% |
| State Government Employees | 116 | 4.2% |
| Federal Government Employees | 37 | 1.3% |
| Unpaid Family Workers | 11 | 0.4% |
| Total | 2,790 | 100.0% |
Employment Status by Age in Roosevelt
According to the labor force statistics for Roosevelt, out of the total population over 16 years of age (4,676), 65.1% or 3,044 individuals are in the labor force, with 6.8% or 207 of them unemployed. The age group with the highest labor force participation rate is 25 to 29 years, with 82.0% or 445 individuals in the labor force. Within the labor force, the 65 to 74 years age range has the highest percentage of unemployed individuals, with 41.1% or 58 of them being unemployed.
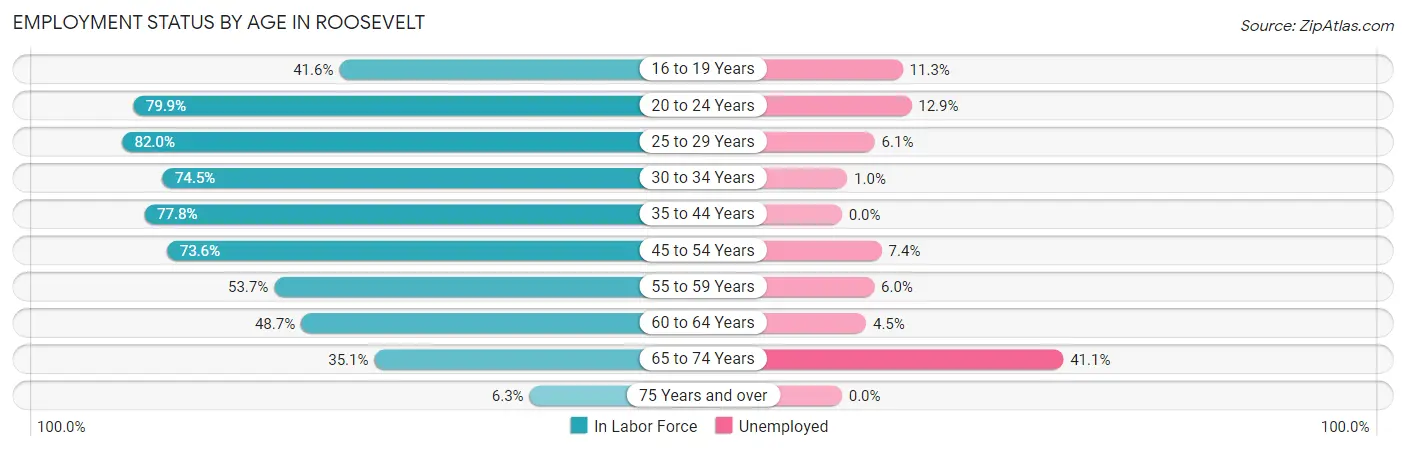
| Age Bracket | In Labor Force | Unemployed |
| 16 to 19 Years | 150 (41.6%) | 17 (11.3%) |
| 20 to 24 Years | 410 (79.9%) | 53 (12.9%) |
| 25 to 29 Years | 445 (82.0%) | 27 (6.1%) |
| 30 to 34 Years | 417 (74.5%) | 4 (1.0%) |
| 35 to 44 Years | 737 (77.8%) | 0 (0.0%) |
| 45 to 54 Years | 461 (73.6%) | 34 (7.4%) |
| 55 to 59 Years | 116 (53.7%) | 7 (6.0%) |
| 60 to 64 Years | 155 (48.7%) | 7 (4.5%) |
| 65 to 74 Years | 141 (35.1%) | 58 (41.1%) |
| 75 Years and over | 12 (6.3%) | 0 (0.0%) |
| Total | 3,044 (65.1%) | 207 (6.8%) |
Employment Status by Educational Attainment in Roosevelt
According to labor force statistics for Roosevelt, 72.6% of individuals (2,330) out of the total population between 25 and 64 years of age (3,210) are in the labor force, with 3.4% or 79 of them being unemployed. The group with the highest labor force participation rate are those with the educational attainment of bachelor's degree or higher, with 87.2% or 563 individuals in the labor force. Within the labor force, individuals with less than high school education have the highest percentage of unemployment, with 9.2% or 25 of them being unemployed.
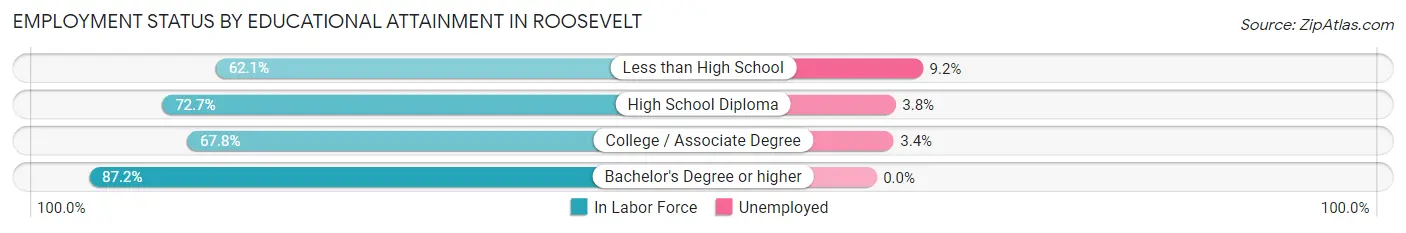
| Educational Attainment | In Labor Force | Unemployed |
| Less than High School | 272 (62.1%) | 40 (9.2%) |
| High School Diploma | 811 (72.7%) | 42 (3.8%) |
| College / Associate Degree | 685 (67.8%) | 34 (3.4%) |
| Bachelor's Degree or higher | 563 (87.2%) | 0 (0.0%) |
| Total | 2,330 (72.6%) | 109 (3.4%) |
Employment Occupations by Sex in Roosevelt
Management, Business, Science and Arts Occupations
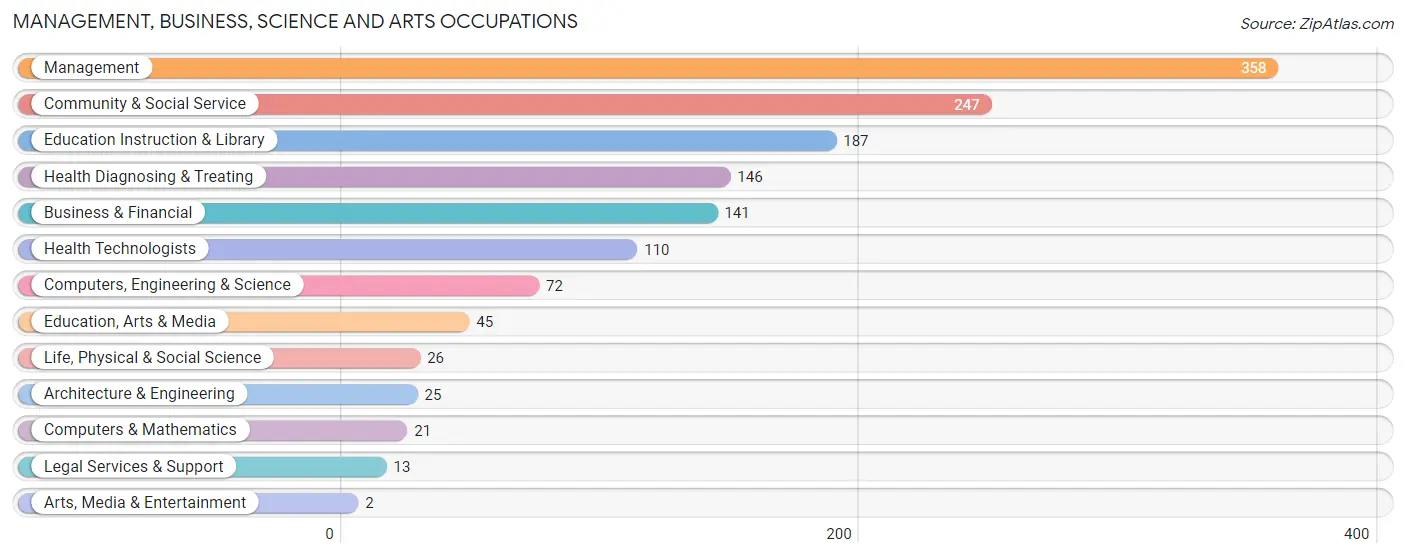
The most common Management, Business, Science and Arts occupations in Roosevelt are Management (358 | 12.6%), Community & Social Service (247 | 8.7%), Education Instruction & Library (187 | 6.6%), Health Diagnosing & Treating (146 | 5.1%), and Business & Financial (141 | 5.0%).
Management, Business, Science and Arts Occupations by Sex
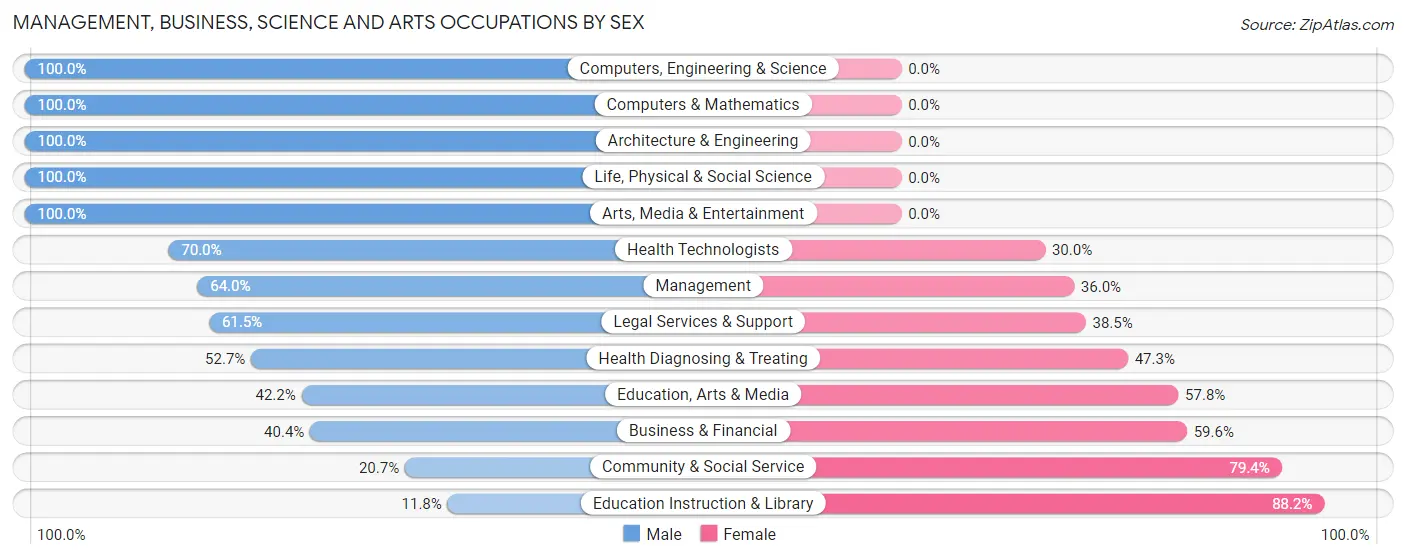
Within the Management, Business, Science and Arts occupations in Roosevelt, the most male-oriented occupations are Computers, Engineering & Science (100.0%), Computers & Mathematics (100.0%), and Architecture & Engineering (100.0%), while the most female-oriented occupations are Education Instruction & Library (88.2%), Community & Social Service (79.3%), and Business & Financial (59.6%).
| Occupation | Male | Female |
| Management | 229 (64.0%) | 129 (36.0%) |
| Business & Financial | 57 (40.4%) | 84 (59.6%) |
| Computers, Engineering & Science | 72 (100.0%) | 0 (0.0%) |
| Computers & Mathematics | 21 (100.0%) | 0 (0.0%) |
| Architecture & Engineering | 25 (100.0%) | 0 (0.0%) |
| Life, Physical & Social Science | 26 (100.0%) | 0 (0.0%) |
| Community & Social Service | 51 (20.6%) | 196 (79.3%) |
| Education, Arts & Media | 19 (42.2%) | 26 (57.8%) |
| Legal Services & Support | 8 (61.5%) | 5 (38.5%) |
| Education Instruction & Library | 22 (11.8%) | 165 (88.2%) |
| Arts, Media & Entertainment | 2 (100.0%) | 0 (0.0%) |
| Health Diagnosing & Treating | 77 (52.7%) | 69 (47.3%) |
| Health Technologists | 77 (70.0%) | 33 (30.0%) |
| Total (Category) | 486 (50.4%) | 478 (49.6%) |
| Total (Overall) | 1,751 (61.7%) | 1,086 (38.3%) |
Services Occupations
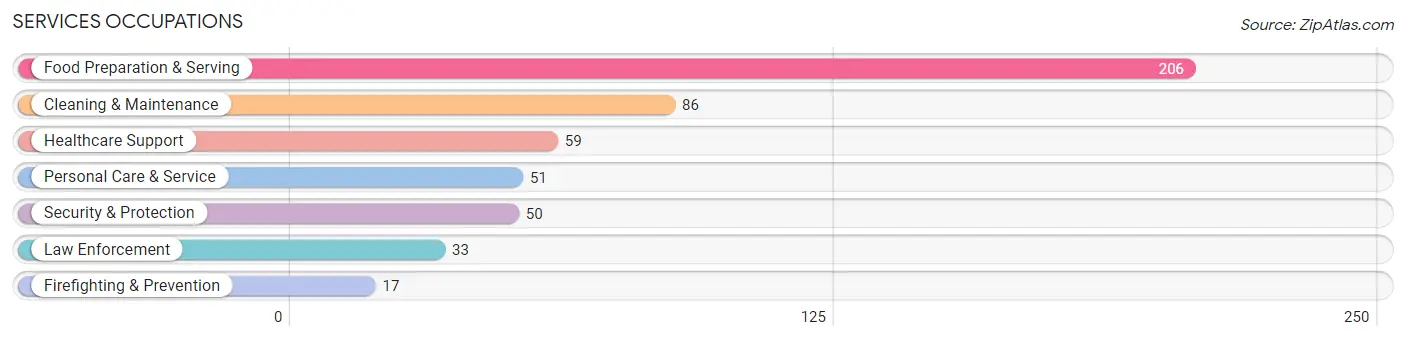
The most common Services occupations in Roosevelt are Food Preparation & Serving (206 | 7.3%), Cleaning & Maintenance (86 | 3.0%), Healthcare Support (59 | 2.1%), Personal Care & Service (51 | 1.8%), and Security & Protection (50 | 1.8%).
Services Occupations by Sex
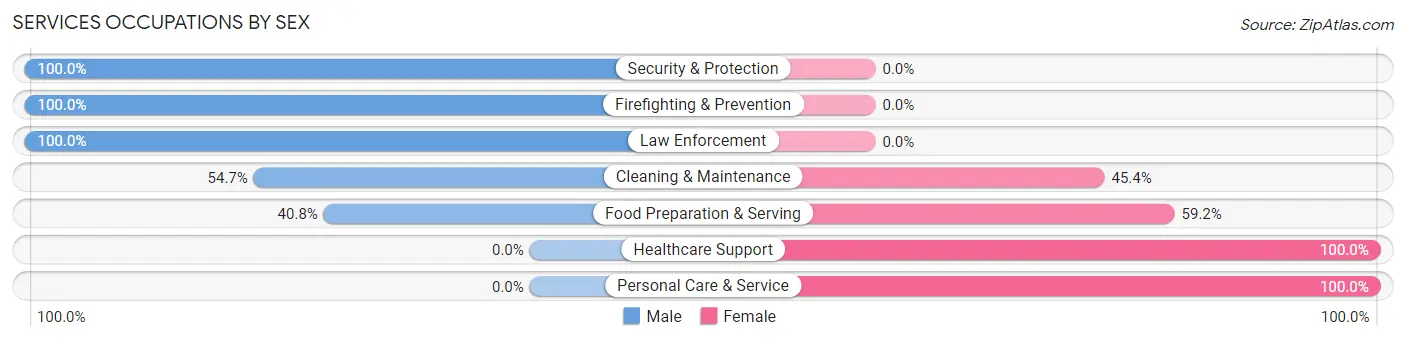
Within the Services occupations in Roosevelt, the most male-oriented occupations are Security & Protection (100.0%), Firefighting & Prevention (100.0%), and Law Enforcement (100.0%), while the most female-oriented occupations are Healthcare Support (100.0%), Personal Care & Service (100.0%), and Food Preparation & Serving (59.2%).
| Occupation | Male | Female |
| Healthcare Support | 0 (0.0%) | 59 (100.0%) |
| Security & Protection | 50 (100.0%) | 0 (0.0%) |
| Firefighting & Prevention | 17 (100.0%) | 0 (0.0%) |
| Law Enforcement | 33 (100.0%) | 0 (0.0%) |
| Food Preparation & Serving | 84 (40.8%) | 122 (59.2%) |
| Cleaning & Maintenance | 47 (54.6%) | 39 (45.4%) |
| Personal Care & Service | 0 (0.0%) | 51 (100.0%) |
| Total (Category) | 181 (40.0%) | 271 (60.0%) |
| Total (Overall) | 1,751 (61.7%) | 1,086 (38.3%) |
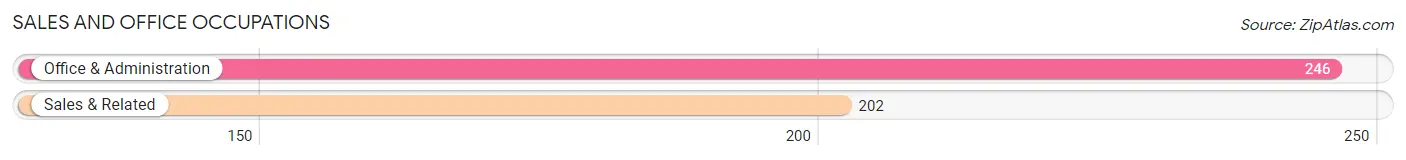
Sales and Office Occupations
The most common Sales and Office occupations in Roosevelt are Office & Administration (246 | 8.7%), and Sales & Related (202 | 7.1%).
Sales and Office Occupations by Sex
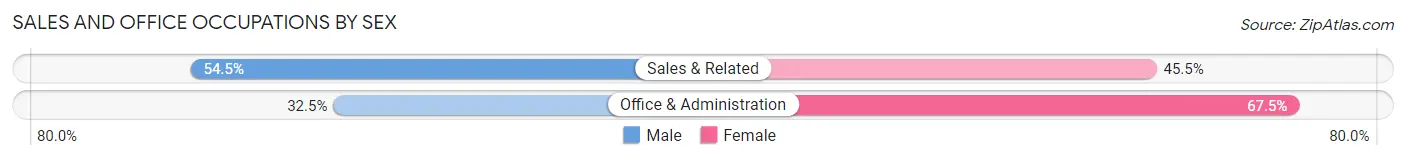
| Occupation | Male | Female |
| Sales & Related | 110 (54.5%) | 92 (45.5%) |
| Office & Administration | 80 (32.5%) | 166 (67.5%) |
| Total (Category) | 190 (42.4%) | 258 (57.6%) |
| Total (Overall) | 1,751 (61.7%) | 1,086 (38.3%) |
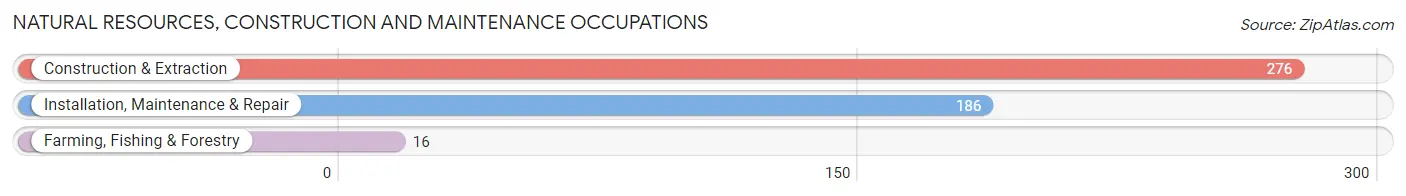
Natural Resources, Construction and Maintenance Occupations
The most common Natural Resources, Construction and Maintenance occupations in Roosevelt are Construction & Extraction (276 | 9.7%), Installation, Maintenance & Repair (186 | 6.6%), and Farming, Fishing & Forestry (16 | 0.6%).
Natural Resources, Construction and Maintenance Occupations by Sex
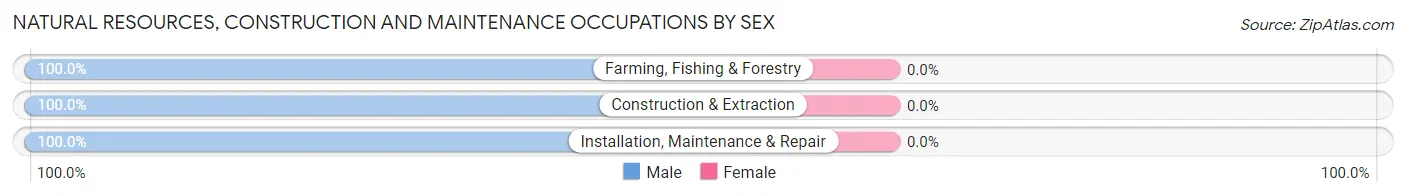
| Occupation | Male | Female |
| Farming, Fishing & Forestry | 16 (100.0%) | 0 (0.0%) |
| Construction & Extraction | 276 (100.0%) | 0 (0.0%) |
| Installation, Maintenance & Repair | 186 (100.0%) | 0 (0.0%) |
| Total (Category) | 478 (100.0%) | 0 (0.0%) |
| Total (Overall) | 1,751 (61.7%) | 1,086 (38.3%) |
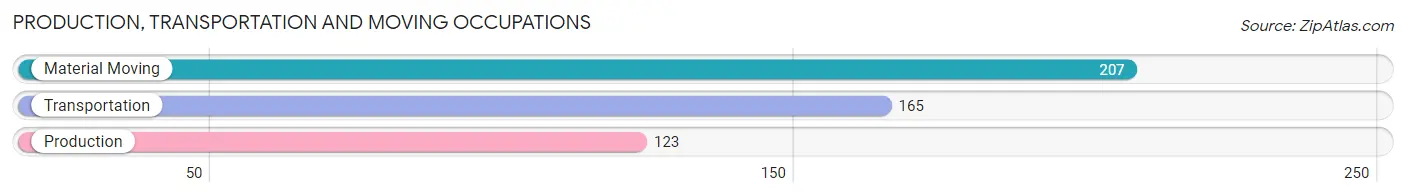
Production, Transportation and Moving Occupations
The most common Production, Transportation and Moving occupations in Roosevelt are Material Moving (207 | 7.3%), Transportation (165 | 5.8%), and Production (123 | 4.3%).
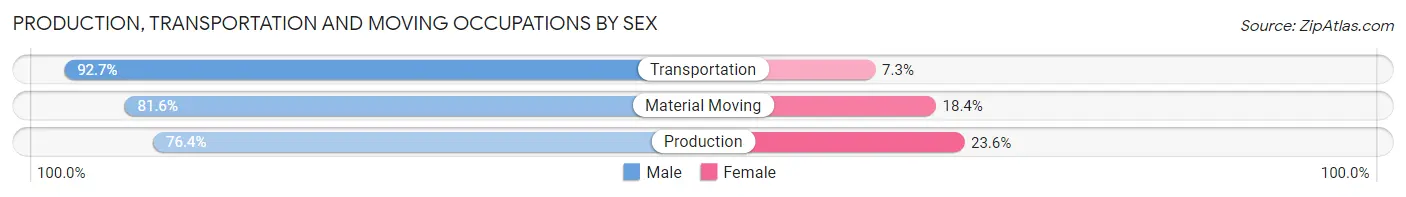
Production, Transportation and Moving Occupations by Sex
| Occupation | Male | Female |
| Production | 94 (76.4%) | 29 (23.6%) |
| Transportation | 153 (92.7%) | 12 (7.3%) |
| Material Moving | 169 (81.6%) | 38 (18.4%) |
| Total (Category) | 416 (84.0%) | 79 (16.0%) |
| Total (Overall) | 1,751 (61.7%) | 1,086 (38.3%) |
Employment Industries by Sex in Roosevelt
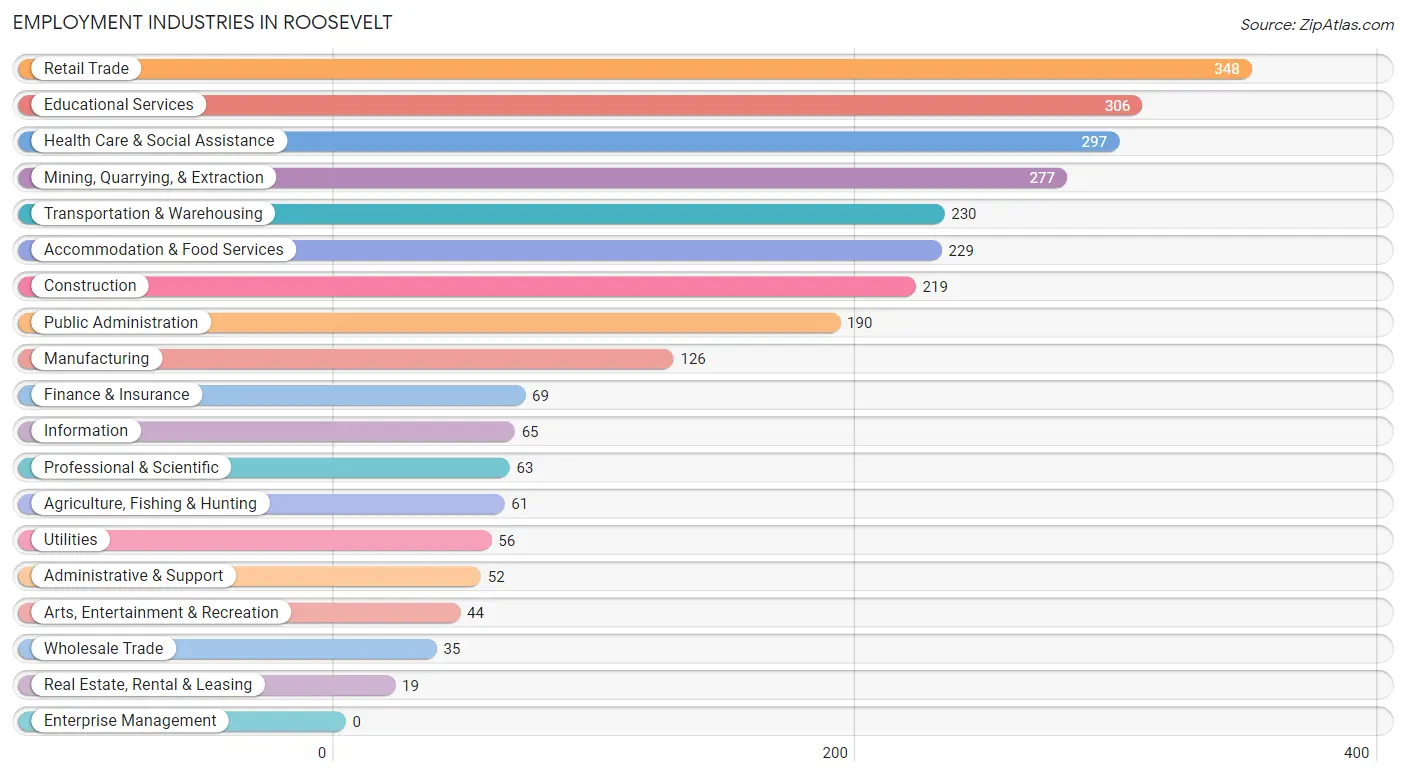
Employment Industries in Roosevelt
The major employment industries in Roosevelt include Retail Trade (348 | 12.3%), Educational Services (306 | 10.8%), Health Care & Social Assistance (297 | 10.5%), Mining, Quarrying, & Extraction (277 | 9.8%), and Transportation & Warehousing (230 | 8.1%).
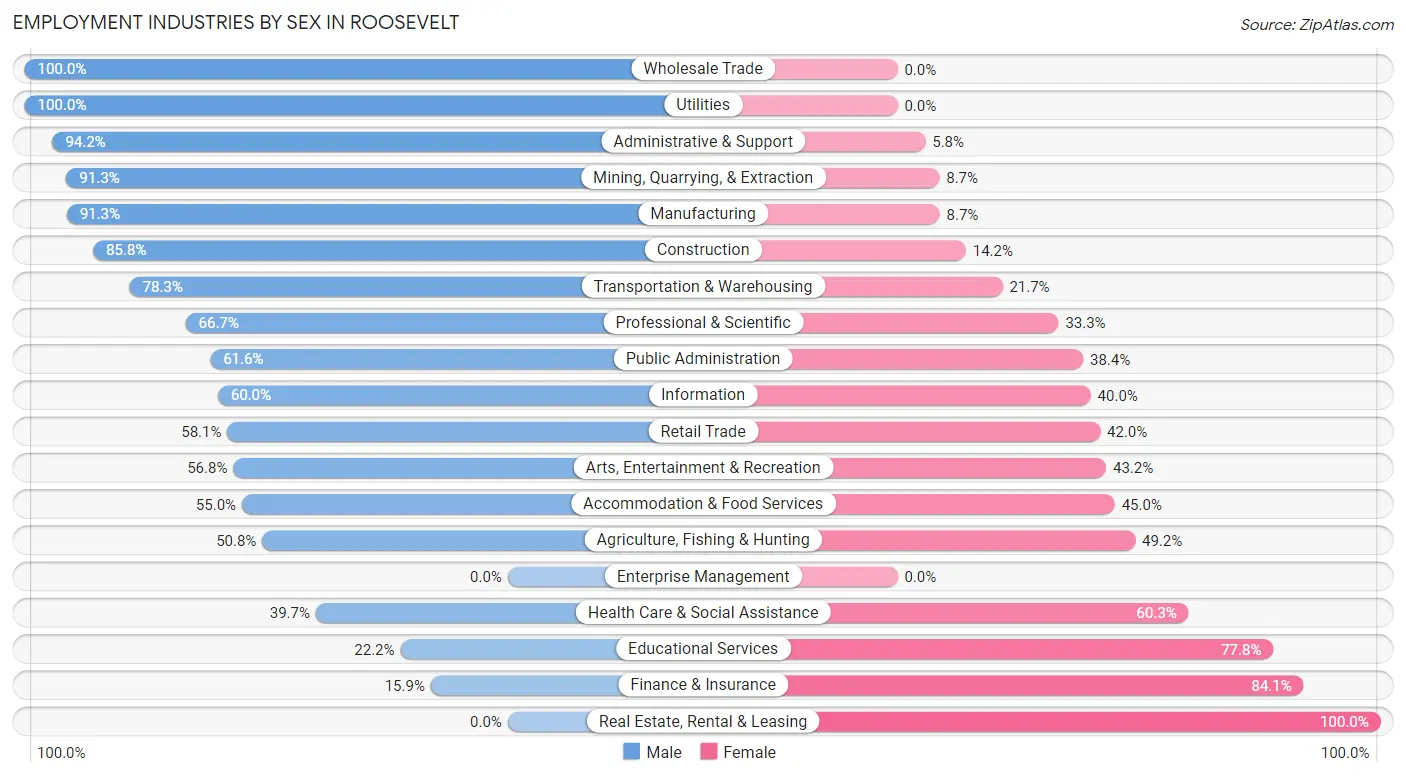
Employment Industries by Sex in Roosevelt
The Roosevelt industries that see more men than women are Wholesale Trade (100.0%), Utilities (100.0%), and Administrative & Support (94.2%), whereas the industries that tend to have a higher number of women are Real Estate, Rental & Leasing (100.0%), Finance & Insurance (84.1%), and Educational Services (77.8%).
| Industry | Male | Female |
| Agriculture, Fishing & Hunting | 31 (50.8%) | 30 (49.2%) |
| Mining, Quarrying, & Extraction | 253 (91.3%) | 24 (8.7%) |
| Construction | 188 (85.8%) | 31 (14.2%) |
| Manufacturing | 115 (91.3%) | 11 (8.7%) |
| Wholesale Trade | 35 (100.0%) | 0 (0.0%) |
| Retail Trade | 202 (58.1%) | 146 (41.9%) |
| Transportation & Warehousing | 180 (78.3%) | 50 (21.7%) |
| Utilities | 56 (100.0%) | 0 (0.0%) |
| Information | 39 (60.0%) | 26 (40.0%) |
| Finance & Insurance | 11 (15.9%) | 58 (84.1%) |
| Real Estate, Rental & Leasing | 0 (0.0%) | 19 (100.0%) |
| Professional & Scientific | 42 (66.7%) | 21 (33.3%) |
| Enterprise Management | 0 (0.0%) | 0 (0.0%) |
| Administrative & Support | 49 (94.2%) | 3 (5.8%) |
| Educational Services | 68 (22.2%) | 238 (77.8%) |
| Health Care & Social Assistance | 118 (39.7%) | 179 (60.3%) |
| Arts, Entertainment & Recreation | 25 (56.8%) | 19 (43.2%) |
| Accommodation & Food Services | 126 (55.0%) | 103 (45.0%) |
| Public Administration | 117 (61.6%) | 73 (38.4%) |
| Total | 1,751 (61.7%) | 1,086 (38.3%) |
Education in Roosevelt
School Enrollment in Roosevelt
The most common levels of schooling among the 2,120 students in Roosevelt are elementary school (597 | 28.2%), middle school (491 | 23.2%), and high school (318 | 15.0%).
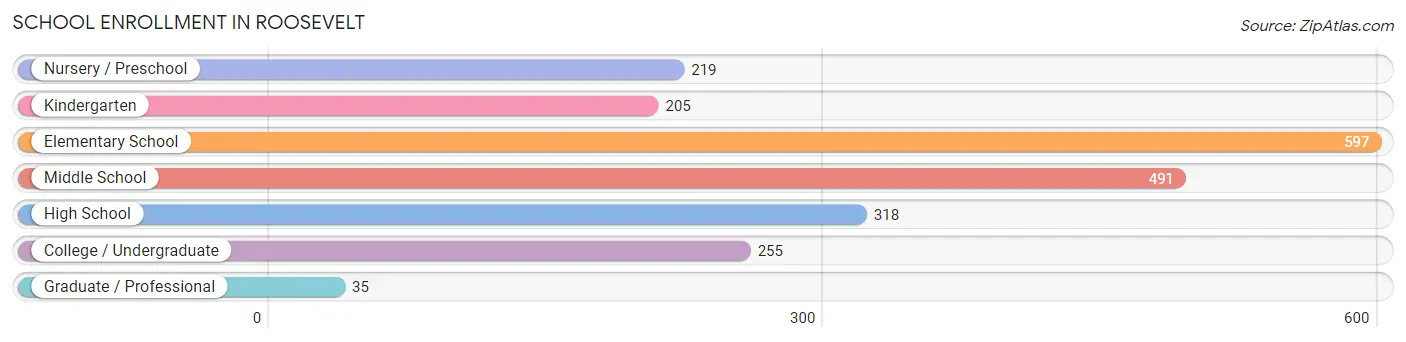
| School Level | # Students | % Students |
| Nursery / Preschool | 219 | 10.3% |
| Kindergarten | 205 | 9.7% |
| Elementary School | 597 | 28.2% |
| Middle School | 491 | 23.2% |
| High School | 318 | 15.0% |
| College / Undergraduate | 255 | 12.0% |
| Graduate / Professional | 35 | 1.7% |
| Total | 2,120 | 100.0% |
School Enrollment by Age by Funding Source in Roosevelt
Out of a total of 2,120 students who are enrolled in schools in Roosevelt, 182 (8.6%) attend a private institution, while the remaining 1,938 (91.4%) are enrolled in public schools. The age group of 35 years and over has the highest likelihood of being enrolled in private schools, with 42 (35.9% in the age bracket) enrolled. Conversely, the age group of 25 to 34 year olds has the lowest likelihood of being enrolled in a private school, with 81 (100.0% in the age bracket) attending a public institution.
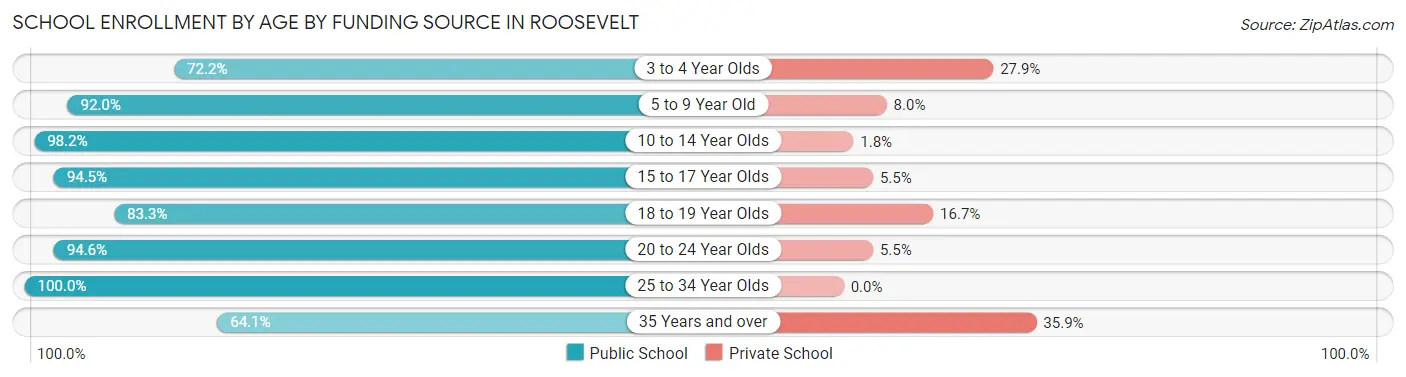
| Age Bracket | Public School | Private School |
| 3 to 4 Year Olds | 114 (72.2%) | 44 (27.9%) |
| 5 to 9 Year Old | 724 (92.0%) | 63 (8.0%) |
| 10 to 14 Year Olds | 600 (98.2%) | 11 (1.8%) |
| 15 to 17 Year Olds | 225 (94.5%) | 13 (5.5%) |
| 18 to 19 Year Olds | 15 (83.3%) | 3 (16.7%) |
| 20 to 24 Year Olds | 104 (94.6%) | 6 (5.4%) |
| 25 to 34 Year Olds | 81 (100.0%) | 0 (0.0%) |
| 35 Years and over | 75 (64.1%) | 42 (35.9%) |
| Total | 1,938 (91.4%) | 182 (8.6%) |
Educational Attainment by Field of Study in Roosevelt
Education (156 | 19.4%), business (132 | 16.4%), science & technology (94 | 11.7%), arts & humanities (79 | 9.8%), and bio, nature & agricultural (55 | 6.8%) are the most common fields of study among 806 individuals in Roosevelt who have obtained a bachelor's degree or higher.
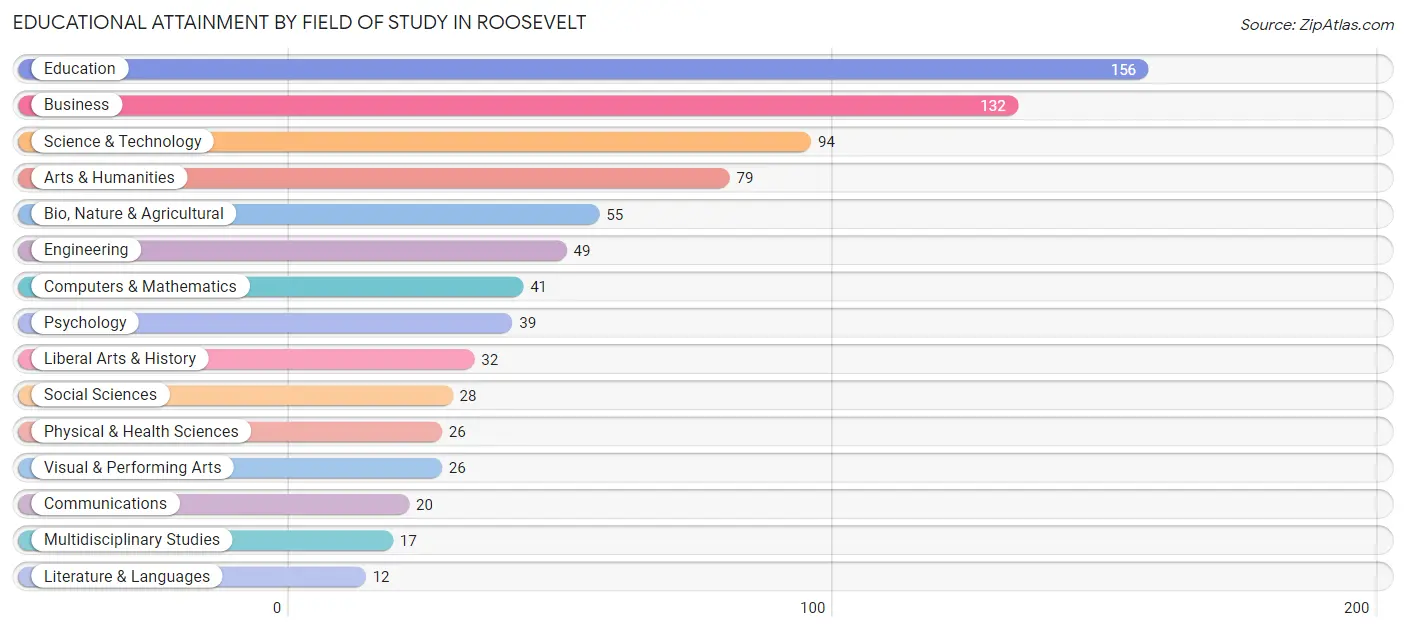
| Field of Study | # Graduates | % Graduates |
| Computers & Mathematics | 41 | 5.1% |
| Bio, Nature & Agricultural | 55 | 6.8% |
| Physical & Health Sciences | 26 | 3.2% |
| Psychology | 39 | 4.8% |
| Social Sciences | 28 | 3.5% |
| Engineering | 49 | 6.1% |
| Multidisciplinary Studies | 17 | 2.1% |
| Science & Technology | 94 | 11.7% |
| Business | 132 | 16.4% |
| Education | 156 | 19.4% |
| Literature & Languages | 12 | 1.5% |
| Liberal Arts & History | 32 | 4.0% |
| Visual & Performing Arts | 26 | 3.2% |
| Communications | 20 | 2.5% |
| Arts & Humanities | 79 | 9.8% |
| Total | 806 | 100.0% |
Transportation & Commute in Roosevelt
Vehicle Availability by Sex in Roosevelt
The most prevalent vehicle ownership categories in Roosevelt are males with 2 vehicles (819, accounting for 47.9%) and females with 2 vehicles (524, making up 75.9%).
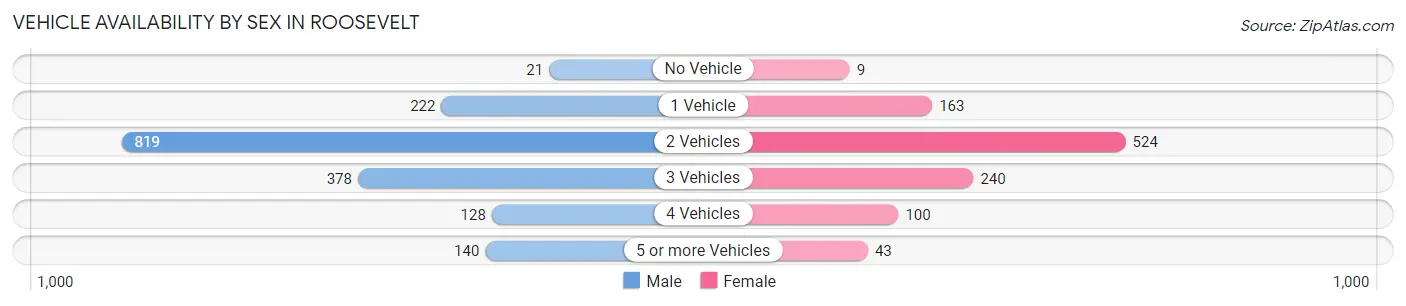
| Vehicles Available | Male | Female |
| No Vehicle | 21 (1.2%) | 9 (0.8%) |
| 1 Vehicle | 222 (13.0%) | 163 (15.1%) |
| 2 Vehicles | 819 (47.9%) | 524 (48.6%) |
| 3 Vehicles | 378 (22.1%) | 240 (22.2%) |
| 4 Vehicles | 128 (7.5%) | 100 (9.3%) |
| 5 or more Vehicles | 140 (8.2%) | 43 (4.0%) |
| Total | 1,708 (100.0%) | 1,079 (100.0%) |
Commute Time in Roosevelt
The most frequently occuring commute durations in Roosevelt are 5 to 9 minutes (1,034 commuters, 39.9%), 10 to 14 minutes (481 commuters, 18.5%), and less than 5 minutes (403 commuters, 15.5%).
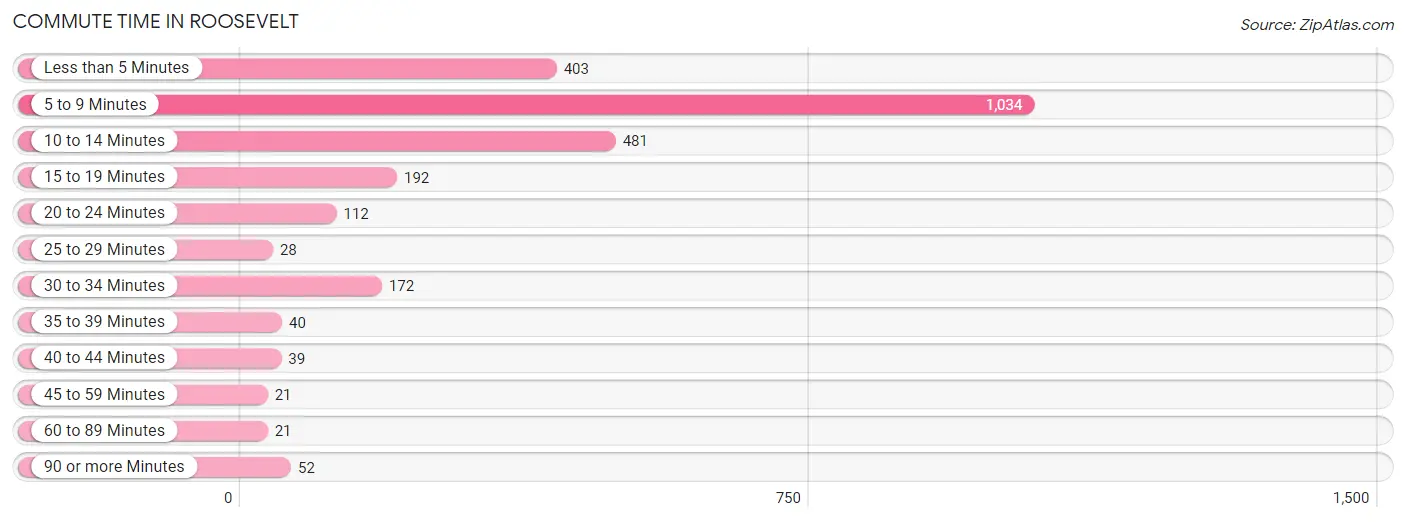
| Commute Time | # Commuters | % Commuters |
| Less than 5 Minutes | 403 | 15.5% |
| 5 to 9 Minutes | 1,034 | 39.9% |
| 10 to 14 Minutes | 481 | 18.5% |
| 15 to 19 Minutes | 192 | 7.4% |
| 20 to 24 Minutes | 112 | 4.3% |
| 25 to 29 Minutes | 28 | 1.1% |
| 30 to 34 Minutes | 172 | 6.6% |
| 35 to 39 Minutes | 40 | 1.5% |
| 40 to 44 Minutes | 39 | 1.5% |
| 45 to 59 Minutes | 21 | 0.8% |
| 60 to 89 Minutes | 21 | 0.8% |
| 90 or more Minutes | 52 | 2.0% |
Commute Time by Sex in Roosevelt
The most common commute times in Roosevelt are 5 to 9 minutes (603 commuters, 35.9%) for males and 5 to 9 minutes (431 commuters, 47.2%) for females.
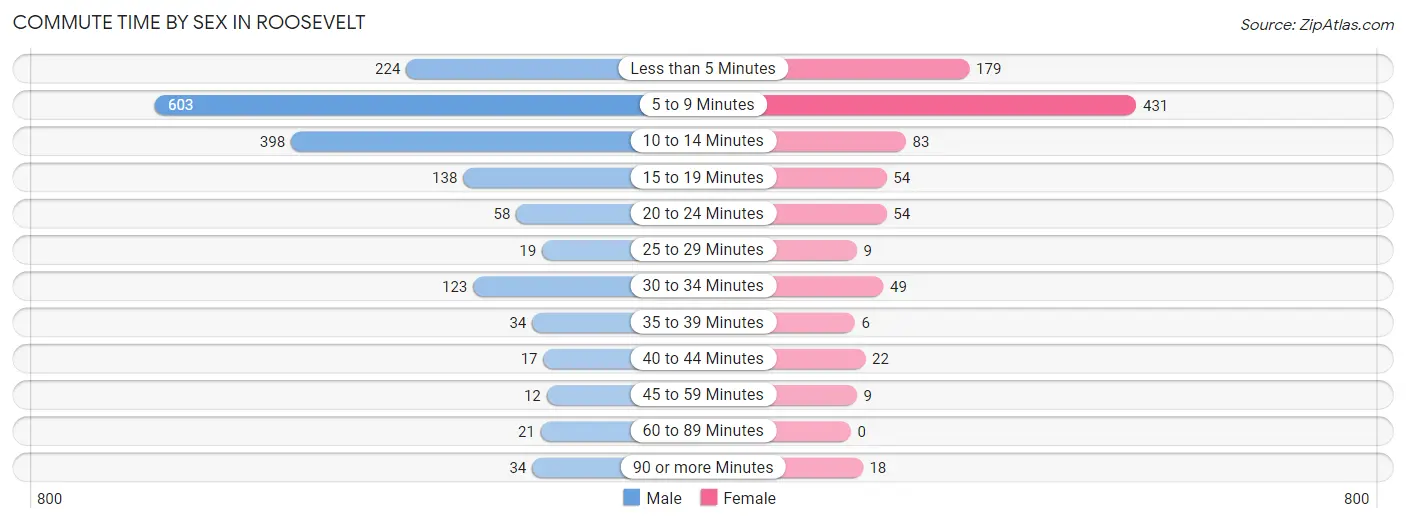
| Commute Time | Male | Female |
| Less than 5 Minutes | 224 (13.3%) | 179 (19.6%) |
| 5 to 9 Minutes | 603 (35.9%) | 431 (47.2%) |
| 10 to 14 Minutes | 398 (23.7%) | 83 (9.1%) |
| 15 to 19 Minutes | 138 (8.2%) | 54 (5.9%) |
| 20 to 24 Minutes | 58 (3.5%) | 54 (5.9%) |
| 25 to 29 Minutes | 19 (1.1%) | 9 (1.0%) |
| 30 to 34 Minutes | 123 (7.3%) | 49 (5.4%) |
| 35 to 39 Minutes | 34 (2.0%) | 6 (0.7%) |
| 40 to 44 Minutes | 17 (1.0%) | 22 (2.4%) |
| 45 to 59 Minutes | 12 (0.7%) | 9 (1.0%) |
| 60 to 89 Minutes | 21 (1.3%) | 0 (0.0%) |
| 90 or more Minutes | 34 (2.0%) | 18 (2.0%) |
Time of Departure to Work by Sex in Roosevelt
The most frequent times of departure to work in Roosevelt are 6:30 AM to 6:59 AM (297, 17.7%) for males and 7:30 AM to 7:59 AM (158, 17.3%) for females.
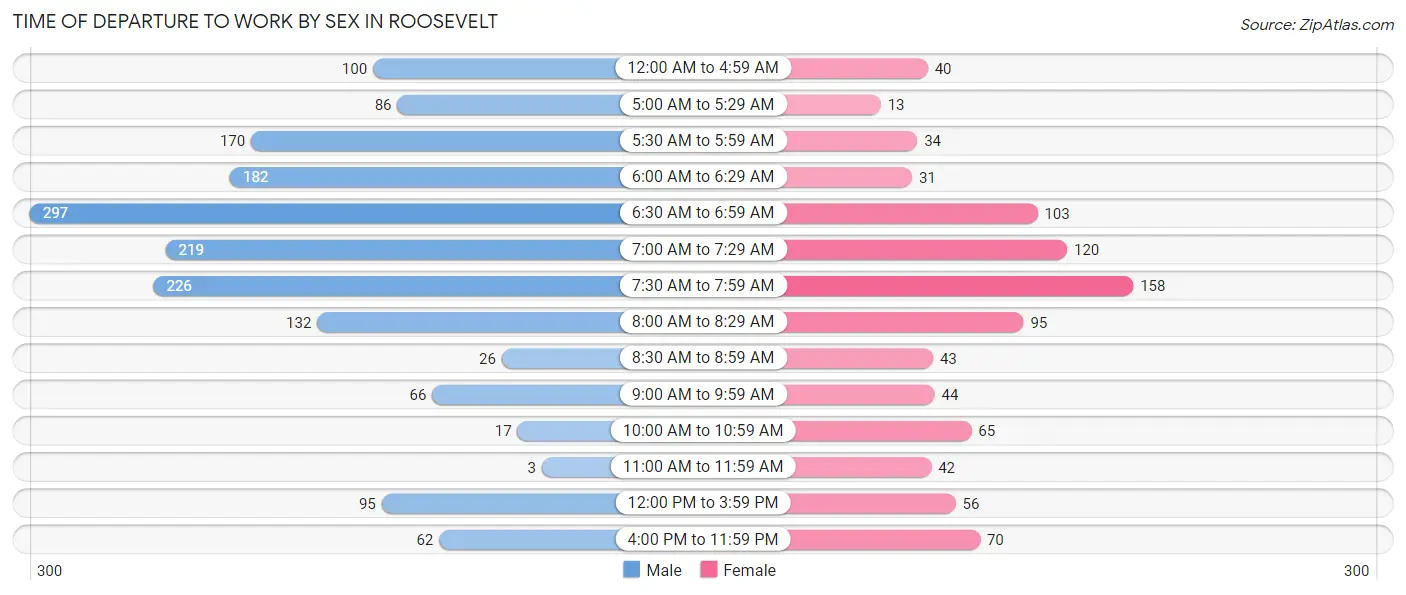
| Time of Departure | Male | Female |
| 12:00 AM to 4:59 AM | 100 (5.9%) | 40 (4.4%) |
| 5:00 AM to 5:29 AM | 86 (5.1%) | 13 (1.4%) |
| 5:30 AM to 5:59 AM | 170 (10.1%) | 34 (3.7%) |
| 6:00 AM to 6:29 AM | 182 (10.8%) | 31 (3.4%) |
| 6:30 AM to 6:59 AM | 297 (17.7%) | 103 (11.3%) |
| 7:00 AM to 7:29 AM | 219 (13.0%) | 120 (13.1%) |
| 7:30 AM to 7:59 AM | 226 (13.4%) | 158 (17.3%) |
| 8:00 AM to 8:29 AM | 132 (7.9%) | 95 (10.4%) |
| 8:30 AM to 8:59 AM | 26 (1.5%) | 43 (4.7%) |
| 9:00 AM to 9:59 AM | 66 (3.9%) | 44 (4.8%) |
| 10:00 AM to 10:59 AM | 17 (1.0%) | 65 (7.1%) |
| 11:00 AM to 11:59 AM | 3 (0.2%) | 42 (4.6%) |
| 12:00 PM to 3:59 PM | 95 (5.7%) | 56 (6.1%) |
| 4:00 PM to 11:59 PM | 62 (3.7%) | 70 (7.7%) |
| Total | 1,681 (100.0%) | 914 (100.0%) |
Housing Occupancy in Roosevelt
Occupancy by Ownership in Roosevelt
Of the total 2,245 dwellings in Roosevelt, owner-occupied units account for 1,461 (65.1%), while renter-occupied units make up 784 (34.9%).
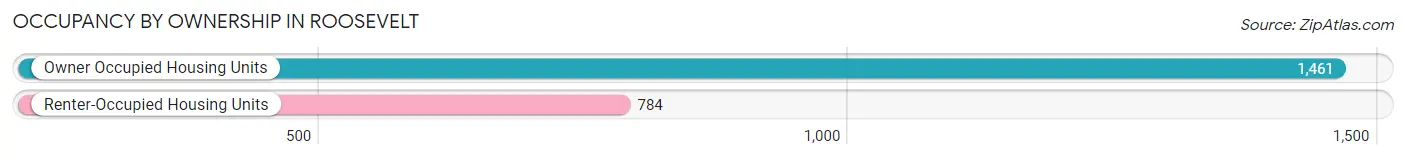
| Occupancy | # Housing Units | % Housing Units |
| Owner Occupied Housing Units | 1,461 | 65.1% |
| Renter-Occupied Housing Units | 784 | 34.9% |
| Total Occupied Housing Units | 2,245 | 100.0% |
Occupancy by Household Size in Roosevelt
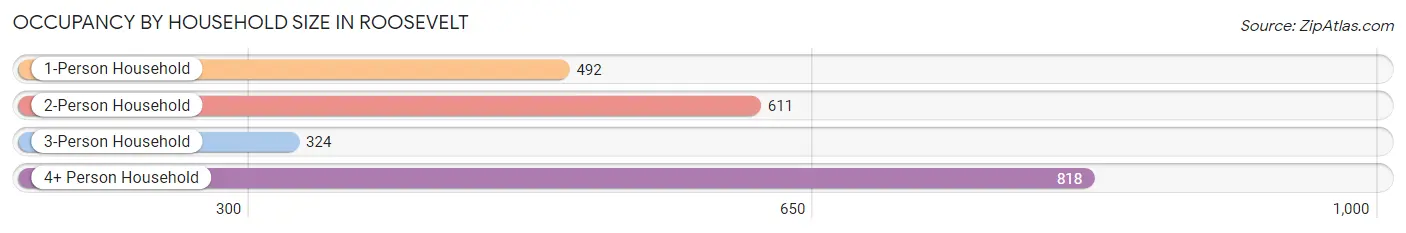
| Household Size | # Housing Units | % Housing Units |
| 1-Person Household | 492 | 21.9% |
| 2-Person Household | 611 | 27.2% |
| 3-Person Household | 324 | 14.4% |
| 4+ Person Household | 818 | 36.4% |
| Total Housing Units | 2,245 | 100.0% |
Occupancy by Ownership by Household Size in Roosevelt
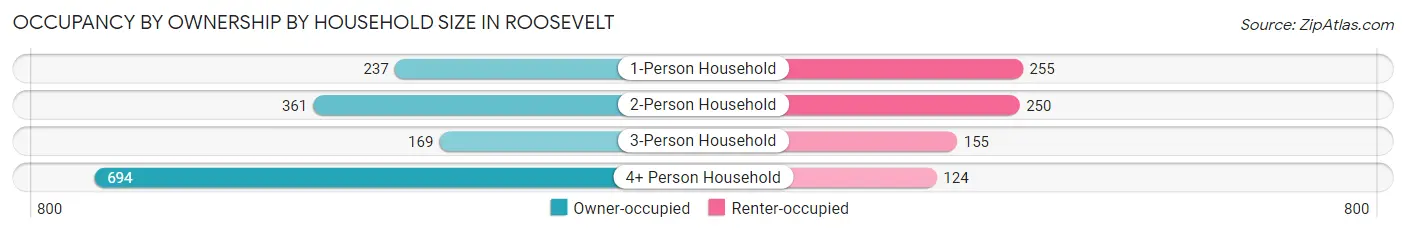
| Household Size | Owner-occupied | Renter-occupied |
| 1-Person Household | 237 (48.2%) | 255 (51.8%) |
| 2-Person Household | 361 (59.1%) | 250 (40.9%) |
| 3-Person Household | 169 (52.2%) | 155 (47.8%) |
| 4+ Person Household | 694 (84.8%) | 124 (15.2%) |
| Total Housing Units | 1,461 (65.1%) | 784 (34.9%) |
Occupancy by Educational Attainment in Roosevelt
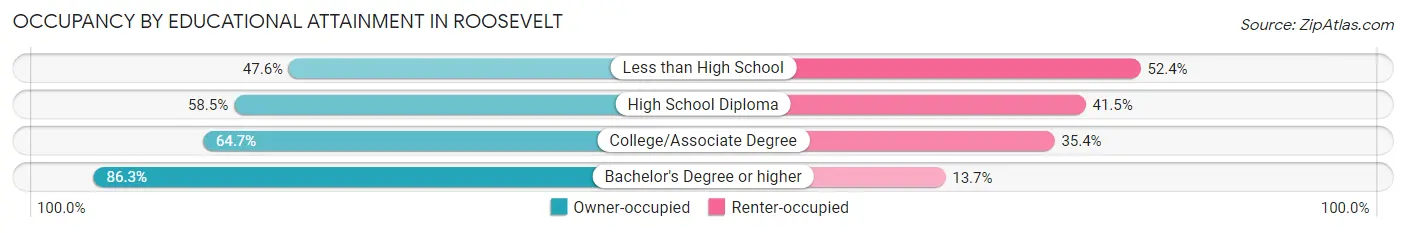
| Household Size | Owner-occupied | Renter-occupied |
| Less than High School | 139 (47.6%) | 153 (52.4%) |
| High School Diploma | 396 (58.5%) | 281 (41.5%) |
| College/Associate Degree | 523 (64.6%) | 286 (35.3%) |
| Bachelor's Degree or higher | 403 (86.3%) | 64 (13.7%) |
Occupancy by Age of Householder in Roosevelt
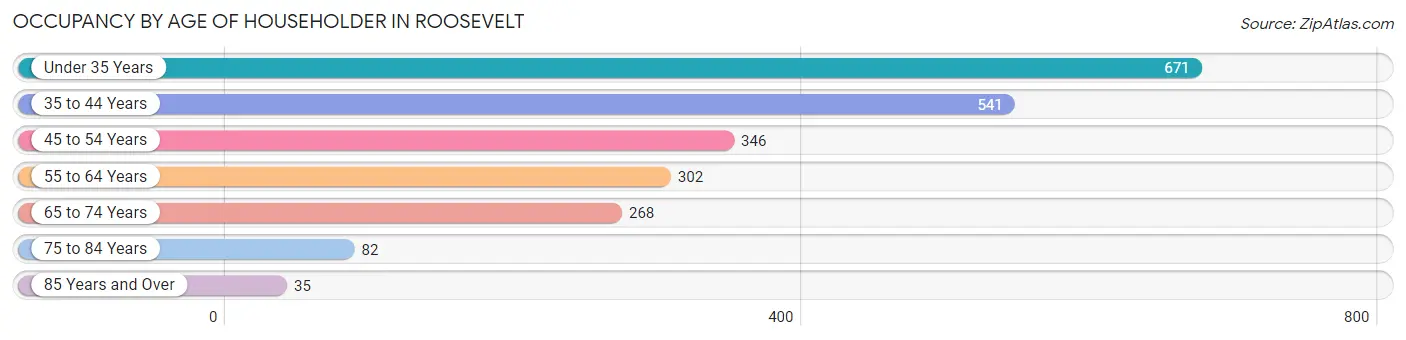
| Age Bracket | # Households | % Households |
| Under 35 Years | 671 | 29.9% |
| 35 to 44 Years | 541 | 24.1% |
| 45 to 54 Years | 346 | 15.4% |
| 55 to 64 Years | 302 | 13.5% |
| 65 to 74 Years | 268 | 11.9% |
| 75 to 84 Years | 82 | 3.6% |
| 85 Years and Over | 35 | 1.6% |
| Total | 2,245 | 100.0% |
Housing Finances in Roosevelt
Median Income by Occupancy in Roosevelt
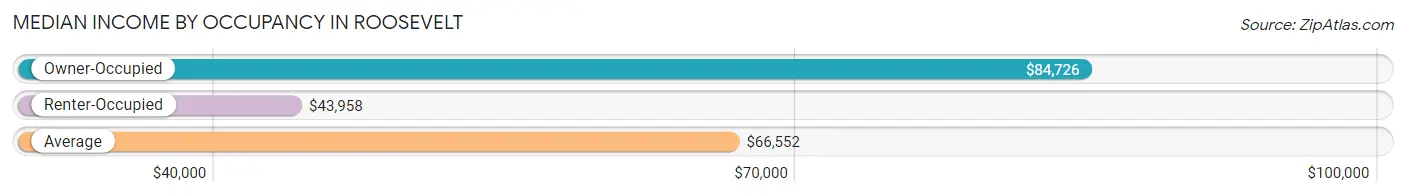
| Occupancy Type | # Households | Median Income |
| Owner-Occupied | 1,461 (65.1%) | $84,726 |
| Renter-Occupied | 784 (34.9%) | $43,958 |
| Average | 2,245 (100.0%) | $66,552 |
Occupancy by Householder Income Bracket in Roosevelt
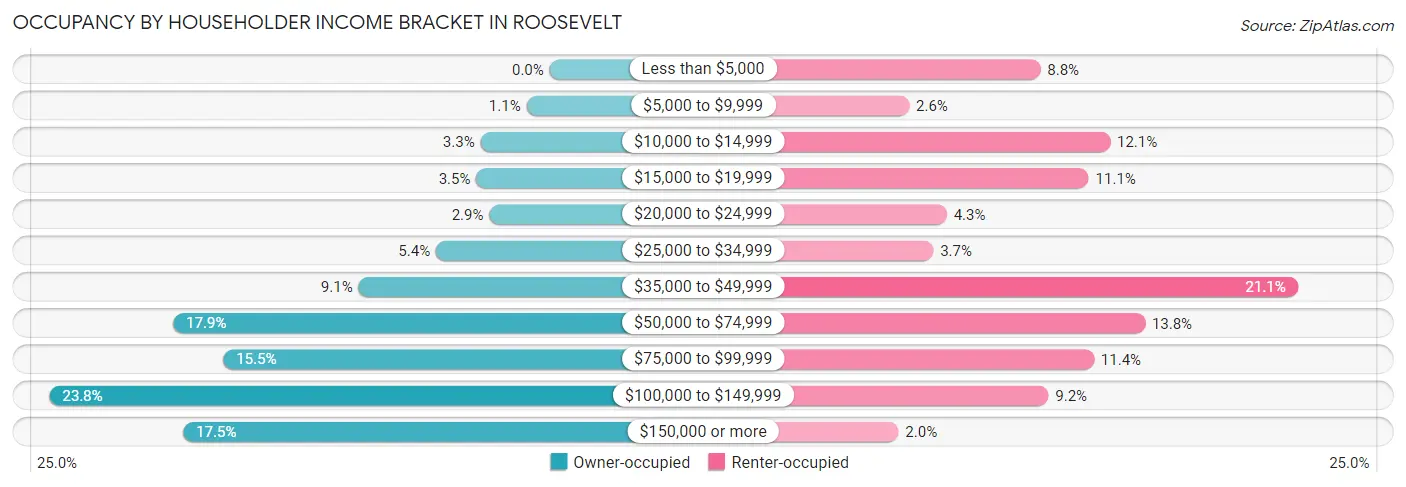
| Income Bracket | Owner-occupied | Renter-occupied |
| Less than $5,000 | 0 (0.0%) | 69 (8.8%) |
| $5,000 to $9,999 | 16 (1.1%) | 20 (2.5%) |
| $10,000 to $14,999 | 48 (3.3%) | 95 (12.1%) |
| $15,000 to $19,999 | 51 (3.5%) | 87 (11.1%) |
| $20,000 to $24,999 | 42 (2.9%) | 34 (4.3%) |
| $25,000 to $34,999 | 79 (5.4%) | 29 (3.7%) |
| $35,000 to $49,999 | 133 (9.1%) | 165 (21.0%) |
| $50,000 to $74,999 | 262 (17.9%) | 108 (13.8%) |
| $75,000 to $99,999 | 227 (15.5%) | 89 (11.4%) |
| $100,000 to $149,999 | 348 (23.8%) | 72 (9.2%) |
| $150,000 or more | 255 (17.4%) | 16 (2.0%) |
| Total | 1,461 (100.0%) | 784 (100.0%) |
Monthly Housing Cost Tiers in Roosevelt
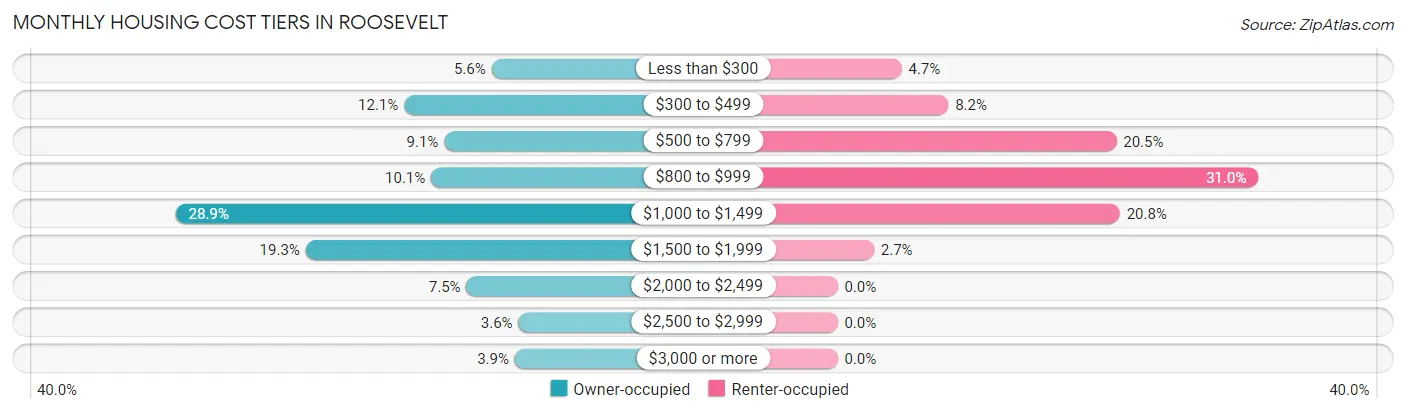
| Monthly Cost | Owner-occupied | Renter-occupied |
| Less than $300 | 82 (5.6%) | 37 (4.7%) |
| $300 to $499 | 176 (12.0%) | 64 (8.2%) |
| $500 to $799 | 133 (9.1%) | 161 (20.5%) |
| $800 to $999 | 147 (10.1%) | 243 (31.0%) |
| $1,000 to $1,499 | 422 (28.9%) | 163 (20.8%) |
| $1,500 to $1,999 | 282 (19.3%) | 21 (2.7%) |
| $2,000 to $2,499 | 109 (7.5%) | 0 (0.0%) |
| $2,500 to $2,999 | 53 (3.6%) | 0 (0.0%) |
| $3,000 or more | 57 (3.9%) | 0 (0.0%) |
| Total | 1,461 (100.0%) | 784 (100.0%) |
Physical Housing Characteristics in Roosevelt
Housing Structures in Roosevelt
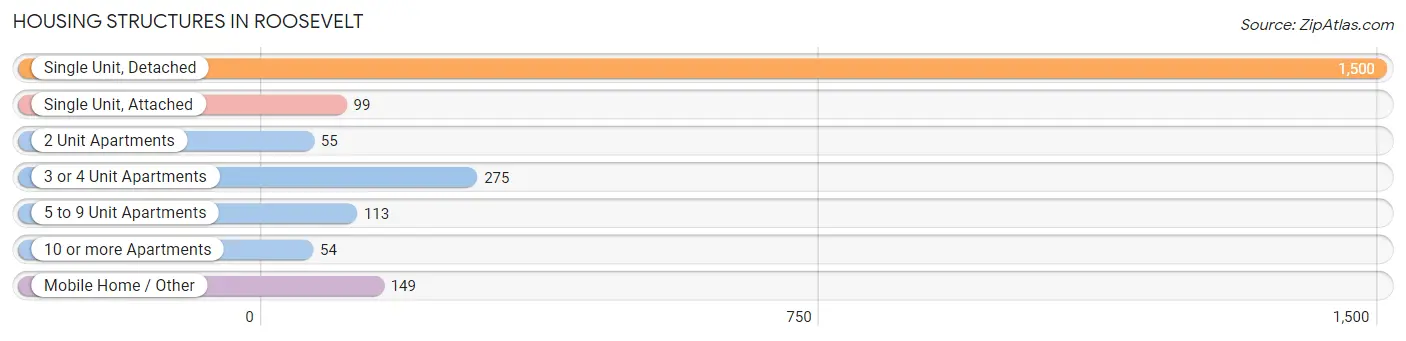
| Structure Type | # Housing Units | % Housing Units |
| Single Unit, Detached | 1,500 | 66.8% |
| Single Unit, Attached | 99 | 4.4% |
| 2 Unit Apartments | 55 | 2.5% |
| 3 or 4 Unit Apartments | 275 | 12.2% |
| 5 to 9 Unit Apartments | 113 | 5.0% |
| 10 or more Apartments | 54 | 2.4% |
| Mobile Home / Other | 149 | 6.6% |
| Total | 2,245 | 100.0% |
Housing Structures by Occupancy in Roosevelt
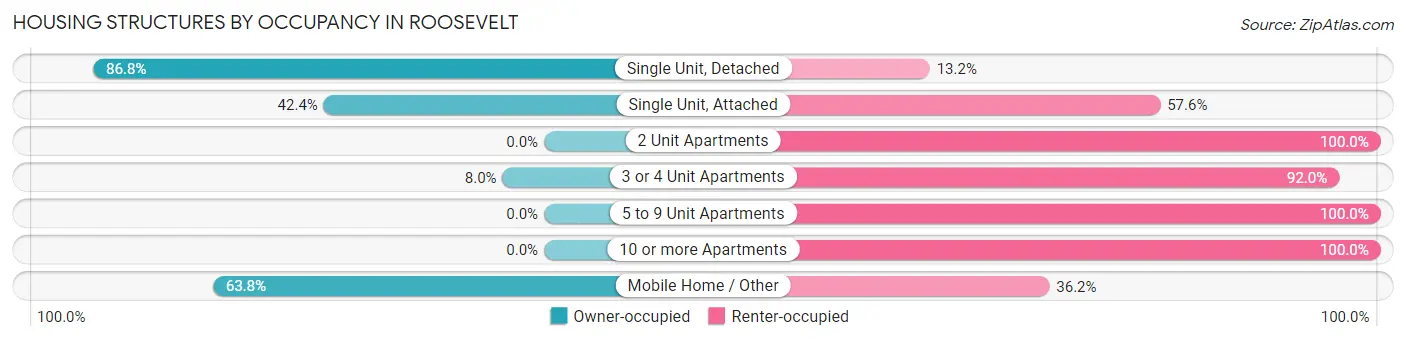
| Structure Type | Owner-occupied | Renter-occupied |
| Single Unit, Detached | 1,302 (86.8%) | 198 (13.2%) |
| Single Unit, Attached | 42 (42.4%) | 57 (57.6%) |
| 2 Unit Apartments | 0 (0.0%) | 55 (100.0%) |
| 3 or 4 Unit Apartments | 22 (8.0%) | 253 (92.0%) |
| 5 to 9 Unit Apartments | 0 (0.0%) | 113 (100.0%) |
| 10 or more Apartments | 0 (0.0%) | 54 (100.0%) |
| Mobile Home / Other | 95 (63.8%) | 54 (36.2%) |
| Total | 1,461 (65.1%) | 784 (34.9%) |
Housing Structures by Number of Rooms in Roosevelt
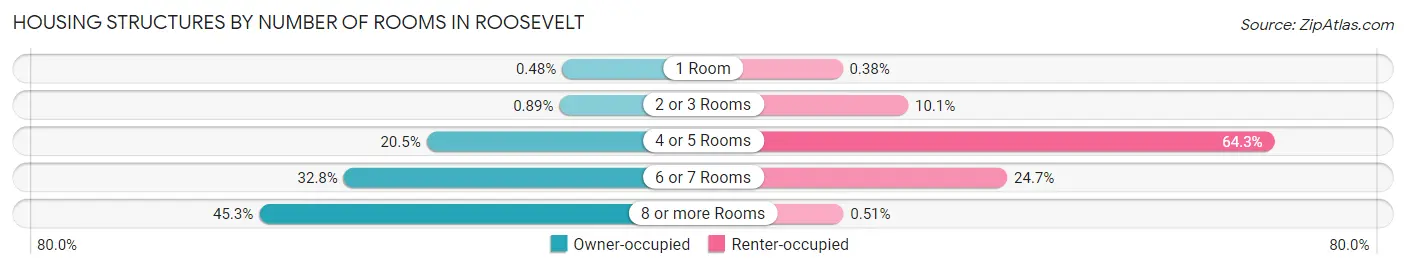
| Number of Rooms | Owner-occupied | Renter-occupied |
| 1 Room | 7 (0.5%) | 3 (0.4%) |
| 2 or 3 Rooms | 13 (0.9%) | 79 (10.1%) |
| 4 or 5 Rooms | 300 (20.5%) | 504 (64.3%) |
| 6 or 7 Rooms | 479 (32.8%) | 194 (24.7%) |
| 8 or more Rooms | 662 (45.3%) | 4 (0.5%) |
| Total | 1,461 (100.0%) | 784 (100.0%) |
Housing Structure by Heating Type in Roosevelt
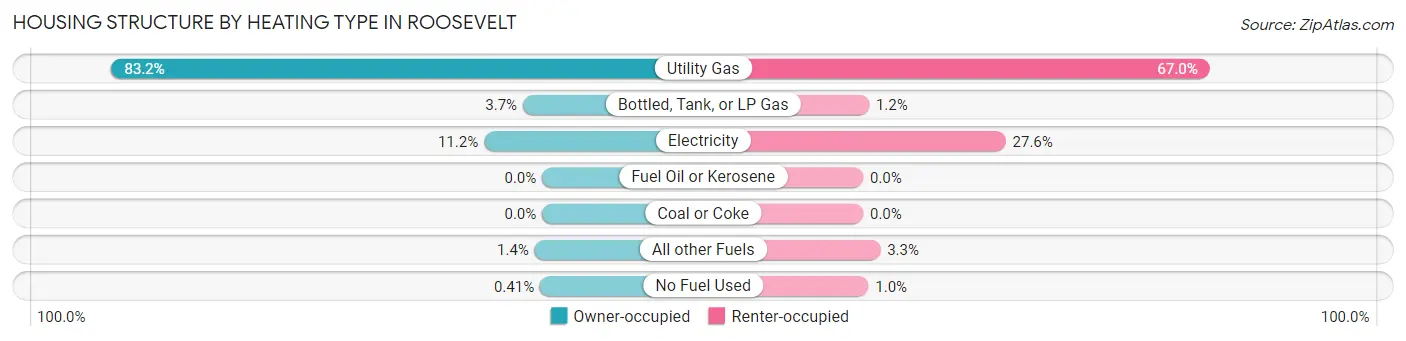
| Heating Type | Owner-occupied | Renter-occupied |
| Utility Gas | 1,216 (83.2%) | 525 (67.0%) |
| Bottled, Tank, or LP Gas | 54 (3.7%) | 9 (1.1%) |
| Electricity | 164 (11.2%) | 216 (27.6%) |
| Fuel Oil or Kerosene | 0 (0.0%) | 0 (0.0%) |
| Coal or Coke | 0 (0.0%) | 0 (0.0%) |
| All other Fuels | 21 (1.4%) | 26 (3.3%) |
| No Fuel Used | 6 (0.4%) | 8 (1.0%) |
| Total | 1,461 (100.0%) | 784 (100.0%) |
Household Vehicle Usage in Roosevelt
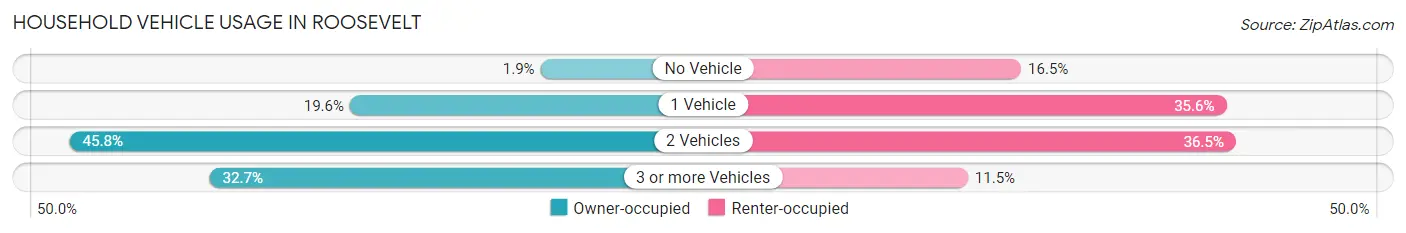
| Vehicles per Household | Owner-occupied | Renter-occupied |
| No Vehicle | 27 (1.8%) | 129 (16.5%) |
| 1 Vehicle | 287 (19.6%) | 279 (35.6%) |
| 2 Vehicles | 669 (45.8%) | 286 (36.5%) |
| 3 or more Vehicles | 478 (32.7%) | 90 (11.5%) |
| Total | 1,461 (100.0%) | 784 (100.0%) |
Real Estate & Mortgages in Roosevelt
Real Estate and Mortgage Overview in Roosevelt
| Characteristic | Without Mortgage | With Mortgage |
| Housing Units | 419 | 1,042 |
| Median Property Value | $226,200 | $251,000 |
| Median Household Income | $67,708 | $199 |
| Monthly Housing Costs | $453 | $57 |
| Real Estate Taxes | $1,559 | $12 |
Property Value by Mortgage Status in Roosevelt
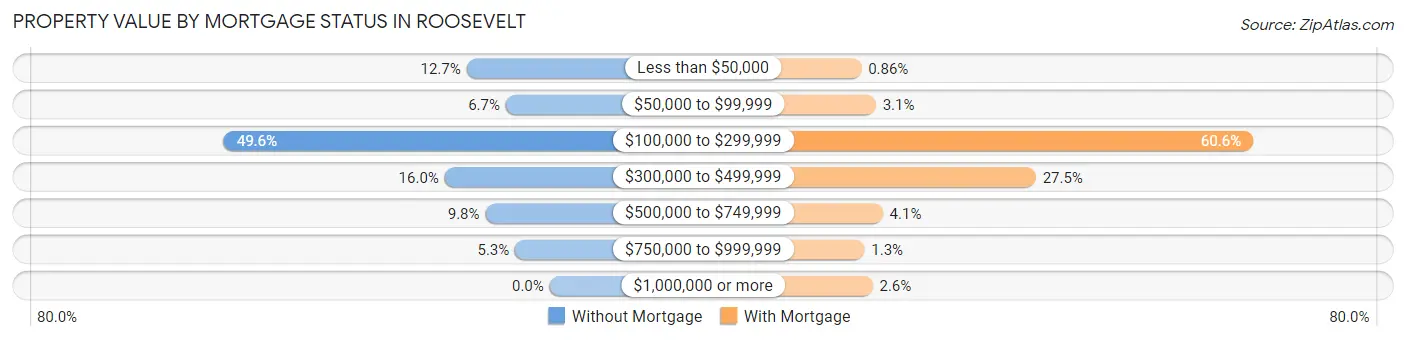
| Property Value | Without Mortgage | With Mortgage |
| Less than $50,000 | 53 (12.7%) | 9 (0.9%) |
| $50,000 to $99,999 | 28 (6.7%) | 32 (3.1%) |
| $100,000 to $299,999 | 208 (49.6%) | 631 (60.6%) |
| $300,000 to $499,999 | 67 (16.0%) | 286 (27.5%) |
| $500,000 to $749,999 | 41 (9.8%) | 43 (4.1%) |
| $750,000 to $999,999 | 22 (5.2%) | 14 (1.3%) |
| $1,000,000 or more | 0 (0.0%) | 27 (2.6%) |
| Total | 419 (100.0%) | 1,042 (100.0%) |
Household Income by Mortgage Status in Roosevelt
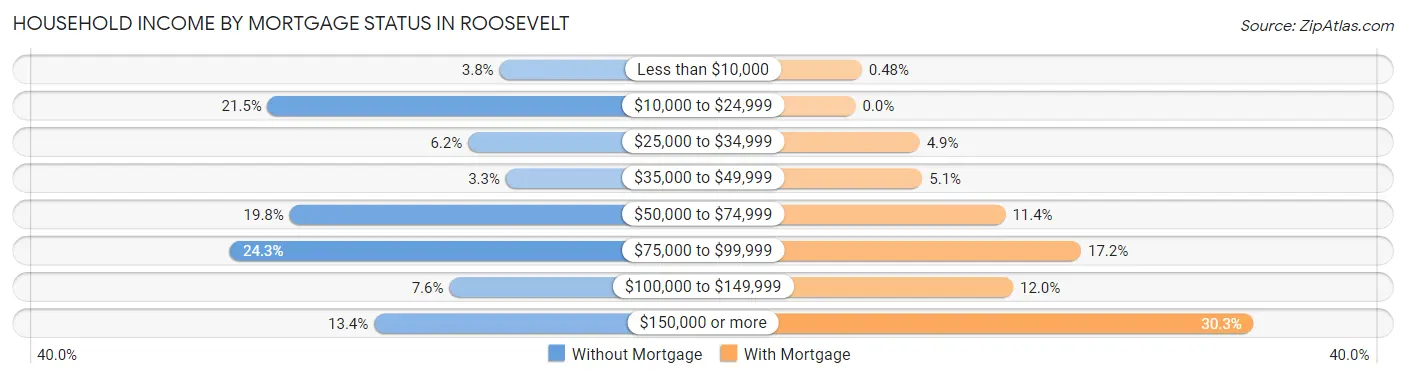
| Household Income | Without Mortgage | With Mortgage |
| Less than $10,000 | 16 (3.8%) | 5 (0.5%) |
| $10,000 to $24,999 | 90 (21.5%) | 0 (0.0%) |
| $25,000 to $34,999 | 26 (6.2%) | 51 (4.9%) |
| $35,000 to $49,999 | 14 (3.3%) | 53 (5.1%) |
| $50,000 to $74,999 | 83 (19.8%) | 119 (11.4%) |
| $75,000 to $99,999 | 102 (24.3%) | 179 (17.2%) |
| $100,000 to $149,999 | 32 (7.6%) | 125 (12.0%) |
| $150,000 or more | 56 (13.4%) | 316 (30.3%) |
| Total | 419 (100.0%) | 1,042 (100.0%) |
Property Value to Household Income Ratio in Roosevelt
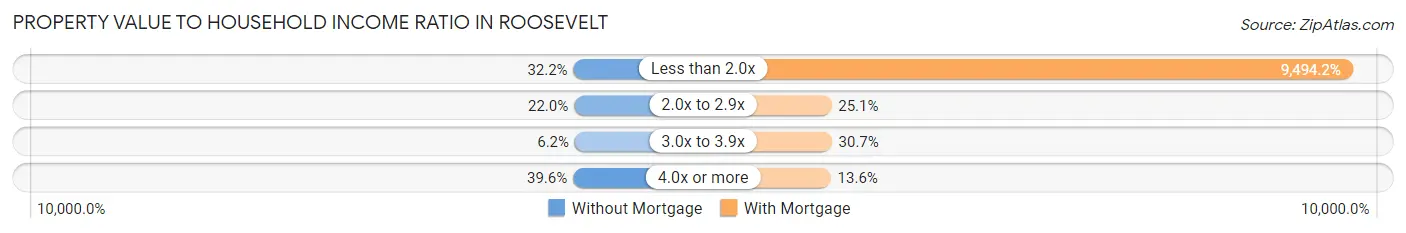
| Value-to-Income Ratio | Without Mortgage | With Mortgage |
| Less than 2.0x | 135 (32.2%) | 98,929 (9,494.2%) |
| 2.0x to 2.9x | 92 (22.0%) | 261 (25.1%) |
| 3.0x to 3.9x | 26 (6.2%) | 320 (30.7%) |
| 4.0x or more | 166 (39.6%) | 142 (13.6%) |
| Total | 419 (100.0%) | 1,042 (100.0%) |
Real Estate Taxes by Mortgage Status in Roosevelt
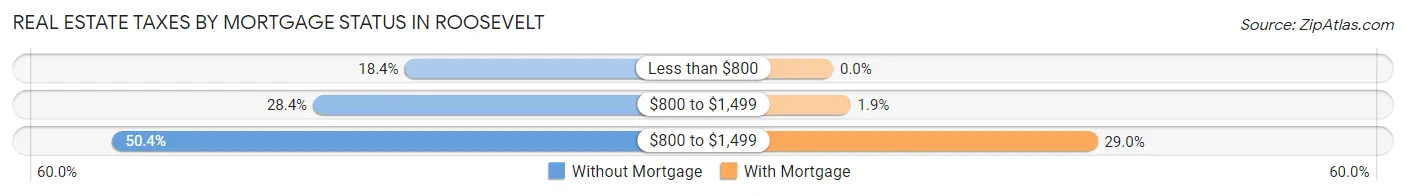
| Property Taxes | Without Mortgage | With Mortgage |
| Less than $800 | 77 (18.4%) | 0 (0.0%) |
| $800 to $1,499 | 119 (28.4%) | 20 (1.9%) |
| $800 to $1,499 | 211 (50.4%) | 302 (29.0%) |
| Total | 419 (100.0%) | 1,042 (100.0%) |
Health & Disability in Roosevelt
Health Insurance Coverage by Age in Roosevelt
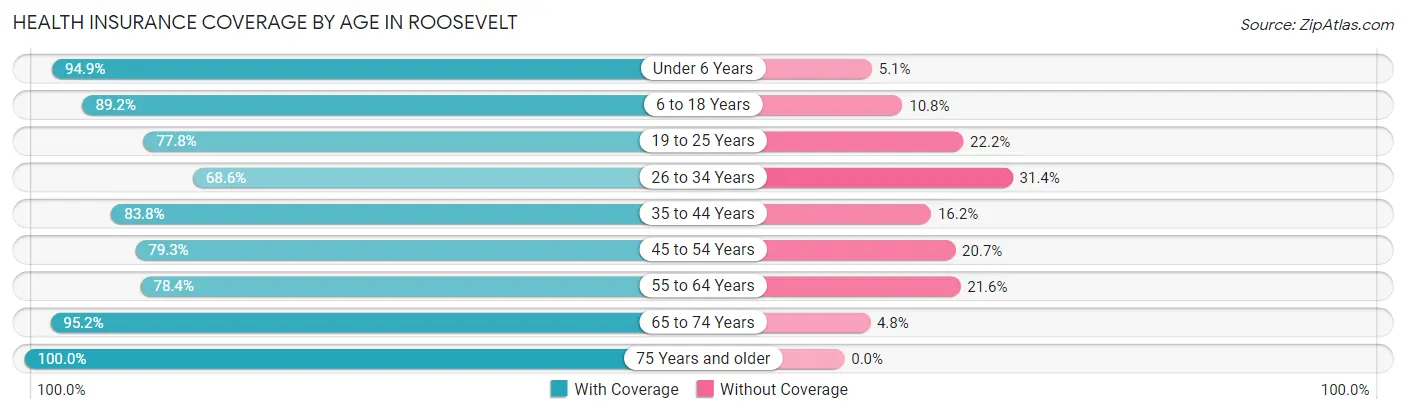
| Age Bracket | With Coverage | Without Coverage |
| Under 6 Years | 850 (94.9%) | 46 (5.1%) |
| 6 to 18 Years | 1,434 (89.2%) | 174 (10.8%) |
| 19 to 25 Years | 495 (77.8%) | 141 (22.2%) |
| 26 to 34 Years | 717 (68.6%) | 328 (31.4%) |
| 35 to 44 Years | 793 (83.8%) | 153 (16.2%) |
| 45 to 54 Years | 495 (79.3%) | 129 (20.7%) |
| 55 to 64 Years | 413 (78.4%) | 114 (21.6%) |
| 65 to 74 Years | 378 (95.2%) | 19 (4.8%) |
| 75 Years and older | 165 (100.0%) | 0 (0.0%) |
| Total | 5,740 (83.9%) | 1,104 (16.1%) |
Health Insurance Coverage by Citizenship Status in Roosevelt
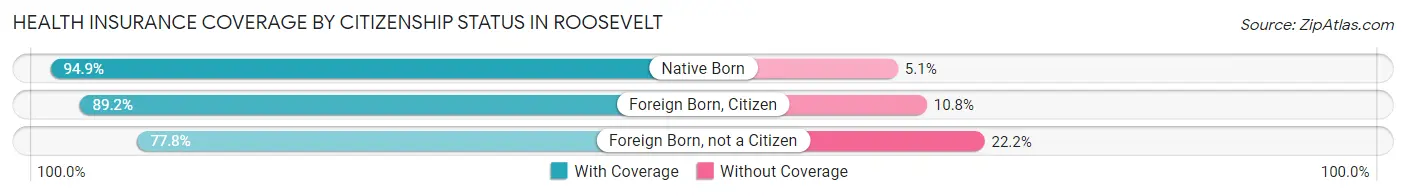
| Citizenship Status | With Coverage | Without Coverage |
| Native Born | 850 (94.9%) | 46 (5.1%) |
| Foreign Born, Citizen | 1,434 (89.2%) | 174 (10.8%) |
| Foreign Born, not a Citizen | 495 (77.8%) | 141 (22.2%) |
Health Insurance Coverage by Household Income in Roosevelt
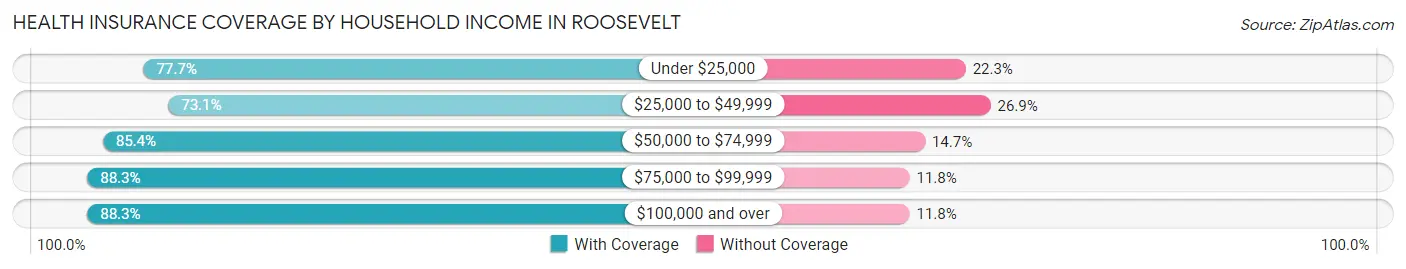
| Household Income | With Coverage | Without Coverage |
| Under $25,000 | 736 (77.7%) | 211 (22.3%) |
| $25,000 to $49,999 | 822 (73.1%) | 303 (26.9%) |
| $50,000 to $74,999 | 979 (85.4%) | 168 (14.6%) |
| $75,000 to $99,999 | 849 (88.2%) | 113 (11.7%) |
| $100,000 and over | 2,320 (88.2%) | 309 (11.7%) |
Public vs Private Health Insurance Coverage by Age in Roosevelt
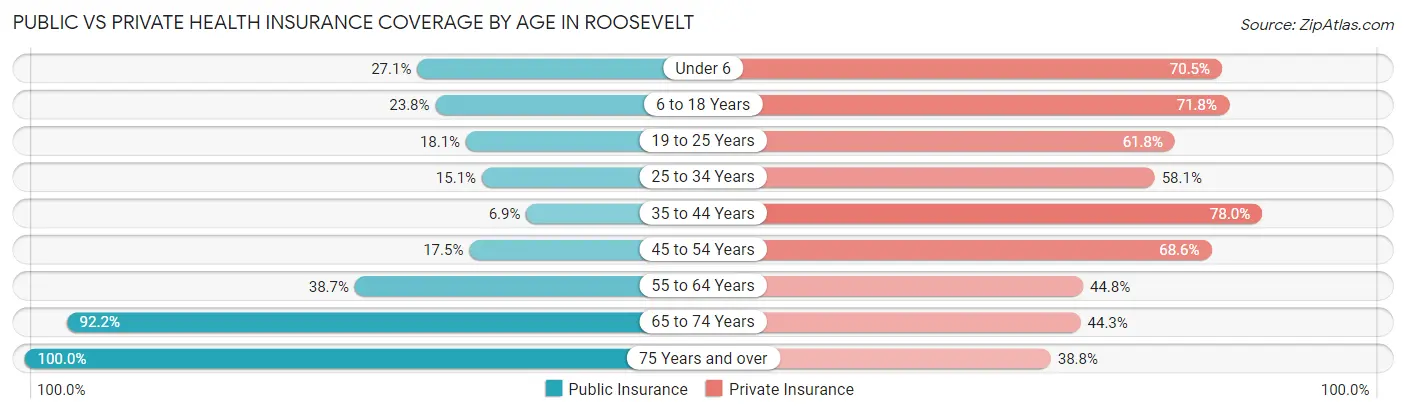
| Age Bracket | Public Insurance | Private Insurance |
| Under 6 | 243 (27.1%) | 632 (70.5%) |
| 6 to 18 Years | 382 (23.8%) | 1,155 (71.8%) |
| 19 to 25 Years | 115 (18.1%) | 393 (61.8%) |
| 25 to 34 Years | 158 (15.1%) | 607 (58.1%) |
| 35 to 44 Years | 65 (6.9%) | 738 (78.0%) |
| 45 to 54 Years | 109 (17.5%) | 428 (68.6%) |
| 55 to 64 Years | 204 (38.7%) | 236 (44.8%) |
| 65 to 74 Years | 366 (92.2%) | 176 (44.3%) |
| 75 Years and over | 165 (100.0%) | 64 (38.8%) |
| Total | 1,807 (26.4%) | 4,429 (64.7%) |
Disability Status by Sex by Age in Roosevelt
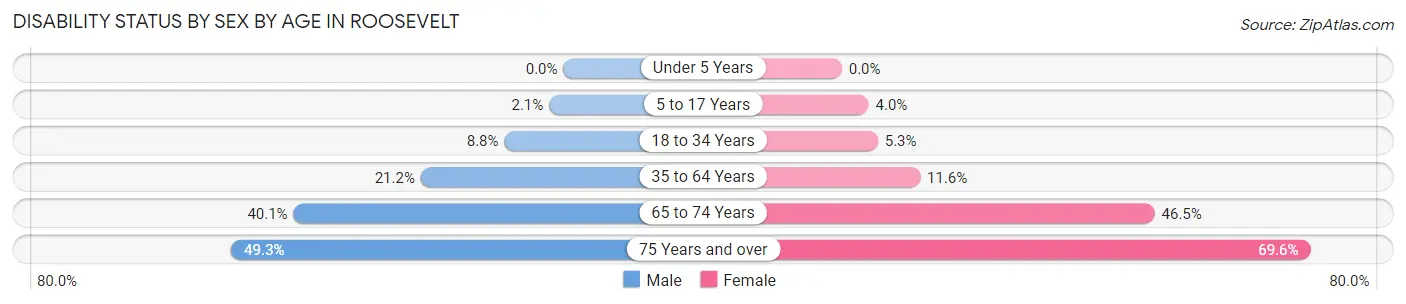
| Age Bracket | Male | Female |
| Under 5 Years | 0 (0.0%) | 0 (0.0%) |
| 5 to 17 Years | 17 (2.1%) | 35 (4.0%) |
| 18 to 34 Years | 85 (8.8%) | 45 (5.3%) |
| 35 to 64 Years | 222 (21.2%) | 122 (11.6%) |
| 65 to 74 Years | 97 (40.1%) | 72 (46.5%) |
| 75 Years and over | 36 (49.3%) | 64 (69.6%) |
Disability Class by Sex by Age in Roosevelt
Disability Class: Hearing Difficulty
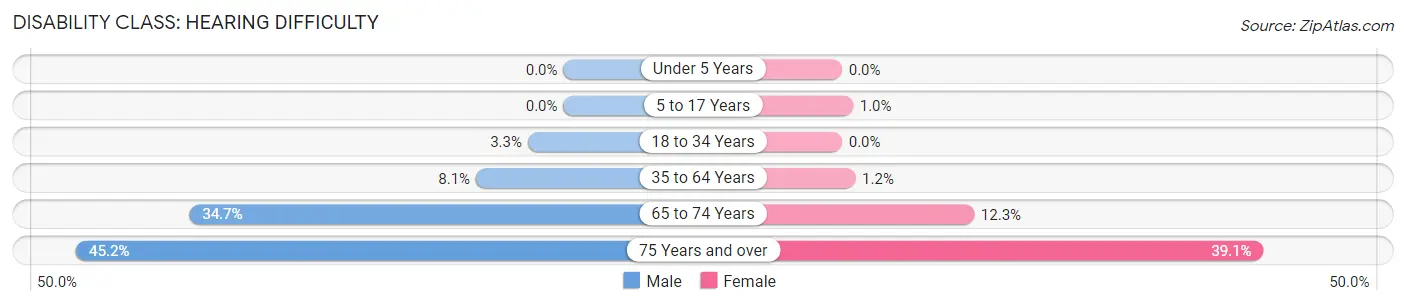
| Age Bracket | Male | Female |
| Under 5 Years | 0 (0.0%) | 0 (0.0%) |
| 5 to 17 Years | 0 (0.0%) | 9 (1.0%) |
| 18 to 34 Years | 32 (3.3%) | 0 (0.0%) |
| 35 to 64 Years | 85 (8.1%) | 13 (1.2%) |
| 65 to 74 Years | 84 (34.7%) | 19 (12.3%) |
| 75 Years and over | 33 (45.2%) | 36 (39.1%) |
Disability Class: Vision Difficulty
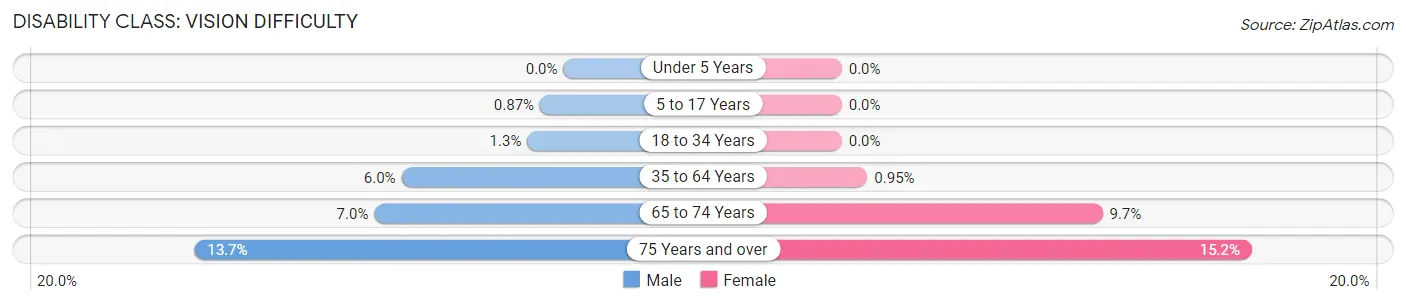
| Age Bracket | Male | Female |
| Under 5 Years | 0 (0.0%) | 0 (0.0%) |
| 5 to 17 Years | 7 (0.9%) | 0 (0.0%) |
| 18 to 34 Years | 13 (1.3%) | 0 (0.0%) |
| 35 to 64 Years | 63 (6.0%) | 10 (0.9%) |
| 65 to 74 Years | 17 (7.0%) | 15 (9.7%) |
| 75 Years and over | 10 (13.7%) | 14 (15.2%) |
Disability Class: Cognitive Difficulty
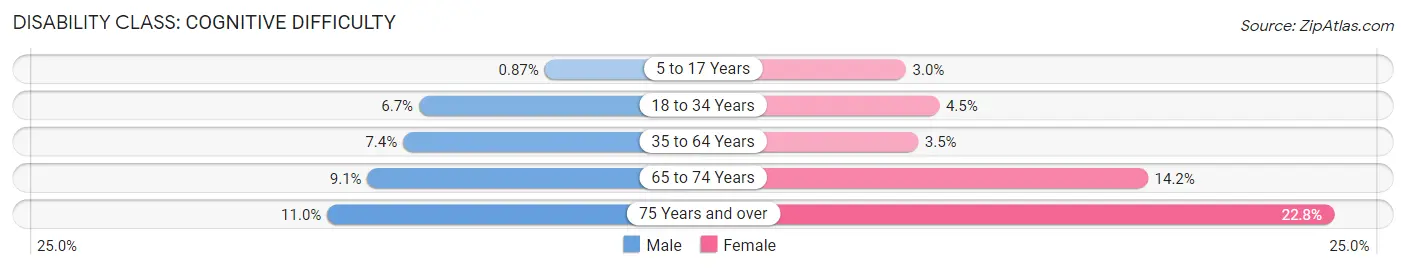
| Age Bracket | Male | Female |
| 5 to 17 Years | 7 (0.9%) | 26 (3.0%) |
| 18 to 34 Years | 65 (6.7%) | 38 (4.5%) |
| 35 to 64 Years | 78 (7.4%) | 37 (3.5%) |
| 65 to 74 Years | 22 (9.1%) | 22 (14.2%) |
| 75 Years and over | 8 (11.0%) | 21 (22.8%) |
Disability Class: Ambulatory Difficulty
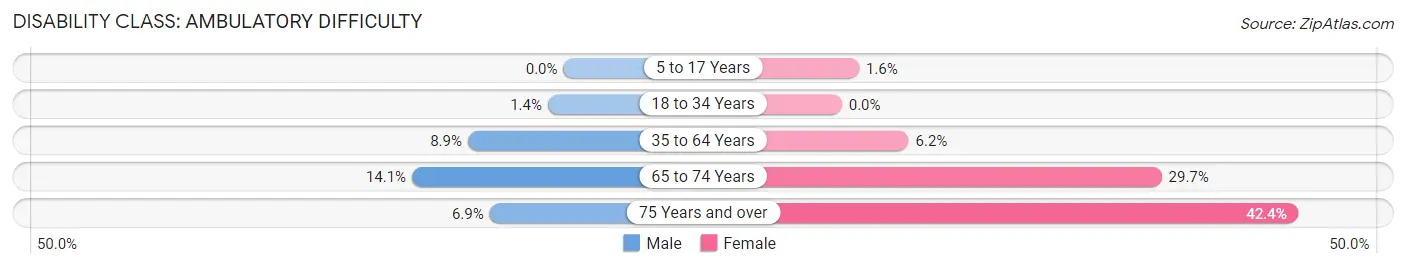
| Age Bracket | Male | Female |
| 5 to 17 Years | 0 (0.0%) | 14 (1.6%) |
| 18 to 34 Years | 14 (1.4%) | 0 (0.0%) |
| 35 to 64 Years | 93 (8.9%) | 65 (6.2%) |
| 65 to 74 Years | 34 (14.1%) | 46 (29.7%) |
| 75 Years and over | 5 (6.9%) | 39 (42.4%) |
Disability Class: Self-Care Difficulty
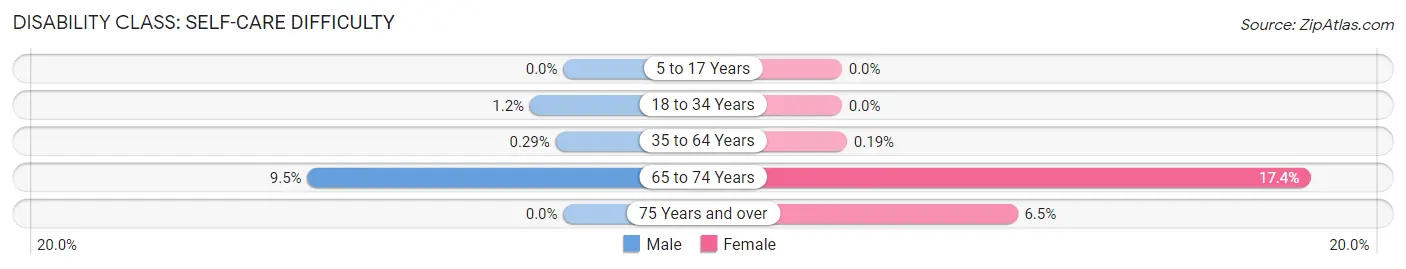
| Age Bracket | Male | Female |
| 5 to 17 Years | 0 (0.0%) | 0 (0.0%) |
| 18 to 34 Years | 12 (1.2%) | 0 (0.0%) |
| 35 to 64 Years | 3 (0.3%) | 2 (0.2%) |
| 65 to 74 Years | 23 (9.5%) | 27 (17.4%) |
| 75 Years and over | 0 (0.0%) | 6 (6.5%) |
Technology Access in Roosevelt
Computing Device Access in Roosevelt
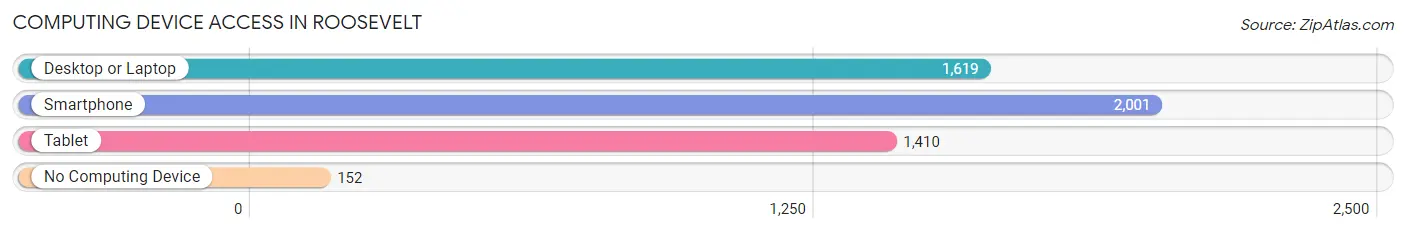
| Device Type | # Households | % Households |
| Desktop or Laptop | 1,619 | 72.1% |
| Smartphone | 2,001 | 89.1% |
| Tablet | 1,410 | 62.8% |
| No Computing Device | 152 | 6.8% |
| Total | 2,245 | 100.0% |
Internet Access in Roosevelt
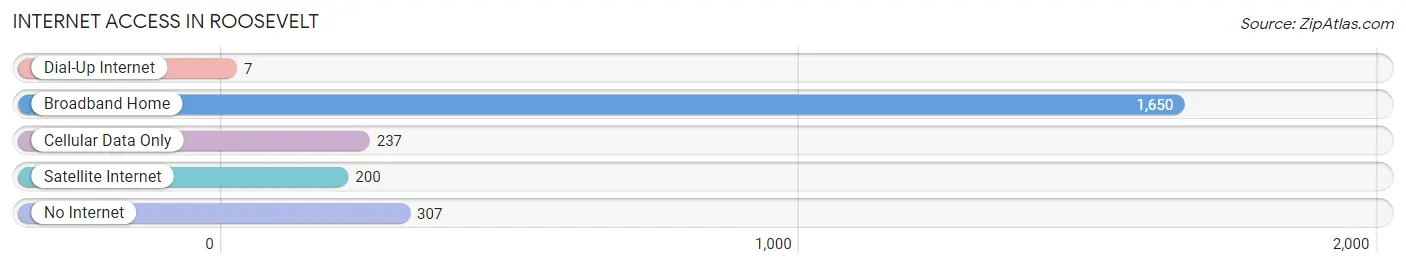
| Internet Type | # Households | % Households |
| Dial-Up Internet | 7 | 0.3% |
| Broadband Home | 1,650 | 73.5% |
| Cellular Data Only | 237 | 10.6% |
| Satellite Internet | 200 | 8.9% |
| No Internet | 307 | 13.7% |
| Total | 2,245 | 100.0% |
Roosevelt Summary
Roosevelt is a city located in the Uintah Basin of northeastern Utah, United States. It is the county seat of Duchesne County and is located in the heart of the Uintah Basin. The city is named after former President Theodore Roosevelt. As of the 2010 census, the population of Roosevelt was 6,046.
Geography
Roosevelt is located at the intersection of U.S. Route 40 and State Route 121 in the Uintah Basin of northeastern Utah. The city is situated at an elevation of 4,945 feet (1,507 m) above sea level. The city is located in the heart of the Uintah Basin, which is a large, flat, arid region of the state. The Uintah Basin is bounded by the Uinta Mountains to the east, the Wasatch Plateau to the west, the Tavaputs Plateau to the north, and the Book Cliffs to the south. The city is located approximately 75 miles (121 km) east of Salt Lake City and approximately 40 miles (64 km) west of Vernal.
Climate
Roosevelt has a semi-arid climate, with hot summers and cold winters. The average annual temperature is 48.3°F (9.1°C). The average high temperature in July is 90°F (32°C), and the average low temperature in January is 11°F (-12°C). The average annual precipitation is 11.3 inches (286 mm).
Demographics
As of the 2010 census, there were 6,046 people, 1,845 households, and 1,521 families residing in the city. The population density was 1,092.3 people per square mile (422.2/km2). The racial makeup of the city was 87.2% White, 0.3% African American, 0.7% Native American, 0.4% Asian, 0.1% Pacific Islander, 8.7% from other races, and 2.6% from two or more races. Hispanic or Latino of any race were 16.3% of the population.
Economy
The economy of Roosevelt is largely based on agriculture and energy production. The city is home to several large agricultural operations, including cattle ranches, dairy farms, and hay farms. The city is also home to several energy production facilities, including oil and gas wells, coal mines, and power plants. The city is also home to several manufacturing companies, including a plastics plant and a food processing plant.
The city is served by the Roosevelt Municipal Airport, which is located just outside of the city limits. The airport is used for general aviation and is served by several regional airlines.
Conclusion
Roosevelt is a city located in the Uintah Basin of northeastern Utah, United States. It is the county seat of Duchesne County and is located in the heart of the Uintah Basin. The city is named after former President Theodore Roosevelt. As of the 2010 census, the population of Roosevelt was 6,046. The city has a semi-arid climate, with hot summers and cold winters. The economy of Roosevelt is largely based on agriculture and energy production. The city is served by the Roosevelt Municipal Airport, which is used for general aviation and is served by several regional airlines.
Common Questions
What is Per Capita Income in Roosevelt?
Per Capita income in Roosevelt is $28,828.
What is the Median Family Income in Roosevelt?
Median Family Income in Roosevelt is $78,287.
What is the Median Household income in Roosevelt?
Median Household Income in Roosevelt is $66,552.
What is Income or Wage Gap in Roosevelt?
Income or Wage Gap in Roosevelt is 62.8%.
Women in Roosevelt earn 37.2 cents for every dollar earned by a man.
What is Family Income Deficit in Roosevelt?
Family Income Deficit in Roosevelt is $13,208.
Families that are below poverty line in Roosevelt earn $13,208 less on average than the poverty threshold level.
What is Inequality or Gini Index in Roosevelt?
Inequality or Gini Index in Roosevelt is 0.46.
What is the Total Population of Roosevelt?
Total Population of Roosevelt is 6,884.
What is the Total Male Population of Roosevelt?
Total Male Population of Roosevelt is 3,494.
What is the Total Female Population of Roosevelt?
Total Female Population of Roosevelt is 3,390.
What is the Ratio of Males per 100 Females in Roosevelt?
There are 103.07 Males per 100 Females in Roosevelt.
What is the Ratio of Females per 100 Males in Roosevelt?
There are 97.02 Females per 100 Males in Roosevelt.
What is the Median Population Age in Roosevelt?
Median Population Age in Roosevelt is 28.7 Years.
What is the Average Family Size in Roosevelt
Average Family Size in Roosevelt is 3.6 People.
What is the Average Household Size in Roosevelt
Average Household Size in Roosevelt is 3.0 People.
How Large is the Labor Force in Roosevelt?
There are 3,044 People in the Labor Forcein in Roosevelt.
What is the Percentage of People in the Labor Force in Roosevelt?
65.1% of People are in the Labor Force in Roosevelt.
What is the Unemployment Rate in Roosevelt?
Unemployment Rate in Roosevelt is 6.8%.