Brigham City, UT Map & Demographics
Brigham City Map
Brigham City Overview
$29,047
PER CAPITA INCOME
$81,348
AVG FAMILY INCOME
$63,315
AVG HOUSEHOLD INCOME
46.3%
WAGE / INCOME GAP [ % ]
53.7¢/ $1
WAGE / INCOME GAP [ $ ]
$10,694
FAMILY INCOME DEFICIT
0.42
INEQUALITY / GINI INDEX
19,602
TOTAL POPULATION
9,626
MALE POPULATION
9,976
FEMALE POPULATION
96.49
MALES / 100 FEMALES
103.64
FEMALES / 100 MALES
33.0
MEDIAN AGE
3.5
AVG FAMILY SIZE
2.8
AVG HOUSEHOLD SIZE
9,560
LABOR FORCE [ PEOPLE ]
65.5%
PERCENT IN LABOR FORCE
3.7%
UNEMPLOYMENT RATE
Brigham City Zip Codes
Brigham City Area Codes
Income in Brigham City
Income Overview in Brigham City
Per Capita Income in Brigham City is $29,047, while median incomes of families and households are $81,348 and $63,315 respectively.
| Characteristic | Number | Measure |
| Per Capita Income | 19,602 | $29,047 |
| Median Family Income | 4,647 | $81,348 |
| Mean Family Income | 4,647 | $94,507 |
| Median Household Income | 6,812 | $63,315 |
| Mean Household Income | 6,812 | $78,978 |
| Income Deficit | 4,647 | $10,694 |
| Wage / Income Gap (%) | 19,602 | 46.25% |
| Wage / Income Gap ($) | 19,602 | 53.75¢ per $1 |
| Gini / Inequality Index | 19,602 | 0.42 |
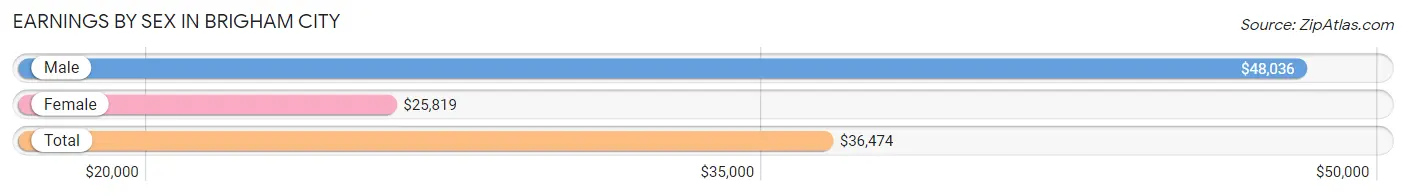
Earnings by Sex in Brigham City
Average Earnings in Brigham City are $36,474, $48,036 for men and $25,819 for women, a difference of 46.3%.
| Sex | Number | Average Earnings |
| Male | 5,397 (54.0%) | $48,036 |
| Female | 4,590 (46.0%) | $25,819 |
| Total | 9,987 (100.0%) | $36,474 |
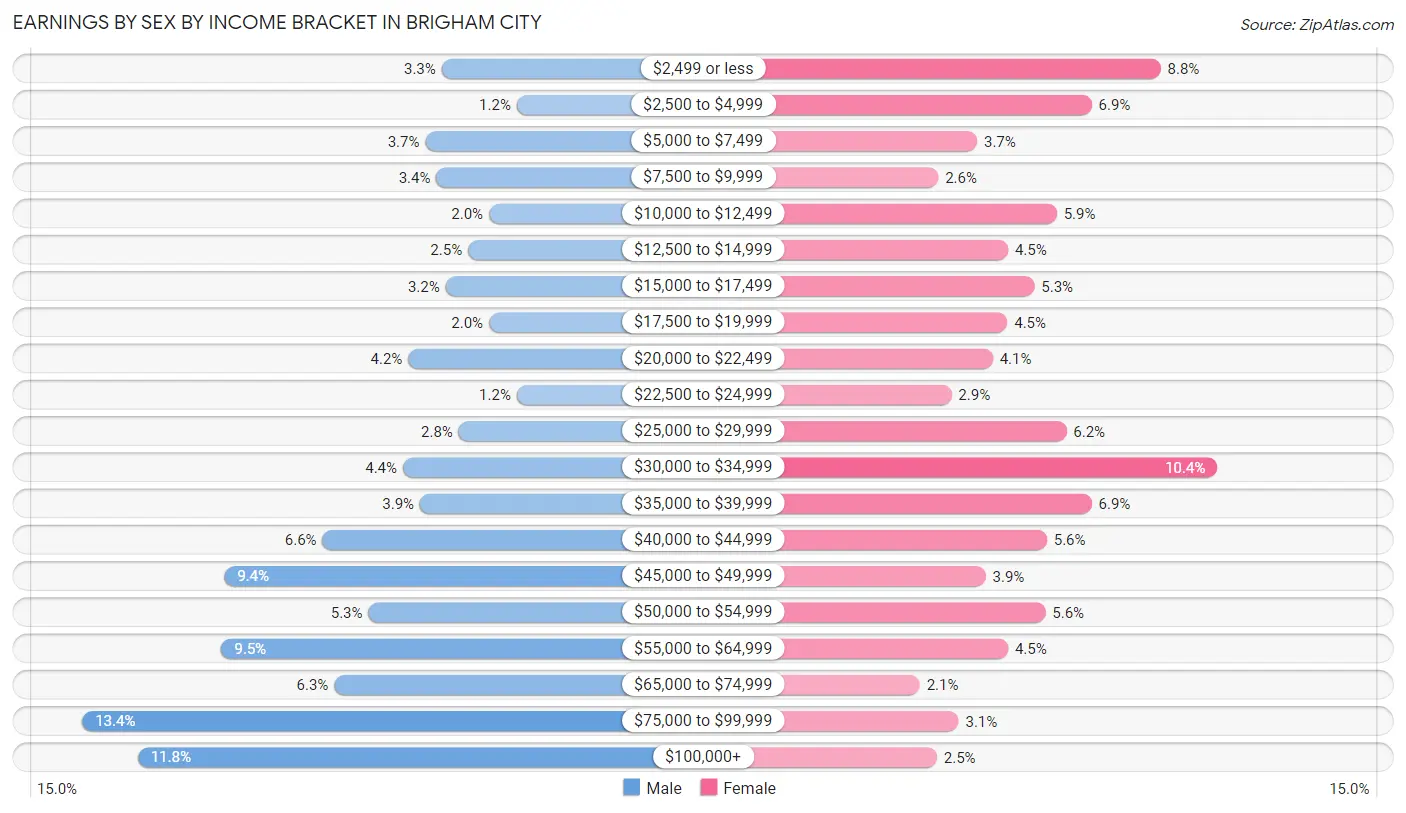
Earnings by Sex by Income Bracket in Brigham City
The most common earnings brackets in Brigham City are $75,000 to $99,999 for men (722 | 13.4%) and $30,000 to $34,999 for women (478 | 10.4%).
| Income | Male | Female |
| $2,499 or less | 177 (3.3%) | 405 (8.8%) |
| $2,500 to $4,999 | 63 (1.2%) | 316 (6.9%) |
| $5,000 to $7,499 | 202 (3.7%) | 168 (3.7%) |
| $7,500 to $9,999 | 185 (3.4%) | 118 (2.6%) |
| $10,000 to $12,499 | 105 (1.9%) | 271 (5.9%) |
| $12,500 to $14,999 | 137 (2.5%) | 208 (4.5%) |
| $15,000 to $17,499 | 171 (3.2%) | 242 (5.3%) |
| $17,500 to $19,999 | 105 (1.9%) | 207 (4.5%) |
| $20,000 to $22,499 | 228 (4.2%) | 188 (4.1%) |
| $22,500 to $24,999 | 63 (1.2%) | 135 (2.9%) |
| $25,000 to $29,999 | 151 (2.8%) | 283 (6.2%) |
| $30,000 to $34,999 | 236 (4.4%) | 478 (10.4%) |
| $35,000 to $39,999 | 210 (3.9%) | 316 (6.9%) |
| $40,000 to $44,999 | 358 (6.6%) | 258 (5.6%) |
| $45,000 to $49,999 | 507 (9.4%) | 179 (3.9%) |
| $50,000 to $54,999 | 288 (5.3%) | 256 (5.6%) |
| $55,000 to $64,999 | 511 (9.5%) | 208 (4.5%) |
| $65,000 to $74,999 | 340 (6.3%) | 94 (2.1%) |
| $75,000 to $99,999 | 722 (13.4%) | 144 (3.1%) |
| $100,000+ | 638 (11.8%) | 116 (2.5%) |
| Total | 5,397 (100.0%) | 4,590 (100.0%) |
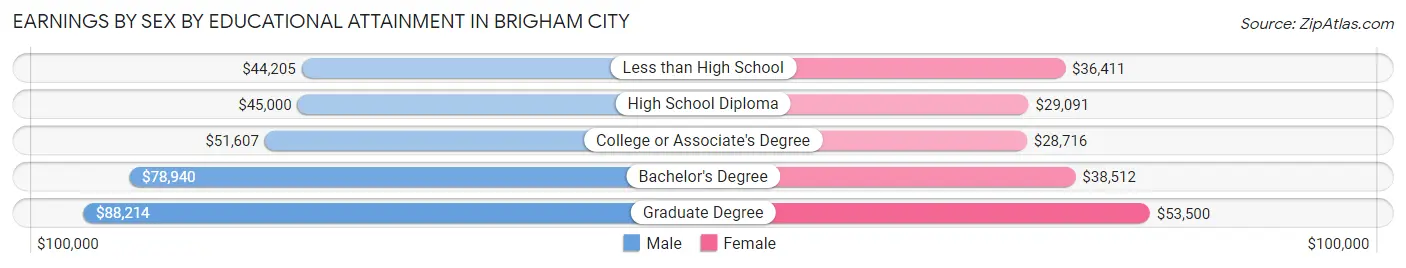
Earnings by Sex by Educational Attainment in Brigham City
Average earnings in Brigham City are $52,755 for men and $32,793 for women, a difference of 37.8%. Men with an educational attainment of graduate degree enjoy the highest average annual earnings of $88,214, while those with less than high school education earn the least with $44,205. Women with an educational attainment of graduate degree earn the most with the average annual earnings of $53,500, while those with college or associate's degree education have the smallest earnings of $28,716.
| Educational Attainment | Male Income | Female Income |
| Less than High School | $44,205 | $36,411 |
| High School Diploma | $45,000 | $29,091 |
| College or Associate's Degree | $51,607 | $28,716 |
| Bachelor's Degree | $78,940 | $38,512 |
| Graduate Degree | $88,214 | $53,500 |
| Total | $52,755 | $32,793 |
Family Income in Brigham City
Family Income Brackets in Brigham City
According to the Brigham City family income data, there are 1,115 families falling into the $50,000 to $74,999 income range, which is the most common income bracket and makes up 24.0% of all families. Conversely, the less than $10,000 income bracket is the least frequent group with only 70 families (1.5%) belonging to this category.
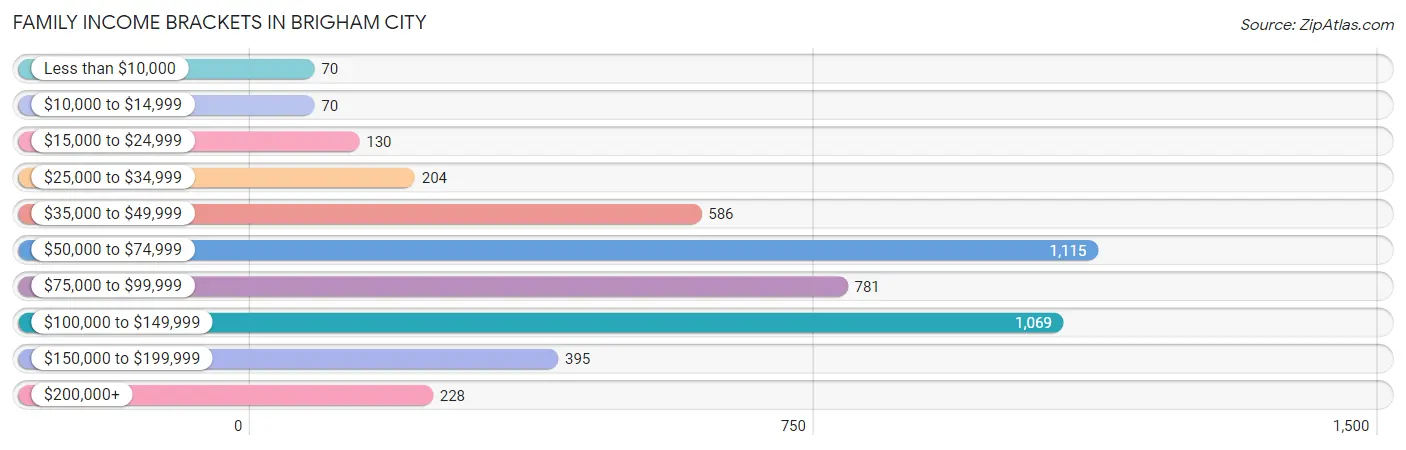
| Income Bracket | # Families | % Families |
| Less than $10,000 | 70 | 1.5% |
| $10,000 to $14,999 | 70 | 1.5% |
| $15,000 to $24,999 | 130 | 2.8% |
| $25,000 to $34,999 | 204 | 4.4% |
| $35,000 to $49,999 | 586 | 12.6% |
| $50,000 to $74,999 | 1,115 | 24.0% |
| $75,000 to $99,999 | 781 | 16.8% |
| $100,000 to $149,999 | 1,069 | 23.0% |
| $150,000 to $199,999 | 395 | 8.5% |
| $200,000+ | 228 | 4.9% |
Family Income by Famaliy Size in Brigham City
7+ person families (150 | 3.2%) account for the highest median family income in Brigham City with $130,625 per family, while 2-person families (2,013 | 43.3%) have the highest median income of $37,458 per family member.
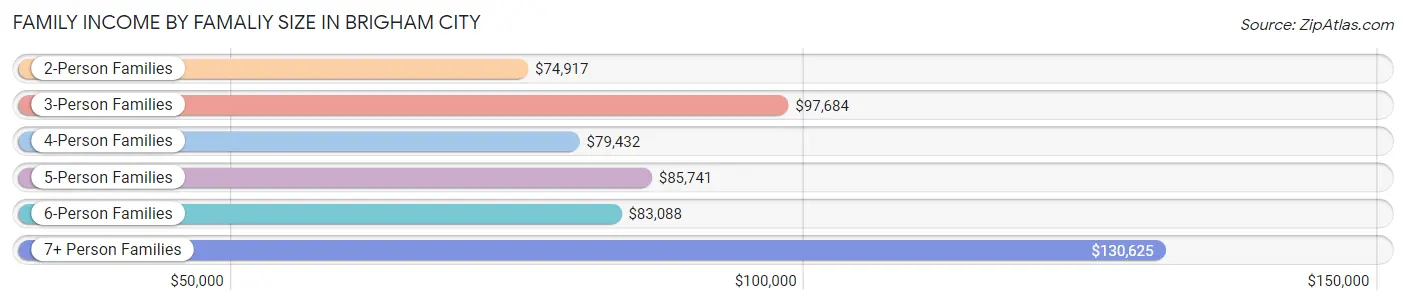
| Income Bracket | # Families | Median Income |
| 2-Person Families | 2,013 (43.3%) | $74,917 |
| 3-Person Families | 761 (16.4%) | $97,684 |
| 4-Person Families | 763 (16.4%) | $79,432 |
| 5-Person Families | 578 (12.4%) | $85,741 |
| 6-Person Families | 382 (8.2%) | $83,088 |
| 7+ Person Families | 150 (3.2%) | $130,625 |
| Total | 4,647 (100.0%) | $81,348 |
Family Income by Number of Earners in Brigham City
The median family income in Brigham City is $81,348, with families comprising 3+ earners (668) having the highest median family income of $129,028, while families with 1 earner (1,367) have the lowest median family income of $60,893, accounting for 14.4% and 29.4% of families, respectively.
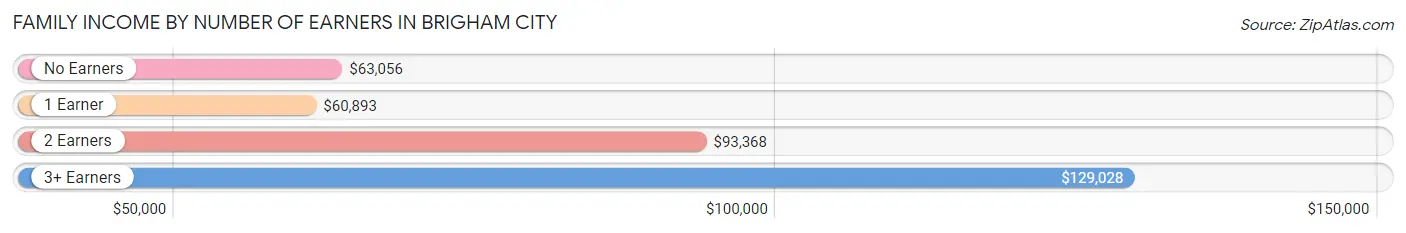
| Number of Earners | # Families | Median Income |
| No Earners | 614 (13.2%) | $63,056 |
| 1 Earner | 1,367 (29.4%) | $60,893 |
| 2 Earners | 1,998 (43.0%) | $93,368 |
| 3+ Earners | 668 (14.4%) | $129,028 |
| Total | 4,647 (100.0%) | $81,348 |
Household Income in Brigham City
Household Income Brackets in Brigham City
With 1,369 households falling in the category, the $50,000 to $74,999 income range is the most frequent in Brigham City, accounting for 20.1% of all households. In contrast, only 266 households (3.9%) fall into the $10,000 to $14,999 income bracket, making it the least populous group.
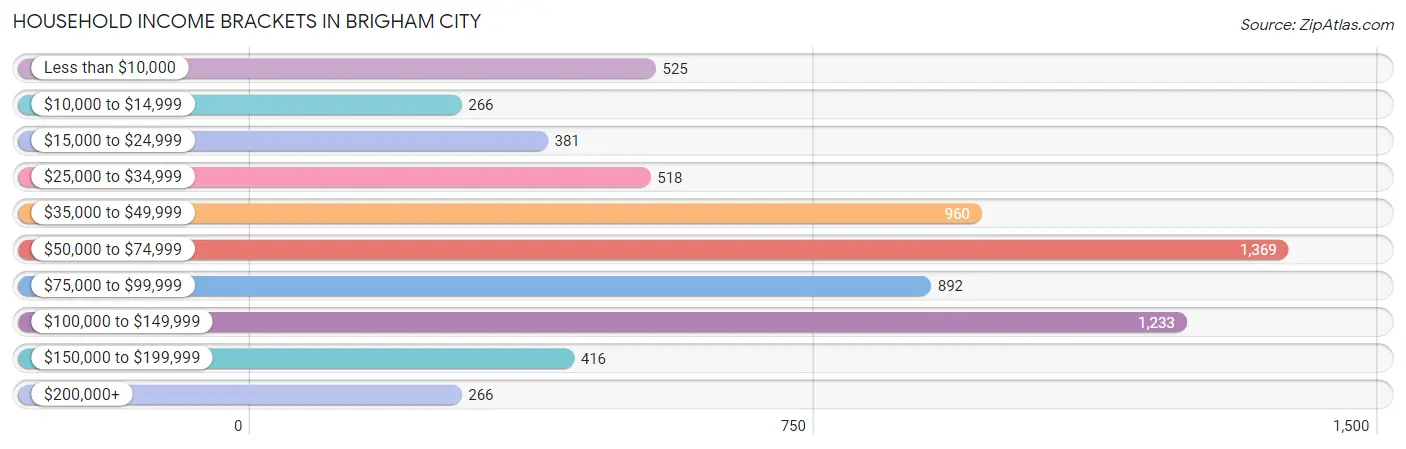
| Income Bracket | # Households | % Households |
| Less than $10,000 | 525 | 7.7% |
| $10,000 to $14,999 | 266 | 3.9% |
| $15,000 to $24,999 | 381 | 5.6% |
| $25,000 to $34,999 | 518 | 7.6% |
| $35,000 to $49,999 | 960 | 14.1% |
| $50,000 to $74,999 | 1,369 | 20.1% |
| $75,000 to $99,999 | 892 | 13.1% |
| $100,000 to $149,999 | 1,233 | 18.1% |
| $150,000 to $199,999 | 416 | 6.1% |
| $200,000+ | 266 | 3.9% |
Household Income by Householder Age in Brigham City
The median household income in Brigham City is $63,315, with the highest median household income of $75,625 found in the 45 to 64 years age bracket for the primary householder. A total of 2,140 households (31.4%) fall into this category. Meanwhile, the 15 to 24 years age bracket for the primary householder has the lowest median household income of $33,319, with 455 households (6.7%) in this group.
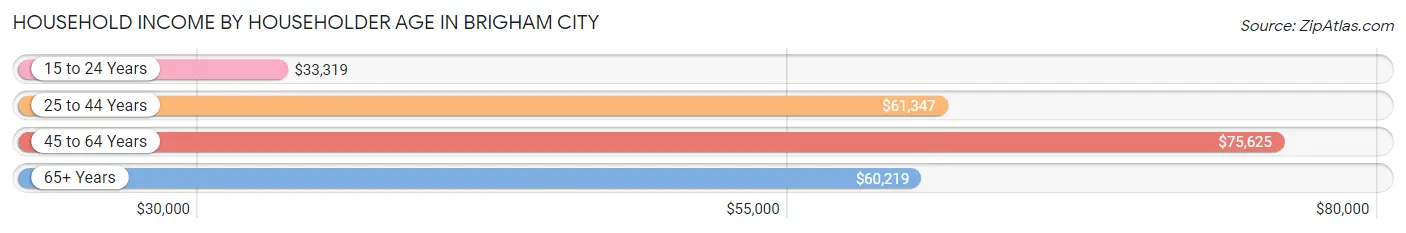
| Income Bracket | # Households | Median Income |
| 15 to 24 Years | 455 (6.7%) | $33,319 |
| 25 to 44 Years | 2,551 (37.4%) | $61,347 |
| 45 to 64 Years | 2,140 (31.4%) | $75,625 |
| 65+ Years | 1,666 (24.5%) | $60,219 |
| Total | 6,812 (100.0%) | $63,315 |
Poverty in Brigham City
Income Below Poverty by Sex and Age in Brigham City
With 7.6% poverty level for males and 11.3% for females among the residents of Brigham City, 55 to 64 year old males and 18 to 24 year old females are the most vulnerable to poverty, with 199 males (21.0%) and 209 females (19.6%) in their respective age groups living below the poverty level.
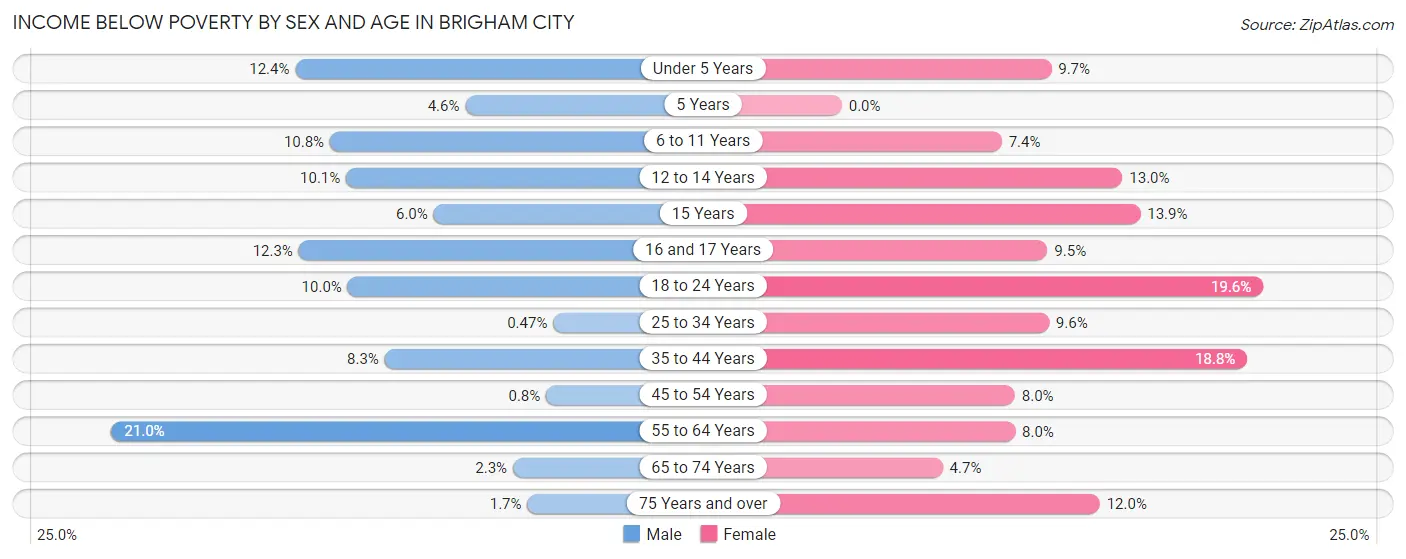
| Age Bracket | Male | Female |
| Under 5 Years | 80 (12.4%) | 73 (9.7%) |
| 5 Years | 9 (4.5%) | 0 (0.0%) |
| 6 to 11 Years | 113 (10.8%) | 58 (7.4%) |
| 12 to 14 Years | 53 (10.1%) | 63 (13.0%) |
| 15 Years | 8 (6.0%) | 32 (13.9%) |
| 16 and 17 Years | 42 (12.3%) | 33 (9.5%) |
| 18 to 24 Years | 75 (10.0%) | 209 (19.6%) |
| 25 to 34 Years | 6 (0.5%) | 139 (9.6%) |
| 35 to 44 Years | 102 (8.3%) | 256 (18.8%) |
| 45 to 54 Years | 9 (0.8%) | 76 (8.0%) |
| 55 to 64 Years | 199 (21.0%) | 70 (8.0%) |
| 65 to 74 Years | 17 (2.3%) | 39 (4.7%) |
| 75 Years and over | 8 (1.7%) | 70 (12.0%) |
| Total | 721 (7.6%) | 1,118 (11.3%) |
Income Above Poverty by Sex and Age in Brigham City
According to the poverty statistics in Brigham City, males aged 25 to 34 years and females aged 5 years are the age groups that are most secure financially, with 99.5% of males and 100.0% of females in these age groups living above the poverty line.
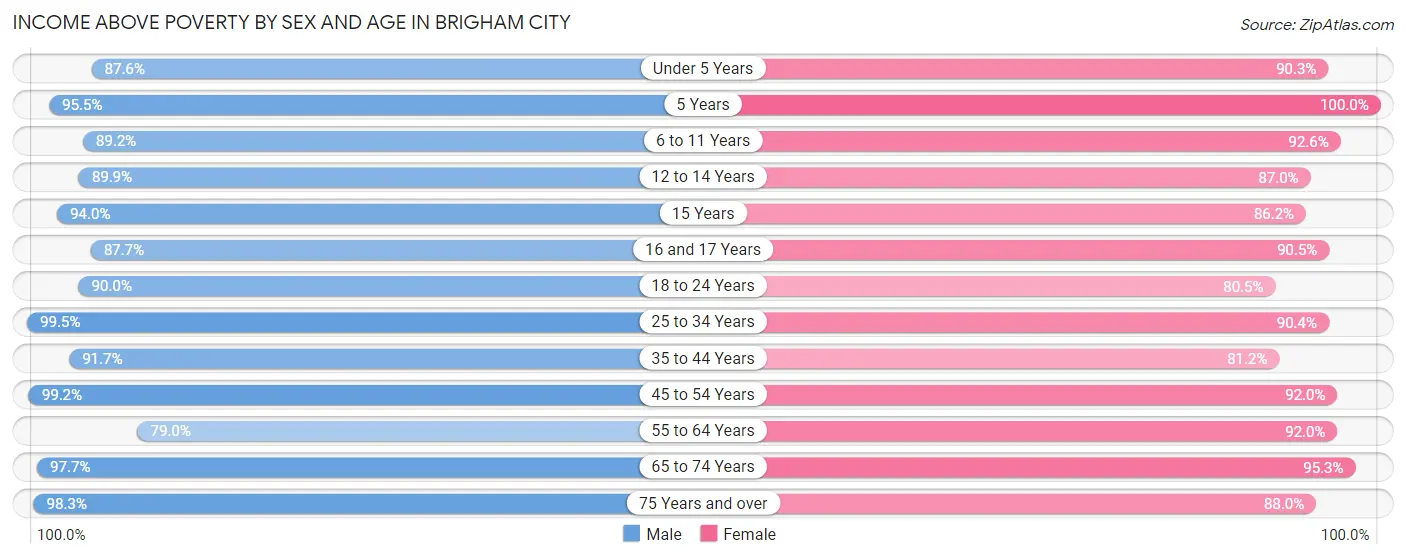
| Age Bracket | Male | Female |
| Under 5 Years | 563 (87.6%) | 678 (90.3%) |
| 5 Years | 189 (95.5%) | 193 (100.0%) |
| 6 to 11 Years | 930 (89.2%) | 724 (92.6%) |
| 12 to 14 Years | 473 (89.9%) | 421 (87.0%) |
| 15 Years | 125 (94.0%) | 199 (86.2%) |
| 16 and 17 Years | 300 (87.7%) | 313 (90.5%) |
| 18 to 24 Years | 674 (90.0%) | 860 (80.4%) |
| 25 to 34 Years | 1,272 (99.5%) | 1,308 (90.4%) |
| 35 to 44 Years | 1,129 (91.7%) | 1,105 (81.2%) |
| 45 to 54 Years | 1,116 (99.2%) | 870 (92.0%) |
| 55 to 64 Years | 750 (79.0%) | 801 (92.0%) |
| 65 to 74 Years | 710 (97.7%) | 795 (95.3%) |
| 75 Years and over | 470 (98.3%) | 515 (88.0%) |
| Total | 8,701 (92.3%) | 8,782 (88.7%) |
Income Below Poverty Among Married-Couple Families in Brigham City
The poverty statistics for married-couple families in Brigham City show that 2.5% or 94 of the total 3,720 families live below the poverty line. Families with 5 or more children have the highest poverty rate of 23.2%, comprising of 26 families. On the other hand, families with no children have the lowest poverty rate of 1.0%, which includes 17 families.
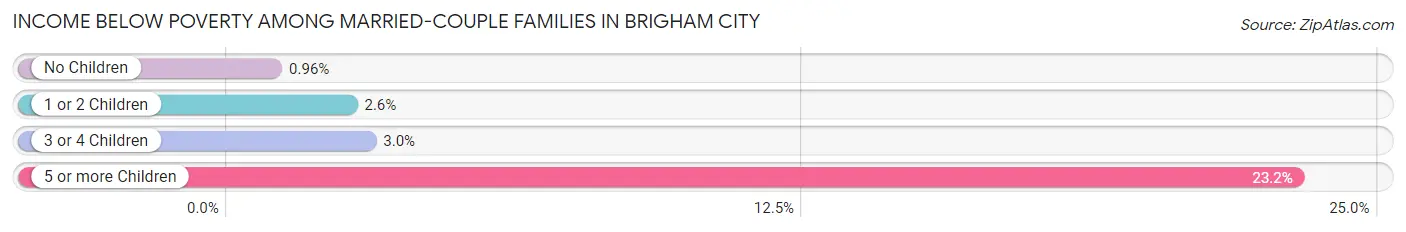
| Children | Above Poverty | Below Poverty |
| No Children | 1,753 (99.0%) | 17 (1.0%) |
| 1 or 2 Children | 1,047 (97.4%) | 28 (2.6%) |
| 3 or 4 Children | 740 (97.0%) | 23 (3.0%) |
| 5 or more Children | 86 (76.8%) | 26 (23.2%) |
| Total | 3,626 (97.5%) | 94 (2.5%) |
Income Below Poverty Among Single-Parent Households in Brigham City
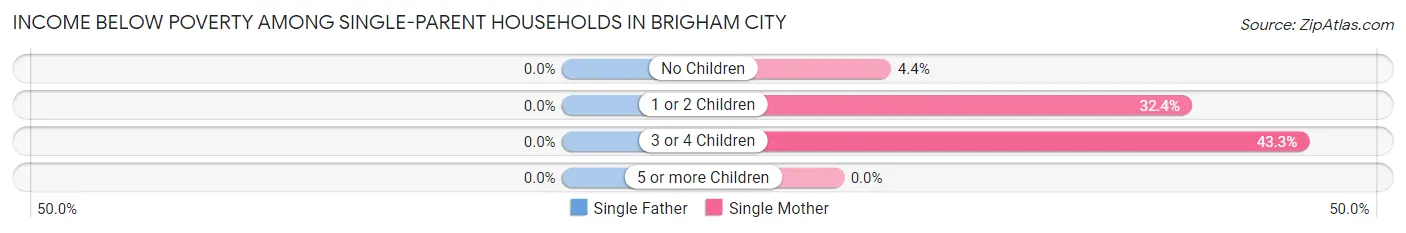
| Children | Single Father | Single Mother |
| No Children | 0 (0.0%) | 11 (4.4%) |
| 1 or 2 Children | 0 (0.0%) | 95 (32.4%) |
| 3 or 4 Children | 0 (0.0%) | 39 (43.3%) |
| 5 or more Children | 0 (0.0%) | 0 (0.0%) |
| Total | 0 (0.0%) | 145 (22.9%) |
Income Below Poverty Among Married-Couple vs Single-Parent Households in Brigham City
The poverty data for Brigham City shows that 94 of the married-couple family households (2.5%) and 145 of the single-parent households (15.6%) are living below the poverty level. Within the married-couple family households, those with 5 or more children have the highest poverty rate, with 26 households (23.2%) falling below the poverty line. Among the single-parent households, those with 3 or 4 children have the highest poverty rate, with 39 household (35.4%) living below poverty.
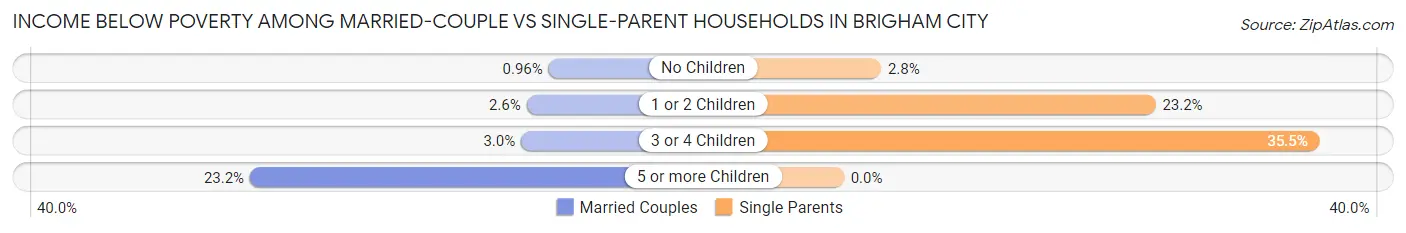
| Children | Married-Couple Families | Single-Parent Households |
| No Children | 17 (1.0%) | 11 (2.8%) |
| 1 or 2 Children | 28 (2.6%) | 95 (23.2%) |
| 3 or 4 Children | 23 (3.0%) | 39 (35.4%) |
| 5 or more Children | 26 (23.2%) | 0 (0.0%) |
| Total | 94 (2.5%) | 145 (15.6%) |
Race in Brigham City
The most populous races in Brigham City are White / Caucasian (17,144 | 87.5%), Hispanic or Latino (2,061 | 10.5%), and Two or more Races (1,605 | 8.2%).
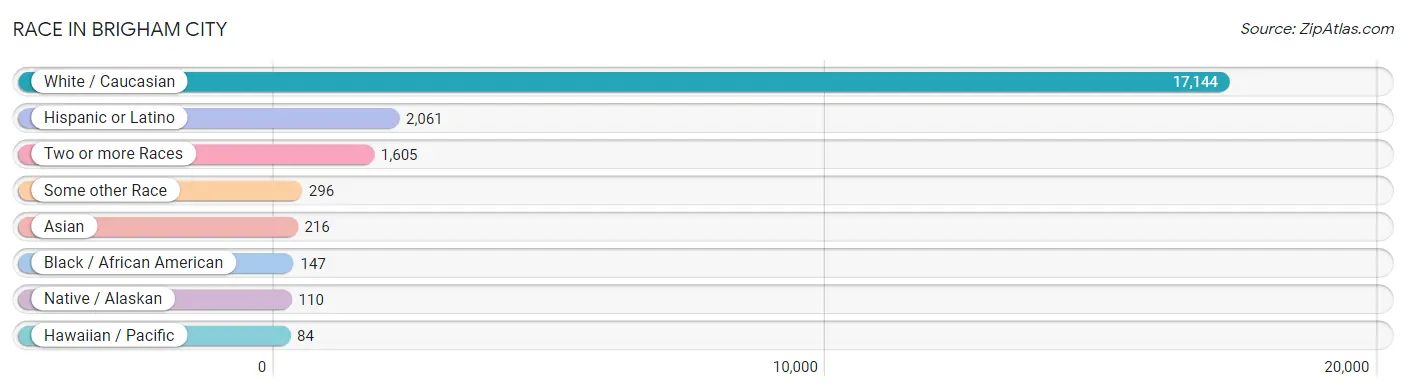
| Race | # Population | % Population |
| Asian | 216 | 1.1% |
| Black / African American | 147 | 0.7% |
| Hawaiian / Pacific | 84 | 0.4% |
| Hispanic or Latino | 2,061 | 10.5% |
| Native / Alaskan | 110 | 0.6% |
| White / Caucasian | 17,144 | 87.5% |
| Two or more Races | 1,605 | 8.2% |
| Some other Race | 296 | 1.5% |
| Total | 19,602 | 100.0% |
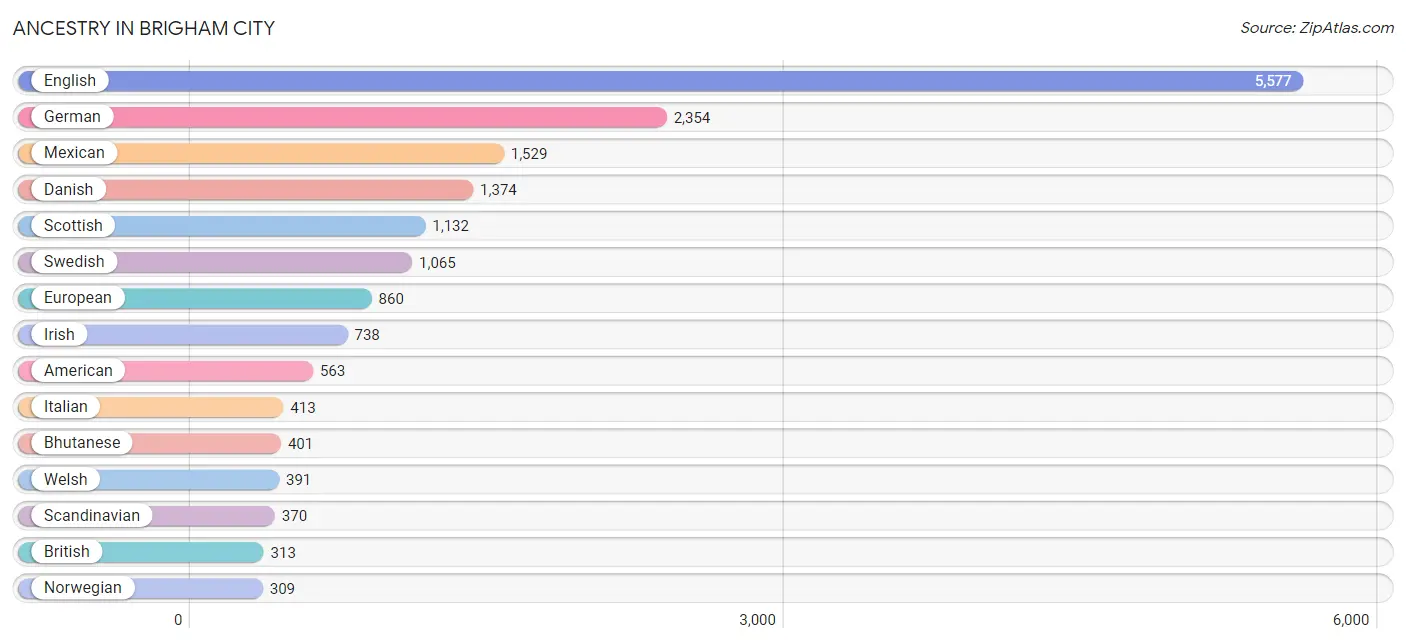
Ancestry in Brigham City
The most populous ancestries reported in Brigham City are English (5,577 | 28.4%), German (2,354 | 12.0%), Mexican (1,529 | 7.8%), Danish (1,374 | 7.0%), and Scottish (1,132 | 5.8%), together accounting for 61.0% of all Brigham City residents.
| Ancestry | # Population | % Population |
| African | 50 | 0.3% |
| American | 563 | 2.9% |
| Armenian | 28 | 0.1% |
| Australian | 37 | 0.2% |
| Austrian | 50 | 0.3% |
| Bhutanese | 401 | 2.1% |
| Brazilian | 6 | 0.0% |
| British | 313 | 1.6% |
| Burmese | 70 | 0.4% |
| Canadian | 34 | 0.2% |
| Central American | 7 | 0.0% |
| Central American Indian | 8 | 0.0% |
| Cherokee | 96 | 0.5% |
| Cheyenne | 22 | 0.1% |
| Chilean | 14 | 0.1% |
| Comanche | 2 | 0.0% |
| Cuban | 8 | 0.0% |
| Czechoslovakian | 3 | 0.0% |
| Danish | 1,374 | 7.0% |
| Dominican | 88 | 0.4% |
| Dutch | 274 | 1.4% |
| Eastern European | 17 | 0.1% |
| English | 5,577 | 28.4% |
| European | 860 | 4.4% |
| Fijian | 5 | 0.0% |
| Finnish | 16 | 0.1% |
| French | 201 | 1.0% |
| French Canadian | 10 | 0.1% |
| German | 2,354 | 12.0% |
| Greek | 20 | 0.1% |
| Honduran | 7 | 0.0% |
| Hopi | 3 | 0.0% |
| Hungarian | 8 | 0.0% |
| Icelander | 2 | 0.0% |
| Indian (Asian) | 35 | 0.2% |
| Iranian | 18 | 0.1% |
| Irish | 738 | 3.8% |
| Italian | 413 | 2.1% |
| Korean | 7 | 0.0% |
| Lithuanian | 32 | 0.2% |
| Mexican | 1,529 | 7.8% |
| Mexican American Indian | 10 | 0.1% |
| Native Hawaiian | 28 | 0.1% |
| Navajo | 132 | 0.7% |
| New Zealander | 17 | 0.1% |
| Nigerian | 61 | 0.3% |
| Northern European | 14 | 0.1% |
| Norwegian | 309 | 1.6% |
| Peruvian | 113 | 0.6% |
| Pima | 6 | 0.0% |
| Polish | 44 | 0.2% |
| Portuguese | 4 | 0.0% |
| Puerto Rican | 25 | 0.1% |
| Romanian | 8 | 0.0% |
| Russian | 15 | 0.1% |
| Samoan | 35 | 0.2% |
| Scandinavian | 370 | 1.9% |
| Scotch-Irish | 174 | 0.9% |
| Scottish | 1,132 | 5.8% |
| Shoshone | 3 | 0.0% |
| Sioux | 6 | 0.0% |
| Slovak | 4 | 0.0% |
| Slovene | 8 | 0.0% |
| South American | 158 | 0.8% |
| Spaniard | 185 | 0.9% |
| Spanish | 15 | 0.1% |
| Sri Lankan | 46 | 0.2% |
| Subsaharan African | 111 | 0.6% |
| Swedish | 1,065 | 5.4% |
| Swiss | 159 | 0.8% |
| Thai | 11 | 0.1% |
| Ukrainian | 16 | 0.1% |
| Welsh | 391 | 2.0% | View All 73 Rows |
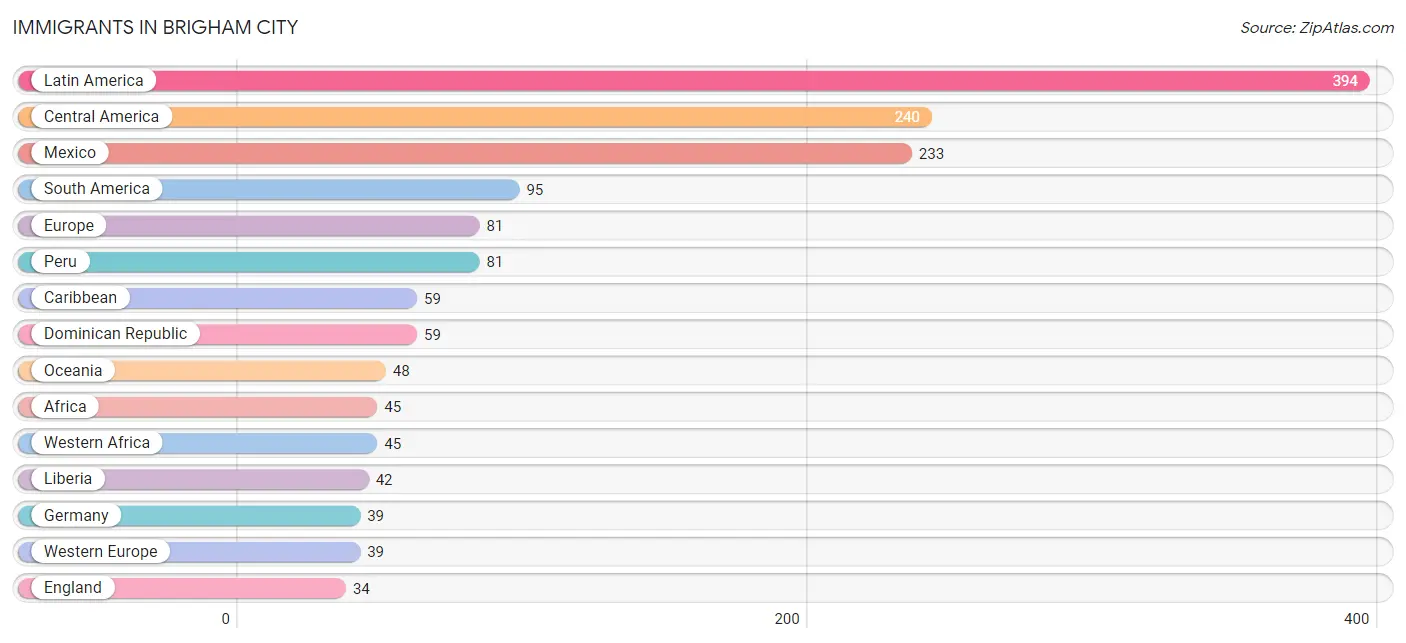
Immigrants in Brigham City
The most numerous immigrant groups reported in Brigham City came from Latin America (394 | 2.0%), Central America (240 | 1.2%), Mexico (233 | 1.2%), South America (95 | 0.5%), and Europe (81 | 0.4%), together accounting for 5.3% of all Brigham City residents.
| Immigration Origin | # Population | % Population |
| Africa | 45 | 0.2% |
| Asia | 13 | 0.1% |
| Australia | 7 | 0.0% |
| Canada | 23 | 0.1% |
| Caribbean | 59 | 0.3% |
| Central America | 240 | 1.2% |
| Chile | 14 | 0.1% |
| China | 13 | 0.1% |
| Dominican Republic | 59 | 0.3% |
| Eastern Asia | 13 | 0.1% |
| Eastern Europe | 8 | 0.0% |
| England | 34 | 0.2% |
| Europe | 81 | 0.4% |
| Germany | 39 | 0.2% |
| Honduras | 7 | 0.0% |
| Latin America | 394 | 2.0% |
| Liberia | 42 | 0.2% |
| Mexico | 233 | 1.2% |
| Micronesia | 24 | 0.1% |
| Nigeria | 3 | 0.0% |
| Northern Europe | 34 | 0.2% |
| Oceania | 48 | 0.2% |
| Peru | 81 | 0.4% |
| Romania | 8 | 0.0% |
| South America | 95 | 0.5% |
| Western Africa | 45 | 0.2% |
| Western Europe | 39 | 0.2% | View All 27 Rows |
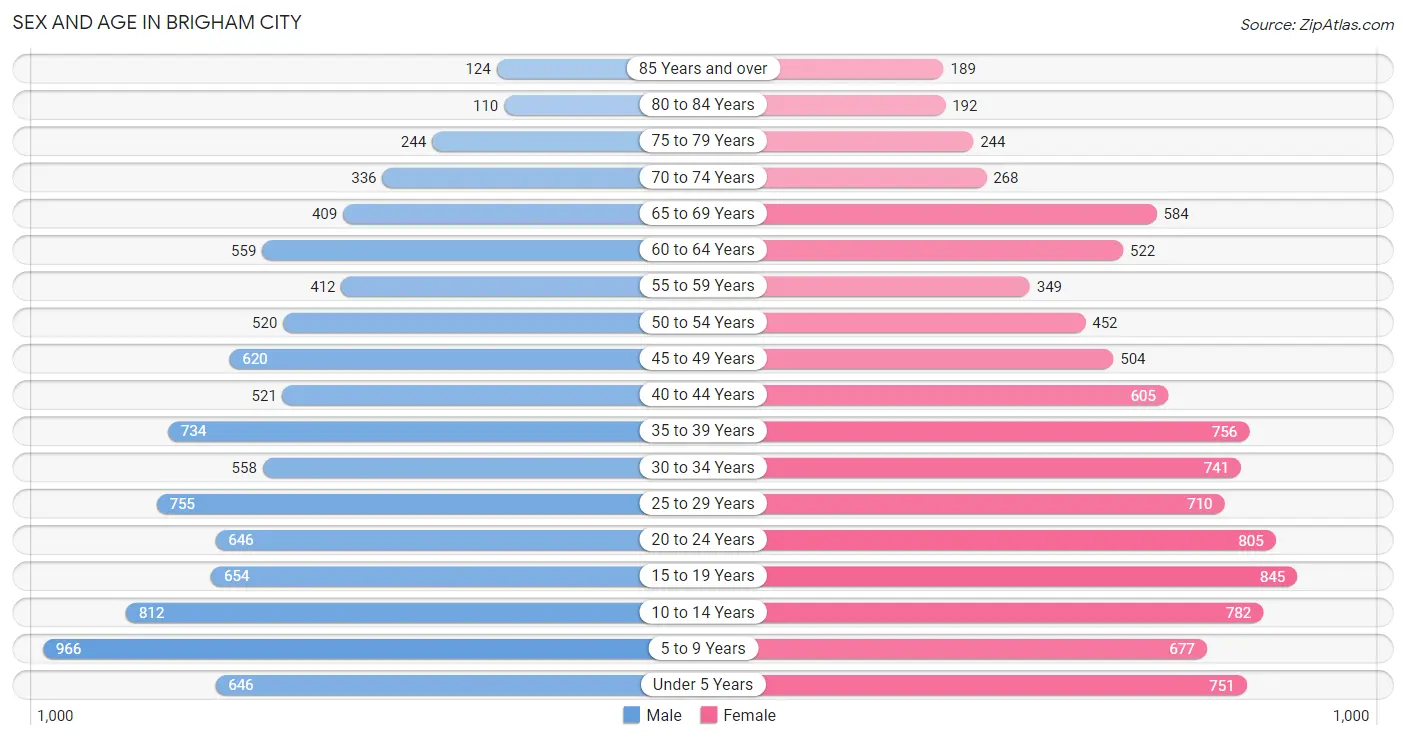
Sex and Age in Brigham City
Sex and Age in Brigham City
The most populous age groups in Brigham City are 5 to 9 Years (966 | 10.0%) for men and 15 to 19 Years (845 | 8.5%) for women.
| Age Bracket | Male | Female |
| Under 5 Years | 646 (6.7%) | 751 (7.5%) |
| 5 to 9 Years | 966 (10.0%) | 677 (6.8%) |
| 10 to 14 Years | 812 (8.4%) | 782 (7.8%) |
| 15 to 19 Years | 654 (6.8%) | 845 (8.5%) |
| 20 to 24 Years | 646 (6.7%) | 805 (8.1%) |
| 25 to 29 Years | 755 (7.8%) | 710 (7.1%) |
| 30 to 34 Years | 558 (5.8%) | 741 (7.4%) |
| 35 to 39 Years | 734 (7.6%) | 756 (7.6%) |
| 40 to 44 Years | 521 (5.4%) | 605 (6.1%) |
| 45 to 49 Years | 620 (6.4%) | 504 (5.1%) |
| 50 to 54 Years | 520 (5.4%) | 452 (4.5%) |
| 55 to 59 Years | 412 (4.3%) | 349 (3.5%) |
| 60 to 64 Years | 559 (5.8%) | 522 (5.2%) |
| 65 to 69 Years | 409 (4.3%) | 584 (5.9%) |
| 70 to 74 Years | 336 (3.5%) | 268 (2.7%) |
| 75 to 79 Years | 244 (2.5%) | 244 (2.5%) |
| 80 to 84 Years | 110 (1.1%) | 192 (1.9%) |
| 85 Years and over | 124 (1.3%) | 189 (1.9%) |
| Total | 9,626 (100.0%) | 9,976 (100.0%) |
Families and Households in Brigham City
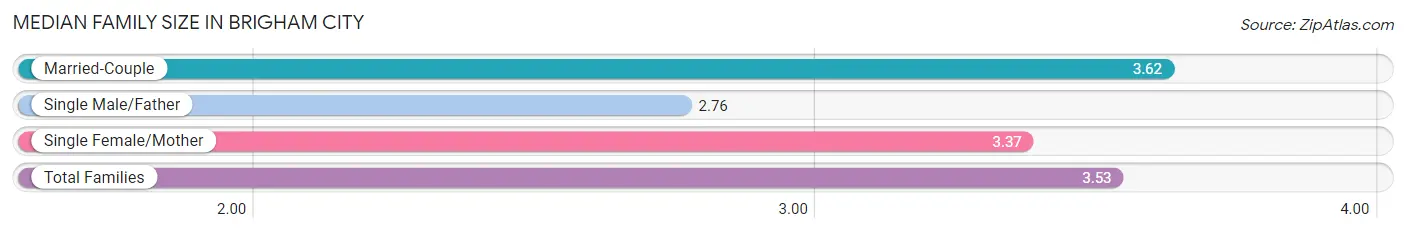
Median Family Size in Brigham City
The median family size in Brigham City is 3.53 persons per family, with married-couple families (3,720 | 80.0%) accounting for the largest median family size of 3.62 persons per family. On the other hand, single male/father families (294 | 6.3%) represent the smallest median family size with 2.76 persons per family.
| Family Type | # Families | Family Size |
| Married-Couple | 3,720 (80.0%) | 3.62 |
| Single Male/Father | 294 (6.3%) | 2.76 |
| Single Female/Mother | 633 (13.6%) | 3.37 |
| Total Families | 4,647 (100.0%) | 3.53 |
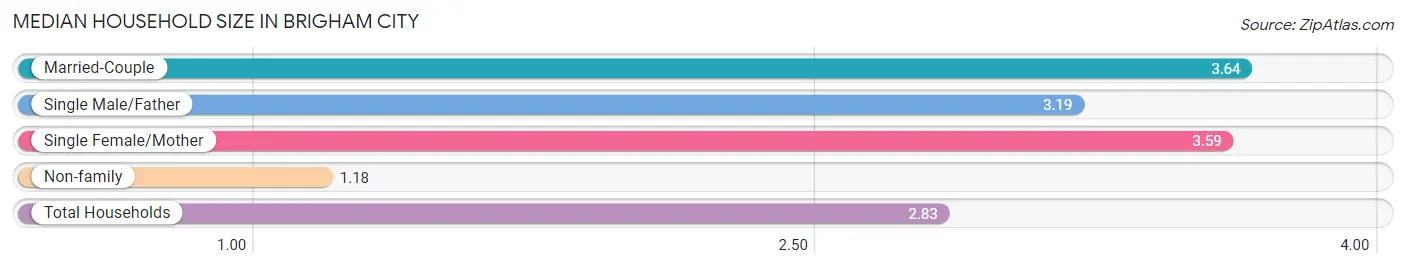
Median Household Size in Brigham City
The median household size in Brigham City is 2.83 persons per household, with married-couple households (3,720 | 54.6%) accounting for the largest median household size of 3.64 persons per household. non-family households (2,165 | 31.8%) represent the smallest median household size with 1.18 persons per household.
| Household Type | # Households | Household Size |
| Married-Couple | 3,720 (54.6%) | 3.64 |
| Single Male/Father | 294 (4.3%) | 3.19 |
| Single Female/Mother | 633 (9.3%) | 3.59 |
| Non-family | 2,165 (31.8%) | 1.18 |
| Total Households | 6,812 (100.0%) | 2.83 |
Household Size by Marriage Status in Brigham City
Out of a total of 6,812 households in Brigham City, 4,647 (68.2%) are family households, while 2,165 (31.8%) are nonfamily households. The most numerous type of family households are 2-person households, comprising 1,846, and the most common type of nonfamily households are 1-person households, comprising 1,904.
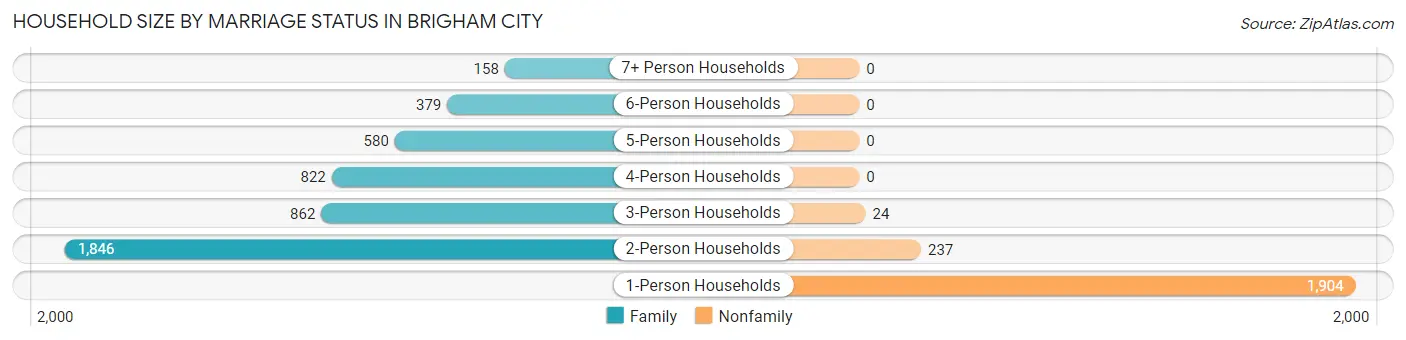
| Household Size | Family Households | Nonfamily Households |
| 1-Person Households | - | 1,904 (28.0%) |
| 2-Person Households | 1,846 (27.1%) | 237 (3.5%) |
| 3-Person Households | 862 (12.7%) | 24 (0.4%) |
| 4-Person Households | 822 (12.1%) | 0 (0.0%) |
| 5-Person Households | 580 (8.5%) | 0 (0.0%) |
| 6-Person Households | 379 (5.6%) | 0 (0.0%) |
| 7+ Person Households | 158 (2.3%) | 0 (0.0%) |
| Total | 4,647 (68.2%) | 2,165 (31.8%) |
Female Fertility in Brigham City
Fertility by Age in Brigham City
Average fertility rate in Brigham City is 44.0 births per 1,000 women. Women in the age bracket of 20 to 34 years have the highest fertility rate with 68.0 births per 1,000 women. Women in the age bracket of 20 to 34 years acount for 69.2% of all women with births.
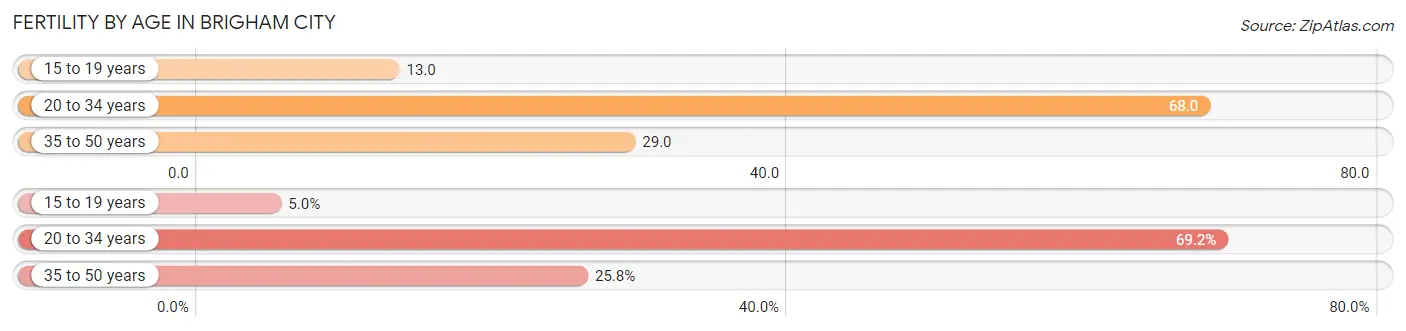
| Age Bracket | Women with Births | Births / 1,000 Women |
| 15 to 19 years | 11 (5.0%) | 13.0 |
| 20 to 34 years | 153 (69.2%) | 68.0 |
| 35 to 50 years | 57 (25.8%) | 29.0 |
| Total | 221 (100.0%) | 44.0 |
Fertility by Age by Marriage Status in Brigham City
69.7% of women with births (221) in Brigham City are married. The highest percentage of unmarried women with births falls into 15 to 19 years age bracket with 100.0% of them unmarried at the time of birth, while the lowest percentage of unmarried women with births belong to 35 to 50 years age bracket with 0.0% of them unmarried.
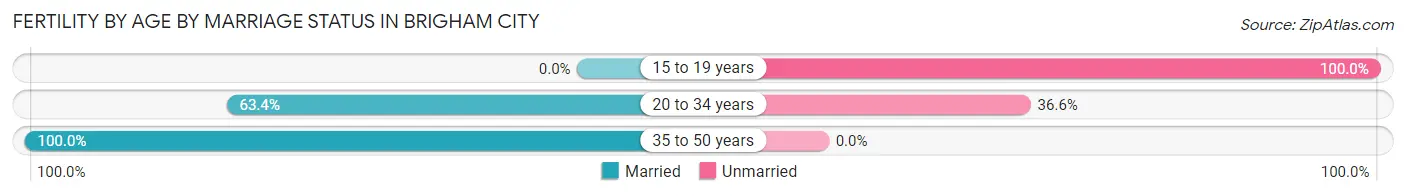
| Age Bracket | Married | Unmarried |
| 15 to 19 years | 0 (0.0%) | 11 (100.0%) |
| 20 to 34 years | 97 (63.4%) | 56 (36.6%) |
| 35 to 50 years | 57 (100.0%) | 0 (0.0%) |
| Total | 154 (69.7%) | 67 (30.3%) |
Fertility by Education in Brigham City
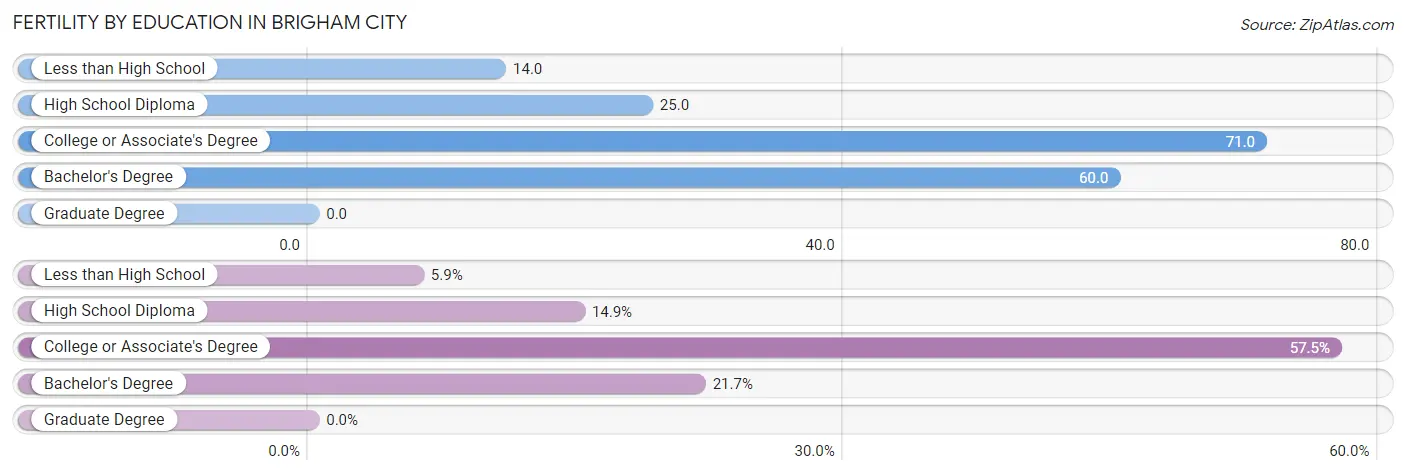
| Educational Attainment | Women with Births | Births / 1,000 Women |
| Less than High School | 13 (5.9%) | 14.0 |
| High School Diploma | 33 (14.9%) | 25.0 |
| College or Associate's Degree | 127 (57.5%) | 71.0 |
| Bachelor's Degree | 48 (21.7%) | 60.0 |
| Graduate Degree | 0 (0.0%) | 0.0 |
| Total | 221 (100.0%) | 44.0 |
Fertility by Education by Marriage Status in Brigham City
30.3% of women with births in Brigham City are unmarried. Women with the educational attainment of less than high school are most likely to be married with 100.0% of them married at childbirth, while women with the educational attainment of high school diploma are least likely to be married with 33.3% of them unmarried at childbirth.
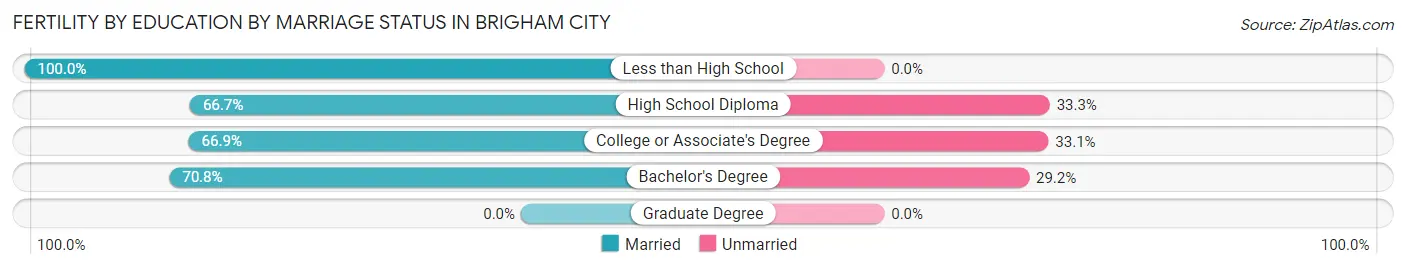
| Educational Attainment | Married | Unmarried |
| Less than High School | 13 (100.0%) | 0 (0.0%) |
| High School Diploma | 22 (66.7%) | 11 (33.3%) |
| College or Associate's Degree | 85 (66.9%) | 42 (33.1%) |
| Bachelor's Degree | 34 (70.8%) | 14 (29.2%) |
| Graduate Degree | 0 (0.0%) | 0 (0.0%) |
| Total | 154 (69.7%) | 67 (30.3%) |
Employment Characteristics in Brigham City
Employment by Class of Employer in Brigham City
Among the 8,939 employed individuals in Brigham City, private company employees (6,216 | 69.5%), local government employees (906 | 10.1%), and self-employed (not incorporated) (493 | 5.5%) make up the most common classes of employment.
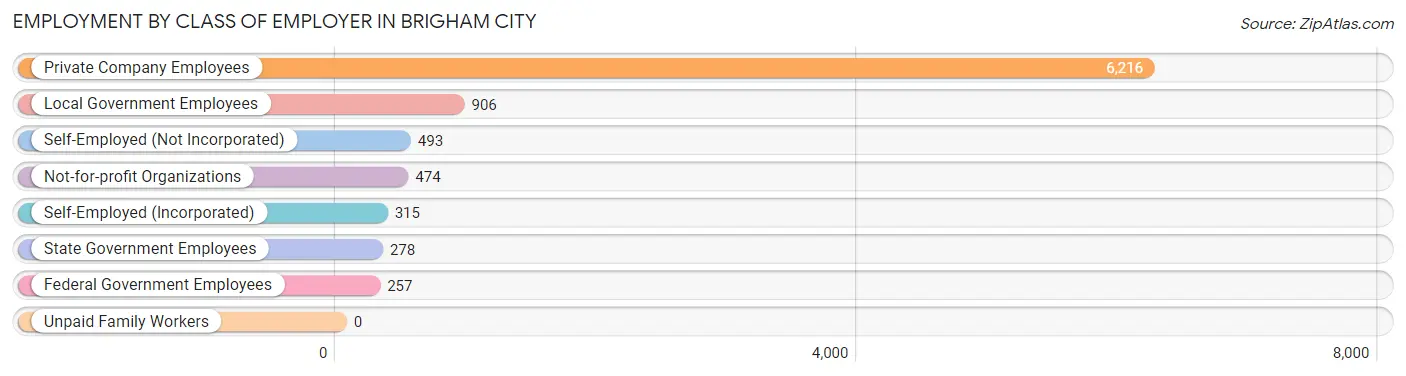
| Employer Class | # Employees | % Employees |
| Private Company Employees | 6,216 | 69.5% |
| Self-Employed (Incorporated) | 315 | 3.5% |
| Self-Employed (Not Incorporated) | 493 | 5.5% |
| Not-for-profit Organizations | 474 | 5.3% |
| Local Government Employees | 906 | 10.1% |
| State Government Employees | 278 | 3.1% |
| Federal Government Employees | 257 | 2.9% |
| Unpaid Family Workers | 0 | 0.0% |
| Total | 8,939 | 100.0% |
Employment Status by Age in Brigham City
According to the labor force statistics for Brigham City, out of the total population over 16 years of age (14,595), 65.5% or 9,560 individuals are in the labor force, with 3.7% or 354 of them unemployed. The age group with the highest labor force participation rate is 45 to 54 years, with 88.3% or 1,851 individuals in the labor force. Within the labor force, the 16 to 19 years age range has the highest percentage of unemployed individuals, with 21.5% or 125 of them being unemployed.
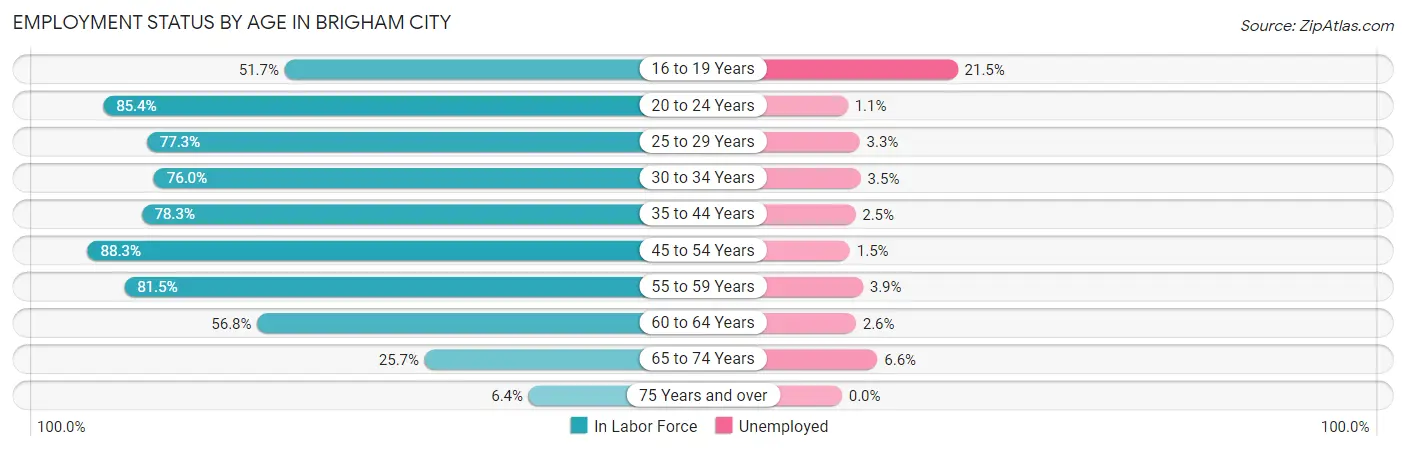
| Age Bracket | In Labor Force | Unemployed |
| 16 to 19 Years | 582 (51.7%) | 125 (21.5%) |
| 20 to 24 Years | 1,239 (85.4%) | 14 (1.1%) |
| 25 to 29 Years | 1,132 (77.3%) | 37 (3.3%) |
| 30 to 34 Years | 987 (76.0%) | 35 (3.5%) |
| 35 to 44 Years | 2,048 (78.3%) | 51 (2.5%) |
| 45 to 54 Years | 1,851 (88.3%) | 28 (1.5%) |
| 55 to 59 Years | 620 (81.5%) | 24 (3.9%) |
| 60 to 64 Years | 614 (56.8%) | 16 (2.6%) |
| 65 to 74 Years | 410 (25.7%) | 27 (6.6%) |
| 75 Years and over | 71 (6.4%) | 0 (0.0%) |
| Total | 9,560 (65.5%) | 354 (3.7%) |
Employment Status by Educational Attainment in Brigham City
According to labor force statistics for Brigham City, 77.8% of individuals (7,249) out of the total population between 25 and 64 years of age (9,318) are in the labor force, with 2.6% or 188 of them being unemployed. The group with the highest labor force participation rate are those with the educational attainment of bachelor's degree or higher, with 82.5% or 1,990 individuals in the labor force. Within the labor force, individuals with less than high school education have the highest percentage of unemployment, with 5.2% or 28 of them being unemployed.
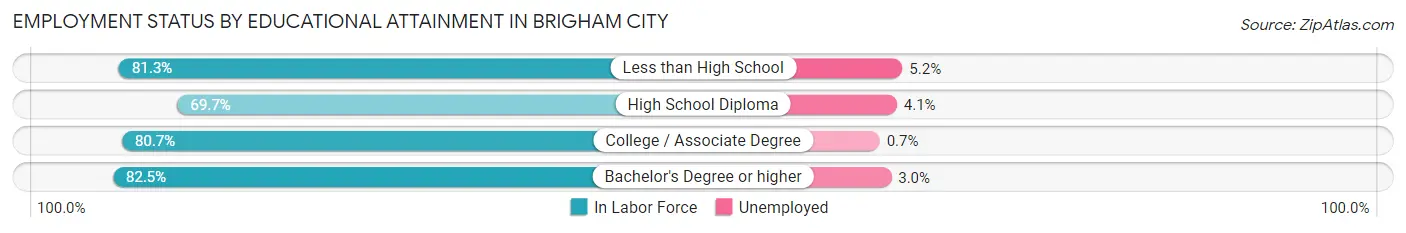
| Educational Attainment | In Labor Force | Unemployed |
| Less than High School | 539 (81.3%) | 34 (5.2%) |
| High School Diploma | 2,005 (69.7%) | 118 (4.1%) |
| College / Associate Degree | 2,716 (80.7%) | 24 (0.7%) |
| Bachelor's Degree or higher | 1,990 (82.5%) | 72 (3.0%) |
| Total | 7,249 (77.8%) | 242 (2.6%) |
Employment Occupations by Sex in Brigham City
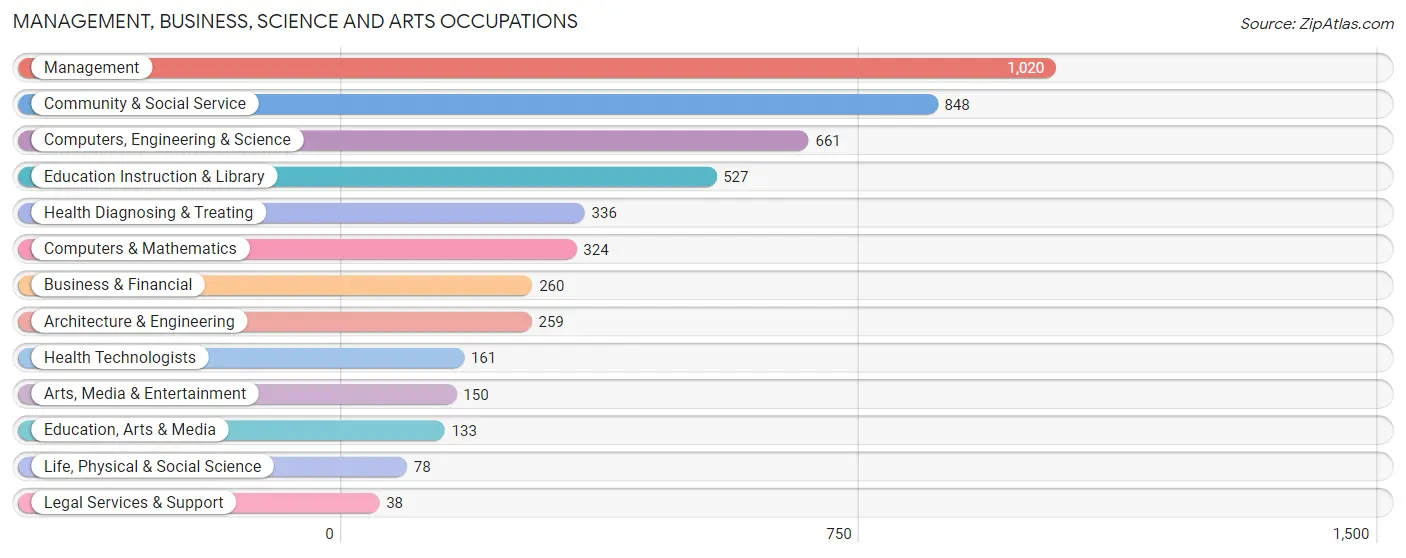
Management, Business, Science and Arts Occupations
The most common Management, Business, Science and Arts occupations in Brigham City are Management (1,020 | 11.1%), Community & Social Service (848 | 9.2%), Computers, Engineering & Science (661 | 7.2%), Education Instruction & Library (527 | 5.7%), and Health Diagnosing & Treating (336 | 3.6%).
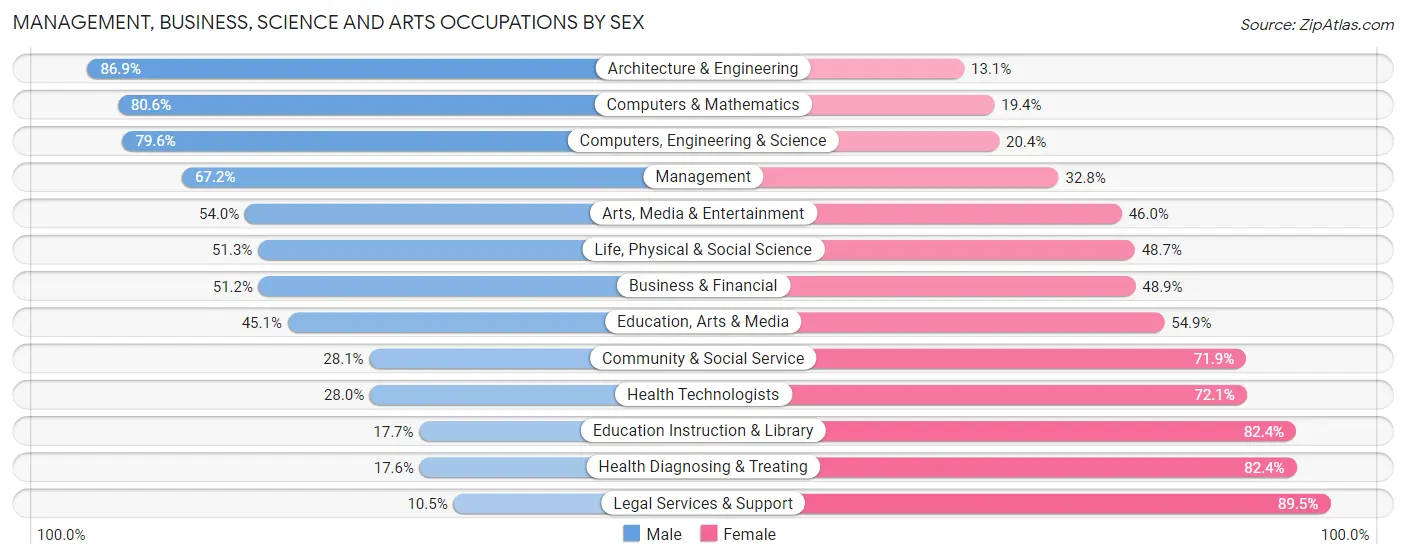
Management, Business, Science and Arts Occupations by Sex
Within the Management, Business, Science and Arts occupations in Brigham City, the most male-oriented occupations are Architecture & Engineering (86.9%), Computers & Mathematics (80.6%), and Computers, Engineering & Science (79.6%), while the most female-oriented occupations are Legal Services & Support (89.5%), Health Diagnosing & Treating (82.4%), and Education Instruction & Library (82.4%).
| Occupation | Male | Female |
| Management | 685 (67.2%) | 335 (32.8%) |
| Business & Financial | 133 (51.1%) | 127 (48.8%) |
| Computers, Engineering & Science | 526 (79.6%) | 135 (20.4%) |
| Computers & Mathematics | 261 (80.6%) | 63 (19.4%) |
| Architecture & Engineering | 225 (86.9%) | 34 (13.1%) |
| Life, Physical & Social Science | 40 (51.3%) | 38 (48.7%) |
| Community & Social Service | 238 (28.1%) | 610 (71.9%) |
| Education, Arts & Media | 60 (45.1%) | 73 (54.9%) |
| Legal Services & Support | 4 (10.5%) | 34 (89.5%) |
| Education Instruction & Library | 93 (17.6%) | 434 (82.4%) |
| Arts, Media & Entertainment | 81 (54.0%) | 69 (46.0%) |
| Health Diagnosing & Treating | 59 (17.6%) | 277 (82.4%) |
| Health Technologists | 45 (28.0%) | 116 (72.1%) |
| Total (Category) | 1,641 (52.5%) | 1,484 (47.5%) |
| Total (Overall) | 5,017 (54.5%) | 4,183 (45.5%) |
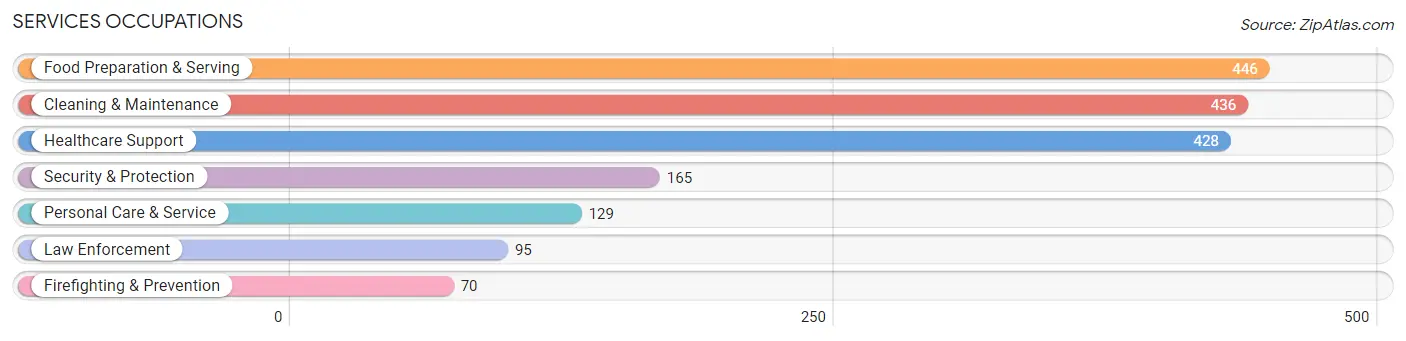
Services Occupations
The most common Services occupations in Brigham City are Food Preparation & Serving (446 | 4.9%), Cleaning & Maintenance (436 | 4.7%), Healthcare Support (428 | 4.6%), Security & Protection (165 | 1.8%), and Personal Care & Service (129 | 1.4%).
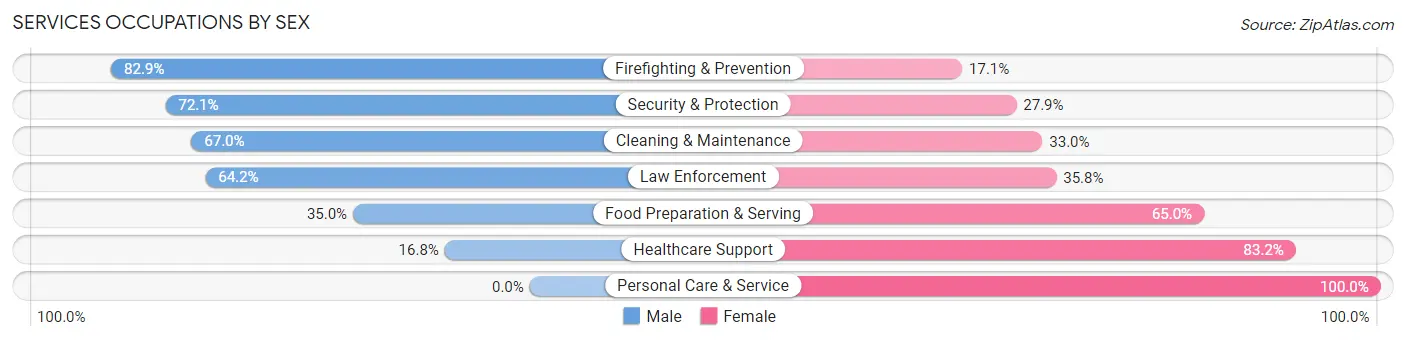
Services Occupations by Sex
Within the Services occupations in Brigham City, the most male-oriented occupations are Firefighting & Prevention (82.9%), Security & Protection (72.1%), and Cleaning & Maintenance (67.0%), while the most female-oriented occupations are Personal Care & Service (100.0%), Healthcare Support (83.2%), and Food Preparation & Serving (65.0%).
| Occupation | Male | Female |
| Healthcare Support | 72 (16.8%) | 356 (83.2%) |
| Security & Protection | 119 (72.1%) | 46 (27.9%) |
| Firefighting & Prevention | 58 (82.9%) | 12 (17.1%) |
| Law Enforcement | 61 (64.2%) | 34 (35.8%) |
| Food Preparation & Serving | 156 (35.0%) | 290 (65.0%) |
| Cleaning & Maintenance | 292 (67.0%) | 144 (33.0%) |
| Personal Care & Service | 0 (0.0%) | 129 (100.0%) |
| Total (Category) | 639 (39.8%) | 965 (60.2%) |
| Total (Overall) | 5,017 (54.5%) | 4,183 (45.5%) |
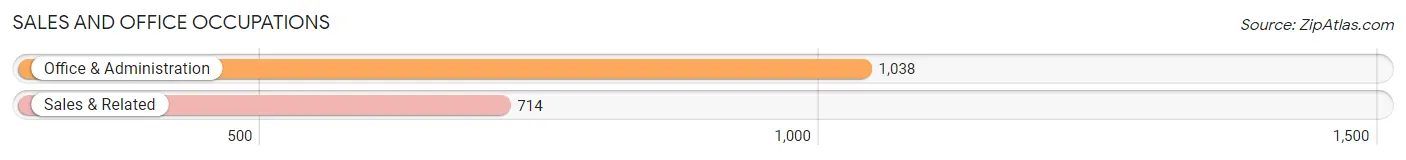
Sales and Office Occupations
The most common Sales and Office occupations in Brigham City are Office & Administration (1,038 | 11.3%), and Sales & Related (714 | 7.8%).
Sales and Office Occupations by Sex
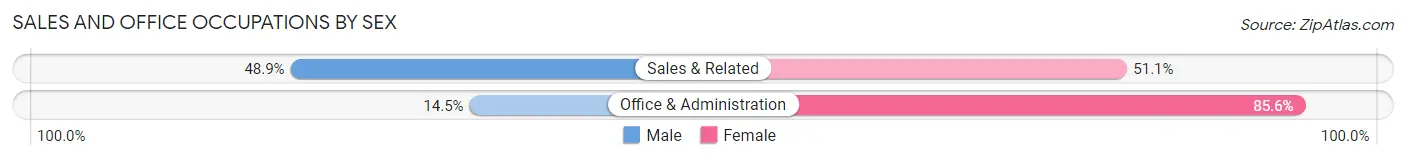
| Occupation | Male | Female |
| Sales & Related | 349 (48.9%) | 365 (51.1%) |
| Office & Administration | 150 (14.4%) | 888 (85.6%) |
| Total (Category) | 499 (28.5%) | 1,253 (71.5%) |
| Total (Overall) | 5,017 (54.5%) | 4,183 (45.5%) |
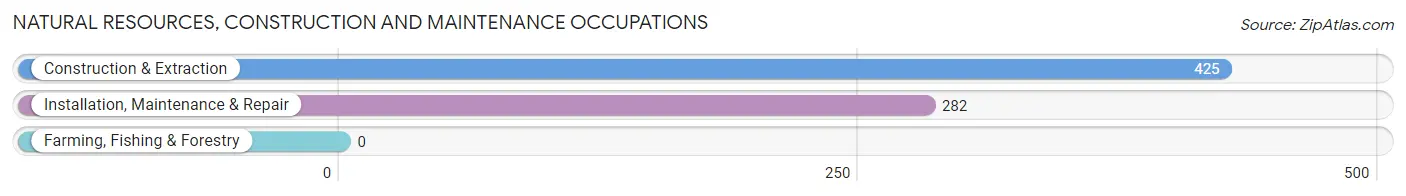
Natural Resources, Construction and Maintenance Occupations
The most common Natural Resources, Construction and Maintenance occupations in Brigham City are Construction & Extraction (425 | 4.6%), and Installation, Maintenance & Repair (282 | 3.1%).
Natural Resources, Construction and Maintenance Occupations by Sex
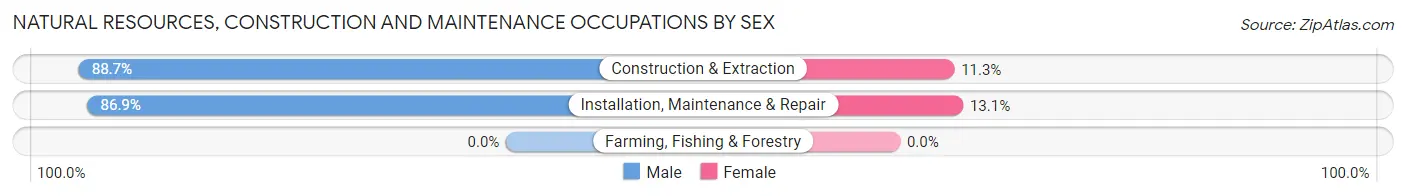
| Occupation | Male | Female |
| Farming, Fishing & Forestry | 0 (0.0%) | 0 (0.0%) |
| Construction & Extraction | 377 (88.7%) | 48 (11.3%) |
| Installation, Maintenance & Repair | 245 (86.9%) | 37 (13.1%) |
| Total (Category) | 622 (88.0%) | 85 (12.0%) |
| Total (Overall) | 5,017 (54.5%) | 4,183 (45.5%) |
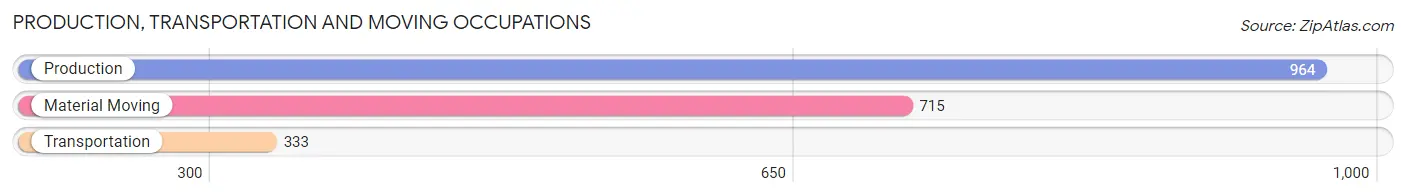
Production, Transportation and Moving Occupations
The most common Production, Transportation and Moving occupations in Brigham City are Production (964 | 10.5%), Material Moving (715 | 7.8%), and Transportation (333 | 3.6%).
Production, Transportation and Moving Occupations by Sex
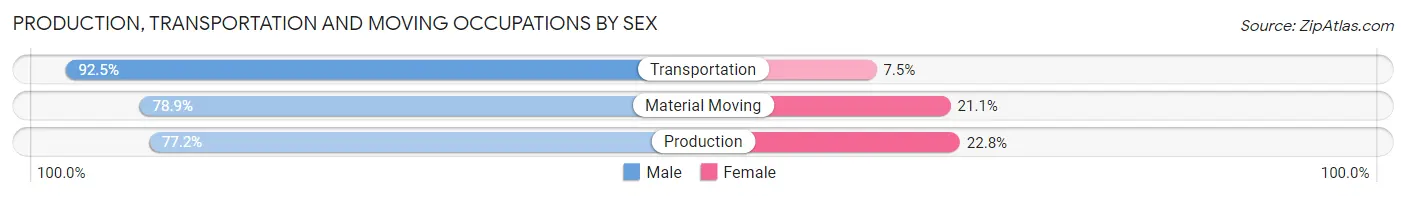
| Occupation | Male | Female |
| Production | 744 (77.2%) | 220 (22.8%) |
| Transportation | 308 (92.5%) | 25 (7.5%) |
| Material Moving | 564 (78.9%) | 151 (21.1%) |
| Total (Category) | 1,616 (80.3%) | 396 (19.7%) |
| Total (Overall) | 5,017 (54.5%) | 4,183 (45.5%) |
Employment Industries by Sex in Brigham City
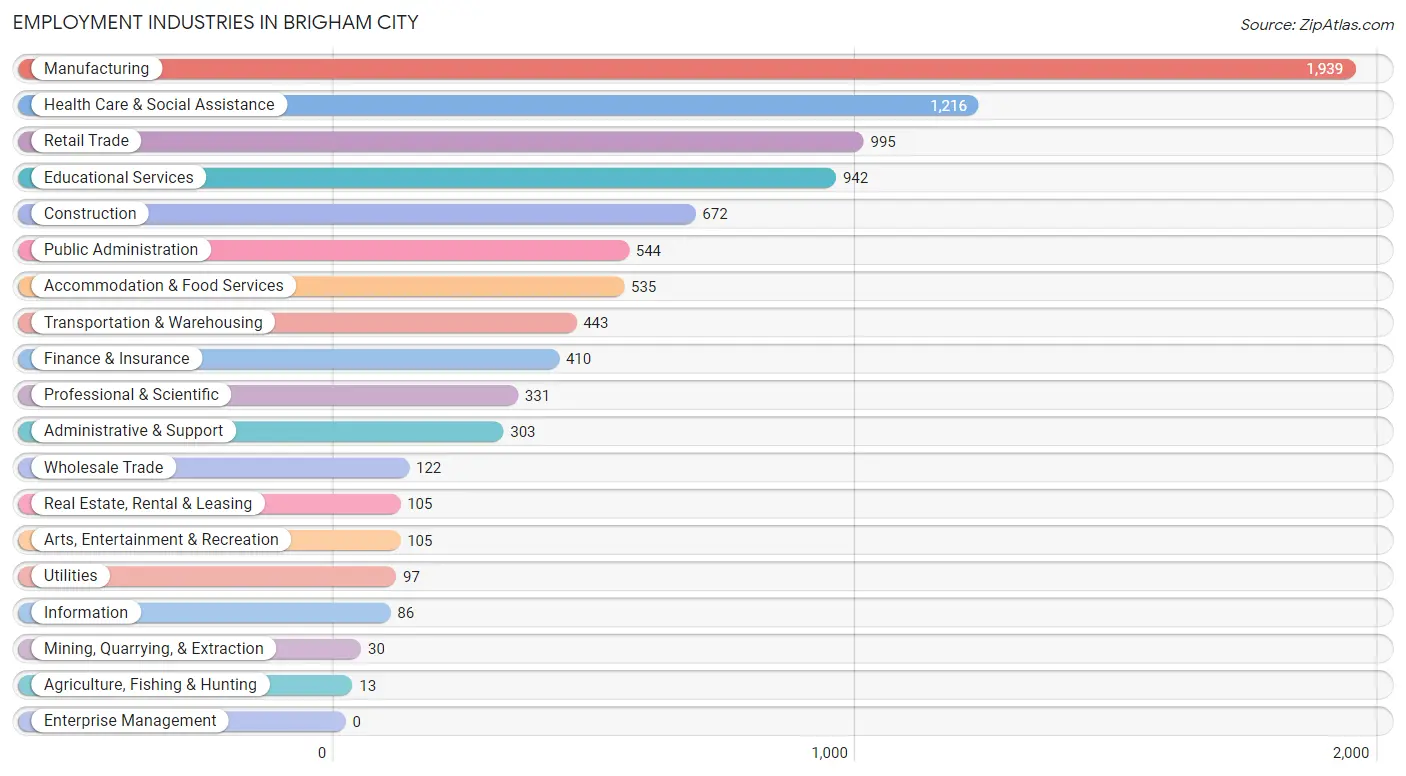
Employment Industries in Brigham City
The major employment industries in Brigham City include Manufacturing (1,939 | 21.1%), Health Care & Social Assistance (1,216 | 13.2%), Retail Trade (995 | 10.8%), Educational Services (942 | 10.2%), and Construction (672 | 7.3%).
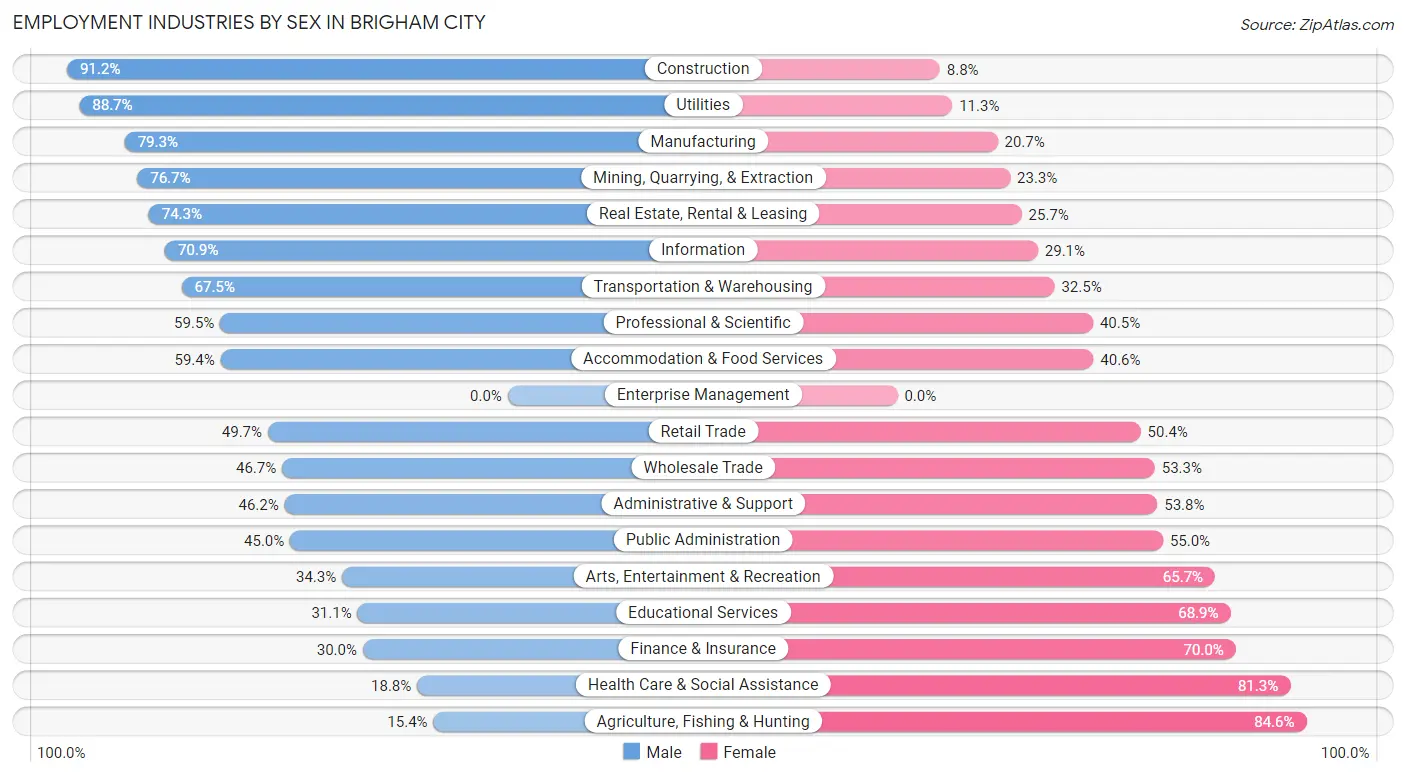
Employment Industries by Sex in Brigham City
The Brigham City industries that see more men than women are Construction (91.2%), Utilities (88.7%), and Manufacturing (79.3%), whereas the industries that tend to have a higher number of women are Agriculture, Fishing & Hunting (84.6%), Health Care & Social Assistance (81.2%), and Finance & Insurance (70.0%).
| Industry | Male | Female |
| Agriculture, Fishing & Hunting | 2 (15.4%) | 11 (84.6%) |
| Mining, Quarrying, & Extraction | 23 (76.7%) | 7 (23.3%) |
| Construction | 613 (91.2%) | 59 (8.8%) |
| Manufacturing | 1,537 (79.3%) | 402 (20.7%) |
| Wholesale Trade | 57 (46.7%) | 65 (53.3%) |
| Retail Trade | 494 (49.6%) | 501 (50.3%) |
| Transportation & Warehousing | 299 (67.5%) | 144 (32.5%) |
| Utilities | 86 (88.7%) | 11 (11.3%) |
| Information | 61 (70.9%) | 25 (29.1%) |
| Finance & Insurance | 123 (30.0%) | 287 (70.0%) |
| Real Estate, Rental & Leasing | 78 (74.3%) | 27 (25.7%) |
| Professional & Scientific | 197 (59.5%) | 134 (40.5%) |
| Enterprise Management | 0 (0.0%) | 0 (0.0%) |
| Administrative & Support | 140 (46.2%) | 163 (53.8%) |
| Educational Services | 293 (31.1%) | 649 (68.9%) |
| Health Care & Social Assistance | 228 (18.8%) | 988 (81.2%) |
| Arts, Entertainment & Recreation | 36 (34.3%) | 69 (65.7%) |
| Accommodation & Food Services | 318 (59.4%) | 217 (40.6%) |
| Public Administration | 245 (45.0%) | 299 (55.0%) |
| Total | 5,017 (54.5%) | 4,183 (45.5%) |
Education in Brigham City
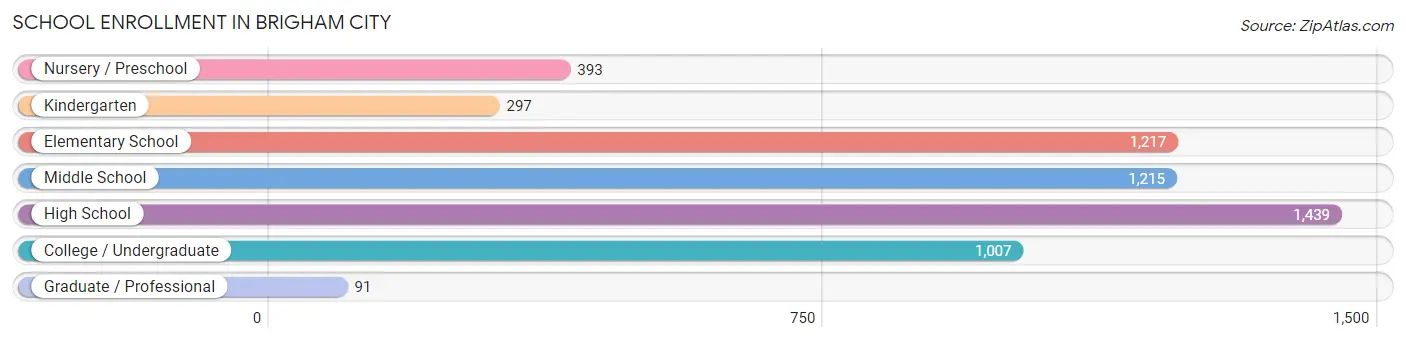
School Enrollment in Brigham City
The most common levels of schooling among the 5,659 students in Brigham City are high school (1,439 | 25.4%), elementary school (1,217 | 21.5%), and middle school (1,215 | 21.5%).
| School Level | # Students | % Students |
| Nursery / Preschool | 393 | 6.9% |
| Kindergarten | 297 | 5.2% |
| Elementary School | 1,217 | 21.5% |
| Middle School | 1,215 | 21.5% |
| High School | 1,439 | 25.4% |
| College / Undergraduate | 1,007 | 17.8% |
| Graduate / Professional | 91 | 1.6% |
| Total | 5,659 | 100.0% |
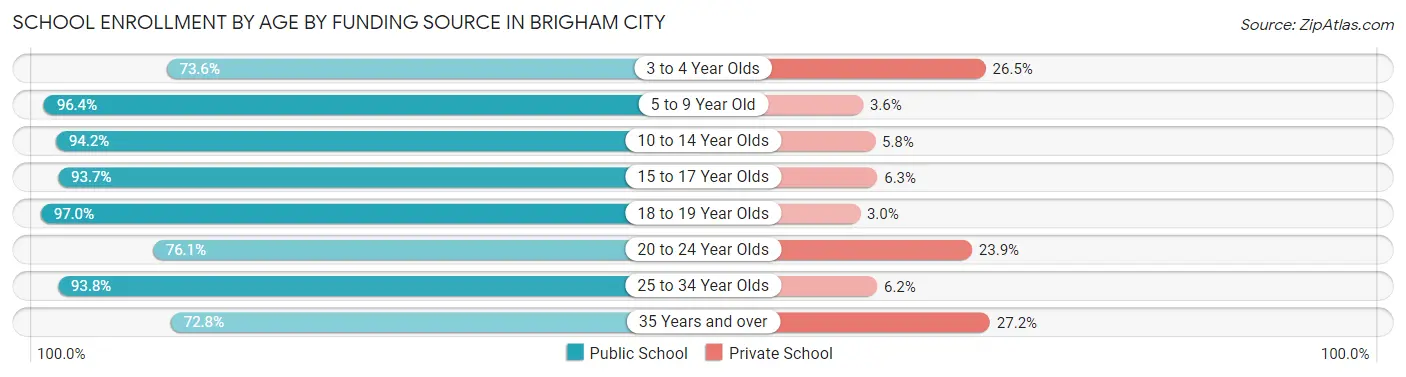
School Enrollment by Age by Funding Source in Brigham City
Out of a total of 5,659 students who are enrolled in schools in Brigham City, 487 (8.6%) attend a private institution, while the remaining 5,172 (91.4%) are enrolled in public schools. The age group of 35 years and over has the highest likelihood of being enrolled in private schools, with 73 (27.2% in the age bracket) enrolled. Conversely, the age group of 18 to 19 year olds has the lowest likelihood of being enrolled in a private school, with 192 (97.0% in the age bracket) attending a public institution.
| Age Bracket | Public School | Private School |
| 3 to 4 Year Olds | 178 (73.6%) | 64 (26.5%) |
| 5 to 9 Year Old | 1,478 (96.4%) | 55 (3.6%) |
| 10 to 14 Year Olds | 1,466 (94.2%) | 91 (5.8%) |
| 15 to 17 Year Olds | 1,019 (93.7%) | 68 (6.3%) |
| 18 to 19 Year Olds | 192 (97.0%) | 6 (3.0%) |
| 20 to 24 Year Olds | 344 (76.1%) | 108 (23.9%) |
| 25 to 34 Year Olds | 302 (93.8%) | 20 (6.2%) |
| 35 Years and over | 195 (72.8%) | 73 (27.2%) |
| Total | 5,172 (91.4%) | 487 (8.6%) |
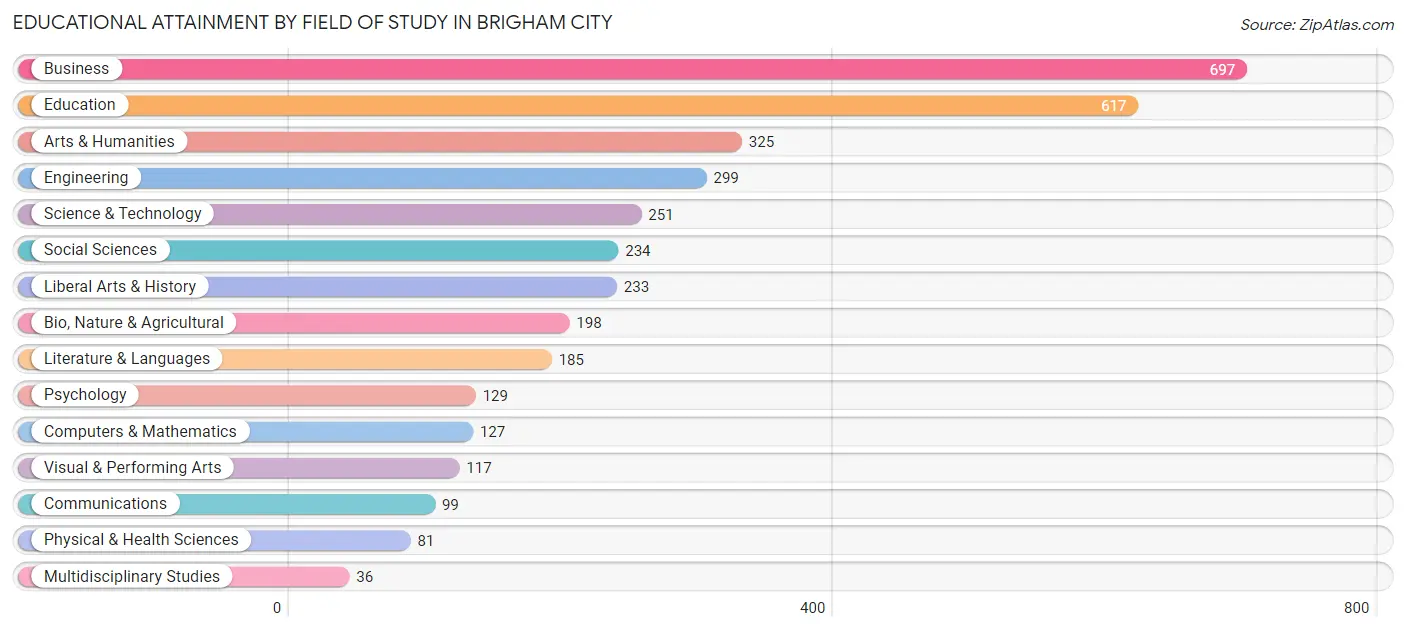
Educational Attainment by Field of Study in Brigham City
Business (697 | 19.2%), education (617 | 17.0%), arts & humanities (325 | 9.0%), engineering (299 | 8.2%), and science & technology (251 | 6.9%) are the most common fields of study among 3,628 individuals in Brigham City who have obtained a bachelor's degree or higher.
| Field of Study | # Graduates | % Graduates |
| Computers & Mathematics | 127 | 3.5% |
| Bio, Nature & Agricultural | 198 | 5.5% |
| Physical & Health Sciences | 81 | 2.2% |
| Psychology | 129 | 3.6% |
| Social Sciences | 234 | 6.5% |
| Engineering | 299 | 8.2% |
| Multidisciplinary Studies | 36 | 1.0% |
| Science & Technology | 251 | 6.9% |
| Business | 697 | 19.2% |
| Education | 617 | 17.0% |
| Literature & Languages | 185 | 5.1% |
| Liberal Arts & History | 233 | 6.4% |
| Visual & Performing Arts | 117 | 3.2% |
| Communications | 99 | 2.7% |
| Arts & Humanities | 325 | 9.0% |
| Total | 3,628 | 100.0% |
Transportation & Commute in Brigham City
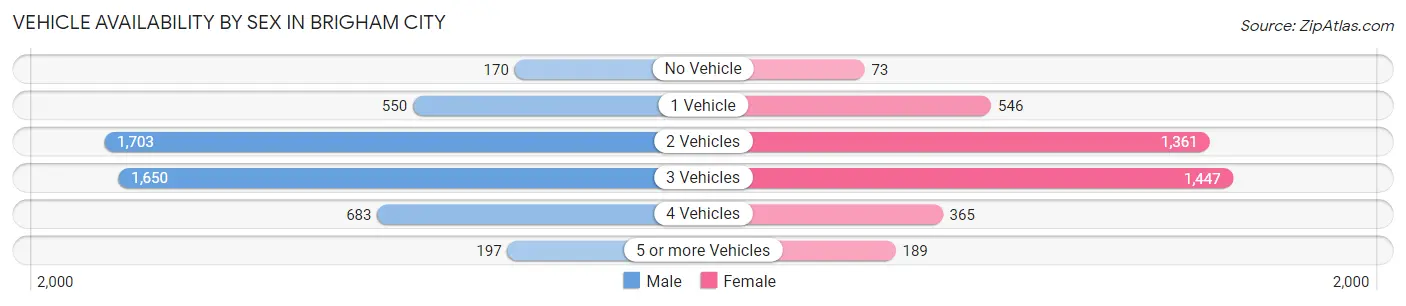
Vehicle Availability by Sex in Brigham City
The most prevalent vehicle ownership categories in Brigham City are males with 2 vehicles (1,703, accounting for 34.4%) and females with 2 vehicles (1,361, making up 42.8%).
| Vehicles Available | Male | Female |
| No Vehicle | 170 (3.4%) | 73 (1.8%) |
| 1 Vehicle | 550 (11.1%) | 546 (13.7%) |
| 2 Vehicles | 1,703 (34.4%) | 1,361 (34.2%) |
| 3 Vehicles | 1,650 (33.3%) | 1,447 (36.3%) |
| 4 Vehicles | 683 (13.8%) | 365 (9.2%) |
| 5 or more Vehicles | 197 (4.0%) | 189 (4.8%) |
| Total | 4,953 (100.0%) | 3,981 (100.0%) |
Commute Time in Brigham City
The most frequently occuring commute durations in Brigham City are 5 to 9 minutes (1,945 commuters, 23.9%), 10 to 14 minutes (1,311 commuters, 16.1%), and 30 to 34 minutes (978 commuters, 12.0%).
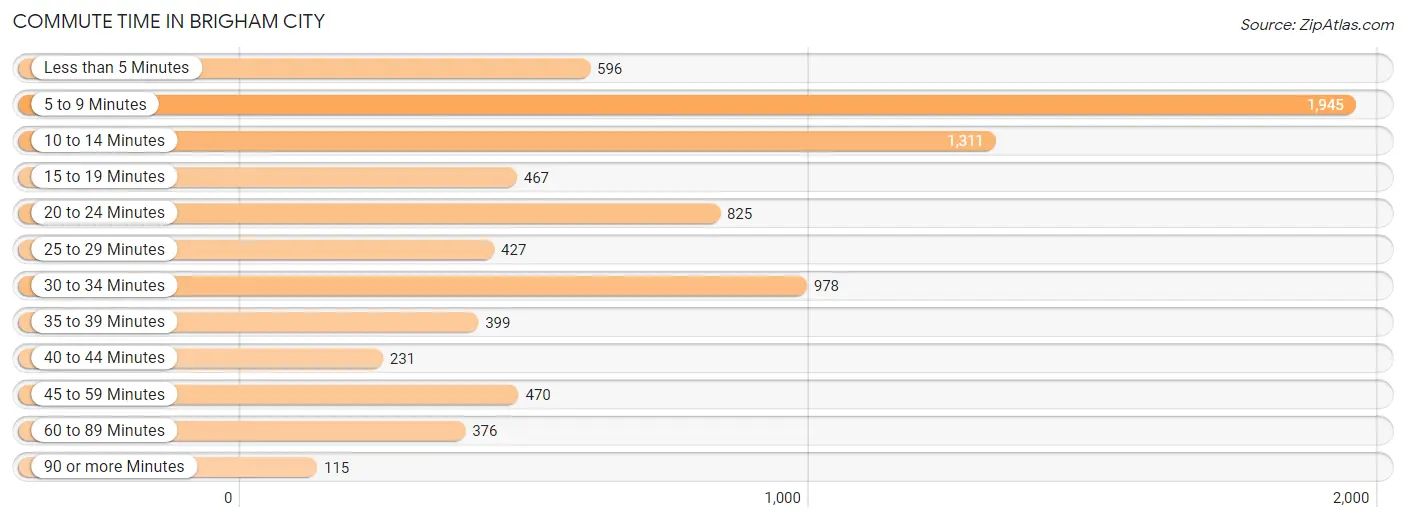
| Commute Time | # Commuters | % Commuters |
| Less than 5 Minutes | 596 | 7.3% |
| 5 to 9 Minutes | 1,945 | 23.9% |
| 10 to 14 Minutes | 1,311 | 16.1% |
| 15 to 19 Minutes | 467 | 5.7% |
| 20 to 24 Minutes | 825 | 10.1% |
| 25 to 29 Minutes | 427 | 5.2% |
| 30 to 34 Minutes | 978 | 12.0% |
| 35 to 39 Minutes | 399 | 4.9% |
| 40 to 44 Minutes | 231 | 2.8% |
| 45 to 59 Minutes | 470 | 5.8% |
| 60 to 89 Minutes | 376 | 4.6% |
| 90 or more Minutes | 115 | 1.4% |
Commute Time by Sex in Brigham City
The most common commute times in Brigham City are 5 to 9 minutes (920 commuters, 20.1%) for males and 5 to 9 minutes (1,025 commuters, 28.7%) for females.
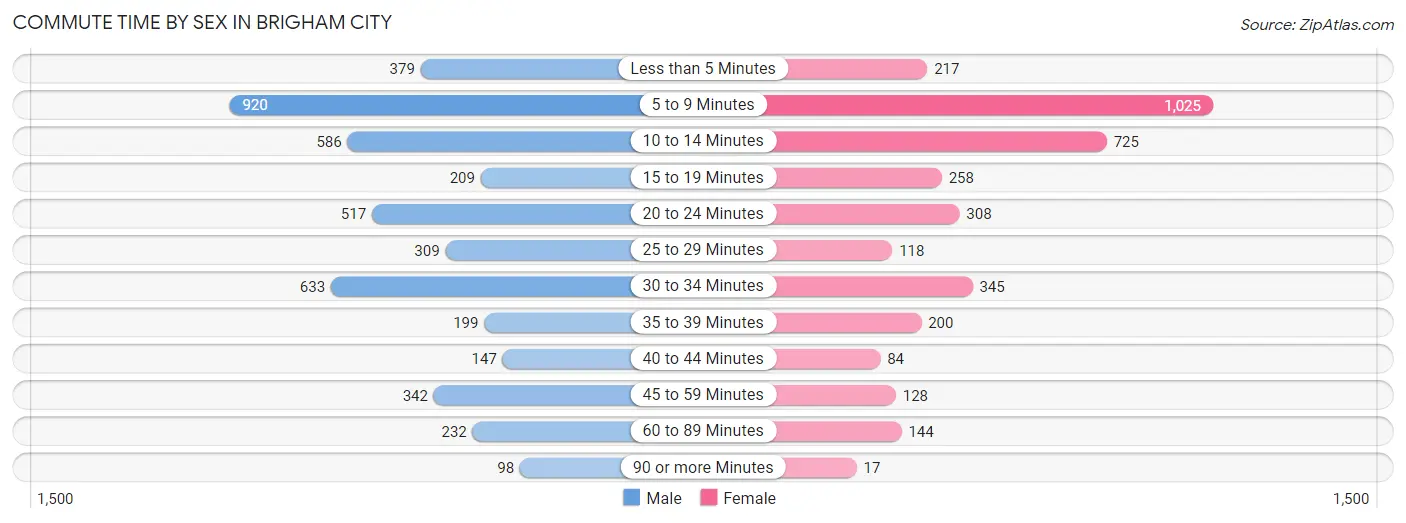
| Commute Time | Male | Female |
| Less than 5 Minutes | 379 (8.3%) | 217 (6.1%) |
| 5 to 9 Minutes | 920 (20.1%) | 1,025 (28.7%) |
| 10 to 14 Minutes | 586 (12.8%) | 725 (20.3%) |
| 15 to 19 Minutes | 209 (4.6%) | 258 (7.2%) |
| 20 to 24 Minutes | 517 (11.3%) | 308 (8.6%) |
| 25 to 29 Minutes | 309 (6.8%) | 118 (3.3%) |
| 30 to 34 Minutes | 633 (13.9%) | 345 (9.7%) |
| 35 to 39 Minutes | 199 (4.3%) | 200 (5.6%) |
| 40 to 44 Minutes | 147 (3.2%) | 84 (2.4%) |
| 45 to 59 Minutes | 342 (7.5%) | 128 (3.6%) |
| 60 to 89 Minutes | 232 (5.1%) | 144 (4.0%) |
| 90 or more Minutes | 98 (2.1%) | 17 (0.5%) |
Time of Departure to Work by Sex in Brigham City
The most frequent times of departure to work in Brigham City are 4:00 PM to 11:59 PM (644, 14.1%) for males and 12:00 PM to 3:59 PM (578, 16.2%) for females.
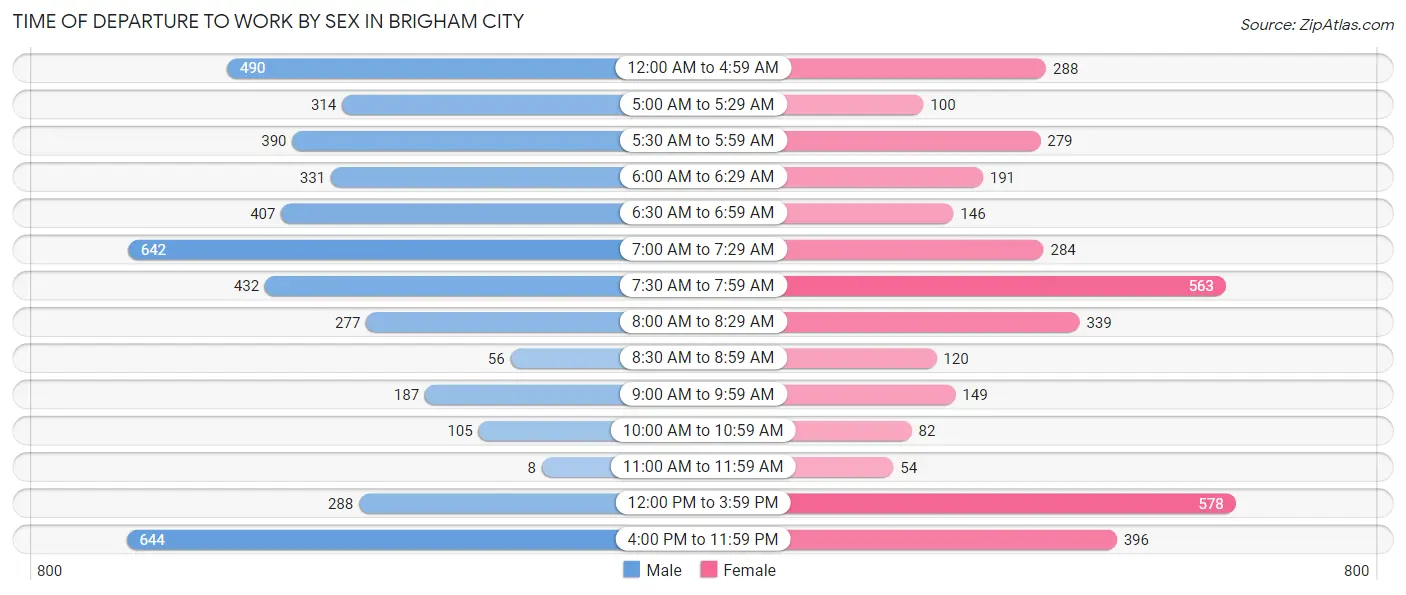
| Time of Departure | Male | Female |
| 12:00 AM to 4:59 AM | 490 (10.7%) | 288 (8.1%) |
| 5:00 AM to 5:29 AM | 314 (6.9%) | 100 (2.8%) |
| 5:30 AM to 5:59 AM | 390 (8.5%) | 279 (7.8%) |
| 6:00 AM to 6:29 AM | 331 (7.2%) | 191 (5.3%) |
| 6:30 AM to 6:59 AM | 407 (8.9%) | 146 (4.1%) |
| 7:00 AM to 7:29 AM | 642 (14.1%) | 284 (8.0%) |
| 7:30 AM to 7:59 AM | 432 (9.5%) | 563 (15.8%) |
| 8:00 AM to 8:29 AM | 277 (6.1%) | 339 (9.5%) |
| 8:30 AM to 8:59 AM | 56 (1.2%) | 120 (3.4%) |
| 9:00 AM to 9:59 AM | 187 (4.1%) | 149 (4.2%) |
| 10:00 AM to 10:59 AM | 105 (2.3%) | 82 (2.3%) |
| 11:00 AM to 11:59 AM | 8 (0.2%) | 54 (1.5%) |
| 12:00 PM to 3:59 PM | 288 (6.3%) | 578 (16.2%) |
| 4:00 PM to 11:59 PM | 644 (14.1%) | 396 (11.1%) |
| Total | 4,571 (100.0%) | 3,569 (100.0%) |
Housing Occupancy in Brigham City
Occupancy by Ownership in Brigham City
Of the total 6,812 dwellings in Brigham City, owner-occupied units account for 4,352 (63.9%), while renter-occupied units make up 2,460 (36.1%).
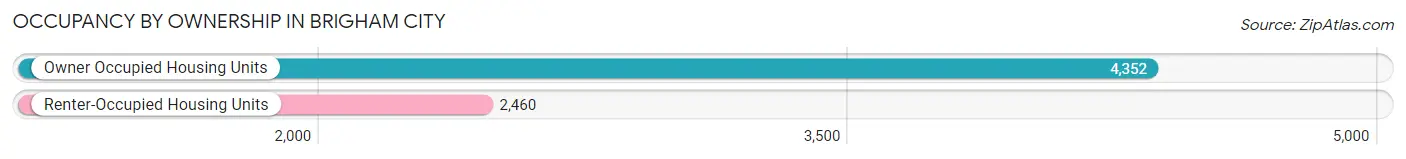
| Occupancy | # Housing Units | % Housing Units |
| Owner Occupied Housing Units | 4,352 | 63.9% |
| Renter-Occupied Housing Units | 2,460 | 36.1% |
| Total Occupied Housing Units | 6,812 | 100.0% |
Occupancy by Household Size in Brigham City
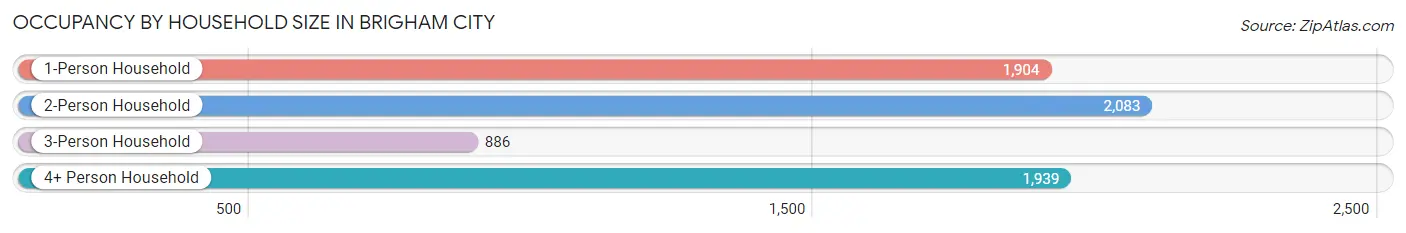
| Household Size | # Housing Units | % Housing Units |
| 1-Person Household | 1,904 | 28.0% |
| 2-Person Household | 2,083 | 30.6% |
| 3-Person Household | 886 | 13.0% |
| 4+ Person Household | 1,939 | 28.5% |
| Total Housing Units | 6,812 | 100.0% |
Occupancy by Ownership by Household Size in Brigham City
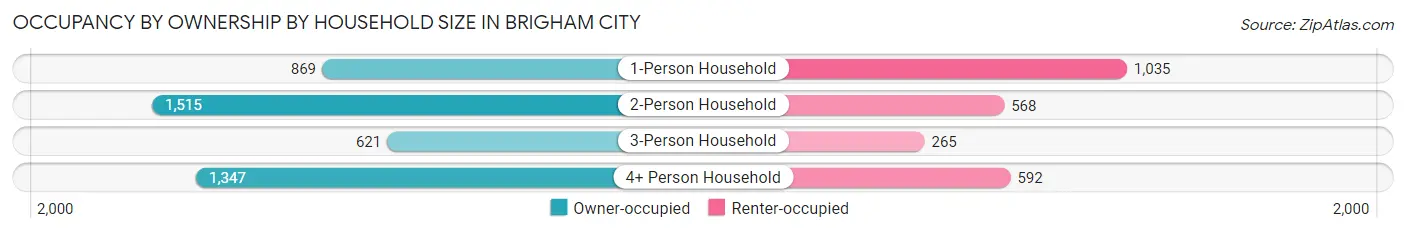
| Household Size | Owner-occupied | Renter-occupied |
| 1-Person Household | 869 (45.6%) | 1,035 (54.4%) |
| 2-Person Household | 1,515 (72.7%) | 568 (27.3%) |
| 3-Person Household | 621 (70.1%) | 265 (29.9%) |
| 4+ Person Household | 1,347 (69.5%) | 592 (30.5%) |
| Total Housing Units | 4,352 (63.9%) | 2,460 (36.1%) |
Occupancy by Educational Attainment in Brigham City
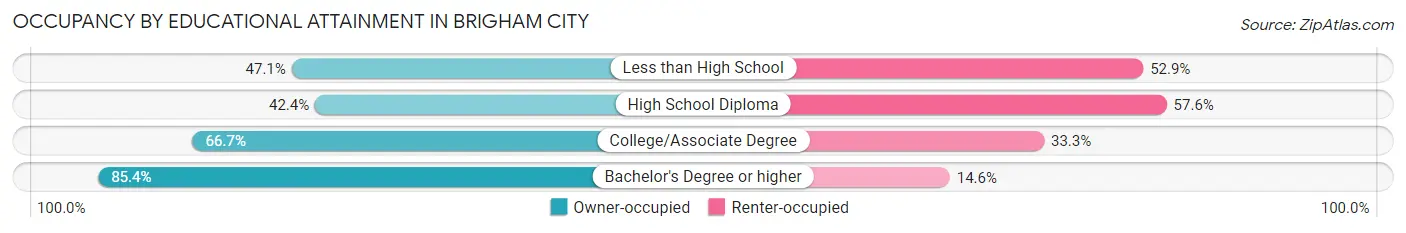
| Household Size | Owner-occupied | Renter-occupied |
| Less than High School | 168 (47.1%) | 189 (52.9%) |
| High School Diploma | 830 (42.4%) | 1,127 (57.6%) |
| College/Associate Degree | 1,739 (66.7%) | 868 (33.3%) |
| Bachelor's Degree or higher | 1,615 (85.4%) | 276 (14.6%) |
Occupancy by Age of Householder in Brigham City
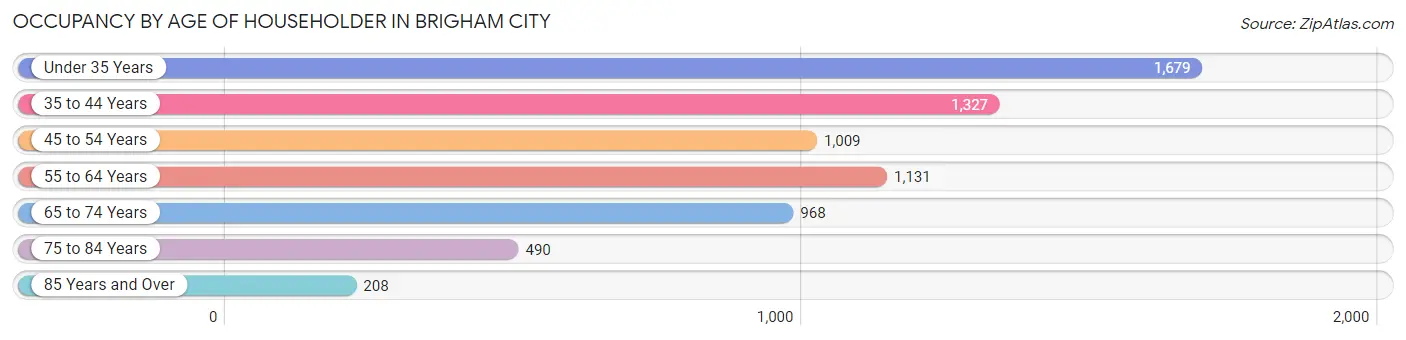
| Age Bracket | # Households | % Households |
| Under 35 Years | 1,679 | 24.6% |
| 35 to 44 Years | 1,327 | 19.5% |
| 45 to 54 Years | 1,009 | 14.8% |
| 55 to 64 Years | 1,131 | 16.6% |
| 65 to 74 Years | 968 | 14.2% |
| 75 to 84 Years | 490 | 7.2% |
| 85 Years and Over | 208 | 3.0% |
| Total | 6,812 | 100.0% |
Housing Finances in Brigham City
Median Income by Occupancy in Brigham City
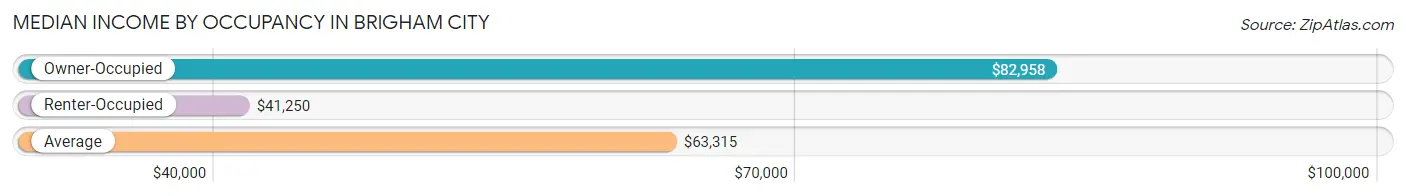
| Occupancy Type | # Households | Median Income |
| Owner-Occupied | 4,352 (63.9%) | $82,958 |
| Renter-Occupied | 2,460 (36.1%) | $41,250 |
| Average | 6,812 (100.0%) | $63,315 |
Occupancy by Householder Income Bracket in Brigham City
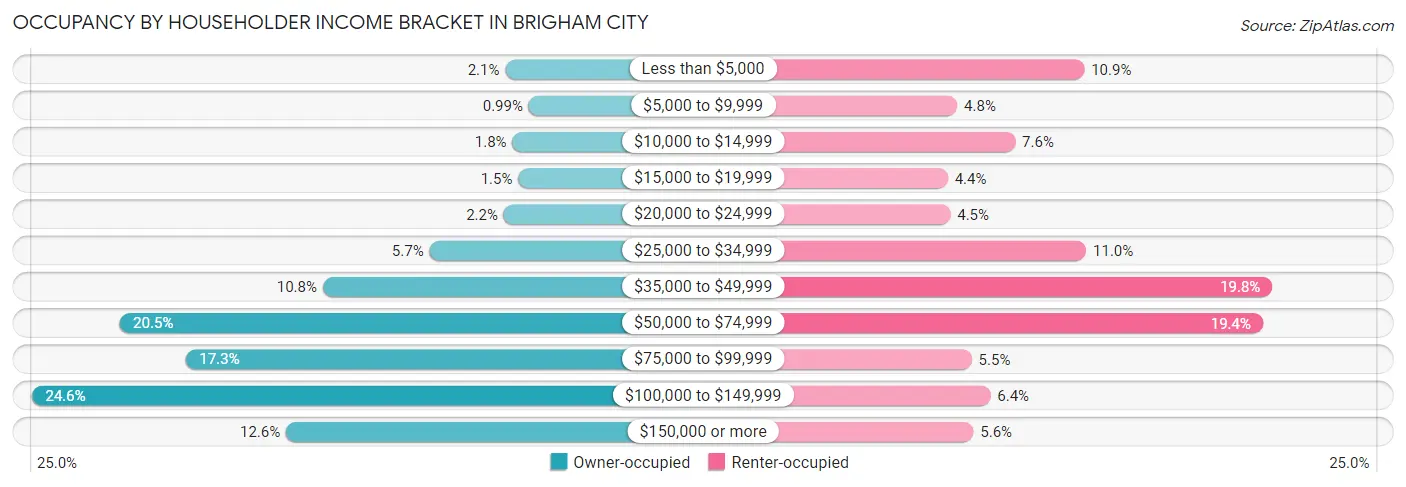
| Income Bracket | Owner-occupied | Renter-occupied |
| Less than $5,000 | 92 (2.1%) | 268 (10.9%) |
| $5,000 to $9,999 | 43 (1.0%) | 119 (4.8%) |
| $10,000 to $14,999 | 77 (1.8%) | 187 (7.6%) |
| $15,000 to $19,999 | 65 (1.5%) | 108 (4.4%) |
| $20,000 to $24,999 | 95 (2.2%) | 111 (4.5%) |
| $25,000 to $34,999 | 249 (5.7%) | 270 (11.0%) |
| $35,000 to $49,999 | 470 (10.8%) | 488 (19.8%) |
| $50,000 to $74,999 | 890 (20.4%) | 477 (19.4%) |
| $75,000 to $99,999 | 753 (17.3%) | 136 (5.5%) |
| $100,000 to $149,999 | 1,072 (24.6%) | 158 (6.4%) |
| $150,000 or more | 546 (12.6%) | 138 (5.6%) |
| Total | 4,352 (100.0%) | 2,460 (100.0%) |
Monthly Housing Cost Tiers in Brigham City
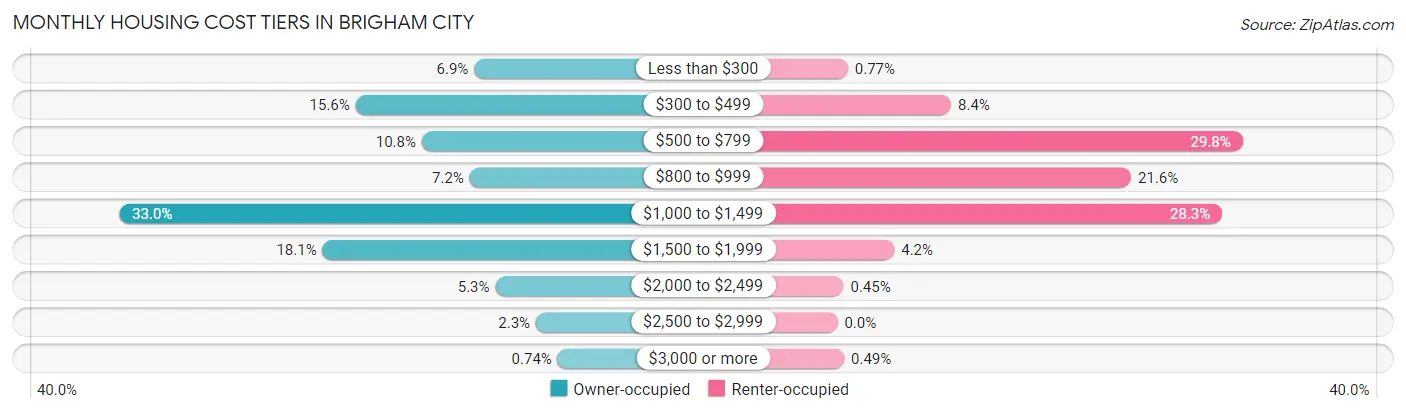
| Monthly Cost | Owner-occupied | Renter-occupied |
| Less than $300 | 300 (6.9%) | 19 (0.8%) |
| $300 to $499 | 680 (15.6%) | 206 (8.4%) |
| $500 to $799 | 468 (10.7%) | 734 (29.8%) |
| $800 to $999 | 314 (7.2%) | 532 (21.6%) |
| $1,000 to $1,499 | 1,438 (33.0%) | 697 (28.3%) |
| $1,500 to $1,999 | 786 (18.1%) | 103 (4.2%) |
| $2,000 to $2,499 | 232 (5.3%) | 11 (0.4%) |
| $2,500 to $2,999 | 102 (2.3%) | 0 (0.0%) |
| $3,000 or more | 32 (0.7%) | 12 (0.5%) |
| Total | 4,352 (100.0%) | 2,460 (100.0%) |
Physical Housing Characteristics in Brigham City
Housing Structures in Brigham City
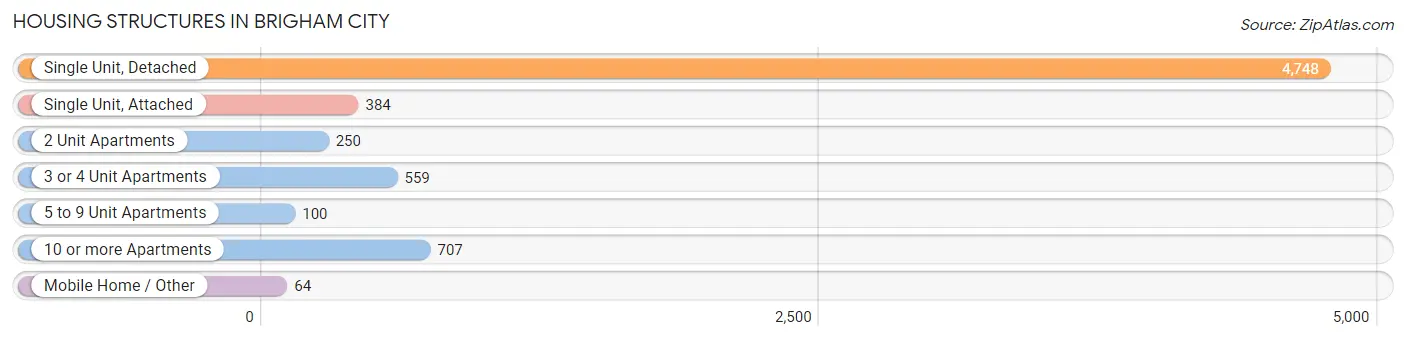
| Structure Type | # Housing Units | % Housing Units |
| Single Unit, Detached | 4,748 | 69.7% |
| Single Unit, Attached | 384 | 5.6% |
| 2 Unit Apartments | 250 | 3.7% |
| 3 or 4 Unit Apartments | 559 | 8.2% |
| 5 to 9 Unit Apartments | 100 | 1.5% |
| 10 or more Apartments | 707 | 10.4% |
| Mobile Home / Other | 64 | 0.9% |
| Total | 6,812 | 100.0% |
Housing Structures by Occupancy in Brigham City
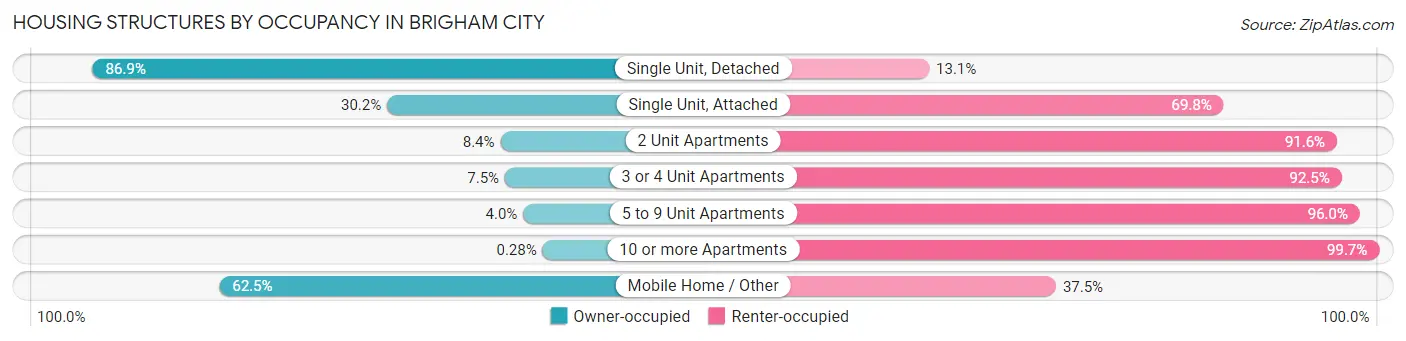
| Structure Type | Owner-occupied | Renter-occupied |
| Single Unit, Detached | 4,127 (86.9%) | 621 (13.1%) |
| Single Unit, Attached | 116 (30.2%) | 268 (69.8%) |
| 2 Unit Apartments | 21 (8.4%) | 229 (91.6%) |
| 3 or 4 Unit Apartments | 42 (7.5%) | 517 (92.5%) |
| 5 to 9 Unit Apartments | 4 (4.0%) | 96 (96.0%) |
| 10 or more Apartments | 2 (0.3%) | 705 (99.7%) |
| Mobile Home / Other | 40 (62.5%) | 24 (37.5%) |
| Total | 4,352 (63.9%) | 2,460 (36.1%) |
Housing Structures by Number of Rooms in Brigham City
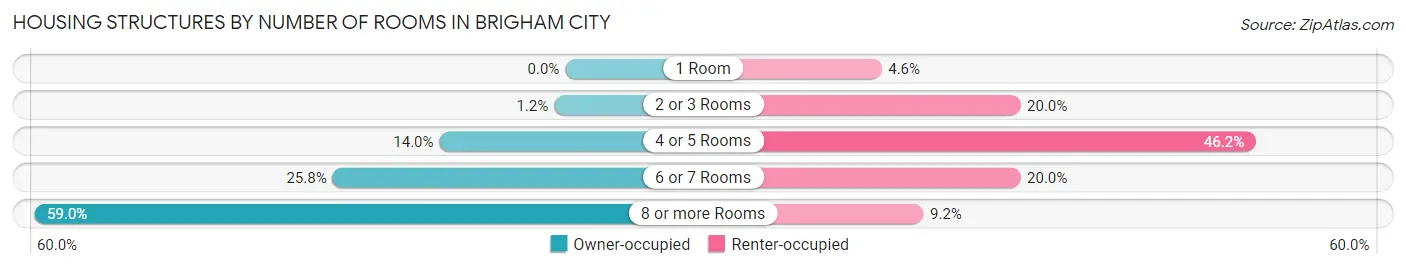
| Number of Rooms | Owner-occupied | Renter-occupied |
| 1 Room | 0 (0.0%) | 113 (4.6%) |
| 2 or 3 Rooms | 54 (1.2%) | 492 (20.0%) |
| 4 or 5 Rooms | 608 (14.0%) | 1,136 (46.2%) |
| 6 or 7 Rooms | 1,124 (25.8%) | 492 (20.0%) |
| 8 or more Rooms | 2,566 (59.0%) | 227 (9.2%) |
| Total | 4,352 (100.0%) | 2,460 (100.0%) |
Housing Structure by Heating Type in Brigham City
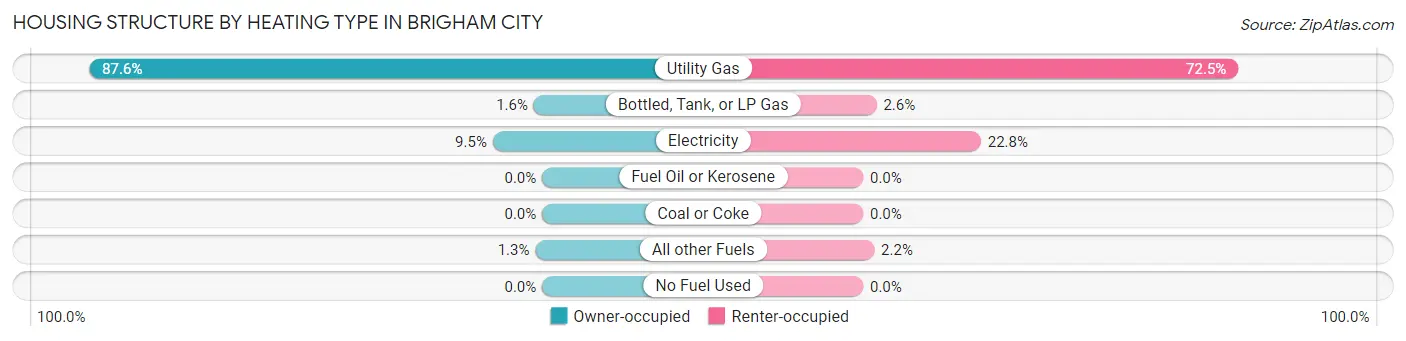
| Heating Type | Owner-occupied | Renter-occupied |
| Utility Gas | 3,810 (87.5%) | 1,783 (72.5%) |
| Bottled, Tank, or LP Gas | 70 (1.6%) | 64 (2.6%) |
| Electricity | 415 (9.5%) | 560 (22.8%) |
| Fuel Oil or Kerosene | 0 (0.0%) | 0 (0.0%) |
| Coal or Coke | 0 (0.0%) | 0 (0.0%) |
| All other Fuels | 57 (1.3%) | 53 (2.1%) |
| No Fuel Used | 0 (0.0%) | 0 (0.0%) |
| Total | 4,352 (100.0%) | 2,460 (100.0%) |
Household Vehicle Usage in Brigham City
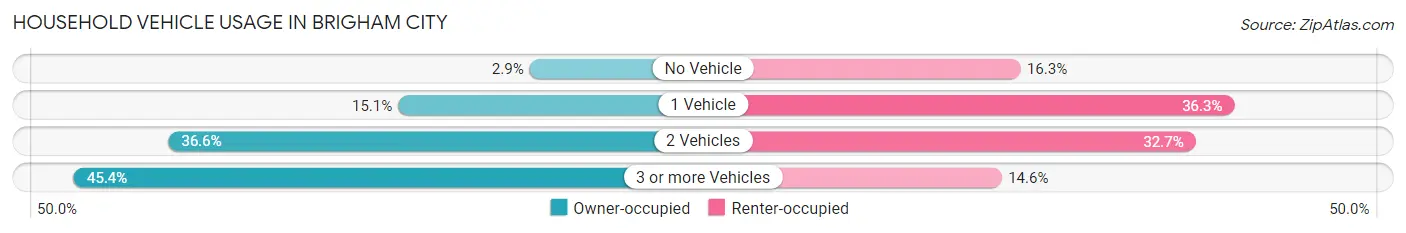
| Vehicles per Household | Owner-occupied | Renter-occupied |
| No Vehicle | 125 (2.9%) | 402 (16.3%) |
| 1 Vehicle | 659 (15.1%) | 894 (36.3%) |
| 2 Vehicles | 1,592 (36.6%) | 805 (32.7%) |
| 3 or more Vehicles | 1,976 (45.4%) | 359 (14.6%) |
| Total | 4,352 (100.0%) | 2,460 (100.0%) |
Real Estate & Mortgages in Brigham City
Real Estate and Mortgage Overview in Brigham City
| Characteristic | Without Mortgage | With Mortgage |
| Housing Units | 1,439 | 2,913 |
| Median Property Value | $283,100 | $279,400 |
| Median Household Income | $71,678 | $433 |
| Monthly Housing Costs | $442 | $32 |
| Real Estate Taxes | $1,560 | $18 |
Property Value by Mortgage Status in Brigham City
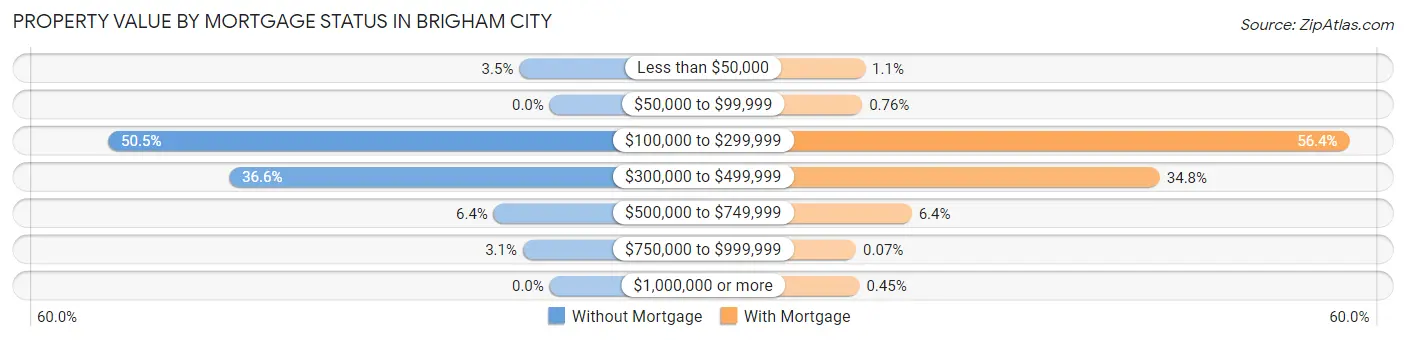
| Property Value | Without Mortgage | With Mortgage |
| Less than $50,000 | 50 (3.5%) | 32 (1.1%) |
| $50,000 to $99,999 | 0 (0.0%) | 22 (0.8%) |
| $100,000 to $299,999 | 726 (50.4%) | 1,644 (56.4%) |
| $300,000 to $499,999 | 527 (36.6%) | 1,013 (34.8%) |
| $500,000 to $749,999 | 92 (6.4%) | 187 (6.4%) |
| $750,000 to $999,999 | 44 (3.1%) | 2 (0.1%) |
| $1,000,000 or more | 0 (0.0%) | 13 (0.4%) |
| Total | 1,439 (100.0%) | 2,913 (100.0%) |
Household Income by Mortgage Status in Brigham City
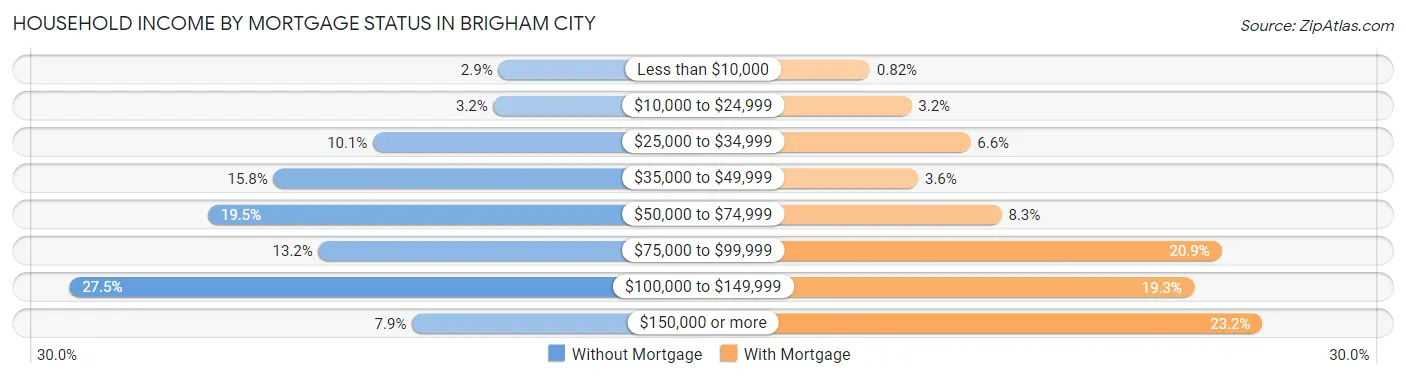
| Household Income | Without Mortgage | With Mortgage |
| Less than $10,000 | 42 (2.9%) | 24 (0.8%) |
| $10,000 to $24,999 | 46 (3.2%) | 93 (3.2%) |
| $25,000 to $34,999 | 145 (10.1%) | 191 (6.6%) |
| $35,000 to $49,999 | 227 (15.8%) | 104 (3.6%) |
| $50,000 to $74,999 | 281 (19.5%) | 243 (8.3%) |
| $75,000 to $99,999 | 190 (13.2%) | 609 (20.9%) |
| $100,000 to $149,999 | 395 (27.5%) | 563 (19.3%) |
| $150,000 or more | 113 (7.9%) | 677 (23.2%) |
| Total | 1,439 (100.0%) | 2,913 (100.0%) |
Property Value to Household Income Ratio in Brigham City
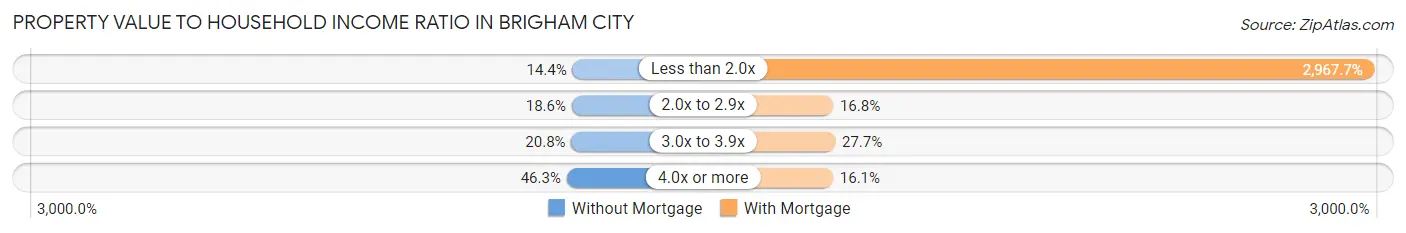
| Value-to-Income Ratio | Without Mortgage | With Mortgage |
| Less than 2.0x | 207 (14.4%) | 86,449 (2,967.7%) |
| 2.0x to 2.9x | 267 (18.5%) | 488 (16.8%) |
| 3.0x to 3.9x | 299 (20.8%) | 808 (27.7%) |
| 4.0x or more | 666 (46.3%) | 468 (16.1%) |
| Total | 1,439 (100.0%) | 2,913 (100.0%) |
Real Estate Taxes by Mortgage Status in Brigham City
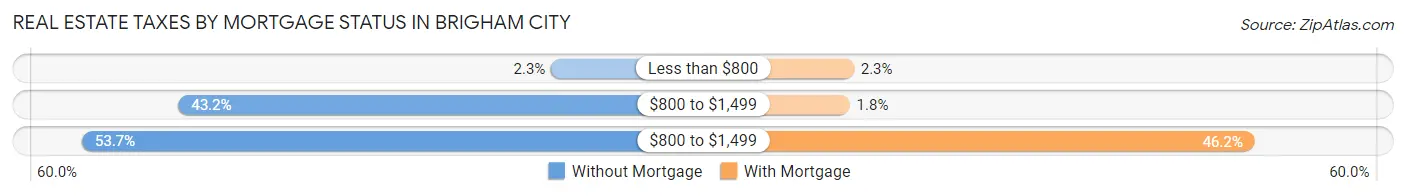
| Property Taxes | Without Mortgage | With Mortgage |
| Less than $800 | 33 (2.3%) | 66 (2.3%) |
| $800 to $1,499 | 621 (43.1%) | 53 (1.8%) |
| $800 to $1,499 | 773 (53.7%) | 1,346 (46.2%) |
| Total | 1,439 (100.0%) | 2,913 (100.0%) |
Health & Disability in Brigham City
Health Insurance Coverage by Age in Brigham City
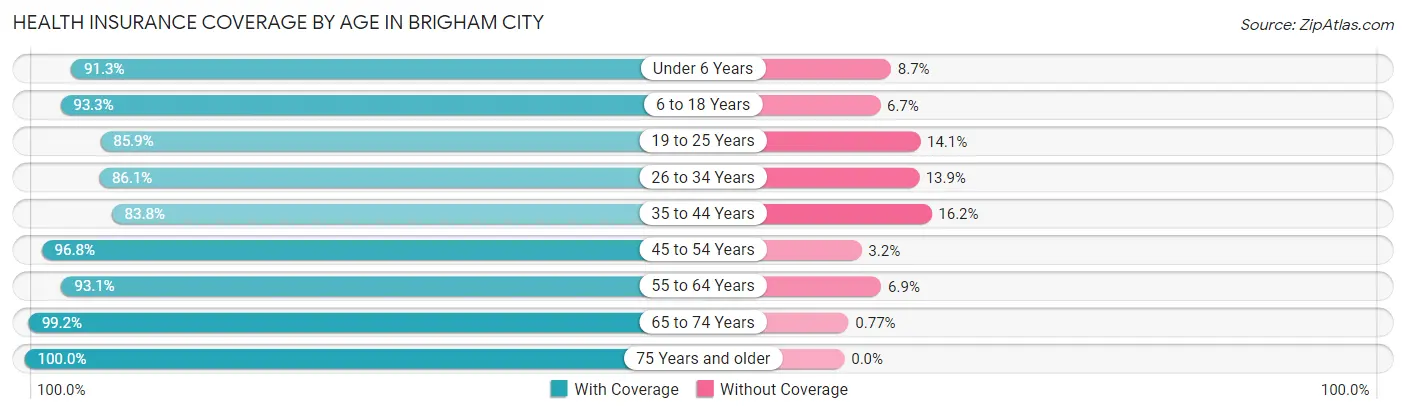
| Age Bracket | With Coverage | Without Coverage |
| Under 6 Years | 1,630 (91.3%) | 155 (8.7%) |
| 6 to 18 Years | 3,796 (93.3%) | 271 (6.7%) |
| 19 to 25 Years | 1,703 (85.9%) | 280 (14.1%) |
| 26 to 34 Years | 2,050 (86.1%) | 330 (13.9%) |
| 35 to 44 Years | 2,171 (83.8%) | 421 (16.2%) |
| 45 to 54 Years | 2,005 (96.8%) | 66 (3.2%) |
| 55 to 64 Years | 1,695 (93.1%) | 125 (6.9%) |
| 65 to 74 Years | 1,549 (99.2%) | 12 (0.8%) |
| 75 Years and older | 1,063 (100.0%) | 0 (0.0%) |
| Total | 17,662 (91.4%) | 1,660 (8.6%) |
Health Insurance Coverage by Citizenship Status in Brigham City
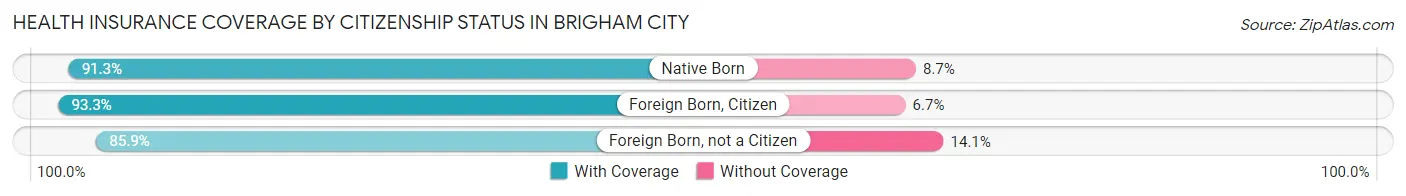
| Citizenship Status | With Coverage | Without Coverage |
| Native Born | 1,630 (91.3%) | 155 (8.7%) |
| Foreign Born, Citizen | 3,796 (93.3%) | 271 (6.7%) |
| Foreign Born, not a Citizen | 1,703 (85.9%) | 280 (14.1%) |
Health Insurance Coverage by Household Income in Brigham City
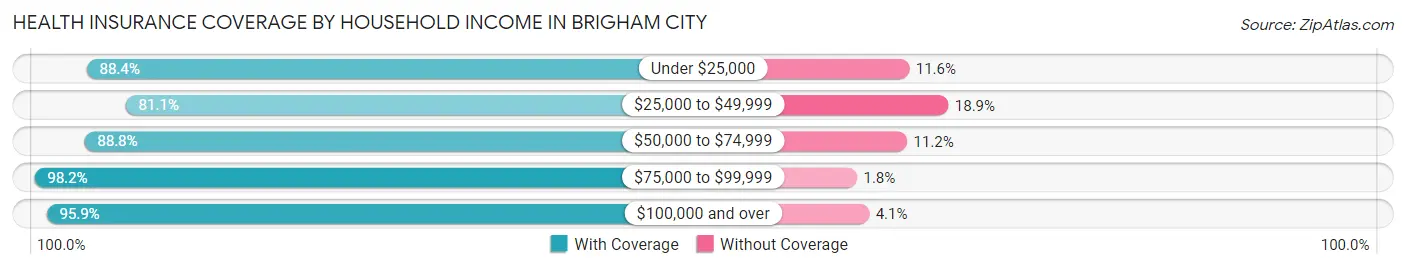
| Household Income | With Coverage | Without Coverage |
| Under $25,000 | 1,401 (88.4%) | 184 (11.6%) |
| $25,000 to $49,999 | 2,743 (81.1%) | 641 (18.9%) |
| $50,000 to $74,999 | 3,876 (88.8%) | 489 (11.2%) |
| $75,000 to $99,999 | 2,692 (98.2%) | 50 (1.8%) |
| $100,000 and over | 6,928 (95.9%) | 296 (4.1%) |
Public vs Private Health Insurance Coverage by Age in Brigham City
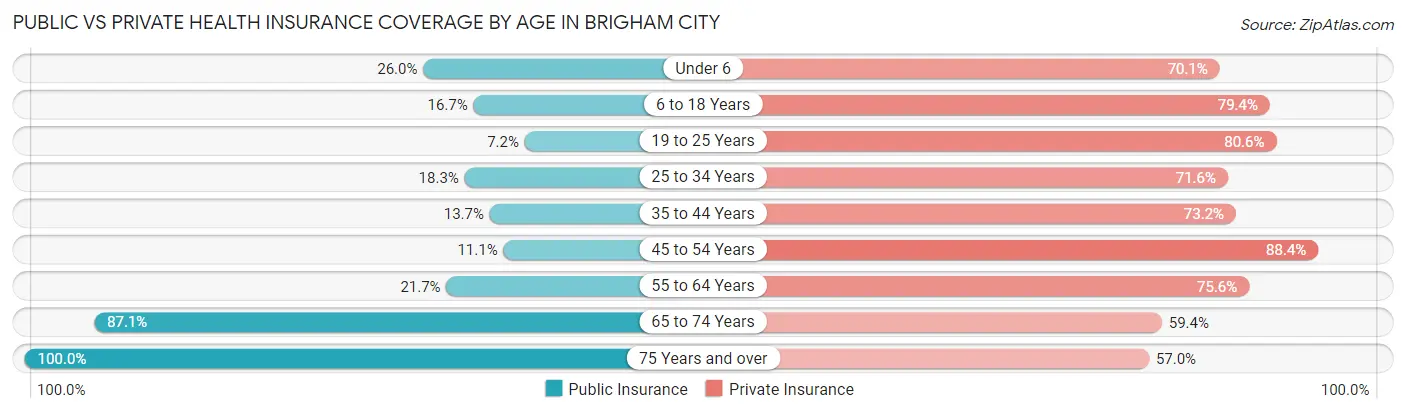
| Age Bracket | Public Insurance | Private Insurance |
| Under 6 | 464 (26.0%) | 1,252 (70.1%) |
| 6 to 18 Years | 678 (16.7%) | 3,231 (79.4%) |
| 19 to 25 Years | 142 (7.2%) | 1,599 (80.6%) |
| 25 to 34 Years | 436 (18.3%) | 1,705 (71.6%) |
| 35 to 44 Years | 354 (13.7%) | 1,896 (73.2%) |
| 45 to 54 Years | 230 (11.1%) | 1,831 (88.4%) |
| 55 to 64 Years | 395 (21.7%) | 1,376 (75.6%) |
| 65 to 74 Years | 1,360 (87.1%) | 927 (59.4%) |
| 75 Years and over | 1,063 (100.0%) | 606 (57.0%) |
| Total | 5,122 (26.5%) | 14,423 (74.7%) |
Disability Status by Sex by Age in Brigham City
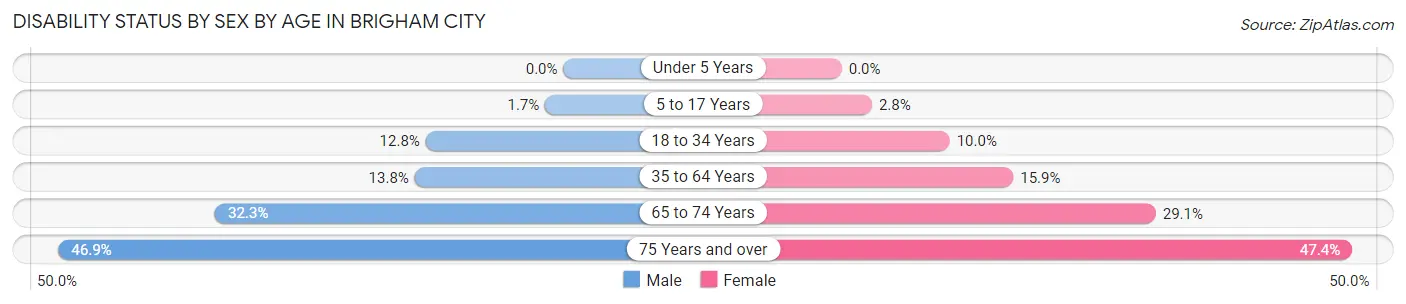
| Age Bracket | Male | Female |
| Under 5 Years | 0 (0.0%) | 0 (0.0%) |
| 5 to 17 Years | 38 (1.7%) | 57 (2.8%) |
| 18 to 34 Years | 259 (12.8%) | 252 (10.0%) |
| 35 to 64 Years | 456 (13.8%) | 506 (15.9%) |
| 65 to 74 Years | 235 (32.3%) | 243 (29.1%) |
| 75 Years and over | 224 (46.9%) | 277 (47.3%) |
Disability Class by Sex by Age in Brigham City
Disability Class: Hearing Difficulty
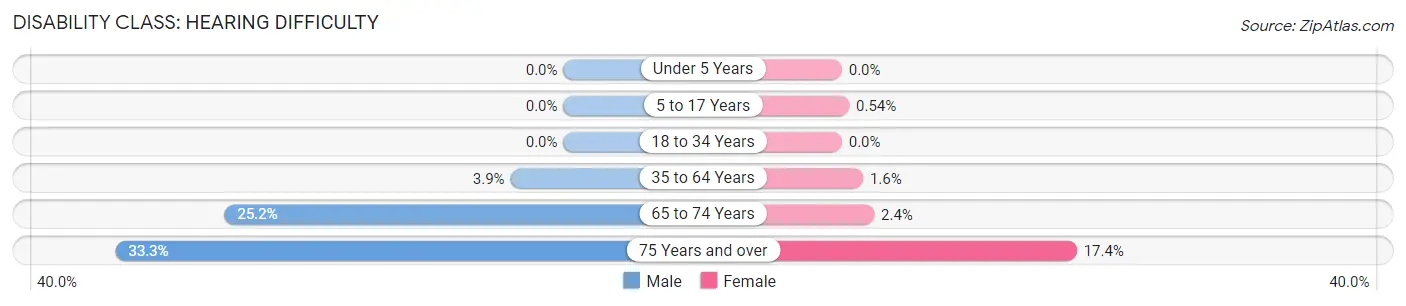
| Age Bracket | Male | Female |
| Under 5 Years | 0 (0.0%) | 0 (0.0%) |
| 5 to 17 Years | 0 (0.0%) | 11 (0.5%) |
| 18 to 34 Years | 0 (0.0%) | 0 (0.0%) |
| 35 to 64 Years | 130 (3.9%) | 50 (1.6%) |
| 65 to 74 Years | 183 (25.2%) | 20 (2.4%) |
| 75 Years and over | 159 (33.3%) | 102 (17.4%) |
Disability Class: Vision Difficulty
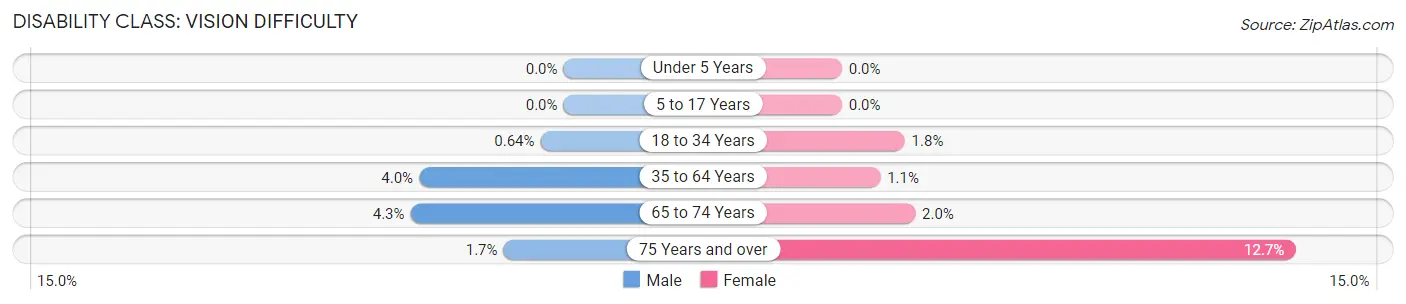
| Age Bracket | Male | Female |
| Under 5 Years | 0 (0.0%) | 0 (0.0%) |
| 5 to 17 Years | 0 (0.0%) | 0 (0.0%) |
| 18 to 34 Years | 13 (0.6%) | 44 (1.8%) |
| 35 to 64 Years | 133 (4.0%) | 34 (1.1%) |
| 65 to 74 Years | 31 (4.3%) | 17 (2.0%) |
| 75 Years and over | 8 (1.7%) | 74 (12.7%) |
Disability Class: Cognitive Difficulty
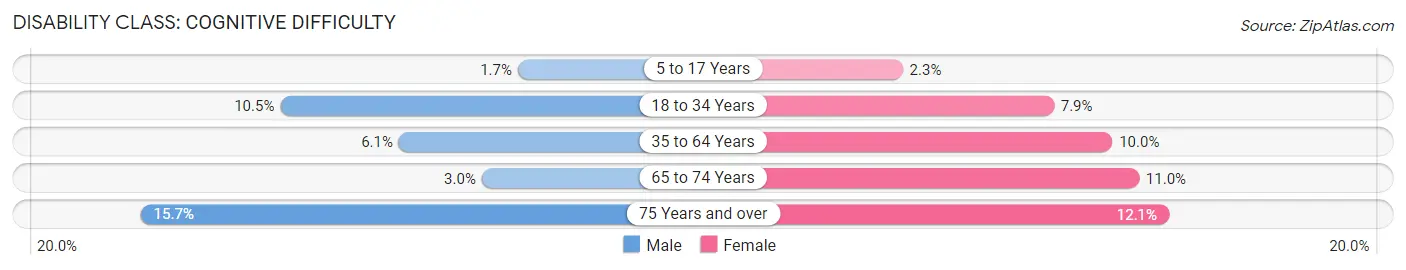
| Age Bracket | Male | Female |
| 5 to 17 Years | 38 (1.7%) | 46 (2.3%) |
| 18 to 34 Years | 213 (10.5%) | 198 (7.9%) |
| 35 to 64 Years | 202 (6.1%) | 319 (10.0%) |
| 65 to 74 Years | 22 (3.0%) | 92 (11.0%) |
| 75 Years and over | 75 (15.7%) | 71 (12.1%) |
Disability Class: Ambulatory Difficulty
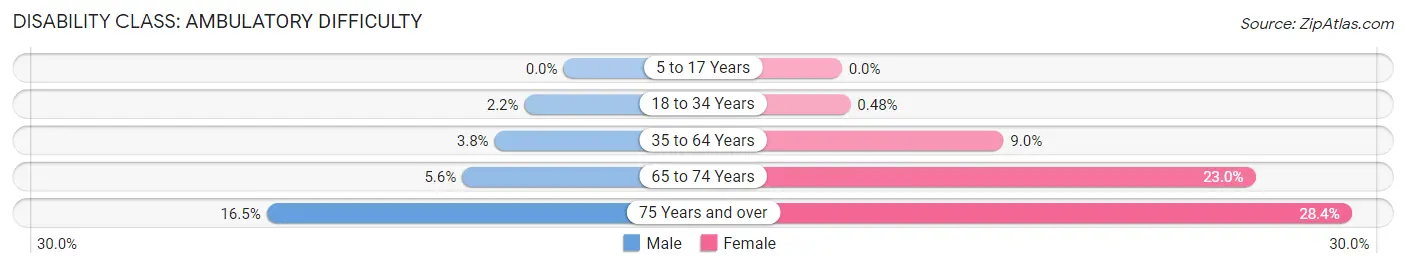
| Age Bracket | Male | Female |
| 5 to 17 Years | 0 (0.0%) | 0 (0.0%) |
| 18 to 34 Years | 44 (2.2%) | 12 (0.5%) |
| 35 to 64 Years | 127 (3.8%) | 286 (9.0%) |
| 65 to 74 Years | 41 (5.6%) | 192 (23.0%) |
| 75 Years and over | 79 (16.5%) | 166 (28.4%) |
Disability Class: Self-Care Difficulty
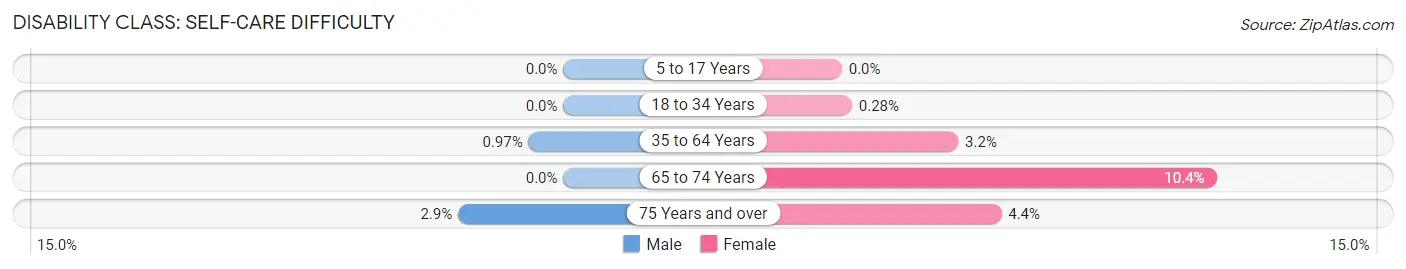
| Age Bracket | Male | Female |
| 5 to 17 Years | 0 (0.0%) | 0 (0.0%) |
| 18 to 34 Years | 0 (0.0%) | 7 (0.3%) |
| 35 to 64 Years | 32 (1.0%) | 103 (3.2%) |
| 65 to 74 Years | 0 (0.0%) | 87 (10.4%) |
| 75 Years and over | 14 (2.9%) | 26 (4.4%) |
Technology Access in Brigham City
Computing Device Access in Brigham City
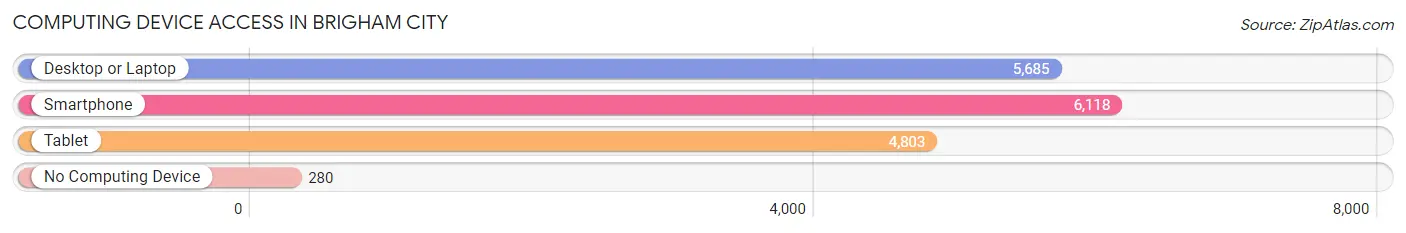
| Device Type | # Households | % Households |
| Desktop or Laptop | 5,685 | 83.5% |
| Smartphone | 6,118 | 89.8% |
| Tablet | 4,803 | 70.5% |
| No Computing Device | 280 | 4.1% |
| Total | 6,812 | 100.0% |
Internet Access in Brigham City
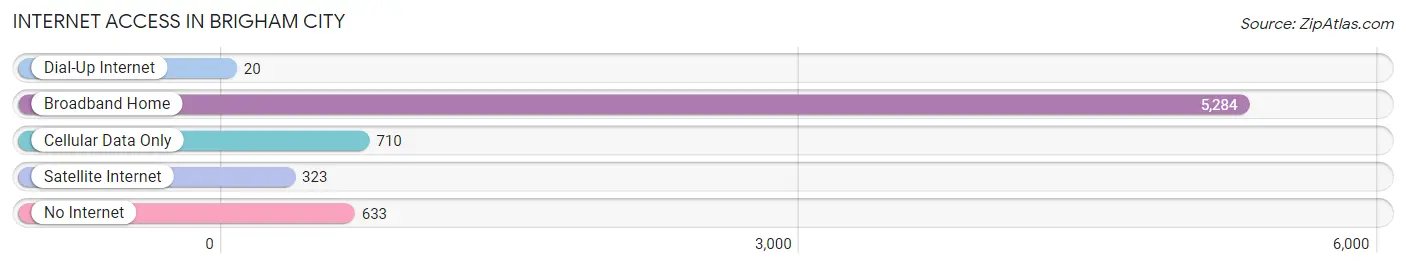
| Internet Type | # Households | % Households |
| Dial-Up Internet | 20 | 0.3% |
| Broadband Home | 5,284 | 77.6% |
| Cellular Data Only | 710 | 10.4% |
| Satellite Internet | 323 | 4.7% |
| No Internet | 633 | 9.3% |
| Total | 6,812 | 100.0% |
Brigham City Summary
Brigham City is a city located in Box Elder County, Utah, United States. It is the county seat of Box Elder County and is located on the eastern edge of the Great Salt Lake. The population of Brigham City was 17,411 at the 2010 census, making it the largest city in Box Elder County.
History
Brigham City was founded in 1851 by Brigham Young and his followers, who were members of The Church of Jesus Christ of Latter-day Saints (LDS Church). The city was named after Young, who was the president of the LDS Church at the time. Brigham City was the first permanent settlement in Box Elder County and was originally known as Box Elder.
The city was incorporated in 1867 and was the first city in Utah to be incorporated by the state legislature. The city was an important stop on the Pony Express and the Overland Stage. It was also the site of the first Mormon temple in Utah, the Box Elder Stake Tabernacle, which was built in 1877.
Geography
Brigham City is located in the northern part of Box Elder County, at the eastern edge of the Great Salt Lake. It is bordered to the north by the city of Perry, to the east by the city of Willard, to the south by the city of Tremonton, and to the west by the city of Corinne.
The city has a total area of 8.3 square miles, of which 8.2 square miles is land and 0.1 square miles is water. The elevation of Brigham City is 4,521 feet above sea level.
Economy
Brigham City is the economic center of Box Elder County and is home to several major employers. The largest employer in the city is the Tooele Army Depot, which is a major employer in the region. Other major employers in the city include the Brigham City Corporation, the Brigham City Medical Center, and the Brigham City School District.
The city is also home to several small businesses, including restaurants, retail stores, and service providers. The city is also home to several manufacturing companies, including the Brigham City Corporation, which produces a variety of products, including automotive parts, medical supplies, and industrial equipment.
Demographics
As of the 2010 census, there were 17,411 people, 5,945 households, and 4,541 families residing in the city. The population density was 2,097.3 people per square mile. The racial makeup of the city was 91.2% White, 0.7% African American, 0.7% Native American, 0.7% Asian, 0.2% Pacific Islander, 4.7% from other races, and 2.0% from two or more races. Hispanic or Latino of any race were 8.3% of the population.
The median income for a household in the city was $41,945, and the median income for a family was $50,945. The per capita income for the city was $19,945. About 8.3% of families and 10.2% of the population were below the poverty line, including 14.2% of those under age 18 and 6.2% of those age 65 or over.
Common Questions
What is Per Capita Income in Brigham City?
Per Capita income in Brigham City is $29,047.
What is the Median Family Income in Brigham City?
Median Family Income in Brigham City is $81,348.
What is the Median Household income in Brigham City?
Median Household Income in Brigham City is $63,315.
What is Income or Wage Gap in Brigham City?
Income or Wage Gap in Brigham City is 46.3%.
Women in Brigham City earn 53.7 cents for every dollar earned by a man.
What is Family Income Deficit in Brigham City?
Family Income Deficit in Brigham City is $10,694.
Families that are below poverty line in Brigham City earn $10,694 less on average than the poverty threshold level.
What is Inequality or Gini Index in Brigham City?
Inequality or Gini Index in Brigham City is 0.42.
What is the Total Population of Brigham City?
Total Population of Brigham City is 19,602.
What is the Total Male Population of Brigham City?
Total Male Population of Brigham City is 9,626.
What is the Total Female Population of Brigham City?
Total Female Population of Brigham City is 9,976.
What is the Ratio of Males per 100 Females in Brigham City?
There are 96.49 Males per 100 Females in Brigham City.
What is the Ratio of Females per 100 Males in Brigham City?
There are 103.64 Females per 100 Males in Brigham City.
What is the Median Population Age in Brigham City?
Median Population Age in Brigham City is 33.0 Years.
What is the Average Family Size in Brigham City
Average Family Size in Brigham City is 3.5 People.
What is the Average Household Size in Brigham City
Average Household Size in Brigham City is 2.8 People.
How Large is the Labor Force in Brigham City?
There are 9,560 People in the Labor Forcein in Brigham City.
What is the Percentage of People in the Labor Force in Brigham City?
65.5% of People are in the Labor Force in Brigham City.
What is the Unemployment Rate in Brigham City?
Unemployment Rate in Brigham City is 3.7%.