Mount Pleasant, UT Map & Demographics
Mount Pleasant Map
Mount Pleasant Overview
$24,017
PER CAPITA INCOME
$67,188
AVG FAMILY INCOME
$61,441
AVG HOUSEHOLD INCOME
50.0%
WAGE / INCOME GAP [ % ]
50.0¢/ $1
WAGE / INCOME GAP [ $ ]
0.40
INEQUALITY / GINI INDEX
3,676
TOTAL POPULATION
1,894
MALE POPULATION
1,782
FEMALE POPULATION
106.29
MALES / 100 FEMALES
94.09
FEMALES / 100 MALES
31.5
MEDIAN AGE
3.4
AVG FAMILY SIZE
3.0
AVG HOUSEHOLD SIZE
1,730
LABOR FORCE [ PEOPLE ]
62.2%
PERCENT IN LABOR FORCE
4.3%
UNEMPLOYMENT RATE
Mount Pleasant Zip Codes
Mount Pleasant Area Codes
Income in Mount Pleasant
Income Overview in Mount Pleasant
Per Capita Income in Mount Pleasant is $24,017, while median incomes of families and households are $67,188 and $61,441 respectively.
| Characteristic | Number | Measure |
| Per Capita Income | 3,676 | $24,017 |
| Median Family Income | 889 | $67,188 |
| Mean Family Income | 889 | $83,306 |
| Median Household Income | 1,133 | $61,441 |
| Mean Household Income | 1,133 | $74,373 |
| Income Deficit | 889 | $0 |
| Wage / Income Gap (%) | 3,676 | 49.97% |
| Wage / Income Gap ($) | 3,676 | 50.03¢ per $1 |
| Gini / Inequality Index | 3,676 | 0.40 |
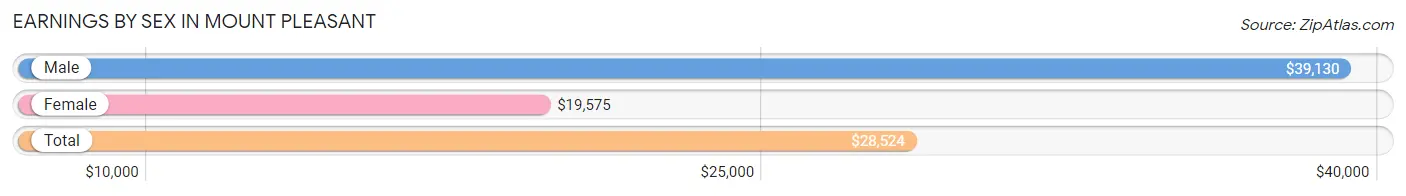
Earnings by Sex in Mount Pleasant
Average Earnings in Mount Pleasant are $28,524, $39,130 for men and $19,575 for women, a difference of 50.0%.
| Sex | Number | Average Earnings |
| Male | 1,034 (58.2%) | $39,130 |
| Female | 743 (41.8%) | $19,575 |
| Total | 1,777 (100.0%) | $28,524 |
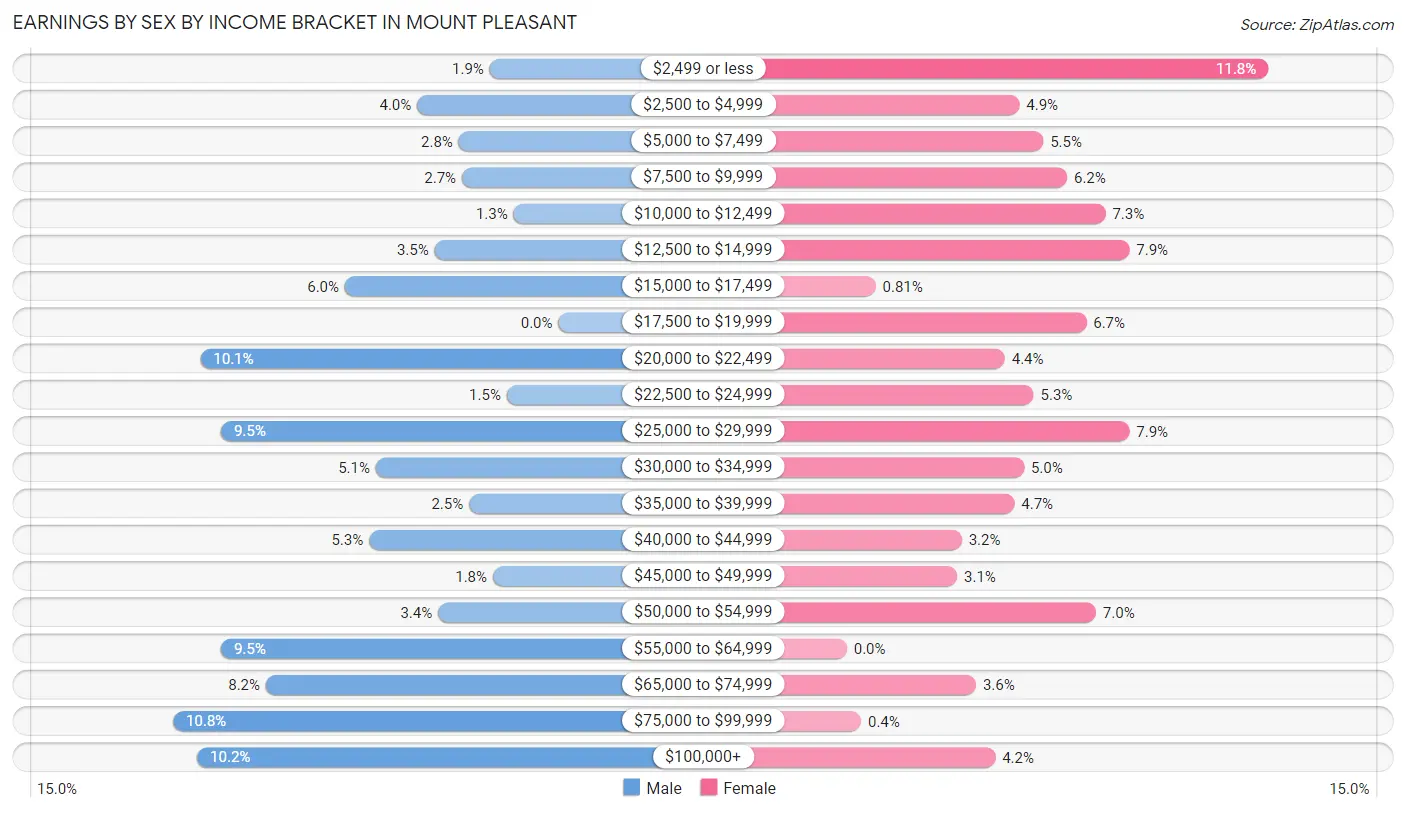
Earnings by Sex by Income Bracket in Mount Pleasant
The most common earnings brackets in Mount Pleasant are $75,000 to $99,999 for men (112 | 10.8%) and $2,499 or less for women (88 | 11.8%).
| Income | Male | Female |
| $2,499 or less | 20 (1.9%) | 88 (11.8%) |
| $2,500 to $4,999 | 41 (4.0%) | 36 (4.9%) |
| $5,000 to $7,499 | 29 (2.8%) | 41 (5.5%) |
| $7,500 to $9,999 | 28 (2.7%) | 46 (6.2%) |
| $10,000 to $12,499 | 13 (1.3%) | 54 (7.3%) |
| $12,500 to $14,999 | 36 (3.5%) | 59 (7.9%) |
| $15,000 to $17,499 | 62 (6.0%) | 6 (0.8%) |
| $17,500 to $19,999 | 0 (0.0%) | 50 (6.7%) |
| $20,000 to $22,499 | 104 (10.1%) | 33 (4.4%) |
| $22,500 to $24,999 | 15 (1.5%) | 39 (5.2%) |
| $25,000 to $29,999 | 98 (9.5%) | 59 (7.9%) |
| $30,000 to $34,999 | 53 (5.1%) | 37 (5.0%) |
| $35,000 to $39,999 | 26 (2.5%) | 35 (4.7%) |
| $40,000 to $44,999 | 55 (5.3%) | 24 (3.2%) |
| $45,000 to $49,999 | 19 (1.8%) | 23 (3.1%) |
| $50,000 to $54,999 | 35 (3.4%) | 52 (7.0%) |
| $55,000 to $64,999 | 98 (9.5%) | 0 (0.0%) |
| $65,000 to $74,999 | 85 (8.2%) | 27 (3.6%) |
| $75,000 to $99,999 | 112 (10.8%) | 3 (0.4%) |
| $100,000+ | 105 (10.2%) | 31 (4.2%) |
| Total | 1,034 (100.0%) | 743 (100.0%) |
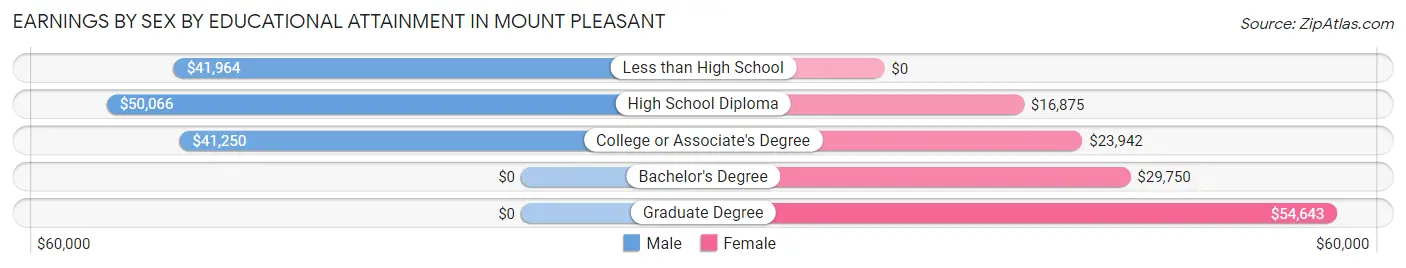
Earnings by Sex by Educational Attainment in Mount Pleasant
Average earnings in Mount Pleasant are $50,972 for men and $21,970 for women, a difference of 56.9%. Men with an educational attainment of high school diploma enjoy the highest average annual earnings of $50,066, while those with college or associate's degree education earn the least with $41,250. Women with an educational attainment of graduate degree earn the most with the average annual earnings of $54,643, while those with high school diploma education have the smallest earnings of $16,875.
| Educational Attainment | Male Income | Female Income |
| Less than High School | $41,964 | $0 |
| High School Diploma | $50,066 | $16,875 |
| College or Associate's Degree | $41,250 | $23,942 |
| Bachelor's Degree | - | - |
| Graduate Degree | - | - |
| Total | $50,972 | $21,970 |
Family Income in Mount Pleasant
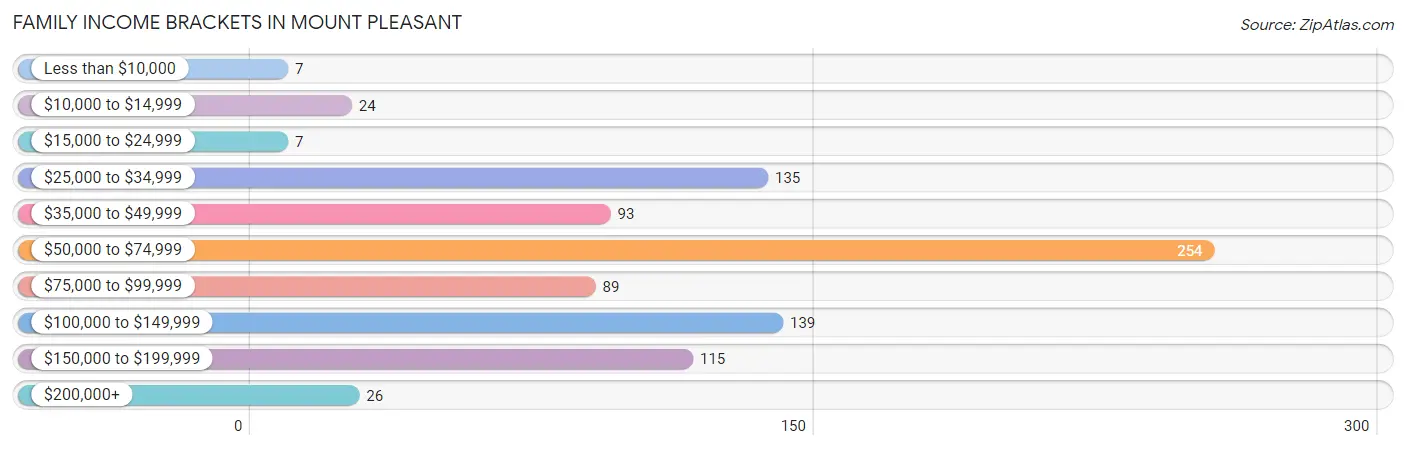
Family Income Brackets in Mount Pleasant
According to the Mount Pleasant family income data, there are 254 families falling into the $50,000 to $74,999 income range, which is the most common income bracket and makes up 28.6% of all families. Conversely, the less than $10,000 income bracket is the least frequent group with only 7 families (0.8%) belonging to this category.
| Income Bracket | # Families | % Families |
| Less than $10,000 | 7 | 0.8% |
| $10,000 to $14,999 | 24 | 2.7% |
| $15,000 to $24,999 | 7 | 0.8% |
| $25,000 to $34,999 | 135 | 15.2% |
| $35,000 to $49,999 | 93 | 10.5% |
| $50,000 to $74,999 | 254 | 28.6% |
| $75,000 to $99,999 | 89 | 10.0% |
| $100,000 to $149,999 | 139 | 15.6% |
| $150,000 to $199,999 | 115 | 12.9% |
| $200,000+ | 26 | 2.9% |
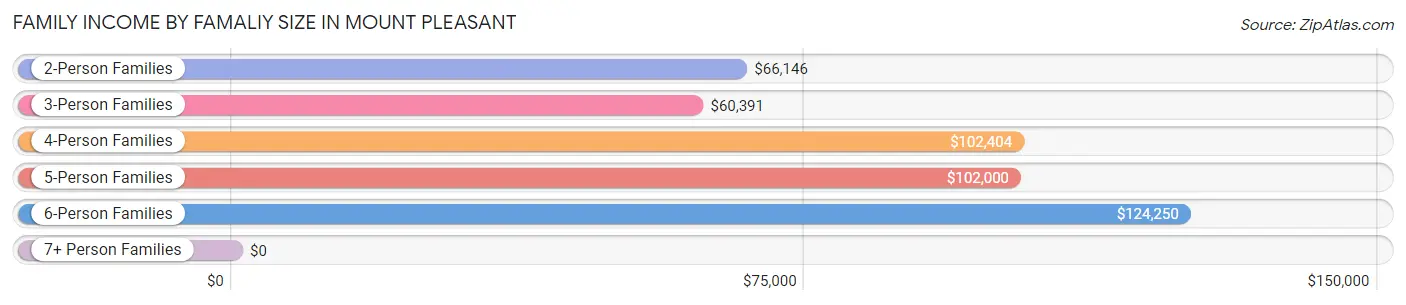
Family Income by Famaliy Size in Mount Pleasant
6-person families (27 | 3.0%) account for the highest median family income in Mount Pleasant with $124,250 per family, while 2-person families (373 | 42.0%) have the highest median income of $33,073 per family member.
| Income Bracket | # Families | Median Income |
| 2-Person Families | 373 (42.0%) | $66,146 |
| 3-Person Families | 133 (15.0%) | $60,391 |
| 4-Person Families | 149 (16.8%) | $102,404 |
| 5-Person Families | 76 (8.6%) | $102,000 |
| 6-Person Families | 27 (3.0%) | $124,250 |
| 7+ Person Families | 131 (14.7%) | $0 |
| Total | 889 (100.0%) | $67,188 |
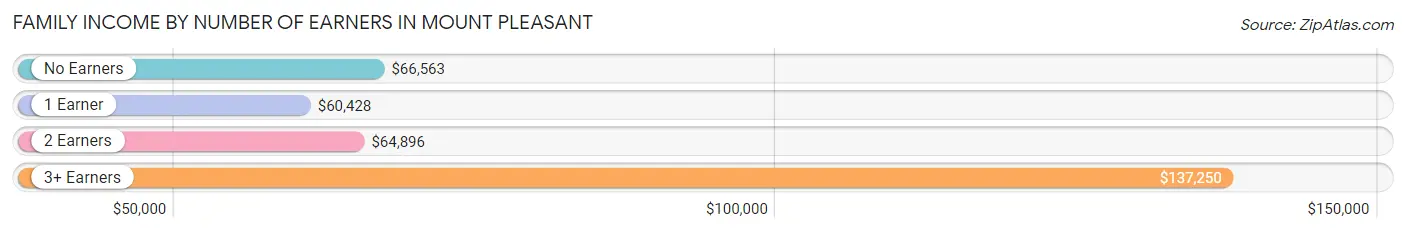
Family Income by Number of Earners in Mount Pleasant
The median family income in Mount Pleasant is $67,188, with families comprising 3+ earners (83) having the highest median family income of $137,250, while families with 1 earner (163) have the lowest median family income of $60,428, accounting for 9.3% and 18.3% of families, respectively.
| Number of Earners | # Families | Median Income |
| No Earners | 133 (15.0%) | $66,563 |
| 1 Earner | 163 (18.3%) | $60,428 |
| 2 Earners | 510 (57.4%) | $64,896 |
| 3+ Earners | 83 (9.3%) | $137,250 |
| Total | 889 (100.0%) | $67,188 |
Household Income in Mount Pleasant
Household Income Brackets in Mount Pleasant
With 266 households falling in the category, the $50,000 to $74,999 income range is the most frequent in Mount Pleasant, accounting for 23.5% of all households. In contrast, only 26 households (2.3%) fall into the $200,000+ income bracket, making it the least populous group.

| Income Bracket | # Households | % Households |
| Less than $10,000 | 78 | 6.9% |
| $10,000 to $14,999 | 43 | 3.8% |
| $15,000 to $24,999 | 48 | 4.2% |
| $25,000 to $34,999 | 168 | 14.8% |
| $35,000 to $49,999 | 112 | 9.9% |
| $50,000 to $74,999 | 266 | 23.5% |
| $75,000 to $99,999 | 97 | 8.6% |
| $100,000 to $149,999 | 174 | 15.4% |
| $150,000 to $199,999 | 120 | 10.6% |
| $200,000+ | 26 | 2.3% |
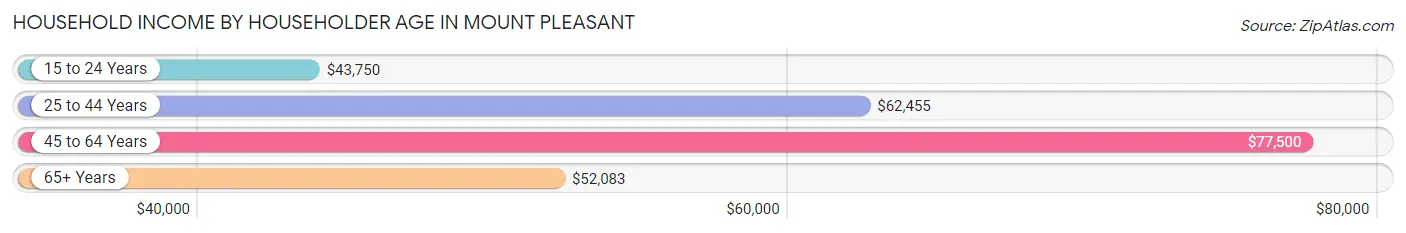
Household Income by Householder Age in Mount Pleasant
The median household income in Mount Pleasant is $61,441, with the highest median household income of $77,500 found in the 45 to 64 years age bracket for the primary householder. A total of 274 households (24.2%) fall into this category. Meanwhile, the 15 to 24 years age bracket for the primary householder has the lowest median household income of $43,750, with 79 households (7.0%) in this group.
| Income Bracket | # Households | Median Income |
| 15 to 24 Years | 79 (7.0%) | $43,750 |
| 25 to 44 Years | 476 (42.0%) | $62,455 |
| 45 to 64 Years | 274 (24.2%) | $77,500 |
| 65+ Years | 304 (26.8%) | $52,083 |
| Total | 1,133 (100.0%) | $61,441 |
Poverty in Mount Pleasant
Income Below Poverty by Sex and Age in Mount Pleasant
With 22.7% poverty level for males and 23.0% for females among the residents of Mount Pleasant, under 5 year old males and 5 year old females are the most vulnerable to poverty, with 75 males (56.4%) and 31 females (66.0%) in their respective age groups living below the poverty level.
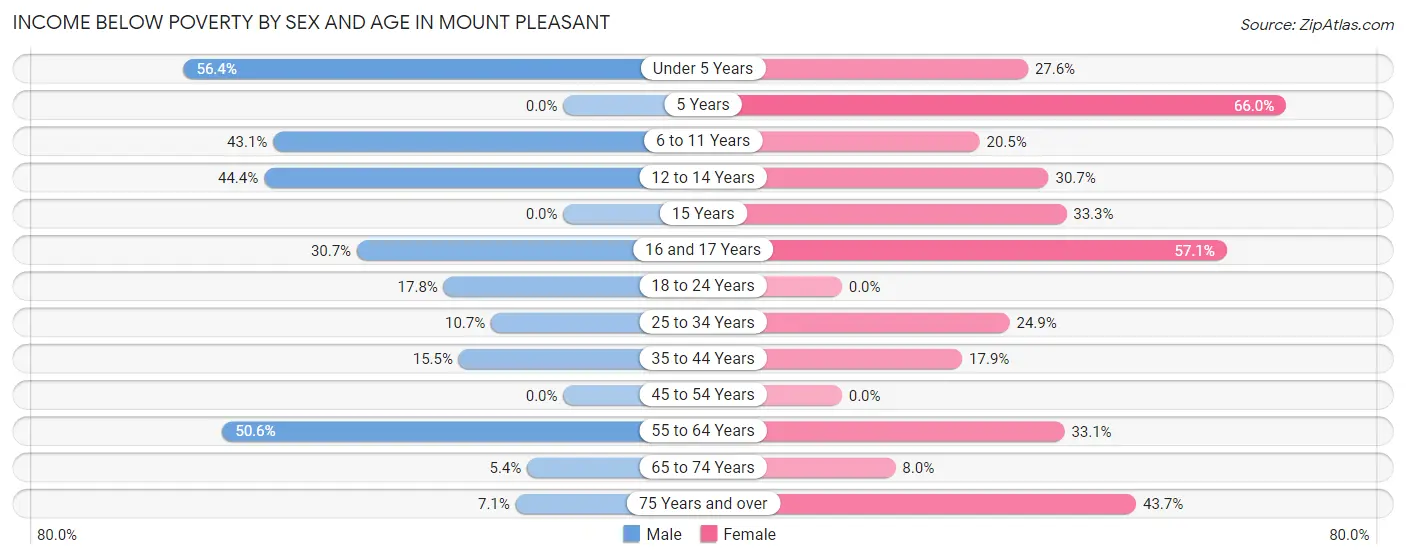
| Age Bracket | Male | Female |
| Under 5 Years | 75 (56.4%) | 34 (27.6%) |
| 5 Years | 0 (0.0%) | 31 (66.0%) |
| 6 to 11 Years | 81 (43.1%) | 18 (20.4%) |
| 12 to 14 Years | 40 (44.4%) | 35 (30.7%) |
| 15 Years | 0 (0.0%) | 7 (33.3%) |
| 16 and 17 Years | 19 (30.6%) | 60 (57.1%) |
| 18 to 24 Years | 35 (17.8%) | 0 (0.0%) |
| 25 to 34 Years | 26 (10.7%) | 71 (24.9%) |
| 35 to 44 Years | 43 (15.5%) | 42 (17.9%) |
| 45 to 54 Years | 0 (0.0%) | 0 (0.0%) |
| 55 to 64 Years | 79 (50.6%) | 40 (33.1%) |
| 65 to 74 Years | 7 (5.4%) | 16 (8.0%) |
| 75 Years and over | 9 (7.1%) | 45 (43.7%) |
| Total | 414 (22.7%) | 399 (23.0%) |
Income Above Poverty by Sex and Age in Mount Pleasant
According to the poverty statistics in Mount Pleasant, males aged 5 years and females aged 18 to 24 years are the age groups that are most secure financially, with 100.0% of males and 100.0% of females in these age groups living above the poverty line.
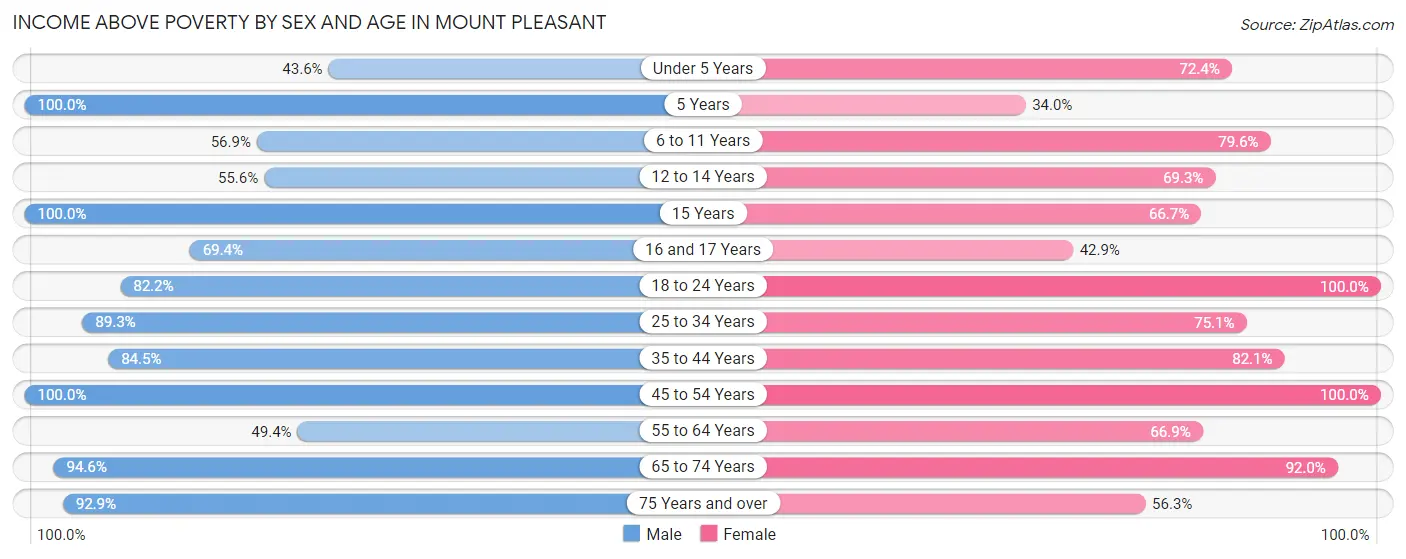
| Age Bracket | Male | Female |
| Under 5 Years | 58 (43.6%) | 89 (72.4%) |
| 5 Years | 32 (100.0%) | 16 (34.0%) |
| 6 to 11 Years | 107 (56.9%) | 70 (79.5%) |
| 12 to 14 Years | 50 (55.6%) | 79 (69.3%) |
| 15 Years | 25 (100.0%) | 14 (66.7%) |
| 16 and 17 Years | 43 (69.4%) | 45 (42.9%) |
| 18 to 24 Years | 162 (82.2%) | 152 (100.0%) |
| 25 to 34 Years | 216 (89.3%) | 214 (75.1%) |
| 35 to 44 Years | 234 (84.5%) | 193 (82.1%) |
| 45 to 54 Years | 163 (100.0%) | 138 (100.0%) |
| 55 to 64 Years | 77 (49.4%) | 81 (66.9%) |
| 65 to 74 Years | 123 (94.6%) | 185 (92.0%) |
| 75 Years and over | 118 (92.9%) | 58 (56.3%) |
| Total | 1,408 (77.3%) | 1,334 (77.0%) |
Income Below Poverty Among Married-Couple Families in Mount Pleasant
The poverty statistics for married-couple families in Mount Pleasant show that 8.8% or 66 of the total 751 families live below the poverty line. Families with 5 or more children have the highest poverty rate of 58.3%, comprising of 56 families. On the other hand, families with 3 or 4 children have the lowest poverty rate of 0.0%, which includes 0 families.
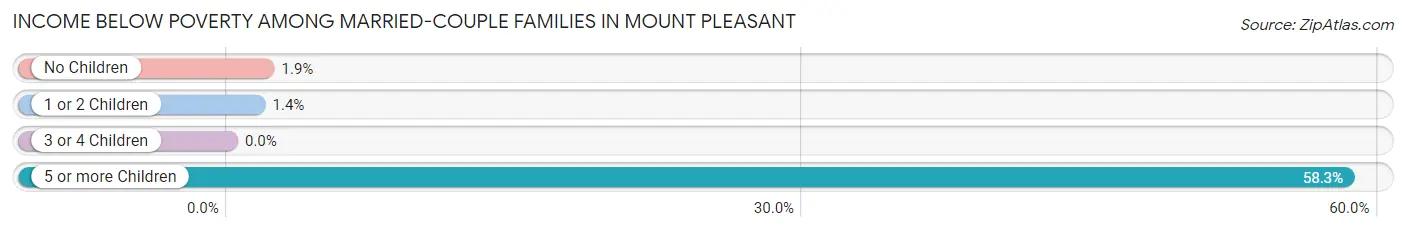
| Children | Above Poverty | Below Poverty |
| No Children | 360 (98.1%) | 7 (1.9%) |
| 1 or 2 Children | 206 (98.6%) | 3 (1.4%) |
| 3 or 4 Children | 79 (100.0%) | 0 (0.0%) |
| 5 or more Children | 40 (41.7%) | 56 (58.3%) |
| Total | 685 (91.2%) | 66 (8.8%) |
Income Below Poverty Among Single-Parent Households in Mount Pleasant
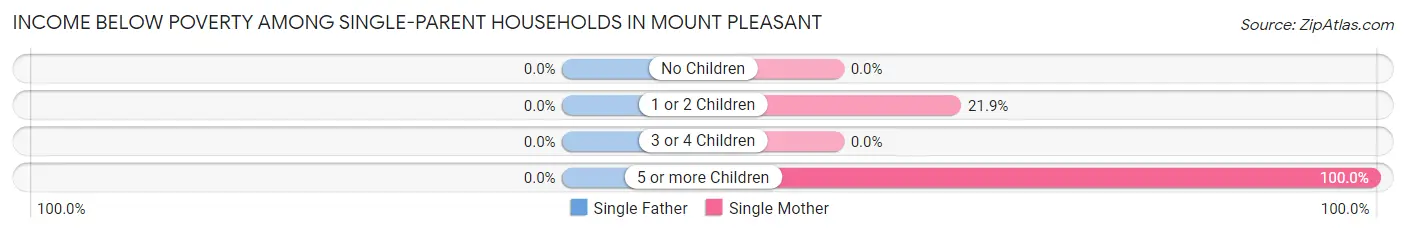
| Children | Single Father | Single Mother |
| No Children | 0 (0.0%) | 0 (0.0%) |
| 1 or 2 Children | 0 (0.0%) | 7 (21.9%) |
| 3 or 4 Children | 0 (0.0%) | 0 (0.0%) |
| 5 or more Children | 0 (0.0%) | 24 (100.0%) |
| Total | 0 (0.0%) | 31 (38.3%) |
Income Below Poverty Among Married-Couple vs Single-Parent Households in Mount Pleasant
The poverty data for Mount Pleasant shows that 66 of the married-couple family households (8.8%) and 31 of the single-parent households (22.5%) are living below the poverty level. Within the married-couple family households, those with 5 or more children have the highest poverty rate, with 56 households (58.3%) falling below the poverty line. Among the single-parent households, those with 5 or more children have the highest poverty rate, with 24 household (100.0%) living below poverty.
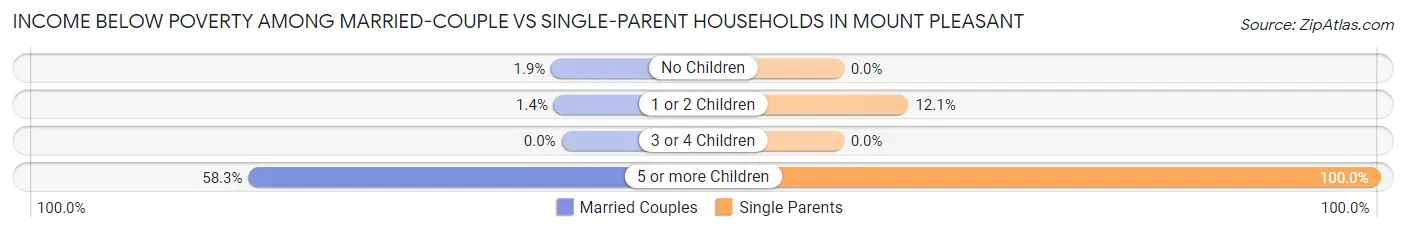
| Children | Married-Couple Families | Single-Parent Households |
| No Children | 7 (1.9%) | 0 (0.0%) |
| 1 or 2 Children | 3 (1.4%) | 7 (12.1%) |
| 3 or 4 Children | 0 (0.0%) | 0 (0.0%) |
| 5 or more Children | 56 (58.3%) | 24 (100.0%) |
| Total | 66 (8.8%) | 31 (22.5%) |
Race in Mount Pleasant
The most populous races in Mount Pleasant are White / Caucasian (3,286 | 89.4%), Two or more Races (208 | 5.7%), and Hispanic or Latino (128 | 3.5%).
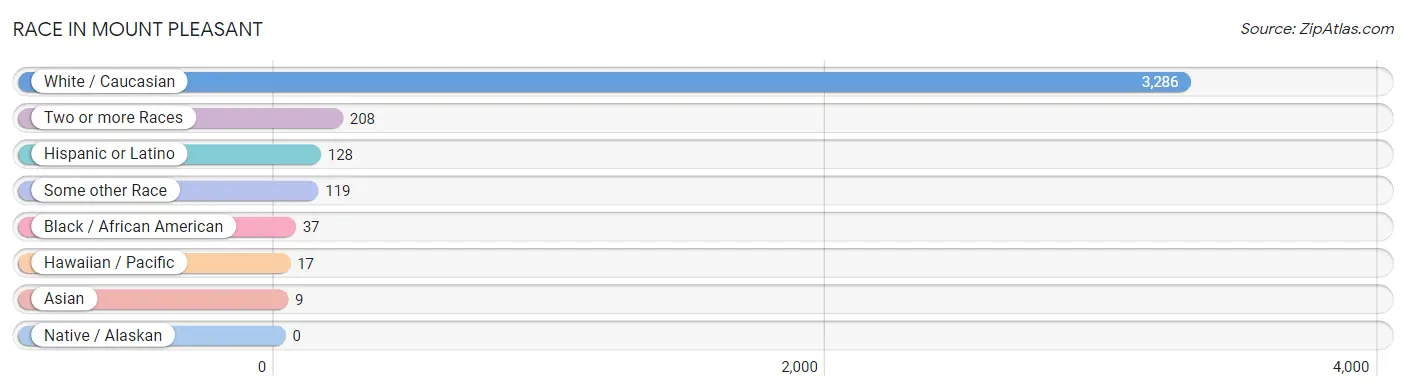
| Race | # Population | % Population |
| Asian | 9 | 0.2% |
| Black / African American | 37 | 1.0% |
| Hawaiian / Pacific | 17 | 0.5% |
| Hispanic or Latino | 128 | 3.5% |
| Native / Alaskan | 0 | 0.0% |
| White / Caucasian | 3,286 | 89.4% |
| Two or more Races | 208 | 5.7% |
| Some other Race | 119 | 3.2% |
| Total | 3,676 | 100.0% |
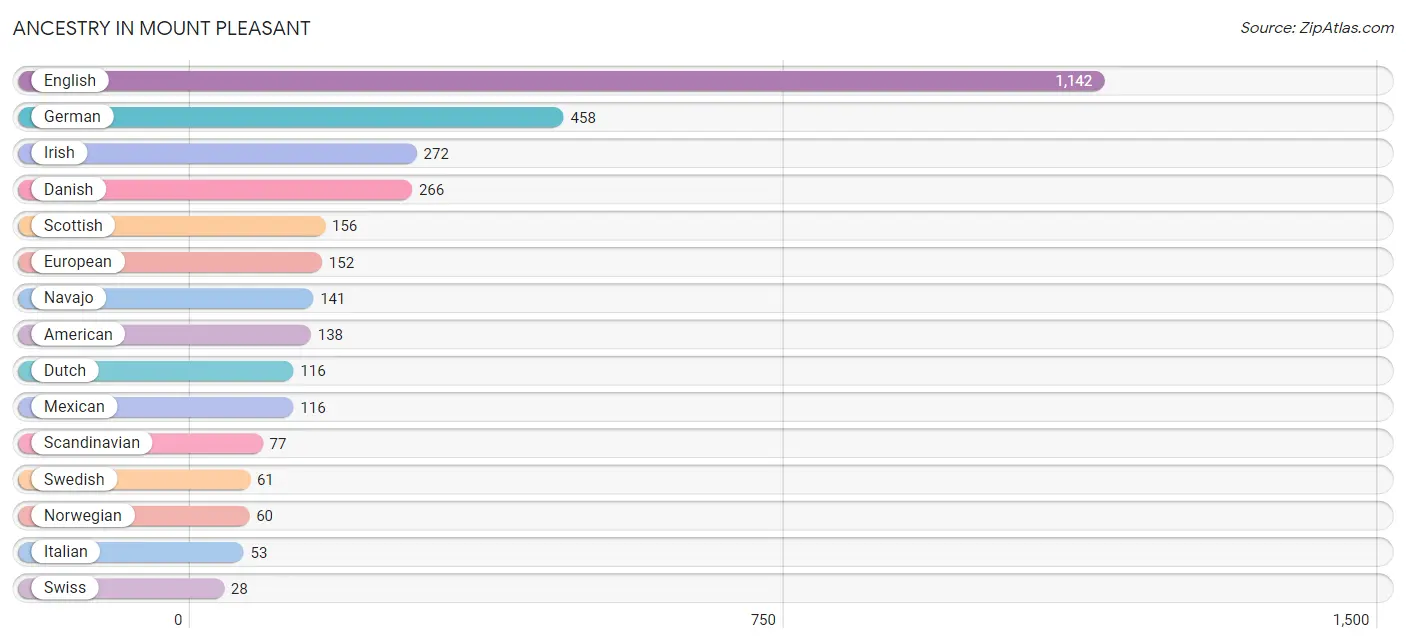
Ancestry in Mount Pleasant
The most populous ancestries reported in Mount Pleasant are English (1,142 | 31.1%), German (458 | 12.5%), Irish (272 | 7.4%), Danish (266 | 7.2%), and Scottish (156 | 4.2%), together accounting for 62.4% of all Mount Pleasant residents.
| Ancestry | # Population | % Population |
| African | 7 | 0.2% |
| American | 138 | 3.7% |
| Australian | 2 | 0.1% |
| Austrian | 7 | 0.2% |
| Bhutanese | 11 | 0.3% |
| Brazilian | 10 | 0.3% |
| British | 11 | 0.3% |
| Canadian | 7 | 0.2% |
| Central American | 2 | 0.1% |
| Danish | 266 | 7.2% |
| Dominican | 2 | 0.1% |
| Dutch | 116 | 3.2% |
| English | 1,142 | 31.1% |
| European | 152 | 4.1% |
| French | 11 | 0.3% |
| German | 458 | 12.5% |
| Hungarian | 22 | 0.6% |
| Irish | 272 | 7.4% |
| Italian | 53 | 1.4% |
| Mexican | 116 | 3.2% |
| Native Hawaiian | 11 | 0.3% |
| Navajo | 141 | 3.8% |
| Northern European | 10 | 0.3% |
| Norwegian | 60 | 1.6% |
| Portuguese | 8 | 0.2% |
| Salvadoran | 2 | 0.1% |
| Samoan | 6 | 0.2% |
| Scandinavian | 77 | 2.1% |
| Scotch-Irish | 24 | 0.6% |
| Scottish | 156 | 4.2% |
| Spanish | 8 | 0.2% |
| Subsaharan African | 7 | 0.2% |
| Swedish | 61 | 1.7% |
| Swiss | 28 | 0.8% |
| Tongan | 16 | 0.4% |
| Welsh | 25 | 0.7% | View All 36 Rows |
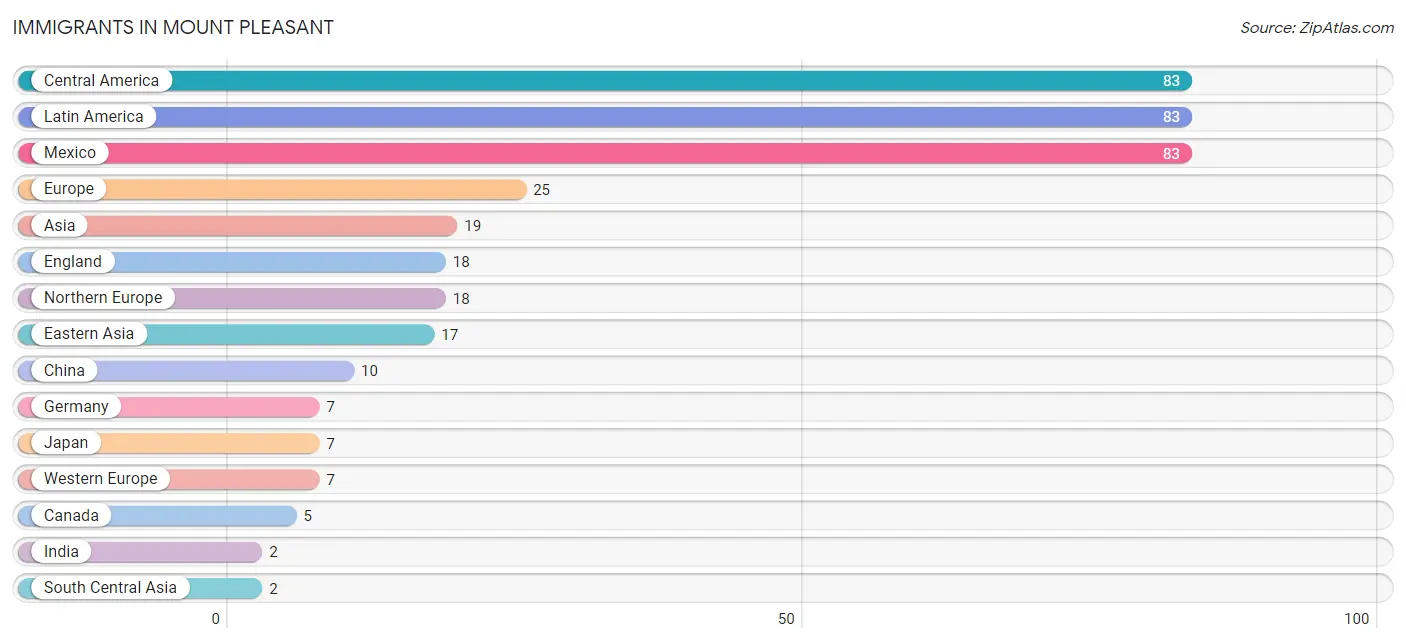
Immigrants in Mount Pleasant
The most numerous immigrant groups reported in Mount Pleasant came from Central America (83 | 2.3%), Latin America (83 | 2.3%), Mexico (83 | 2.3%), Europe (25 | 0.7%), and Asia (19 | 0.5%), together accounting for 8.0% of all Mount Pleasant residents.
| Immigration Origin | # Population | % Population |
| Asia | 19 | 0.5% |
| Canada | 5 | 0.1% |
| Central America | 83 | 2.3% |
| China | 10 | 0.3% |
| Eastern Asia | 17 | 0.5% |
| England | 18 | 0.5% |
| Europe | 25 | 0.7% |
| Germany | 7 | 0.2% |
| India | 2 | 0.1% |
| Japan | 7 | 0.2% |
| Latin America | 83 | 2.3% |
| Mexico | 83 | 2.3% |
| Northern Europe | 18 | 0.5% |
| South Central Asia | 2 | 0.1% |
| Western Europe | 7 | 0.2% | View All 15 Rows |
Sex and Age in Mount Pleasant
Sex and Age in Mount Pleasant
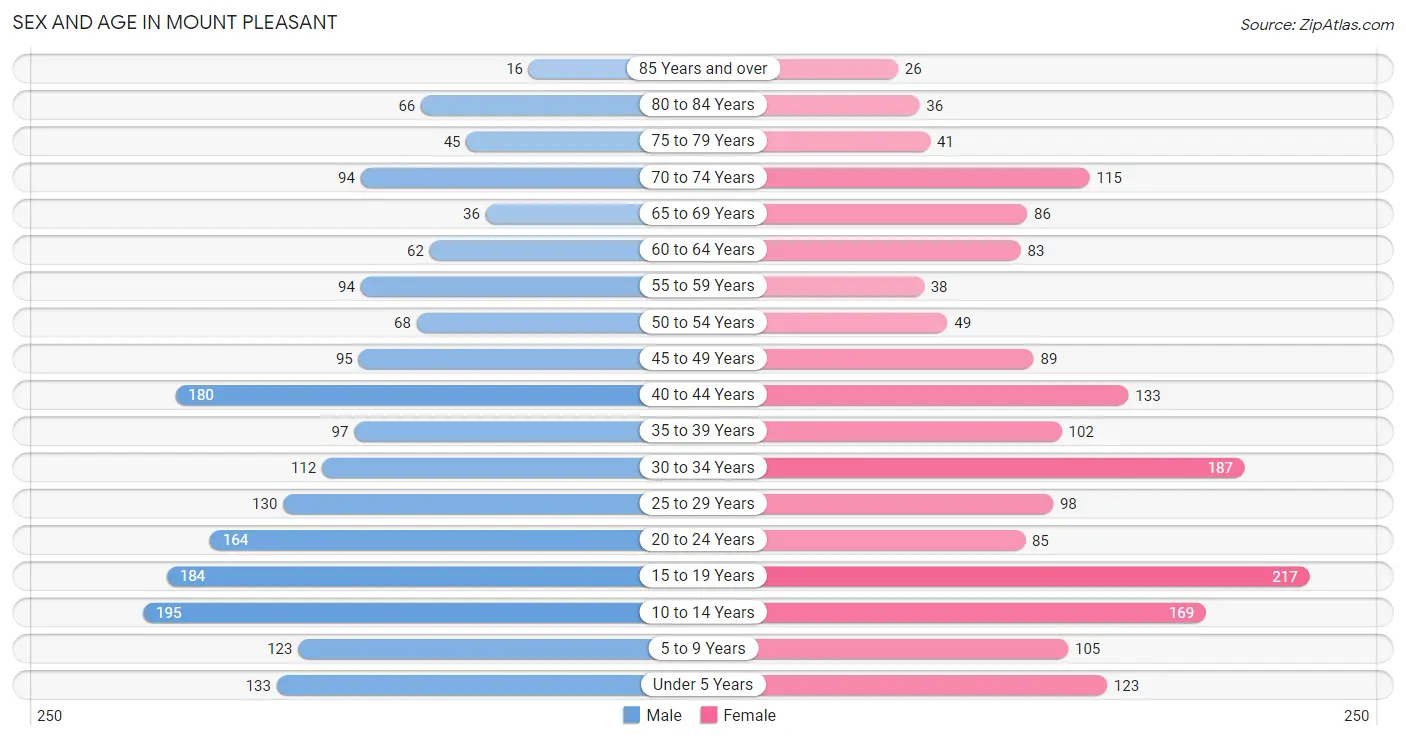
The most populous age groups in Mount Pleasant are 10 to 14 Years (195 | 10.3%) for men and 15 to 19 Years (217 | 12.2%) for women.
| Age Bracket | Male | Female |
| Under 5 Years | 133 (7.0%) | 123 (6.9%) |
| 5 to 9 Years | 123 (6.5%) | 105 (5.9%) |
| 10 to 14 Years | 195 (10.3%) | 169 (9.5%) |
| 15 to 19 Years | 184 (9.7%) | 217 (12.2%) |
| 20 to 24 Years | 164 (8.7%) | 85 (4.8%) |
| 25 to 29 Years | 130 (6.9%) | 98 (5.5%) |
| 30 to 34 Years | 112 (5.9%) | 187 (10.5%) |
| 35 to 39 Years | 97 (5.1%) | 102 (5.7%) |
| 40 to 44 Years | 180 (9.5%) | 133 (7.5%) |
| 45 to 49 Years | 95 (5.0%) | 89 (5.0%) |
| 50 to 54 Years | 68 (3.6%) | 49 (2.8%) |
| 55 to 59 Years | 94 (5.0%) | 38 (2.1%) |
| 60 to 64 Years | 62 (3.3%) | 83 (4.7%) |
| 65 to 69 Years | 36 (1.9%) | 86 (4.8%) |
| 70 to 74 Years | 94 (5.0%) | 115 (6.5%) |
| 75 to 79 Years | 45 (2.4%) | 41 (2.3%) |
| 80 to 84 Years | 66 (3.5%) | 36 (2.0%) |
| 85 Years and over | 16 (0.8%) | 26 (1.5%) |
| Total | 1,894 (100.0%) | 1,782 (100.0%) |
Families and Households in Mount Pleasant
Median Family Size in Mount Pleasant
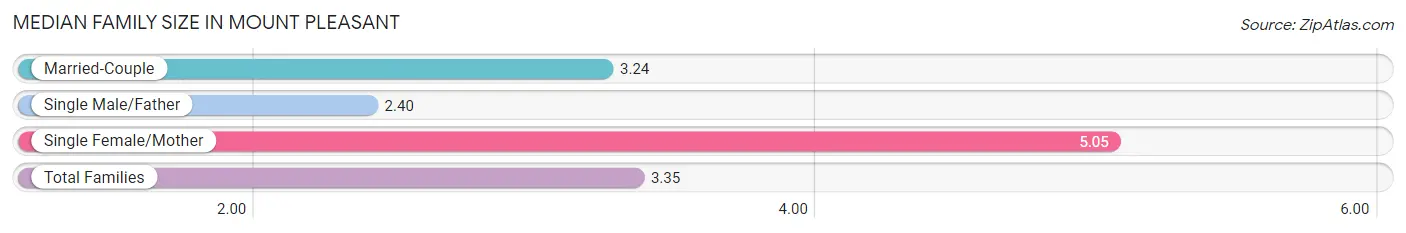
The median family size in Mount Pleasant is 3.35 persons per family, with single female/mother families (81 | 9.1%) accounting for the largest median family size of 5.05 persons per family. On the other hand, single male/father families (57 | 6.4%) represent the smallest median family size with 2.40 persons per family.
| Family Type | # Families | Family Size |
| Married-Couple | 751 (84.5%) | 3.24 |
| Single Male/Father | 57 (6.4%) | 2.40 |
| Single Female/Mother | 81 (9.1%) | 5.05 |
| Total Families | 889 (100.0%) | 3.35 |
Median Household Size in Mount Pleasant
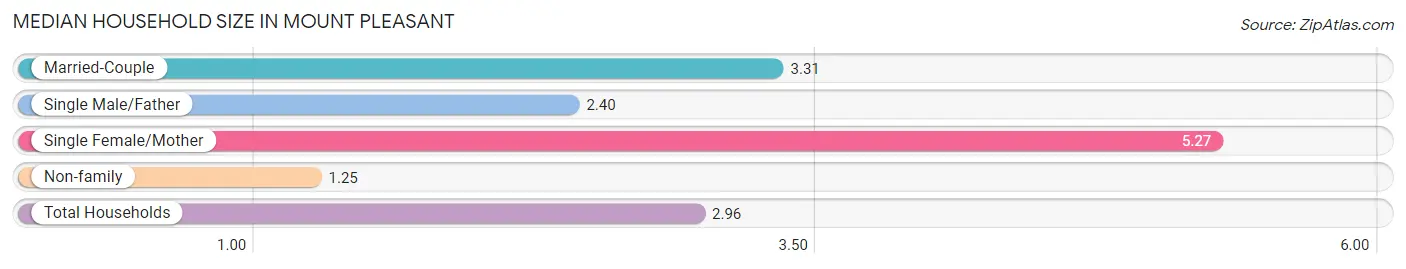
The median household size in Mount Pleasant is 2.96 persons per household, with single female/mother households (81 | 7.1%) accounting for the largest median household size of 5.27 persons per household. non-family households (244 | 21.5%) represent the smallest median household size with 1.25 persons per household.
| Household Type | # Households | Household Size |
| Married-Couple | 751 (66.3%) | 3.31 |
| Single Male/Father | 57 (5.0%) | 2.40 |
| Single Female/Mother | 81 (7.1%) | 5.27 |
| Non-family | 244 (21.5%) | 1.25 |
| Total Households | 1,133 (100.0%) | 2.96 |
Household Size by Marriage Status in Mount Pleasant
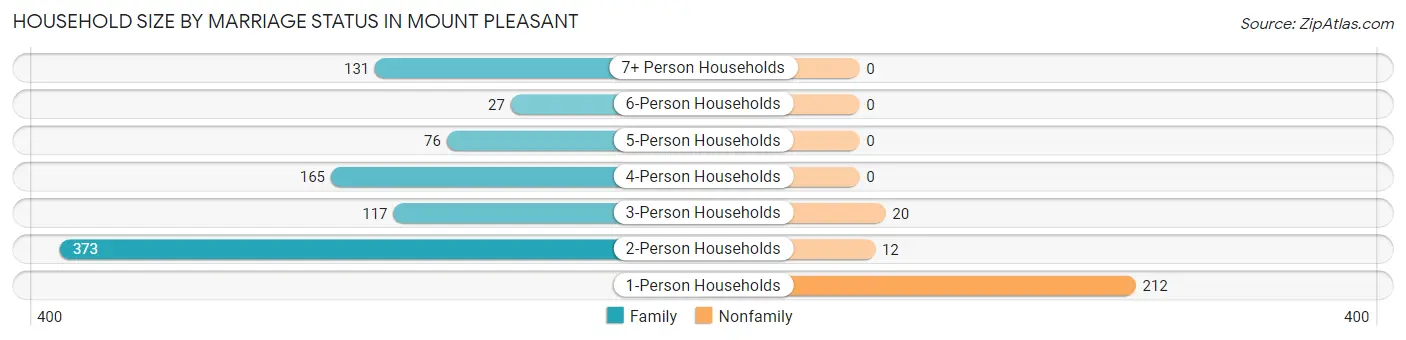
Out of a total of 1,133 households in Mount Pleasant, 889 (78.5%) are family households, while 244 (21.5%) are nonfamily households. The most numerous type of family households are 2-person households, comprising 373, and the most common type of nonfamily households are 1-person households, comprising 212.
| Household Size | Family Households | Nonfamily Households |
| 1-Person Households | - | 212 (18.7%) |
| 2-Person Households | 373 (32.9%) | 12 (1.1%) |
| 3-Person Households | 117 (10.3%) | 20 (1.8%) |
| 4-Person Households | 165 (14.6%) | 0 (0.0%) |
| 5-Person Households | 76 (6.7%) | 0 (0.0%) |
| 6-Person Households | 27 (2.4%) | 0 (0.0%) |
| 7+ Person Households | 131 (11.6%) | 0 (0.0%) |
| Total | 889 (78.5%) | 244 (21.5%) |
Female Fertility in Mount Pleasant
Fertility by Age in Mount Pleasant
Average fertility rate in Mount Pleasant is 138.0 births per 1,000 women. Women in the age bracket of 20 to 34 years have the highest fertility rate with 222.0 births per 1,000 women. Women in the age bracket of 20 to 34 years acount for 65.1% of all women with births.
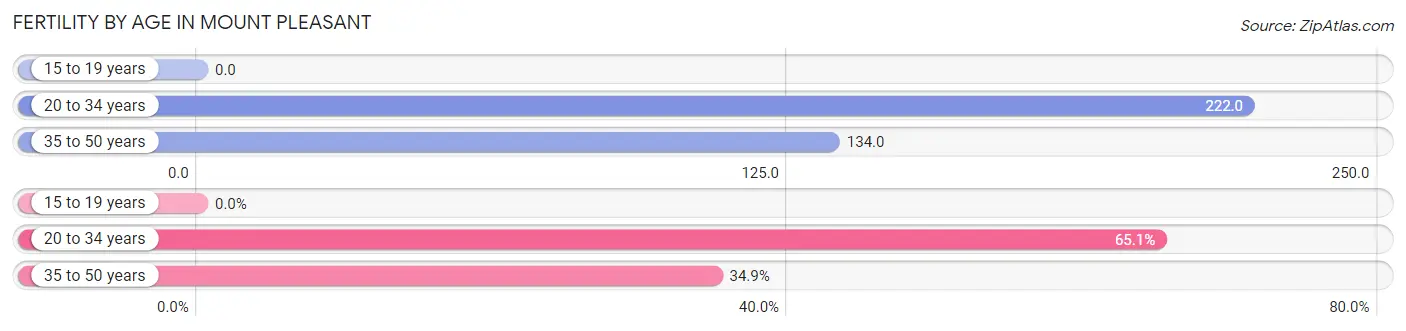
| Age Bracket | Women with Births | Births / 1,000 Women |
| 15 to 19 years | 0 (0.0%) | 0.0 |
| 20 to 34 years | 82 (65.1%) | 222.0 |
| 35 to 50 years | 44 (34.9%) | 134.0 |
| Total | 126 (100.0%) | 138.0 |
Fertility by Age by Marriage Status in Mount Pleasant
77.0% of women with births (126) in Mount Pleasant are married. The highest percentage of unmarried women with births falls into 35 to 50 years age bracket with 65.9% of them unmarried at the time of birth, while the lowest percentage of unmarried women with births belong to 20 to 34 years age bracket with 0.0% of them unmarried.
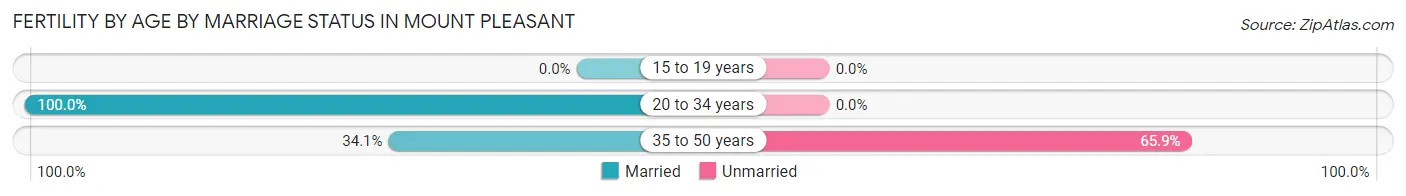
| Age Bracket | Married | Unmarried |
| 15 to 19 years | 0 (0.0%) | 0 (0.0%) |
| 20 to 34 years | 82 (100.0%) | 0 (0.0%) |
| 35 to 50 years | 15 (34.1%) | 29 (65.9%) |
| Total | 97 (77.0%) | 29 (23.0%) |
Fertility by Education in Mount Pleasant
Average fertility rate in Mount Pleasant is 138.0 births per 1,000 women. Women with the education attainment of bachelor's degree have the highest fertility rate of 213.0 births per 1,000 women, while women with the education attainment of graduate degree have the lowest fertility at 18.0 births per 1,000 women. Women with the education attainment of college or associate's degree represent 41.3% of all women with births.
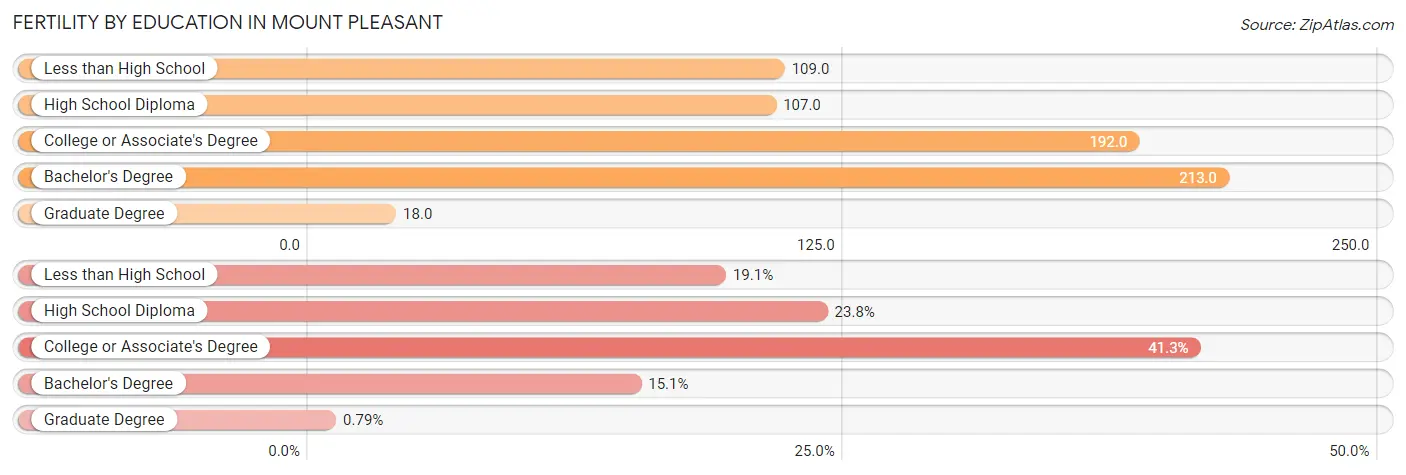
| Educational Attainment | Women with Births | Births / 1,000 Women |
| Less than High School | 24 (19.1%) | 109.0 |
| High School Diploma | 30 (23.8%) | 107.0 |
| College or Associate's Degree | 52 (41.3%) | 192.0 |
| Bachelor's Degree | 19 (15.1%) | 213.0 |
| Graduate Degree | 1 (0.8%) | 18.0 |
| Total | 126 (100.0%) | 138.0 |
Fertility by Education by Marriage Status in Mount Pleasant
23.0% of women with births in Mount Pleasant are unmarried. Women with the educational attainment of high school diploma are most likely to be married with 100.0% of them married at childbirth, while women with the educational attainment of less than high school are least likely to be married with 100.0% of them unmarried at childbirth.
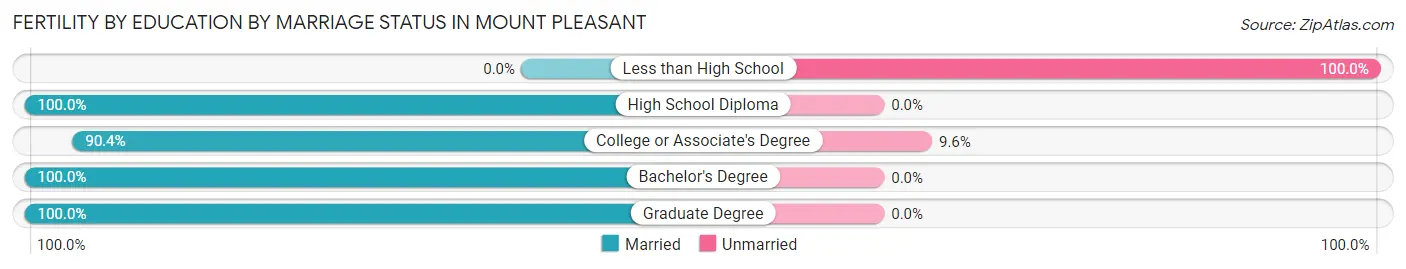
| Educational Attainment | Married | Unmarried |
| Less than High School | 0 (0.0%) | 24 (100.0%) |
| High School Diploma | 30 (100.0%) | 0 (0.0%) |
| College or Associate's Degree | 47 (90.4%) | 5 (9.6%) |
| Bachelor's Degree | 19 (100.0%) | 0 (0.0%) |
| Graduate Degree | 1 (100.0%) | 0 (0.0%) |
| Total | 97 (77.0%) | 29 (23.0%) |
Employment Characteristics in Mount Pleasant
Employment by Class of Employer in Mount Pleasant
Among the 1,623 employed individuals in Mount Pleasant, private company employees (1,102 | 67.9%), self-employed (not incorporated) (135 | 8.3%), and state government employees (129 | 8.0%) make up the most common classes of employment.
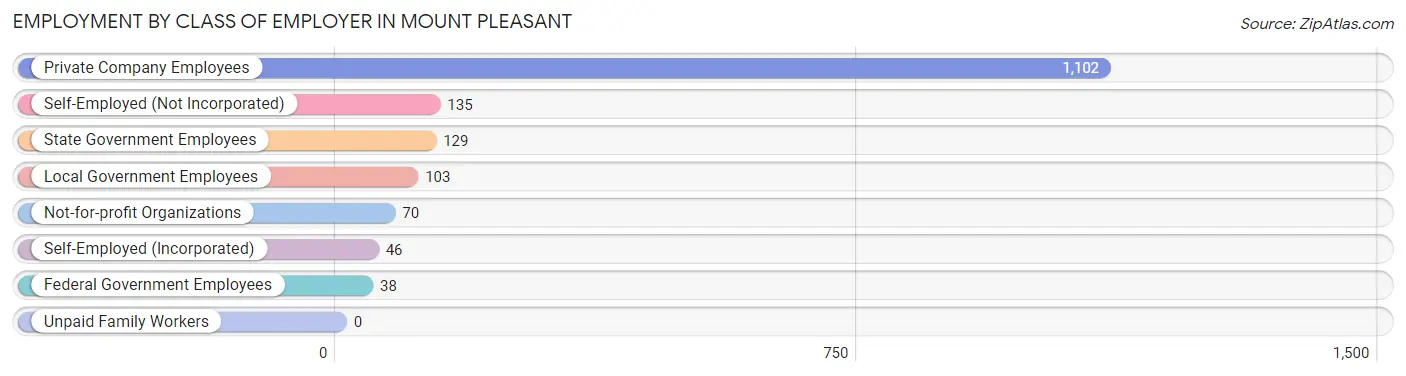
| Employer Class | # Employees | % Employees |
| Private Company Employees | 1,102 | 67.9% |
| Self-Employed (Incorporated) | 46 | 2.8% |
| Self-Employed (Not Incorporated) | 135 | 8.3% |
| Not-for-profit Organizations | 70 | 4.3% |
| Local Government Employees | 103 | 6.4% |
| State Government Employees | 129 | 8.0% |
| Federal Government Employees | 38 | 2.3% |
| Unpaid Family Workers | 0 | 0.0% |
| Total | 1,623 | 100.0% |
Employment Status by Age in Mount Pleasant
According to the labor force statistics for Mount Pleasant, out of the total population over 16 years of age (2,782), 62.2% or 1,730 individuals are in the labor force, with 4.3% or 74 of them unemployed. The age group with the highest labor force participation rate is 45 to 54 years, with 91.0% or 274 individuals in the labor force. Within the labor force, the 16 to 19 years age range has the highest percentage of unemployed individuals, with 29.6% or 48 of them being unemployed.
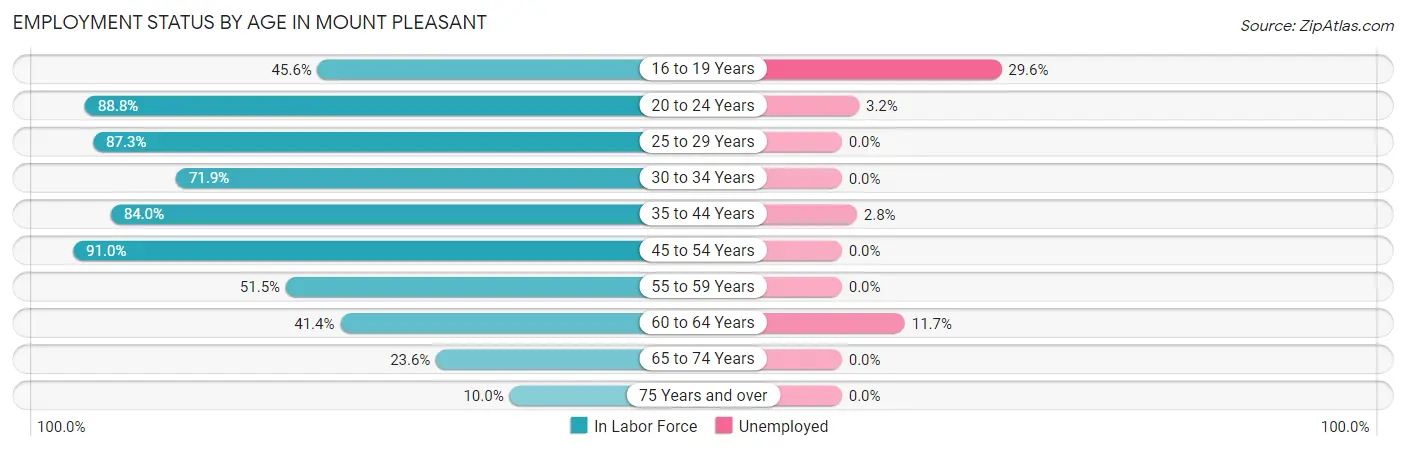
| Age Bracket | In Labor Force | Unemployed |
| 16 to 19 Years | 162 (45.6%) | 48 (29.6%) |
| 20 to 24 Years | 221 (88.8%) | 7 (3.2%) |
| 25 to 29 Years | 199 (87.3%) | 0 (0.0%) |
| 30 to 34 Years | 215 (71.9%) | 0 (0.0%) |
| 35 to 44 Years | 430 (84.0%) | 12 (2.8%) |
| 45 to 54 Years | 274 (91.0%) | 0 (0.0%) |
| 55 to 59 Years | 68 (51.5%) | 0 (0.0%) |
| 60 to 64 Years | 60 (41.4%) | 7 (11.7%) |
| 65 to 74 Years | 78 (23.6%) | 0 (0.0%) |
| 75 Years and over | 23 (10.0%) | 0 (0.0%) |
| Total | 1,730 (62.2%) | 74 (4.3%) |
Employment Status by Educational Attainment in Mount Pleasant
According to labor force statistics for Mount Pleasant, 77.1% of individuals (1,247) out of the total population between 25 and 64 years of age (1,617) are in the labor force, with 1.5% or 19 of them being unemployed. The group with the highest labor force participation rate are those with the educational attainment of bachelor's degree or higher, with 88.1% or 303 individuals in the labor force. Within the labor force, individuals with college / associate degree education have the highest percentage of unemployment, with 5.0% or 19 of them being unemployed.
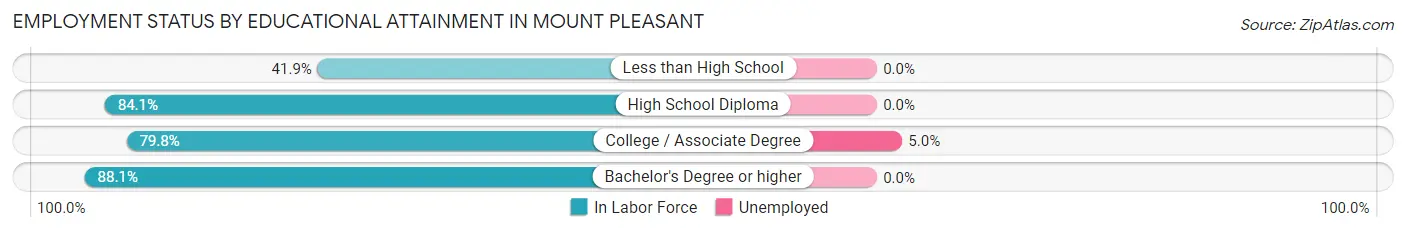
| Educational Attainment | In Labor Force | Unemployed |
| Less than High School | 106 (41.9%) | 0 (0.0%) |
| High School Diploma | 454 (84.1%) | 0 (0.0%) |
| College / Associate Degree | 383 (79.8%) | 24 (5.0%) |
| Bachelor's Degree or higher | 303 (88.1%) | 0 (0.0%) |
| Total | 1,247 (77.1%) | 24 (1.5%) |
Employment Occupations by Sex in Mount Pleasant
Management, Business, Science and Arts Occupations
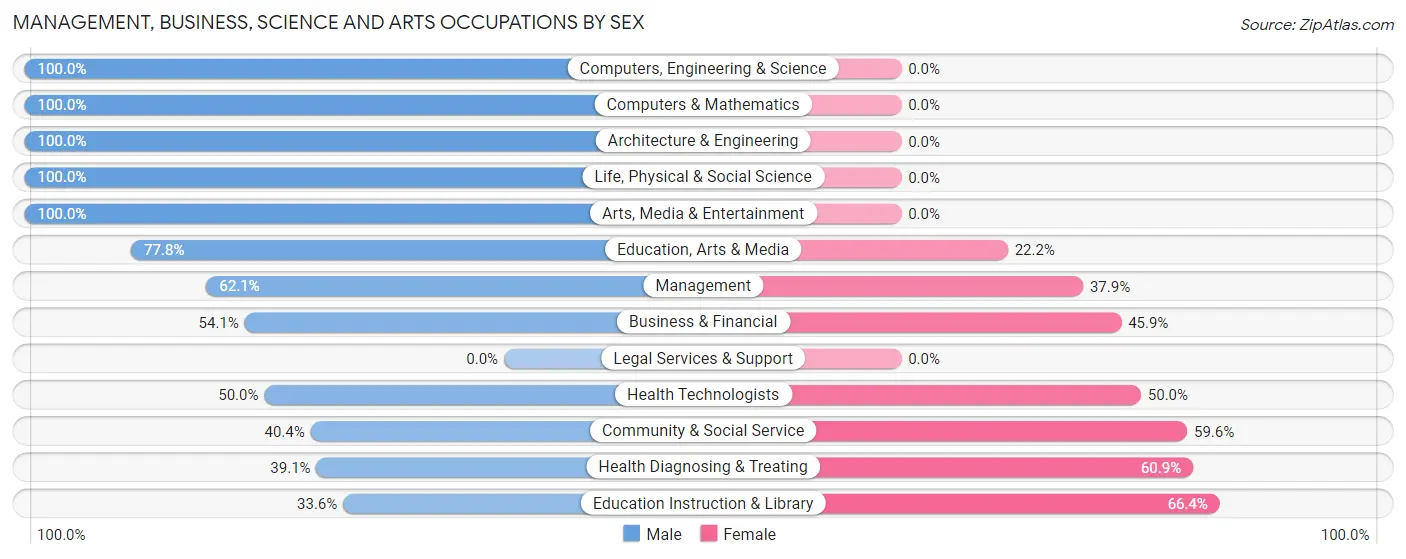
The most common Management, Business, Science and Arts occupations in Mount Pleasant are Management (174 | 10.5%), Community & Social Service (166 | 10.0%), Education Instruction & Library (146 | 8.8%), Health Diagnosing & Treating (69 | 4.2%), and Business & Financial (61 | 3.7%).
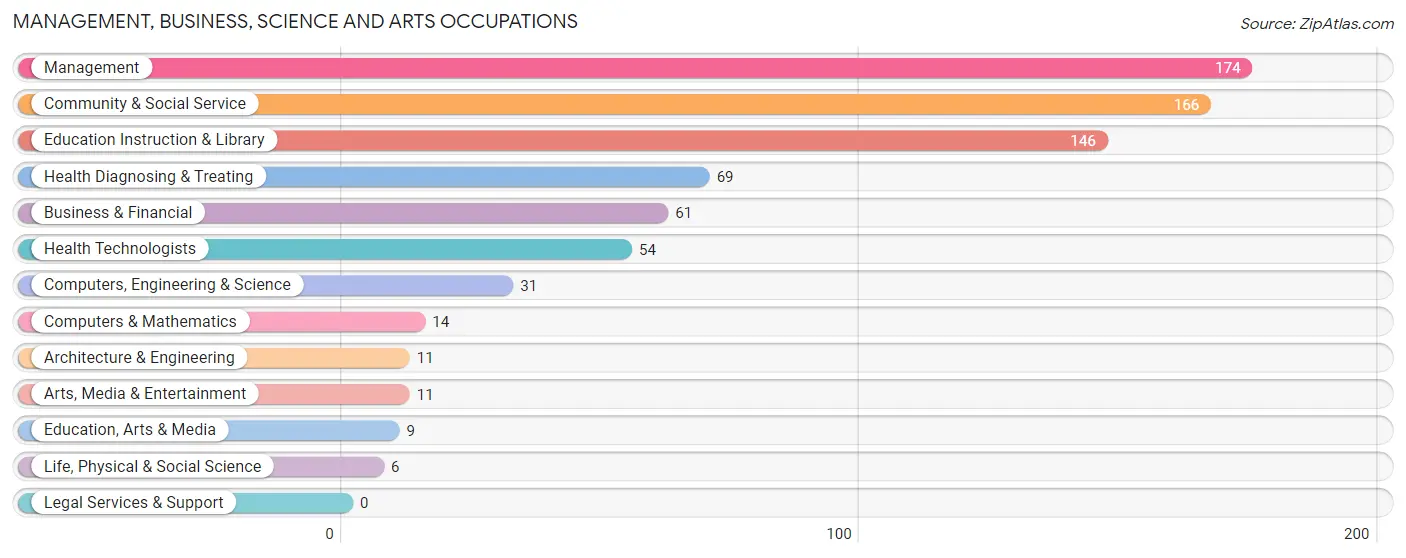
Management, Business, Science and Arts Occupations by Sex
Within the Management, Business, Science and Arts occupations in Mount Pleasant, the most male-oriented occupations are Computers, Engineering & Science (100.0%), Computers & Mathematics (100.0%), and Architecture & Engineering (100.0%), while the most female-oriented occupations are Education Instruction & Library (66.4%), Health Diagnosing & Treating (60.9%), and Community & Social Service (59.6%).
| Occupation | Male | Female |
| Management | 108 (62.1%) | 66 (37.9%) |
| Business & Financial | 33 (54.1%) | 28 (45.9%) |
| Computers, Engineering & Science | 31 (100.0%) | 0 (0.0%) |
| Computers & Mathematics | 14 (100.0%) | 0 (0.0%) |
| Architecture & Engineering | 11 (100.0%) | 0 (0.0%) |
| Life, Physical & Social Science | 6 (100.0%) | 0 (0.0%) |
| Community & Social Service | 67 (40.4%) | 99 (59.6%) |
| Education, Arts & Media | 7 (77.8%) | 2 (22.2%) |
| Legal Services & Support | 0 (0.0%) | 0 (0.0%) |
| Education Instruction & Library | 49 (33.6%) | 97 (66.4%) |
| Arts, Media & Entertainment | 11 (100.0%) | 0 (0.0%) |
| Health Diagnosing & Treating | 27 (39.1%) | 42 (60.9%) |
| Health Technologists | 27 (50.0%) | 27 (50.0%) |
| Total (Category) | 266 (53.1%) | 235 (46.9%) |
| Total (Overall) | 1,006 (60.8%) | 650 (39.3%) |
Services Occupations
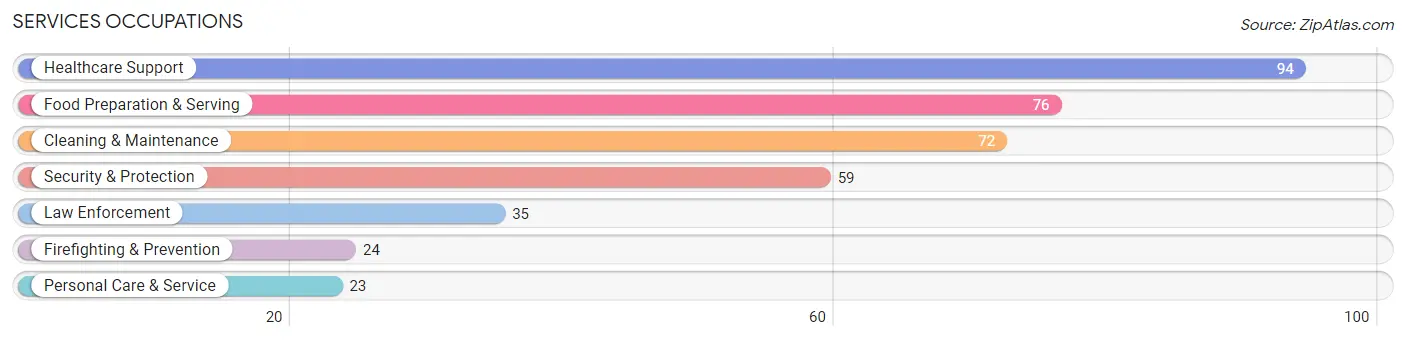
The most common Services occupations in Mount Pleasant are Healthcare Support (94 | 5.7%), Food Preparation & Serving (76 | 4.6%), Cleaning & Maintenance (72 | 4.3%), Security & Protection (59 | 3.6%), and Law Enforcement (35 | 2.1%).
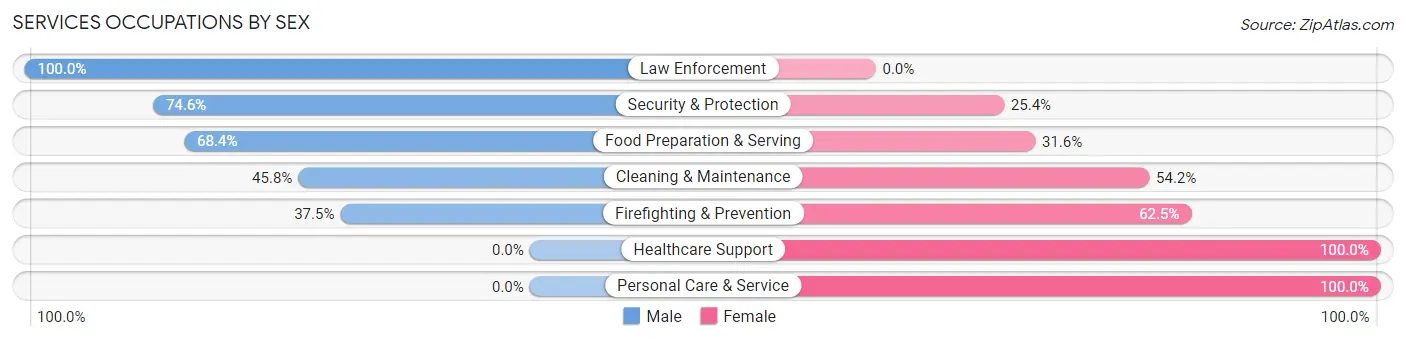
Services Occupations by Sex
Within the Services occupations in Mount Pleasant, the most male-oriented occupations are Law Enforcement (100.0%), Security & Protection (74.6%), and Food Preparation & Serving (68.4%), while the most female-oriented occupations are Healthcare Support (100.0%), Personal Care & Service (100.0%), and Firefighting & Prevention (62.5%).
| Occupation | Male | Female |
| Healthcare Support | 0 (0.0%) | 94 (100.0%) |
| Security & Protection | 44 (74.6%) | 15 (25.4%) |
| Firefighting & Prevention | 9 (37.5%) | 15 (62.5%) |
| Law Enforcement | 35 (100.0%) | 0 (0.0%) |
| Food Preparation & Serving | 52 (68.4%) | 24 (31.6%) |
| Cleaning & Maintenance | 33 (45.8%) | 39 (54.2%) |
| Personal Care & Service | 0 (0.0%) | 23 (100.0%) |
| Total (Category) | 129 (39.8%) | 195 (60.2%) |
| Total (Overall) | 1,006 (60.8%) | 650 (39.3%) |
Sales and Office Occupations
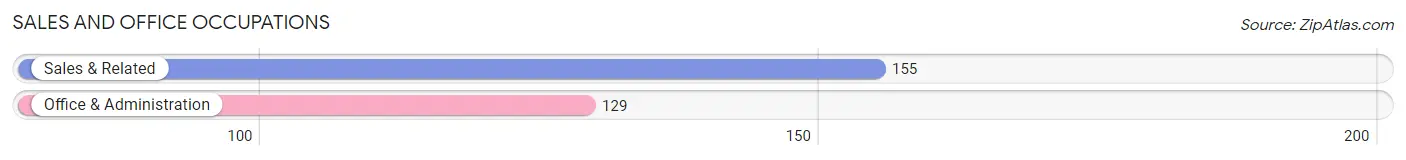
The most common Sales and Office occupations in Mount Pleasant are Sales & Related (155 | 9.4%), and Office & Administration (129 | 7.8%).
Sales and Office Occupations by Sex
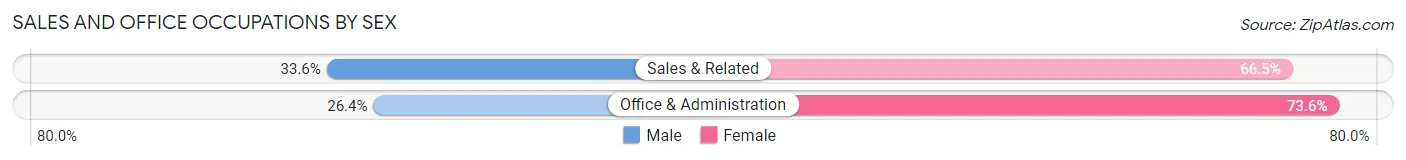
| Occupation | Male | Female |
| Sales & Related | 52 (33.6%) | 103 (66.4%) |
| Office & Administration | 34 (26.4%) | 95 (73.6%) |
| Total (Category) | 86 (30.3%) | 198 (69.7%) |
| Total (Overall) | 1,006 (60.8%) | 650 (39.3%) |
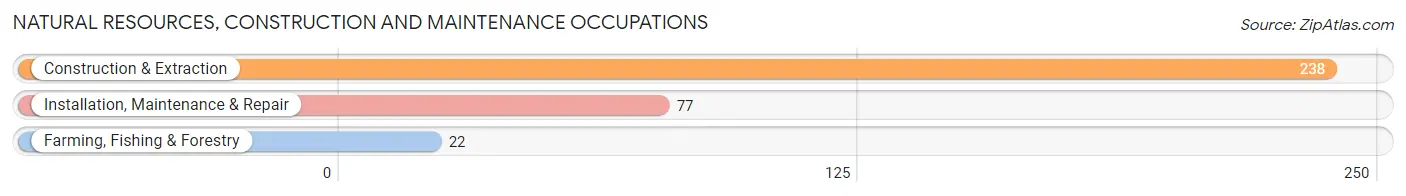
Natural Resources, Construction and Maintenance Occupations
The most common Natural Resources, Construction and Maintenance occupations in Mount Pleasant are Construction & Extraction (238 | 14.4%), Installation, Maintenance & Repair (77 | 4.6%), and Farming, Fishing & Forestry (22 | 1.3%).
Natural Resources, Construction and Maintenance Occupations by Sex
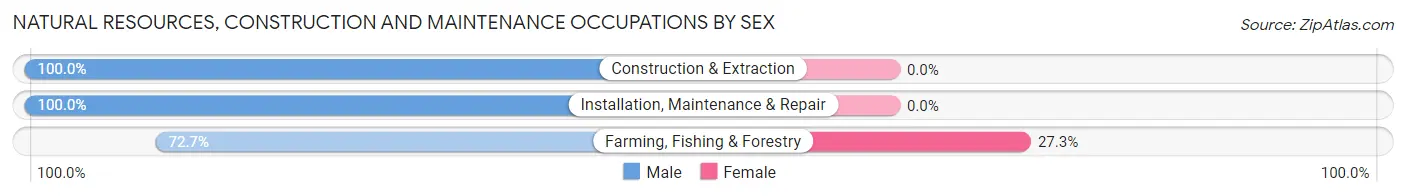
| Occupation | Male | Female |
| Farming, Fishing & Forestry | 16 (72.7%) | 6 (27.3%) |
| Construction & Extraction | 238 (100.0%) | 0 (0.0%) |
| Installation, Maintenance & Repair | 77 (100.0%) | 0 (0.0%) |
| Total (Category) | 331 (98.2%) | 6 (1.8%) |
| Total (Overall) | 1,006 (60.8%) | 650 (39.3%) |
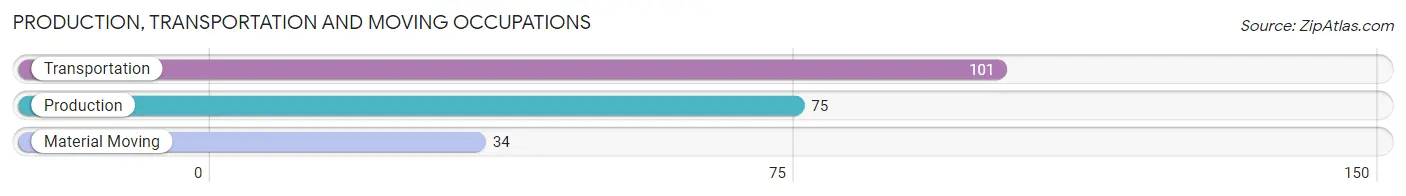
Production, Transportation and Moving Occupations
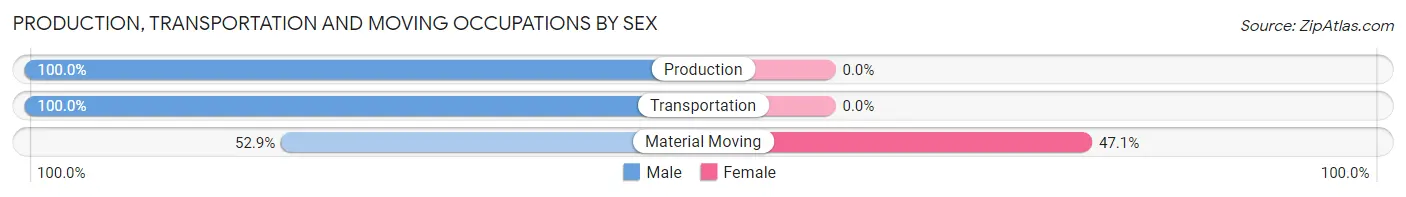
The most common Production, Transportation and Moving occupations in Mount Pleasant are Transportation (101 | 6.1%), Production (75 | 4.5%), and Material Moving (34 | 2.1%).
Production, Transportation and Moving Occupations by Sex
| Occupation | Male | Female |
| Production | 75 (100.0%) | 0 (0.0%) |
| Transportation | 101 (100.0%) | 0 (0.0%) |
| Material Moving | 18 (52.9%) | 16 (47.1%) |
| Total (Category) | 194 (92.4%) | 16 (7.6%) |
| Total (Overall) | 1,006 (60.8%) | 650 (39.3%) |
Employment Industries by Sex in Mount Pleasant
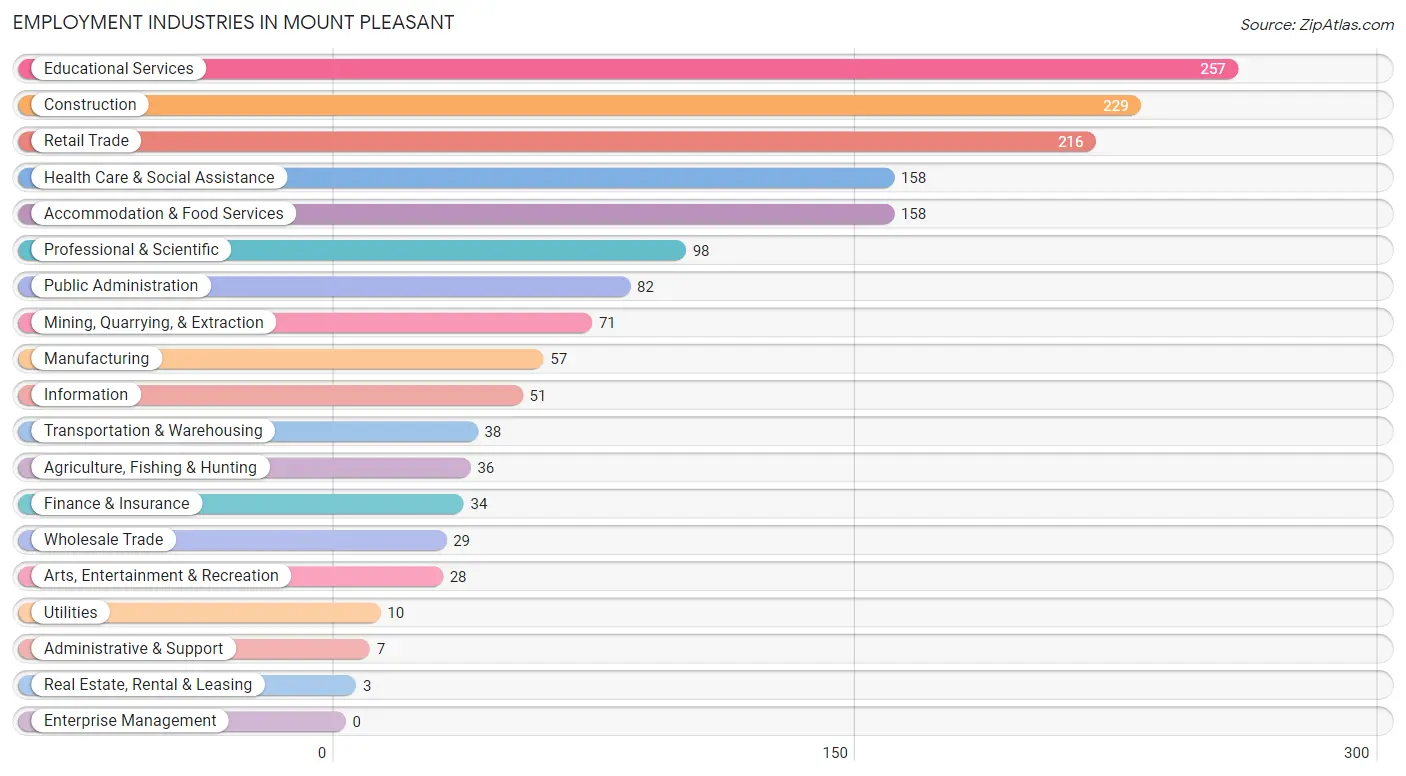
Employment Industries in Mount Pleasant
The major employment industries in Mount Pleasant include Educational Services (257 | 15.5%), Construction (229 | 13.8%), Retail Trade (216 | 13.0%), Health Care & Social Assistance (158 | 9.5%), and Accommodation & Food Services (158 | 9.5%).
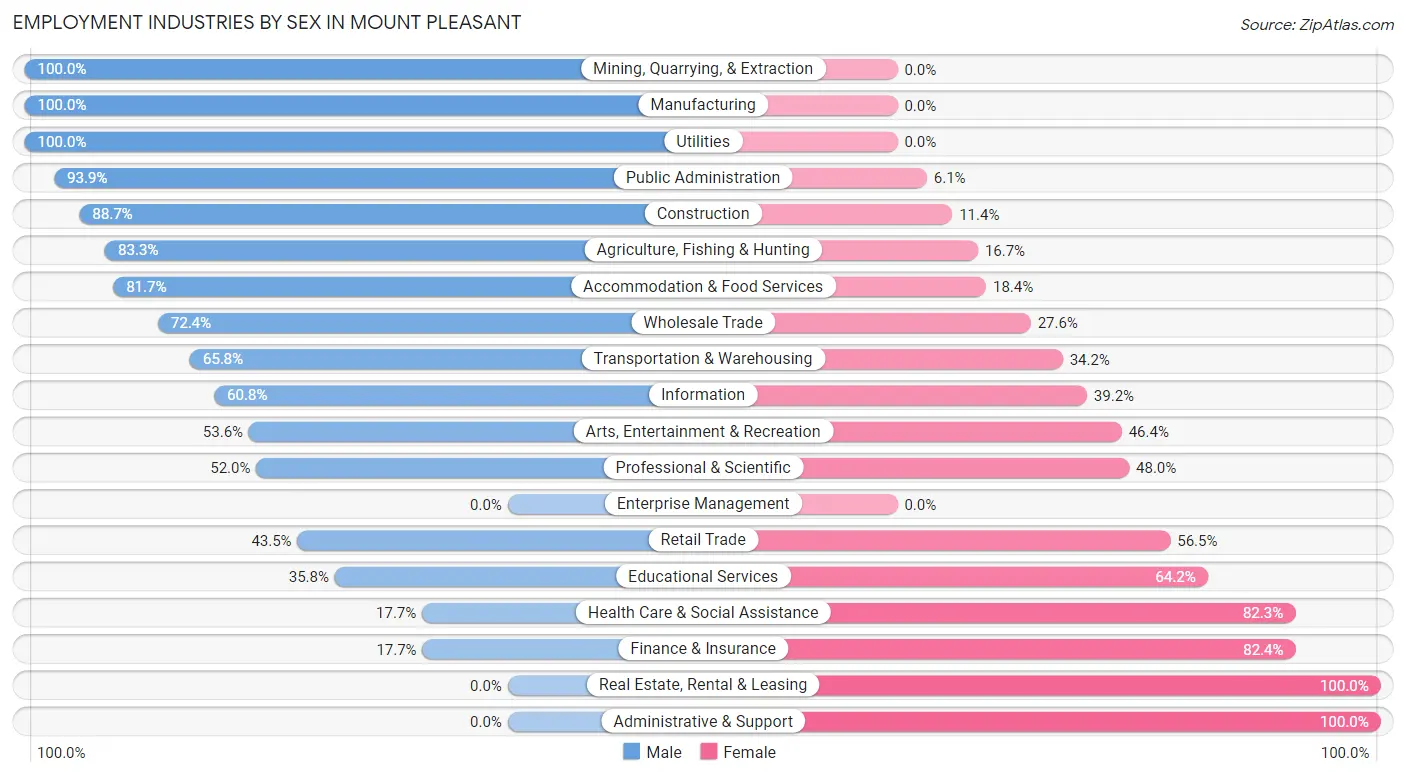
Employment Industries by Sex in Mount Pleasant
The Mount Pleasant industries that see more men than women are Mining, Quarrying, & Extraction (100.0%), Manufacturing (100.0%), and Utilities (100.0%), whereas the industries that tend to have a higher number of women are Real Estate, Rental & Leasing (100.0%), Administrative & Support (100.0%), and Finance & Insurance (82.4%).
| Industry | Male | Female |
| Agriculture, Fishing & Hunting | 30 (83.3%) | 6 (16.7%) |
| Mining, Quarrying, & Extraction | 71 (100.0%) | 0 (0.0%) |
| Construction | 203 (88.6%) | 26 (11.4%) |
| Manufacturing | 57 (100.0%) | 0 (0.0%) |
| Wholesale Trade | 21 (72.4%) | 8 (27.6%) |
| Retail Trade | 94 (43.5%) | 122 (56.5%) |
| Transportation & Warehousing | 25 (65.8%) | 13 (34.2%) |
| Utilities | 10 (100.0%) | 0 (0.0%) |
| Information | 31 (60.8%) | 20 (39.2%) |
| Finance & Insurance | 6 (17.6%) | 28 (82.4%) |
| Real Estate, Rental & Leasing | 0 (0.0%) | 3 (100.0%) |
| Professional & Scientific | 51 (52.0%) | 47 (48.0%) |
| Enterprise Management | 0 (0.0%) | 0 (0.0%) |
| Administrative & Support | 0 (0.0%) | 7 (100.0%) |
| Educational Services | 92 (35.8%) | 165 (64.2%) |
| Health Care & Social Assistance | 28 (17.7%) | 130 (82.3%) |
| Arts, Entertainment & Recreation | 15 (53.6%) | 13 (46.4%) |
| Accommodation & Food Services | 129 (81.7%) | 29 (18.3%) |
| Public Administration | 77 (93.9%) | 5 (6.1%) |
| Total | 1,006 (60.8%) | 650 (39.3%) |
Education in Mount Pleasant
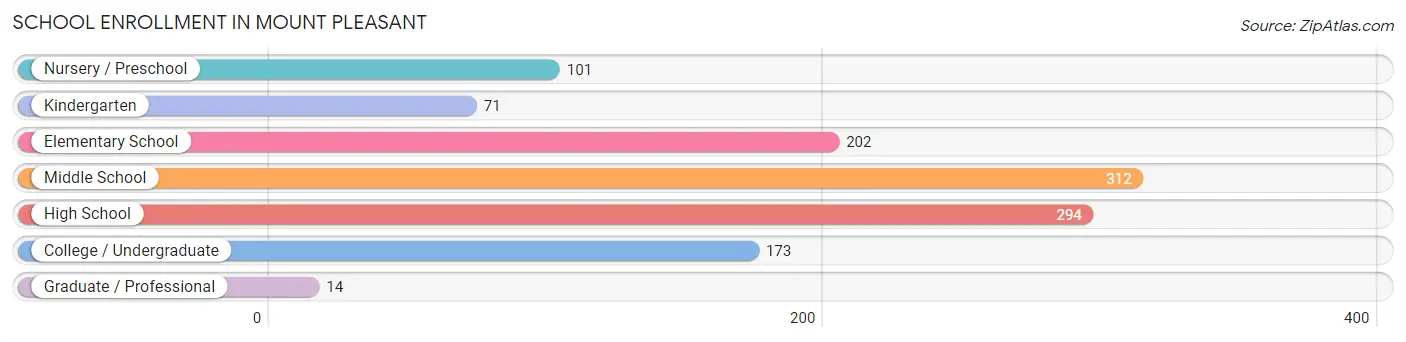
School Enrollment in Mount Pleasant
The most common levels of schooling among the 1,167 students in Mount Pleasant are middle school (312 | 26.7%), high school (294 | 25.2%), and elementary school (202 | 17.3%).
| School Level | # Students | % Students |
| Nursery / Preschool | 101 | 8.6% |
| Kindergarten | 71 | 6.1% |
| Elementary School | 202 | 17.3% |
| Middle School | 312 | 26.7% |
| High School | 294 | 25.2% |
| College / Undergraduate | 173 | 14.8% |
| Graduate / Professional | 14 | 1.2% |
| Total | 1,167 | 100.0% |
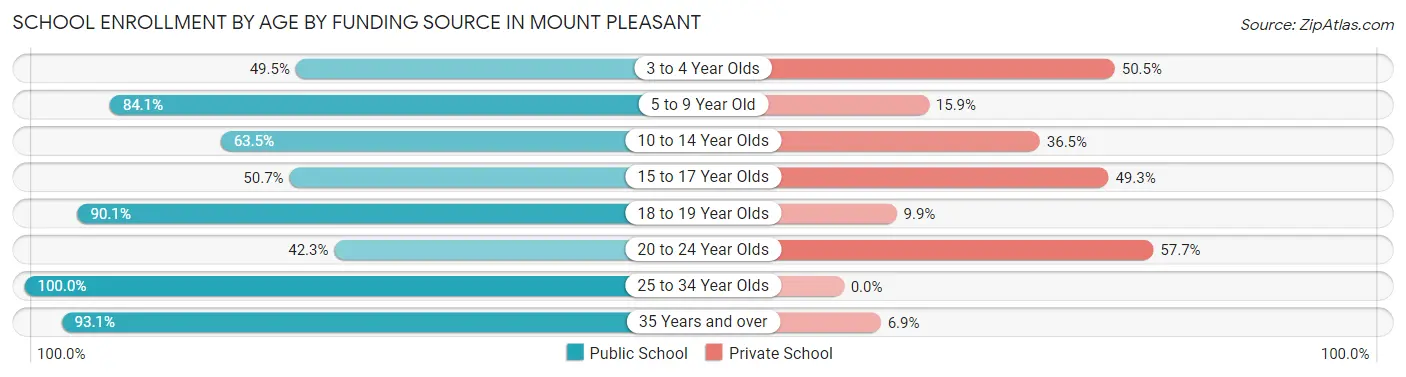
School Enrollment by Age by Funding Source in Mount Pleasant
Out of a total of 1,167 students who are enrolled in schools in Mount Pleasant, 373 (32.0%) attend a private institution, while the remaining 794 (68.0%) are enrolled in public schools. The age group of 20 to 24 year olds has the highest likelihood of being enrolled in private schools, with 30 (57.7% in the age bracket) enrolled. Conversely, the age group of 25 to 34 year olds has the lowest likelihood of being enrolled in a private school, with 21 (100.0% in the age bracket) attending a public institution.
| Age Bracket | Public School | Private School |
| 3 to 4 Year Olds | 50 (49.5%) | 51 (50.5%) |
| 5 to 9 Year Old | 175 (84.1%) | 33 (15.9%) |
| 10 to 14 Year Olds | 231 (63.5%) | 133 (36.5%) |
| 15 to 17 Year Olds | 112 (50.7%) | 109 (49.3%) |
| 18 to 19 Year Olds | 128 (90.1%) | 14 (9.9%) |
| 20 to 24 Year Olds | 22 (42.3%) | 30 (57.7%) |
| 25 to 34 Year Olds | 21 (100.0%) | 0 (0.0%) |
| 35 Years and over | 54 (93.1%) | 4 (6.9%) |
| Total | 794 (68.0%) | 373 (32.0%) |
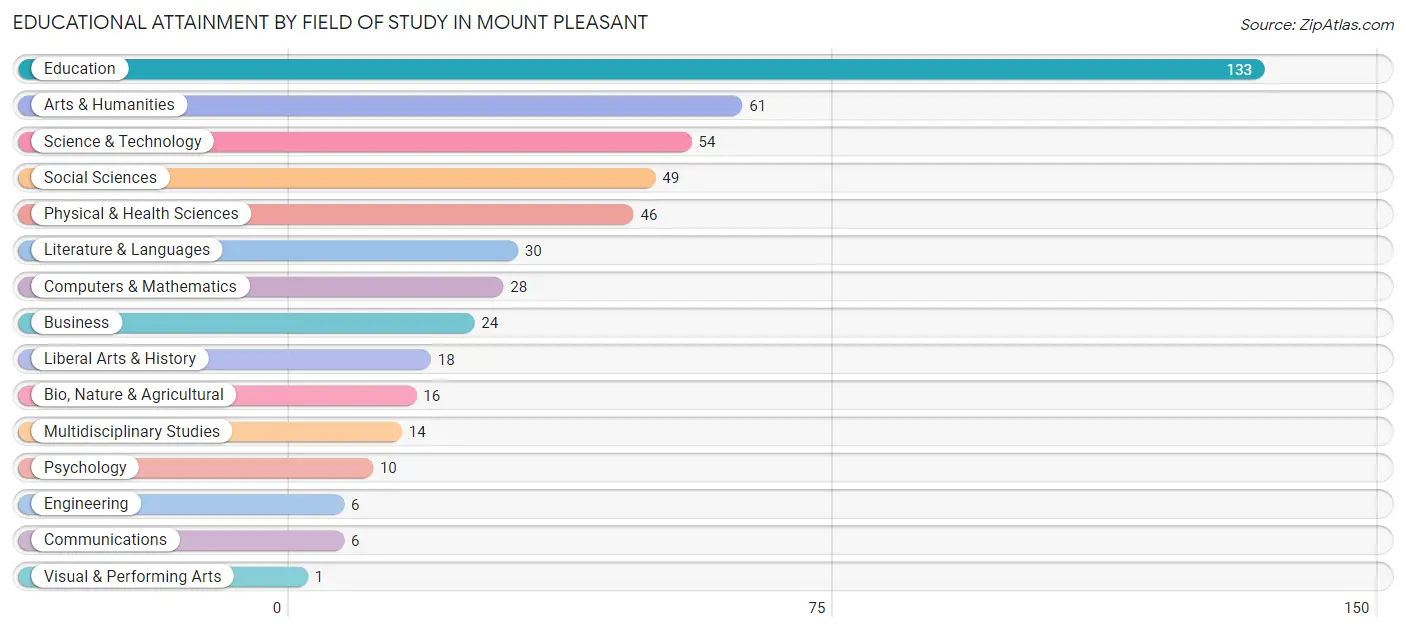
Educational Attainment by Field of Study in Mount Pleasant
Education (133 | 26.8%), arts & humanities (61 | 12.3%), science & technology (54 | 10.9%), social sciences (49 | 9.9%), and physical & health sciences (46 | 9.3%) are the most common fields of study among 496 individuals in Mount Pleasant who have obtained a bachelor's degree or higher.
| Field of Study | # Graduates | % Graduates |
| Computers & Mathematics | 28 | 5.7% |
| Bio, Nature & Agricultural | 16 | 3.2% |
| Physical & Health Sciences | 46 | 9.3% |
| Psychology | 10 | 2.0% |
| Social Sciences | 49 | 9.9% |
| Engineering | 6 | 1.2% |
| Multidisciplinary Studies | 14 | 2.8% |
| Science & Technology | 54 | 10.9% |
| Business | 24 | 4.8% |
| Education | 133 | 26.8% |
| Literature & Languages | 30 | 6.0% |
| Liberal Arts & History | 18 | 3.6% |
| Visual & Performing Arts | 1 | 0.2% |
| Communications | 6 | 1.2% |
| Arts & Humanities | 61 | 12.3% |
| Total | 496 | 100.0% |
Transportation & Commute in Mount Pleasant
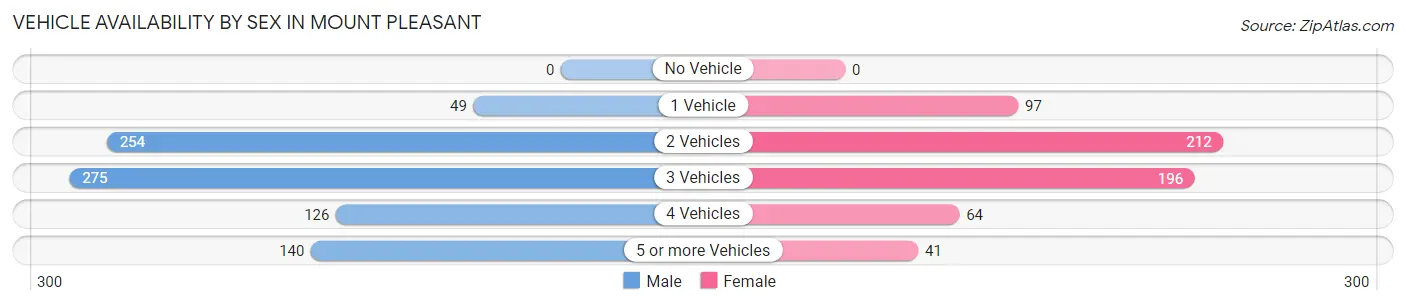
Vehicle Availability by Sex in Mount Pleasant
The most prevalent vehicle ownership categories in Mount Pleasant are males with 3 vehicles (275, accounting for 32.6%) and females with 3 vehicles (196, making up 45.1%).
| Vehicles Available | Male | Female |
| No Vehicle | 0 (0.0%) | 0 (0.0%) |
| 1 Vehicle | 49 (5.8%) | 97 (15.9%) |
| 2 Vehicles | 254 (30.1%) | 212 (34.7%) |
| 3 Vehicles | 275 (32.6%) | 196 (32.1%) |
| 4 Vehicles | 126 (14.9%) | 64 (10.5%) |
| 5 or more Vehicles | 140 (16.6%) | 41 (6.7%) |
| Total | 844 (100.0%) | 610 (100.0%) |
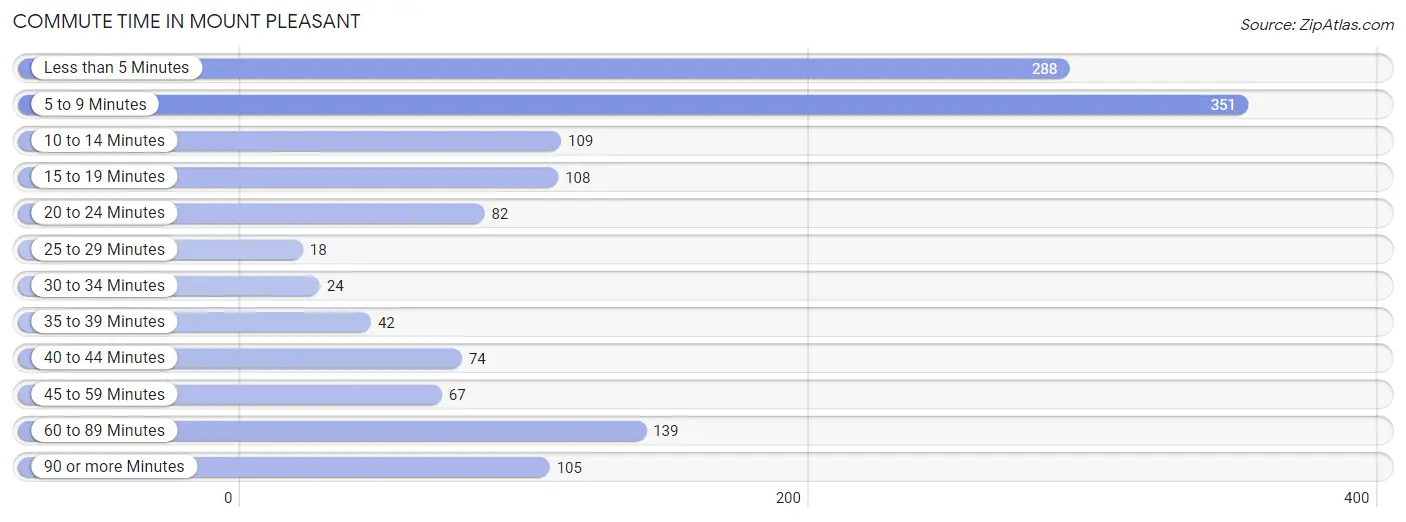
Commute Time in Mount Pleasant
The most frequently occuring commute durations in Mount Pleasant are 5 to 9 minutes (351 commuters, 24.9%), less than 5 minutes (288 commuters, 20.5%), and 60 to 89 minutes (139 commuters, 9.9%).
| Commute Time | # Commuters | % Commuters |
| Less than 5 Minutes | 288 | 20.5% |
| 5 to 9 Minutes | 351 | 24.9% |
| 10 to 14 Minutes | 109 | 7.7% |
| 15 to 19 Minutes | 108 | 7.7% |
| 20 to 24 Minutes | 82 | 5.8% |
| 25 to 29 Minutes | 18 | 1.3% |
| 30 to 34 Minutes | 24 | 1.7% |
| 35 to 39 Minutes | 42 | 3.0% |
| 40 to 44 Minutes | 74 | 5.3% |
| 45 to 59 Minutes | 67 | 4.8% |
| 60 to 89 Minutes | 139 | 9.9% |
| 90 or more Minutes | 105 | 7.5% |
Commute Time by Sex in Mount Pleasant
The most common commute times in Mount Pleasant are 5 to 9 minutes (206 commuters, 23.0%) for males and less than 5 minutes (153 commuters, 29.9%) for females.
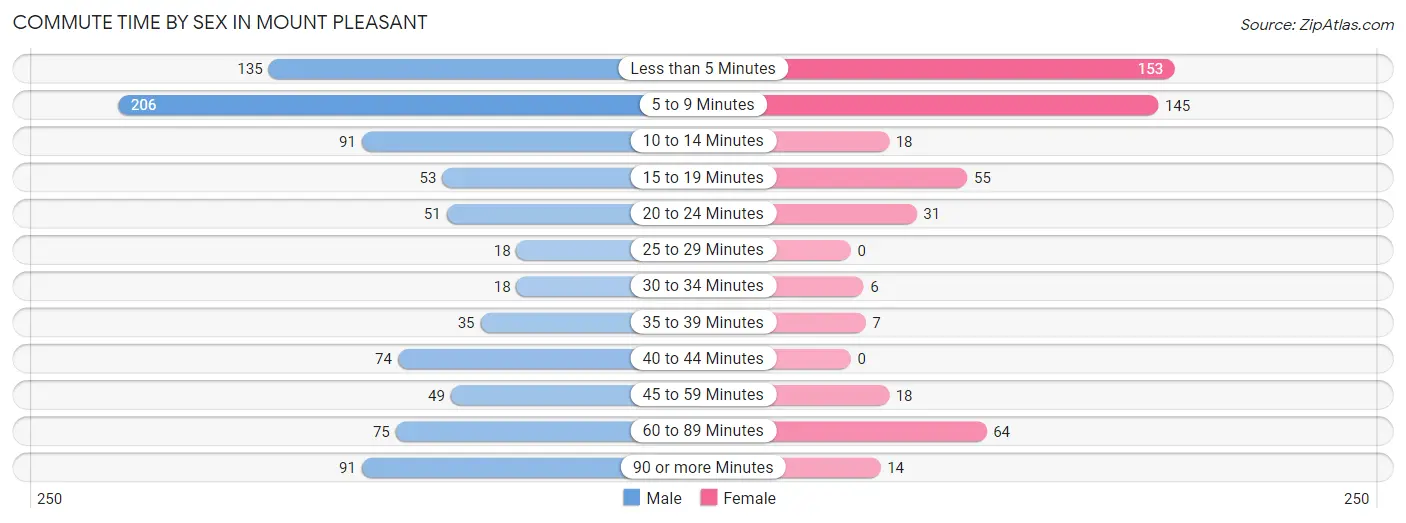
| Commute Time | Male | Female |
| Less than 5 Minutes | 135 (15.1%) | 153 (29.9%) |
| 5 to 9 Minutes | 206 (23.0%) | 145 (28.4%) |
| 10 to 14 Minutes | 91 (10.2%) | 18 (3.5%) |
| 15 to 19 Minutes | 53 (5.9%) | 55 (10.8%) |
| 20 to 24 Minutes | 51 (5.7%) | 31 (6.1%) |
| 25 to 29 Minutes | 18 (2.0%) | 0 (0.0%) |
| 30 to 34 Minutes | 18 (2.0%) | 6 (1.2%) |
| 35 to 39 Minutes | 35 (3.9%) | 7 (1.4%) |
| 40 to 44 Minutes | 74 (8.3%) | 0 (0.0%) |
| 45 to 59 Minutes | 49 (5.5%) | 18 (3.5%) |
| 60 to 89 Minutes | 75 (8.4%) | 64 (12.5%) |
| 90 or more Minutes | 91 (10.2%) | 14 (2.7%) |
Time of Departure to Work by Sex in Mount Pleasant
The most frequent times of departure to work in Mount Pleasant are 7:30 AM to 7:59 AM (213, 23.8%) for males and 4:00 PM to 11:59 PM (91, 17.8%) for females.
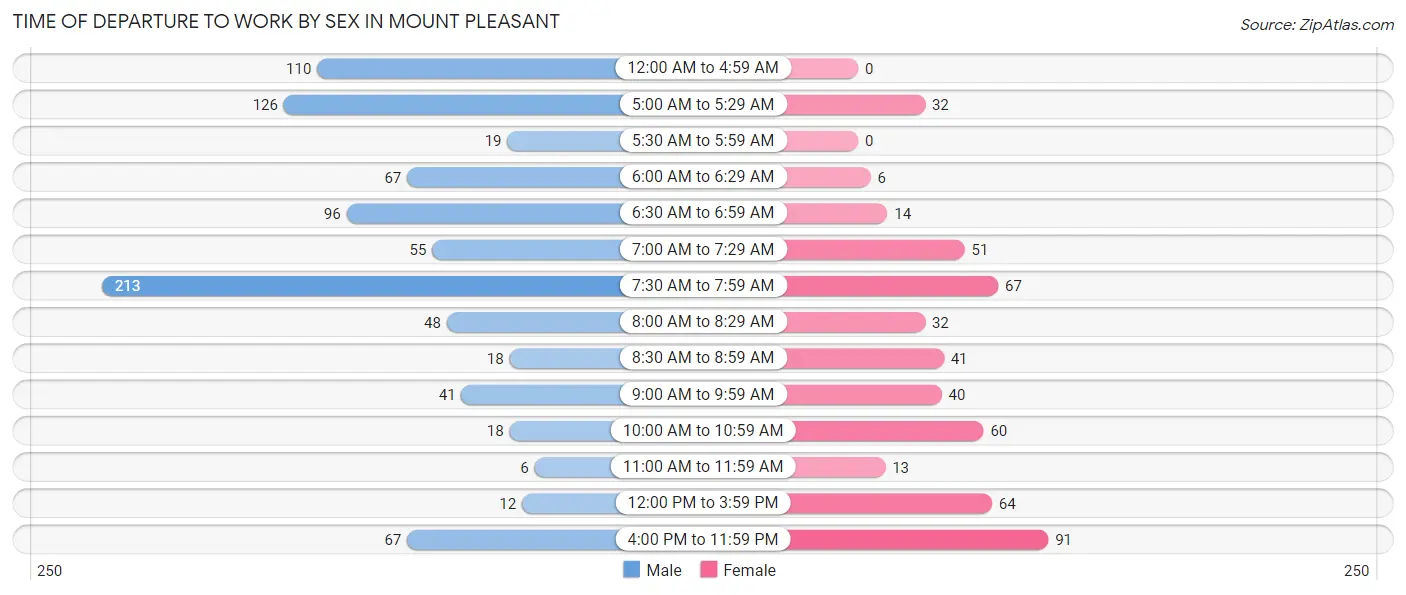
| Time of Departure | Male | Female |
| 12:00 AM to 4:59 AM | 110 (12.3%) | 0 (0.0%) |
| 5:00 AM to 5:29 AM | 126 (14.1%) | 32 (6.3%) |
| 5:30 AM to 5:59 AM | 19 (2.1%) | 0 (0.0%) |
| 6:00 AM to 6:29 AM | 67 (7.5%) | 6 (1.2%) |
| 6:30 AM to 6:59 AM | 96 (10.7%) | 14 (2.7%) |
| 7:00 AM to 7:29 AM | 55 (6.1%) | 51 (10.0%) |
| 7:30 AM to 7:59 AM | 213 (23.8%) | 67 (13.1%) |
| 8:00 AM to 8:29 AM | 48 (5.4%) | 32 (6.3%) |
| 8:30 AM to 8:59 AM | 18 (2.0%) | 41 (8.0%) |
| 9:00 AM to 9:59 AM | 41 (4.6%) | 40 (7.8%) |
| 10:00 AM to 10:59 AM | 18 (2.0%) | 60 (11.7%) |
| 11:00 AM to 11:59 AM | 6 (0.7%) | 13 (2.5%) |
| 12:00 PM to 3:59 PM | 12 (1.3%) | 64 (12.5%) |
| 4:00 PM to 11:59 PM | 67 (7.5%) | 91 (17.8%) |
| Total | 896 (100.0%) | 511 (100.0%) |
Housing Occupancy in Mount Pleasant
Occupancy by Ownership in Mount Pleasant
Of the total 1,133 dwellings in Mount Pleasant, owner-occupied units account for 893 (78.8%), while renter-occupied units make up 240 (21.2%).
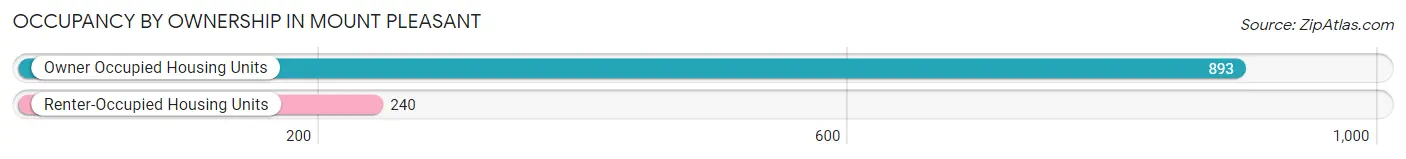
| Occupancy | # Housing Units | % Housing Units |
| Owner Occupied Housing Units | 893 | 78.8% |
| Renter-Occupied Housing Units | 240 | 21.2% |
| Total Occupied Housing Units | 1,133 | 100.0% |
Occupancy by Household Size in Mount Pleasant
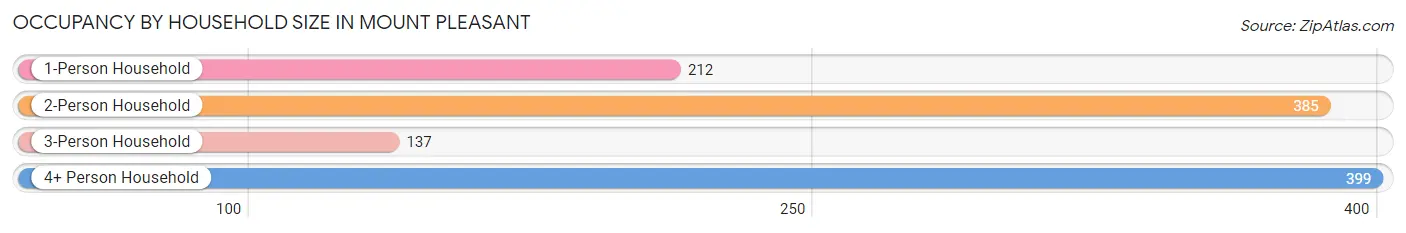
| Household Size | # Housing Units | % Housing Units |
| 1-Person Household | 212 | 18.7% |
| 2-Person Household | 385 | 34.0% |
| 3-Person Household | 137 | 12.1% |
| 4+ Person Household | 399 | 35.2% |
| Total Housing Units | 1,133 | 100.0% |
Occupancy by Ownership by Household Size in Mount Pleasant
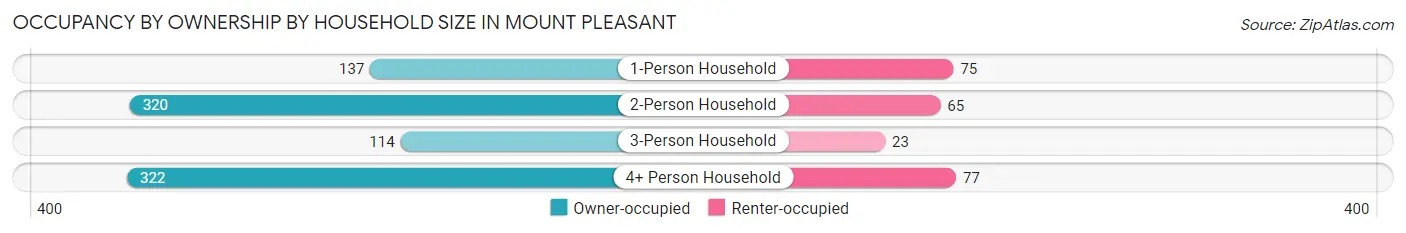
| Household Size | Owner-occupied | Renter-occupied |
| 1-Person Household | 137 (64.6%) | 75 (35.4%) |
| 2-Person Household | 320 (83.1%) | 65 (16.9%) |
| 3-Person Household | 114 (83.2%) | 23 (16.8%) |
| 4+ Person Household | 322 (80.7%) | 77 (19.3%) |
| Total Housing Units | 893 (78.8%) | 240 (21.2%) |
Occupancy by Educational Attainment in Mount Pleasant
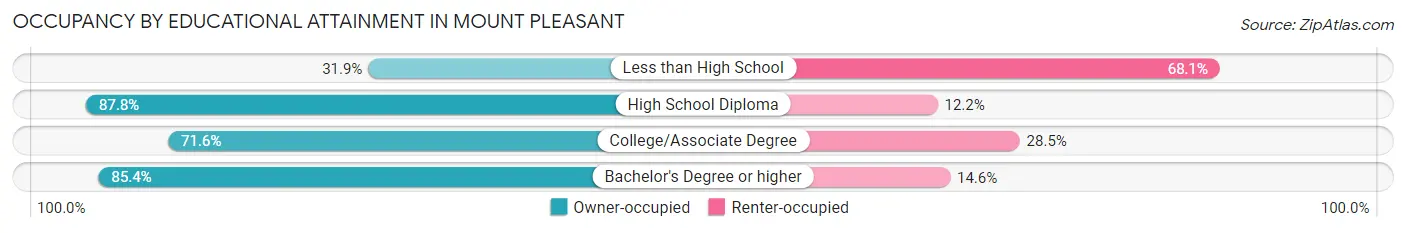
| Household Size | Owner-occupied | Renter-occupied |
| Less than High School | 22 (31.9%) | 47 (68.1%) |
| High School Diploma | 383 (87.8%) | 53 (12.2%) |
| College/Associate Degree | 249 (71.6%) | 99 (28.4%) |
| Bachelor's Degree or higher | 239 (85.4%) | 41 (14.6%) |
Occupancy by Age of Householder in Mount Pleasant
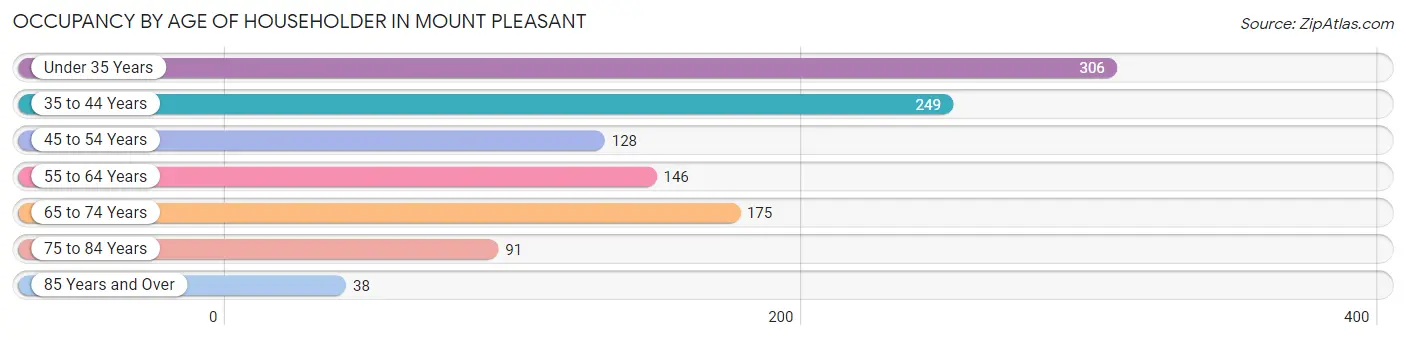
| Age Bracket | # Households | % Households |
| Under 35 Years | 306 | 27.0% |
| 35 to 44 Years | 249 | 22.0% |
| 45 to 54 Years | 128 | 11.3% |
| 55 to 64 Years | 146 | 12.9% |
| 65 to 74 Years | 175 | 15.4% |
| 75 to 84 Years | 91 | 8.0% |
| 85 Years and Over | 38 | 3.4% |
| Total | 1,133 | 100.0% |
Housing Finances in Mount Pleasant
Median Income by Occupancy in Mount Pleasant
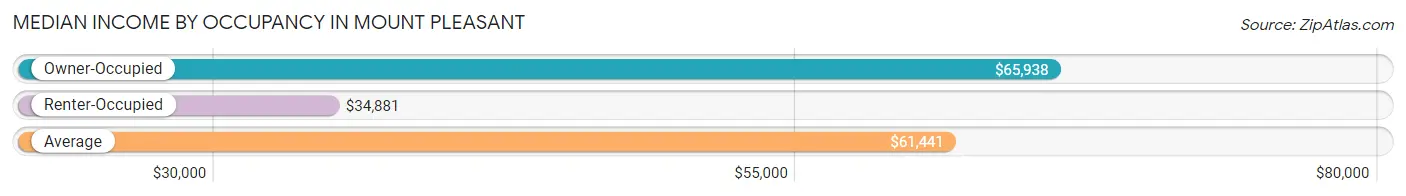
| Occupancy Type | # Households | Median Income |
| Owner-Occupied | 893 (78.8%) | $65,938 |
| Renter-Occupied | 240 (21.2%) | $34,881 |
| Average | 1,133 (100.0%) | $61,441 |
Occupancy by Householder Income Bracket in Mount Pleasant
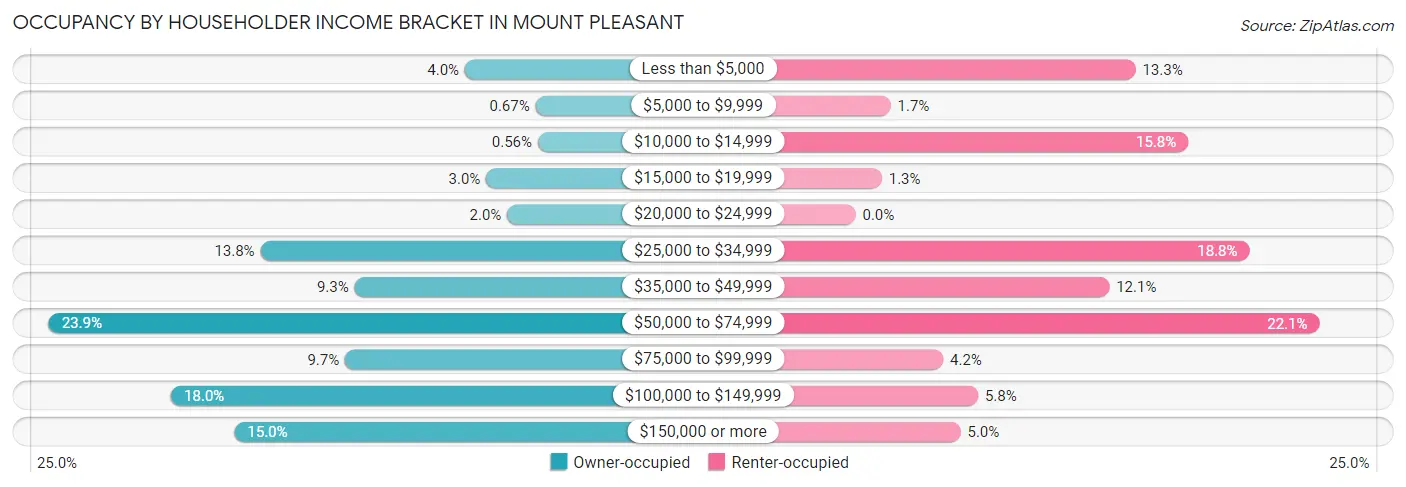
| Income Bracket | Owner-occupied | Renter-occupied |
| Less than $5,000 | 36 (4.0%) | 32 (13.3%) |
| $5,000 to $9,999 | 6 (0.7%) | 4 (1.7%) |
| $10,000 to $14,999 | 5 (0.6%) | 38 (15.8%) |
| $15,000 to $19,999 | 27 (3.0%) | 3 (1.3%) |
| $20,000 to $24,999 | 18 (2.0%) | 0 (0.0%) |
| $25,000 to $34,999 | 123 (13.8%) | 45 (18.8%) |
| $35,000 to $49,999 | 83 (9.3%) | 29 (12.1%) |
| $50,000 to $74,999 | 213 (23.8%) | 53 (22.1%) |
| $75,000 to $99,999 | 87 (9.7%) | 10 (4.2%) |
| $100,000 to $149,999 | 161 (18.0%) | 14 (5.8%) |
| $150,000 or more | 134 (15.0%) | 12 (5.0%) |
| Total | 893 (100.0%) | 240 (100.0%) |
Monthly Housing Cost Tiers in Mount Pleasant
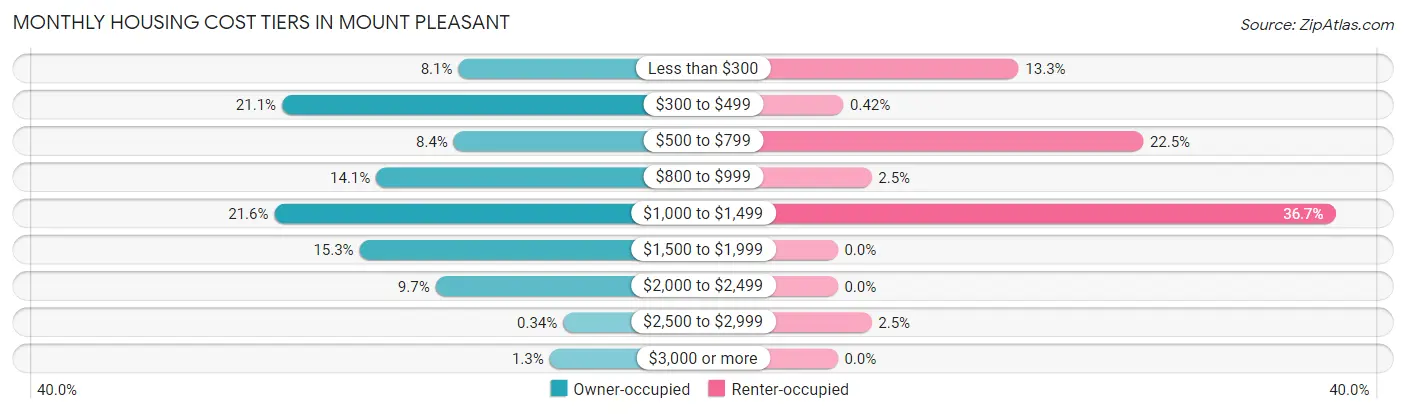
| Monthly Cost | Owner-occupied | Renter-occupied |
| Less than $300 | 72 (8.1%) | 32 (13.3%) |
| $300 to $499 | 188 (21.0%) | 1 (0.4%) |
| $500 to $799 | 75 (8.4%) | 54 (22.5%) |
| $800 to $999 | 126 (14.1%) | 6 (2.5%) |
| $1,000 to $1,499 | 193 (21.6%) | 88 (36.7%) |
| $1,500 to $1,999 | 137 (15.3%) | 0 (0.0%) |
| $2,000 to $2,499 | 87 (9.7%) | 0 (0.0%) |
| $2,500 to $2,999 | 3 (0.3%) | 6 (2.5%) |
| $3,000 or more | 12 (1.3%) | 0 (0.0%) |
| Total | 893 (100.0%) | 240 (100.0%) |
Physical Housing Characteristics in Mount Pleasant
Housing Structures in Mount Pleasant
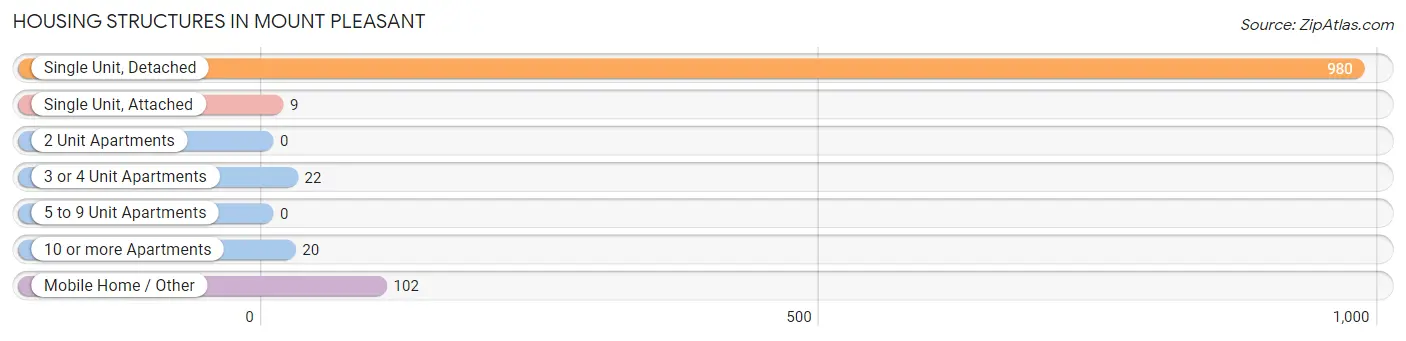
| Structure Type | # Housing Units | % Housing Units |
| Single Unit, Detached | 980 | 86.5% |
| Single Unit, Attached | 9 | 0.8% |
| 2 Unit Apartments | 0 | 0.0% |
| 3 or 4 Unit Apartments | 22 | 1.9% |
| 5 to 9 Unit Apartments | 0 | 0.0% |
| 10 or more Apartments | 20 | 1.8% |
| Mobile Home / Other | 102 | 9.0% |
| Total | 1,133 | 100.0% |
Housing Structures by Occupancy in Mount Pleasant
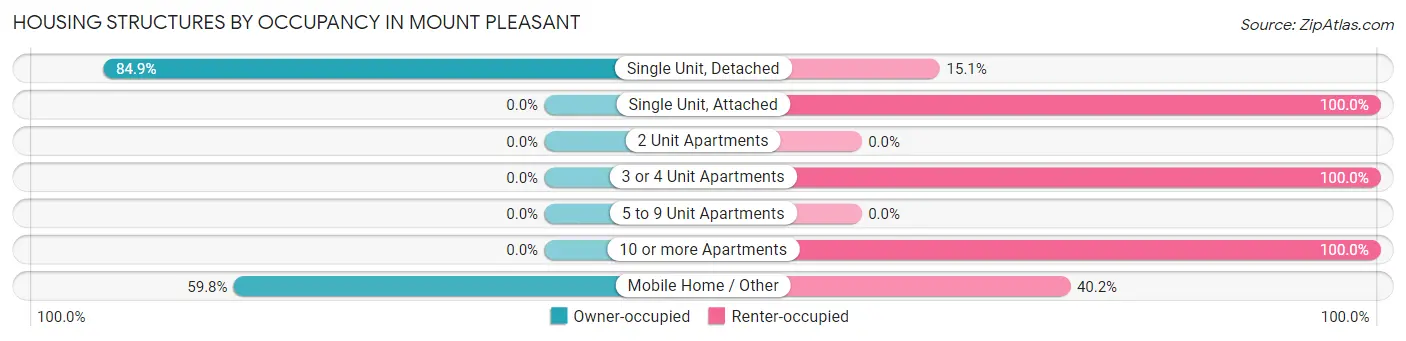
| Structure Type | Owner-occupied | Renter-occupied |
| Single Unit, Detached | 832 (84.9%) | 148 (15.1%) |
| Single Unit, Attached | 0 (0.0%) | 9 (100.0%) |
| 2 Unit Apartments | 0 (0.0%) | 0 (0.0%) |
| 3 or 4 Unit Apartments | 0 (0.0%) | 22 (100.0%) |
| 5 to 9 Unit Apartments | 0 (0.0%) | 0 (0.0%) |
| 10 or more Apartments | 0 (0.0%) | 20 (100.0%) |
| Mobile Home / Other | 61 (59.8%) | 41 (40.2%) |
| Total | 893 (78.8%) | 240 (21.2%) |
Housing Structures by Number of Rooms in Mount Pleasant
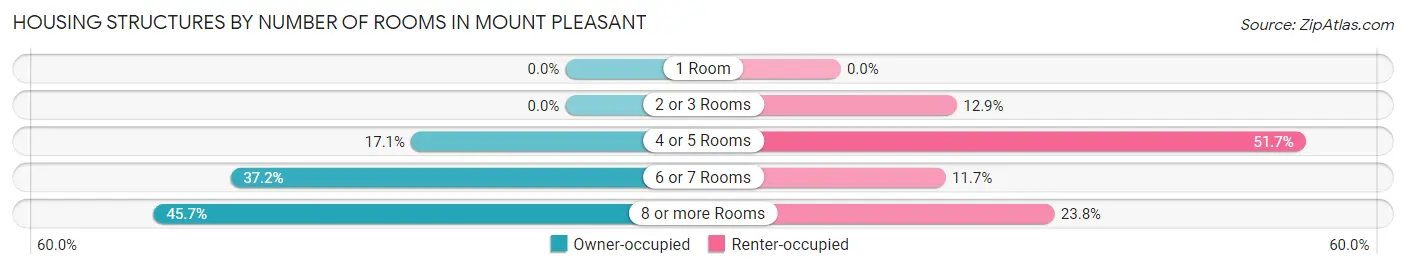
| Number of Rooms | Owner-occupied | Renter-occupied |
| 1 Room | 0 (0.0%) | 0 (0.0%) |
| 2 or 3 Rooms | 0 (0.0%) | 31 (12.9%) |
| 4 or 5 Rooms | 153 (17.1%) | 124 (51.7%) |
| 6 or 7 Rooms | 332 (37.2%) | 28 (11.7%) |
| 8 or more Rooms | 408 (45.7%) | 57 (23.7%) |
| Total | 893 (100.0%) | 240 (100.0%) |
Housing Structure by Heating Type in Mount Pleasant
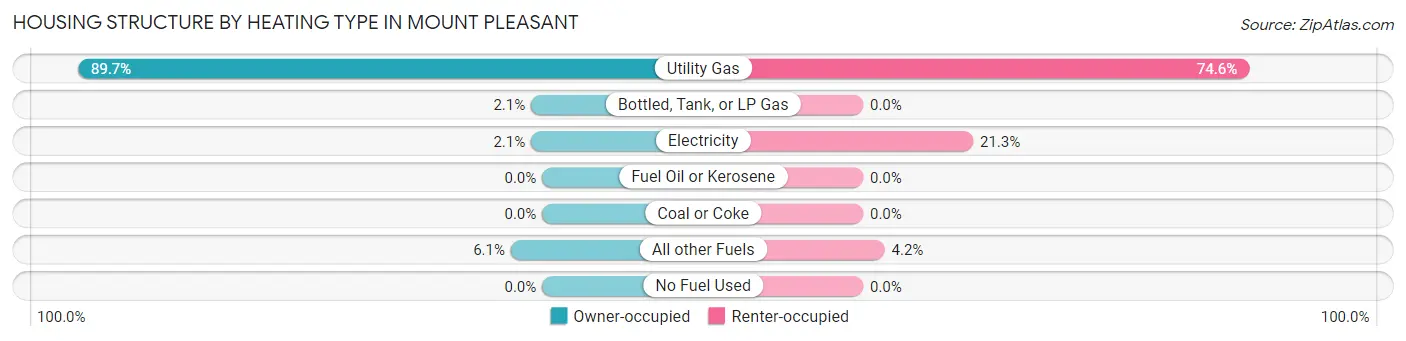
| Heating Type | Owner-occupied | Renter-occupied |
| Utility Gas | 801 (89.7%) | 179 (74.6%) |
| Bottled, Tank, or LP Gas | 19 (2.1%) | 0 (0.0%) |
| Electricity | 19 (2.1%) | 51 (21.2%) |
| Fuel Oil or Kerosene | 0 (0.0%) | 0 (0.0%) |
| Coal or Coke | 0 (0.0%) | 0 (0.0%) |
| All other Fuels | 54 (6.0%) | 10 (4.2%) |
| No Fuel Used | 0 (0.0%) | 0 (0.0%) |
| Total | 893 (100.0%) | 240 (100.0%) |
Household Vehicle Usage in Mount Pleasant
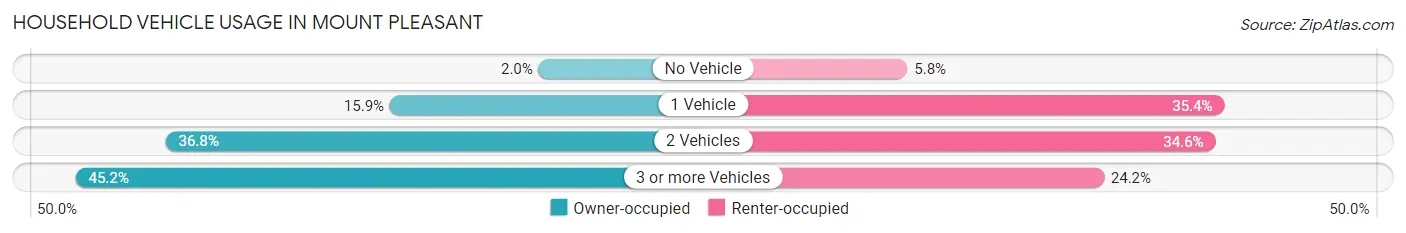
| Vehicles per Household | Owner-occupied | Renter-occupied |
| No Vehicle | 18 (2.0%) | 14 (5.8%) |
| 1 Vehicle | 142 (15.9%) | 85 (35.4%) |
| 2 Vehicles | 329 (36.8%) | 83 (34.6%) |
| 3 or more Vehicles | 404 (45.2%) | 58 (24.2%) |
| Total | 893 (100.0%) | 240 (100.0%) |
Real Estate & Mortgages in Mount Pleasant
Real Estate and Mortgage Overview in Mount Pleasant
| Characteristic | Without Mortgage | With Mortgage |
| Housing Units | 359 | 534 |
| Median Property Value | $224,200 | $255,500 |
| Median Household Income | $62,007 | $91 |
| Monthly Housing Costs | $386 | $12 |
| Real Estate Taxes | $1,428 | $0 |
Property Value by Mortgage Status in Mount Pleasant
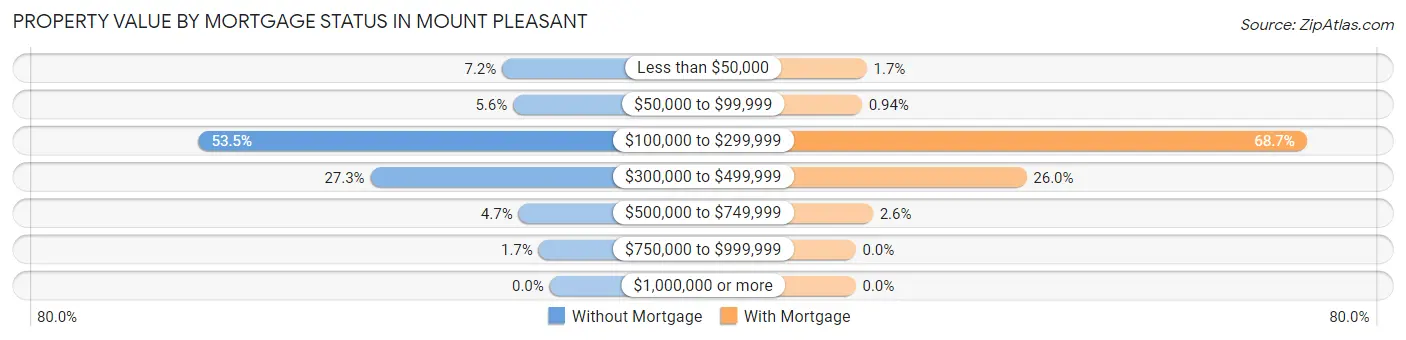
| Property Value | Without Mortgage | With Mortgage |
| Less than $50,000 | 26 (7.2%) | 9 (1.7%) |
| $50,000 to $99,999 | 20 (5.6%) | 5 (0.9%) |
| $100,000 to $299,999 | 192 (53.5%) | 367 (68.7%) |
| $300,000 to $499,999 | 98 (27.3%) | 139 (26.0%) |
| $500,000 to $749,999 | 17 (4.7%) | 14 (2.6%) |
| $750,000 to $999,999 | 6 (1.7%) | 0 (0.0%) |
| $1,000,000 or more | 0 (0.0%) | 0 (0.0%) |
| Total | 359 (100.0%) | 534 (100.0%) |
Household Income by Mortgage Status in Mount Pleasant
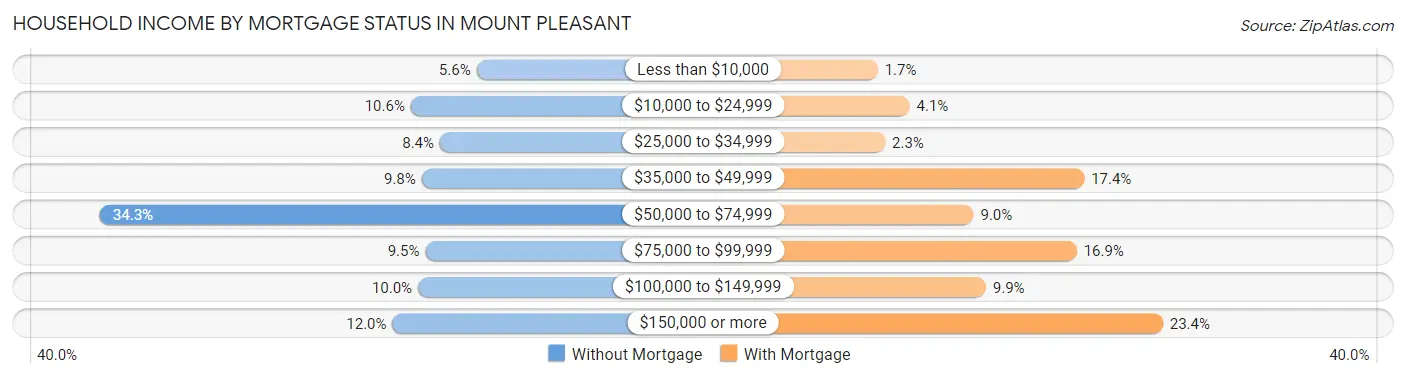
| Household Income | Without Mortgage | With Mortgage |
| Less than $10,000 | 20 (5.6%) | 9 (1.7%) |
| $10,000 to $24,999 | 38 (10.6%) | 22 (4.1%) |
| $25,000 to $34,999 | 30 (8.4%) | 12 (2.2%) |
| $35,000 to $49,999 | 35 (9.8%) | 93 (17.4%) |
| $50,000 to $74,999 | 123 (34.3%) | 48 (9.0%) |
| $75,000 to $99,999 | 34 (9.5%) | 90 (16.9%) |
| $100,000 to $149,999 | 36 (10.0%) | 53 (9.9%) |
| $150,000 or more | 43 (12.0%) | 125 (23.4%) |
| Total | 359 (100.0%) | 534 (100.0%) |
Property Value to Household Income Ratio in Mount Pleasant
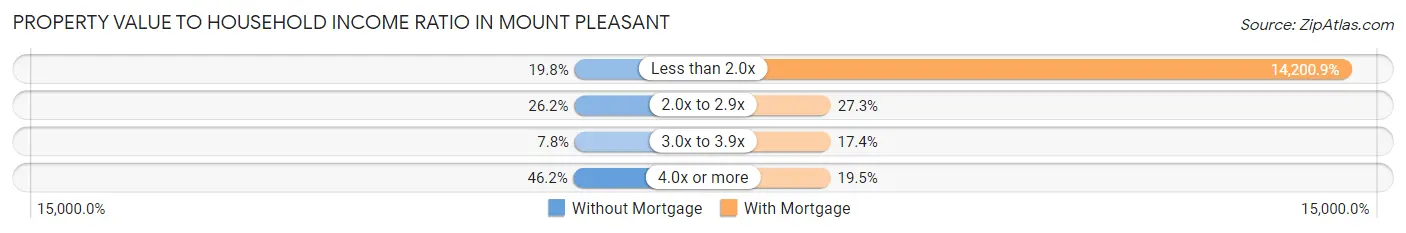
| Value-to-Income Ratio | Without Mortgage | With Mortgage |
| Less than 2.0x | 71 (19.8%) | 75,833 (14,200.9%) |
| 2.0x to 2.9x | 94 (26.2%) | 146 (27.3%) |
| 3.0x to 3.9x | 28 (7.8%) | 93 (17.4%) |
| 4.0x or more | 166 (46.2%) | 104 (19.5%) |
| Total | 359 (100.0%) | 534 (100.0%) |
Real Estate Taxes by Mortgage Status in Mount Pleasant
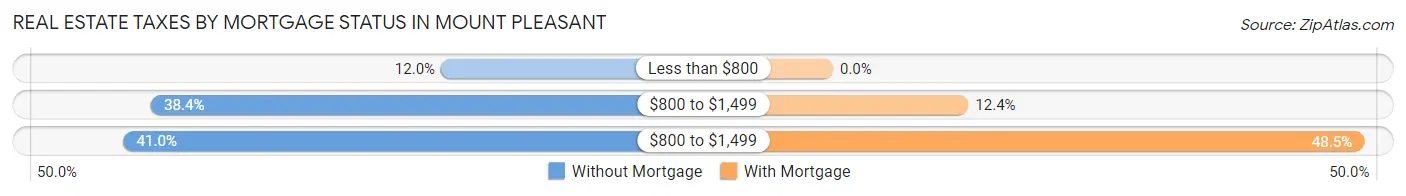
| Property Taxes | Without Mortgage | With Mortgage |
| Less than $800 | 43 (12.0%) | 0 (0.0%) |
| $800 to $1,499 | 138 (38.4%) | 66 (12.4%) |
| $800 to $1,499 | 147 (40.9%) | 259 (48.5%) |
| Total | 359 (100.0%) | 534 (100.0%) |
Health & Disability in Mount Pleasant
Health Insurance Coverage by Age in Mount Pleasant
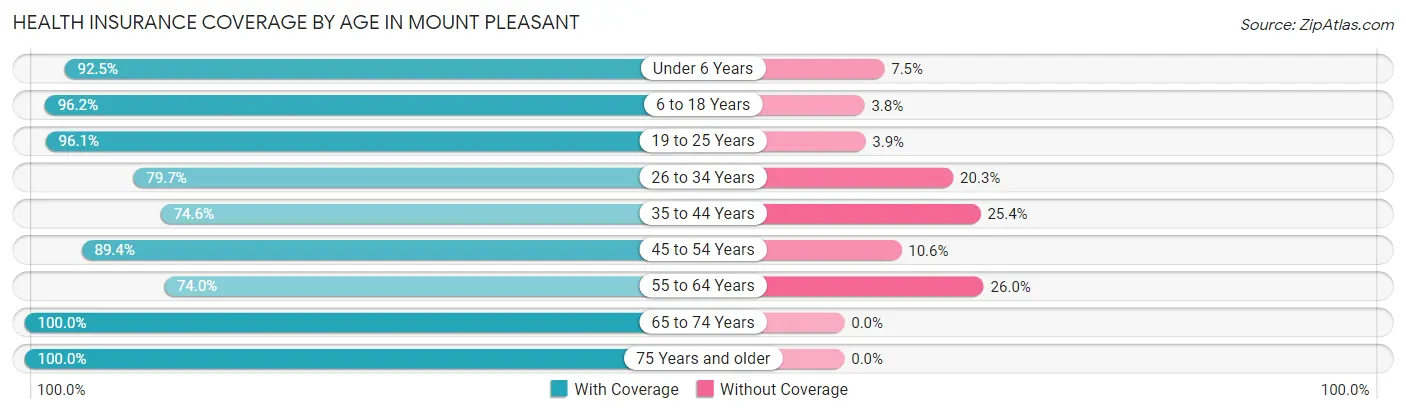
| Age Bracket | With Coverage | Without Coverage |
| Under 6 Years | 310 (92.5%) | 25 (7.5%) |
| 6 to 18 Years | 818 (96.2%) | 32 (3.8%) |
| 19 to 25 Years | 342 (96.1%) | 14 (3.9%) |
| 26 to 34 Years | 369 (79.7%) | 94 (20.3%) |
| 35 to 44 Years | 382 (74.6%) | 130 (25.4%) |
| 45 to 54 Years | 269 (89.4%) | 32 (10.6%) |
| 55 to 64 Years | 205 (74.0%) | 72 (26.0%) |
| 65 to 74 Years | 331 (100.0%) | 0 (0.0%) |
| 75 Years and older | 230 (100.0%) | 0 (0.0%) |
| Total | 3,256 (89.1%) | 399 (10.9%) |
Health Insurance Coverage by Citizenship Status in Mount Pleasant
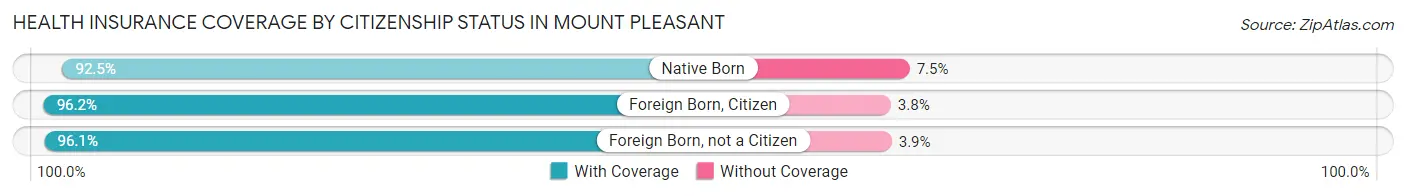
| Citizenship Status | With Coverage | Without Coverage |
| Native Born | 310 (92.5%) | 25 (7.5%) |
| Foreign Born, Citizen | 818 (96.2%) | 32 (3.8%) |
| Foreign Born, not a Citizen | 342 (96.1%) | 14 (3.9%) |
Health Insurance Coverage by Household Income in Mount Pleasant
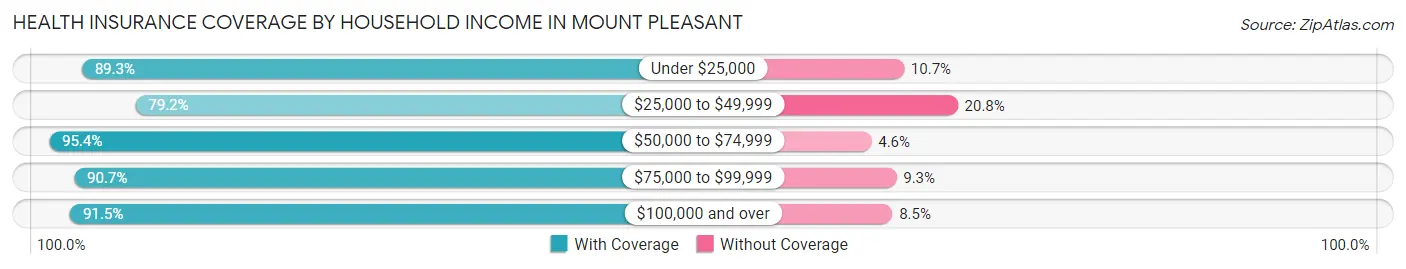
| Household Income | With Coverage | Without Coverage |
| Under $25,000 | 359 (89.3%) | 43 (10.7%) |
| $25,000 to $49,999 | 664 (79.2%) | 174 (20.8%) |
| $50,000 to $74,999 | 645 (95.4%) | 31 (4.6%) |
| $75,000 to $99,999 | 274 (90.7%) | 28 (9.3%) |
| $100,000 and over | 1,043 (91.5%) | 97 (8.5%) |
Public vs Private Health Insurance Coverage by Age in Mount Pleasant
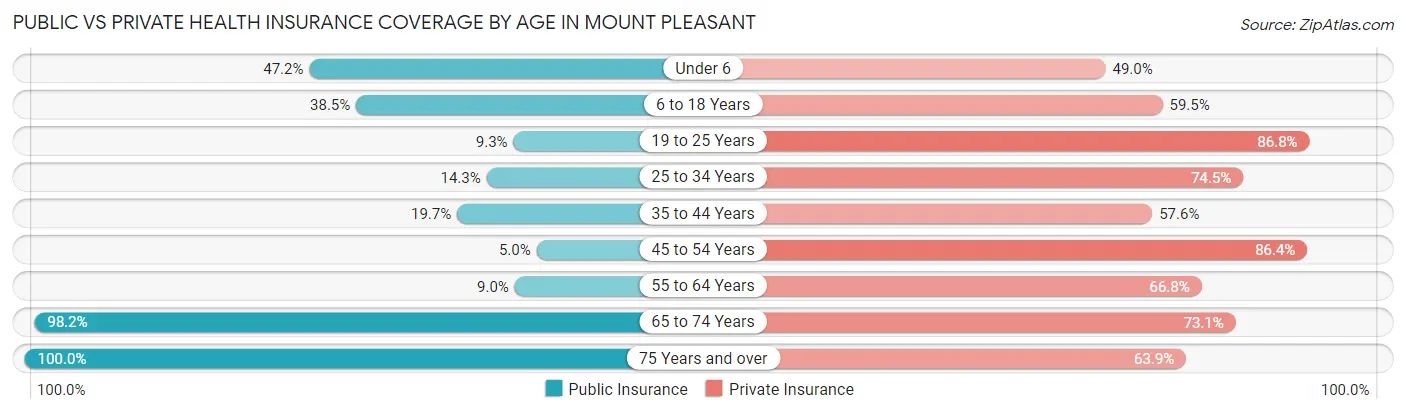
| Age Bracket | Public Insurance | Private Insurance |
| Under 6 | 158 (47.2%) | 164 (49.0%) |
| 6 to 18 Years | 327 (38.5%) | 506 (59.5%) |
| 19 to 25 Years | 33 (9.3%) | 309 (86.8%) |
| 25 to 34 Years | 66 (14.2%) | 345 (74.5%) |
| 35 to 44 Years | 101 (19.7%) | 295 (57.6%) |
| 45 to 54 Years | 15 (5.0%) | 260 (86.4%) |
| 55 to 64 Years | 25 (9.0%) | 185 (66.8%) |
| 65 to 74 Years | 325 (98.2%) | 242 (73.1%) |
| 75 Years and over | 230 (100.0%) | 147 (63.9%) |
| Total | 1,280 (35.0%) | 2,453 (67.1%) |
Disability Status by Sex by Age in Mount Pleasant
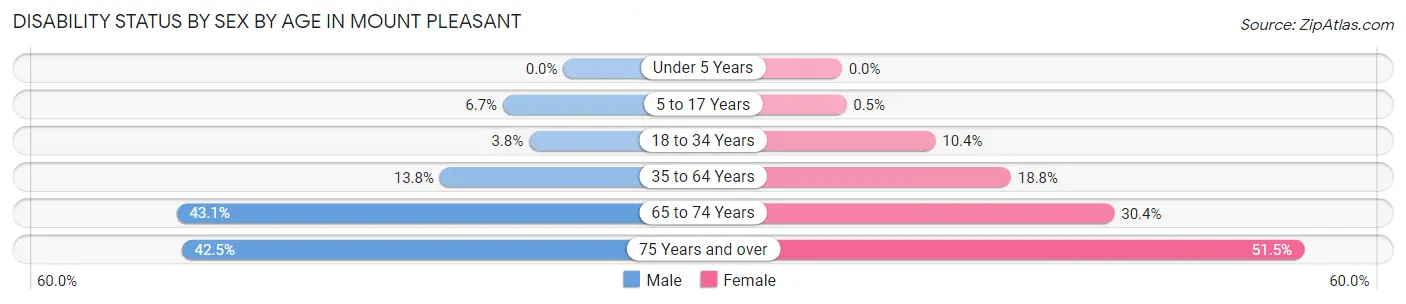
| Age Bracket | Male | Female |
| Under 5 Years | 0 (0.0%) | 0 (0.0%) |
| 5 to 17 Years | 28 (6.7%) | 2 (0.5%) |
| 18 to 34 Years | 18 (3.8%) | 48 (10.4%) |
| 35 to 64 Years | 82 (13.8%) | 93 (18.8%) |
| 65 to 74 Years | 56 (43.1%) | 61 (30.3%) |
| 75 Years and over | 54 (42.5%) | 53 (51.5%) |
Disability Class by Sex by Age in Mount Pleasant
Disability Class: Hearing Difficulty
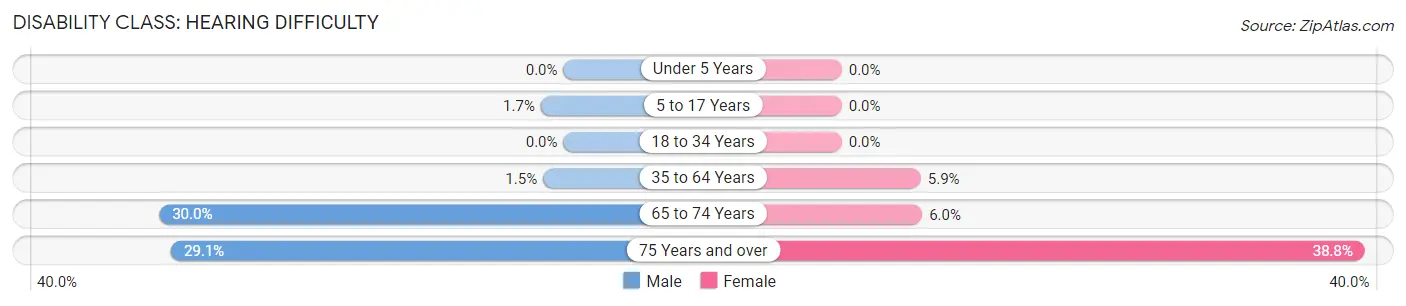
| Age Bracket | Male | Female |
| Under 5 Years | 0 (0.0%) | 0 (0.0%) |
| 5 to 17 Years | 7 (1.7%) | 0 (0.0%) |
| 18 to 34 Years | 0 (0.0%) | 0 (0.0%) |
| 35 to 64 Years | 9 (1.5%) | 29 (5.9%) |
| 65 to 74 Years | 39 (30.0%) | 12 (6.0%) |
| 75 Years and over | 37 (29.1%) | 40 (38.8%) |
Disability Class: Vision Difficulty
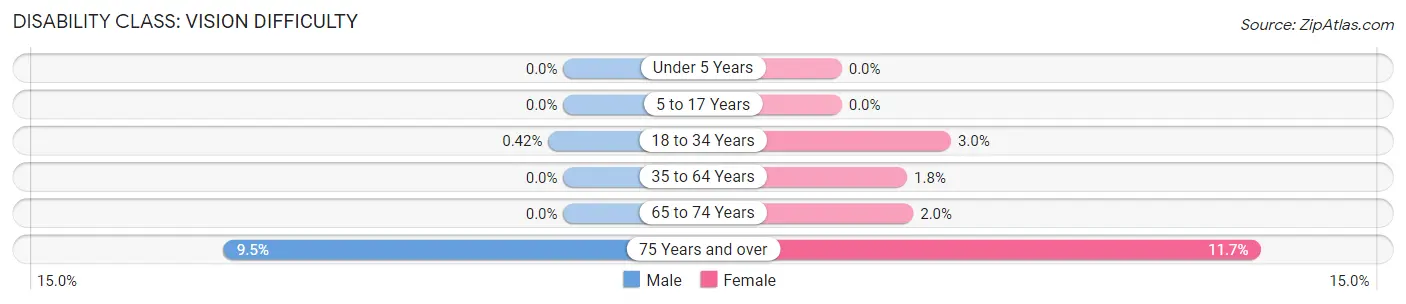
| Age Bracket | Male | Female |
| Under 5 Years | 0 (0.0%) | 0 (0.0%) |
| 5 to 17 Years | 0 (0.0%) | 0 (0.0%) |
| 18 to 34 Years | 2 (0.4%) | 14 (3.0%) |
| 35 to 64 Years | 0 (0.0%) | 9 (1.8%) |
| 65 to 74 Years | 0 (0.0%) | 4 (2.0%) |
| 75 Years and over | 12 (9.5%) | 12 (11.7%) |
Disability Class: Cognitive Difficulty
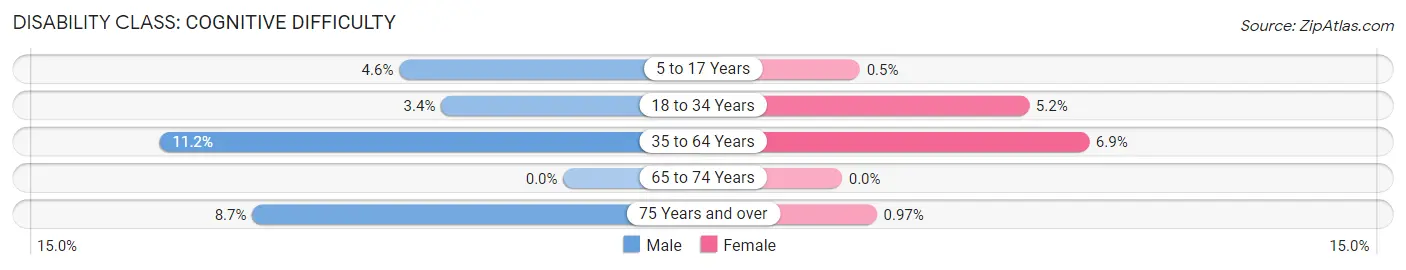
| Age Bracket | Male | Female |
| 5 to 17 Years | 19 (4.6%) | 2 (0.5%) |
| 18 to 34 Years | 16 (3.4%) | 24 (5.2%) |
| 35 to 64 Years | 67 (11.2%) | 34 (6.9%) |
| 65 to 74 Years | 0 (0.0%) | 0 (0.0%) |
| 75 Years and over | 11 (8.7%) | 1 (1.0%) |
Disability Class: Ambulatory Difficulty
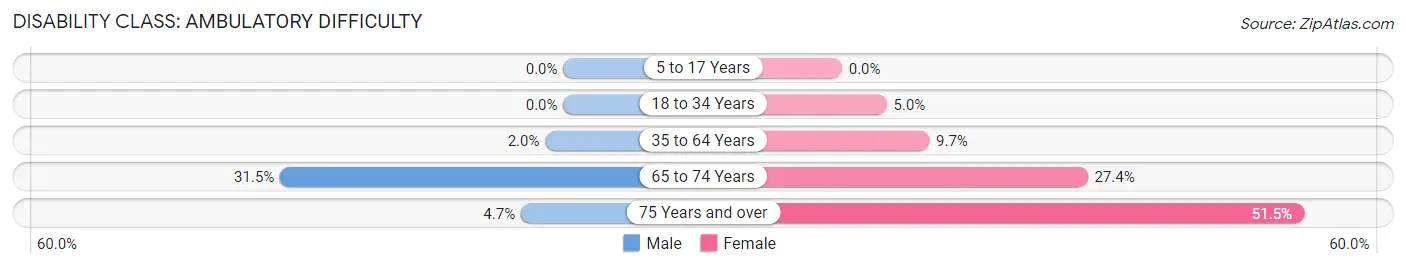
| Age Bracket | Male | Female |
| 5 to 17 Years | 0 (0.0%) | 0 (0.0%) |
| 18 to 34 Years | 0 (0.0%) | 23 (5.0%) |
| 35 to 64 Years | 12 (2.0%) | 48 (9.7%) |
| 65 to 74 Years | 41 (31.5%) | 55 (27.4%) |
| 75 Years and over | 6 (4.7%) | 53 (51.5%) |
Disability Class: Self-Care Difficulty
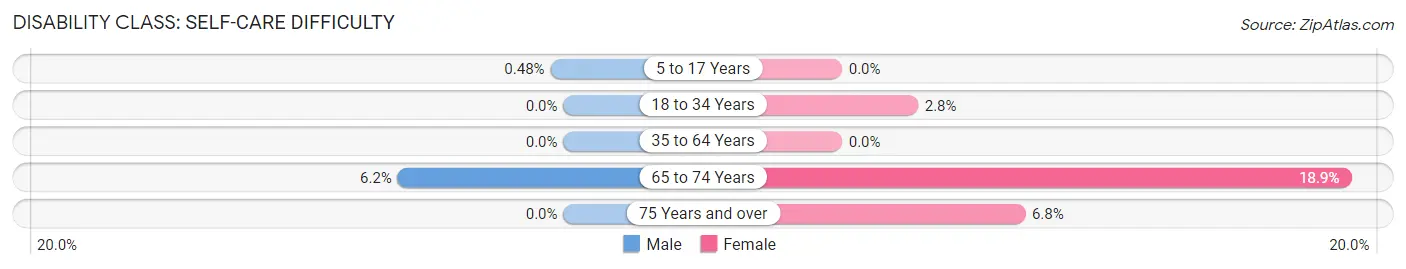
| Age Bracket | Male | Female |
| 5 to 17 Years | 2 (0.5%) | 0 (0.0%) |
| 18 to 34 Years | 0 (0.0%) | 13 (2.8%) |
| 35 to 64 Years | 0 (0.0%) | 0 (0.0%) |
| 65 to 74 Years | 8 (6.1%) | 38 (18.9%) |
| 75 Years and over | 0 (0.0%) | 7 (6.8%) |
Technology Access in Mount Pleasant
Computing Device Access in Mount Pleasant
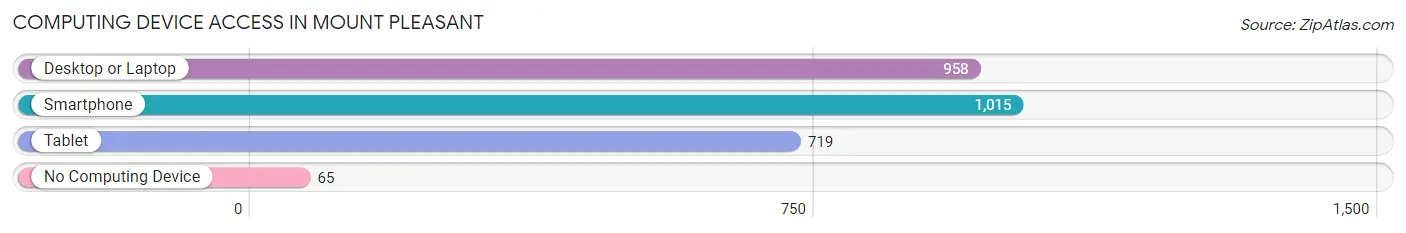
| Device Type | # Households | % Households |
| Desktop or Laptop | 958 | 84.6% |
| Smartphone | 1,015 | 89.6% |
| Tablet | 719 | 63.5% |
| No Computing Device | 65 | 5.7% |
| Total | 1,133 | 100.0% |
Internet Access in Mount Pleasant
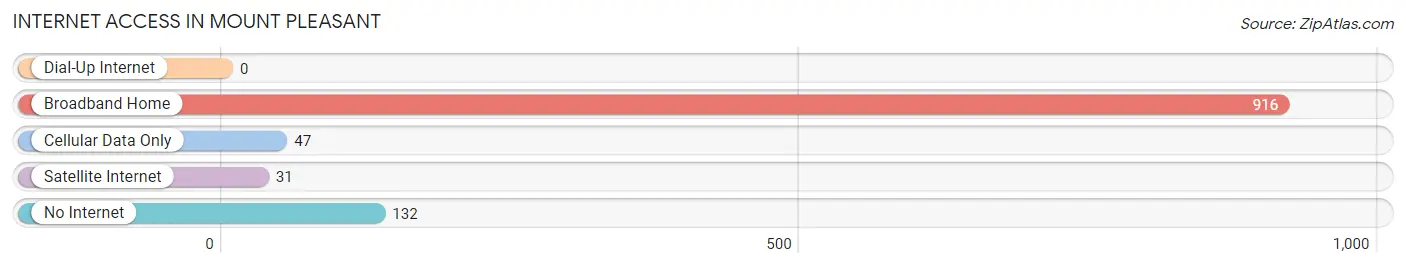
| Internet Type | # Households | % Households |
| Dial-Up Internet | 0 | 0.0% |
| Broadband Home | 916 | 80.8% |
| Cellular Data Only | 47 | 4.2% |
| Satellite Internet | 31 | 2.7% |
| No Internet | 132 | 11.7% |
| Total | 1,133 | 100.0% |
Mount Pleasant Summary
Introduction
Mount Pleasant is a small city located in Sanpete County, Utah. It is situated in the foothills of the Wasatch Mountains, about 90 miles south of Salt Lake City. The city is known for its rich history, beautiful scenery, and friendly people. It is home to a variety of businesses, including a large dairy farm, a cheese factory, and a number of small businesses. The city is also home to a number of churches, schools, and other organizations.
History
Mount Pleasant was first settled in 1859 by a group of Mormon pioneers led by John R. Murdock. The settlers named the area after the nearby mountain, Mount Pleasant. The settlers built a fort and began to farm the land. The town grew slowly, but by the late 1800s, it had become a thriving community.
In the early 1900s, the town began to experience a period of growth. The first school was built in 1906, and the first church was built in 1908. The town also saw the construction of a number of businesses, including a cheese factory, a creamery, and a cannery.
In the 1950s, the town experienced a period of decline. Many of the businesses closed, and the population began to decline. However, in the late 1970s, the town began to experience a period of revitalization. The population began to grow, and new businesses began to open.
Geography
Mount Pleasant is located in the foothills of the Wasatch Mountains, about 90 miles south of Salt Lake City. The city is situated at an elevation of 5,400 feet, and the surrounding area is characterized by rolling hills and lush vegetation. The city is located in a valley, and the surrounding mountains provide a beautiful backdrop.
The climate in Mount Pleasant is generally mild, with warm summers and cold winters. The average temperature in the summer is around 70 degrees Fahrenheit, and the average temperature in the winter is around 30 degrees Fahrenheit.
Economy
The economy of Mount Pleasant is largely based on agriculture and tourism. The city is home to a large dairy farm, a cheese factory, and a number of small businesses. The city is also home to a number of churches, schools, and other organizations.
Tourism is an important part of the economy of Mount Pleasant. The city is home to a number of attractions, including the Sanpete County Historical Museum, the Sanpete County Fairgrounds, and the Sanpete County Arts Council. The city also hosts a number of festivals and events throughout the year, including the Sanpete County Fair and the Sanpete County Music Festival.
Demographics
As of the 2010 census, the population of Mount Pleasant was 3,564. The population is largely white (93.3%), with a small percentage of Hispanic (2.3%) and Native American (1.2%) residents. The median household income is $41,944, and the median age is 33.
Conclusion
Mount Pleasant is a small city located in Sanpete County, Utah. It is situated in the foothills of the Wasatch Mountains, about 90 miles south of Salt Lake City. The city is known for its rich history, beautiful scenery, and friendly people. The economy of Mount Pleasant is largely based on agriculture and tourism, and the population is largely white. The city is home to a number of attractions, including the Sanpete County Historical Museum, the Sanpete County Fairgrounds, and the Sanpete County Arts Council.
Common Questions
What is Per Capita Income in Mount Pleasant?
Per Capita income in Mount Pleasant is $24,017.
What is the Median Family Income in Mount Pleasant?
Median Family Income in Mount Pleasant is $67,188.
What is the Median Household income in Mount Pleasant?
Median Household Income in Mount Pleasant is $61,441.
What is Income or Wage Gap in Mount Pleasant?
Income or Wage Gap in Mount Pleasant is 50.0%.
Women in Mount Pleasant earn 50.0 cents for every dollar earned by a man.
What is Inequality or Gini Index in Mount Pleasant?
Inequality or Gini Index in Mount Pleasant is 0.40.
What is the Total Population of Mount Pleasant?
Total Population of Mount Pleasant is 3,676.
What is the Total Male Population of Mount Pleasant?
Total Male Population of Mount Pleasant is 1,894.
What is the Total Female Population of Mount Pleasant?
Total Female Population of Mount Pleasant is 1,782.
What is the Ratio of Males per 100 Females in Mount Pleasant?
There are 106.29 Males per 100 Females in Mount Pleasant.
What is the Ratio of Females per 100 Males in Mount Pleasant?
There are 94.09 Females per 100 Males in Mount Pleasant.
What is the Median Population Age in Mount Pleasant?
Median Population Age in Mount Pleasant is 31.5 Years.
What is the Average Family Size in Mount Pleasant
Average Family Size in Mount Pleasant is 3.4 People.
What is the Average Household Size in Mount Pleasant
Average Household Size in Mount Pleasant is 3.0 People.
How Large is the Labor Force in Mount Pleasant?
There are 1,730 People in the Labor Forcein in Mount Pleasant.
What is the Percentage of People in the Labor Force in Mount Pleasant?
62.2% of People are in the Labor Force in Mount Pleasant.
What is the Unemployment Rate in Mount Pleasant?
Unemployment Rate in Mount Pleasant is 4.3%.