Alpine, UT Map & Demographics
Alpine Map
Alpine Overview
$58,980
PER CAPITA INCOME
$171,063
AVG FAMILY INCOME
$161,602
AVG HOUSEHOLD INCOME
70.8%
WAGE / INCOME GAP [ % ]
29.2¢/ $1
WAGE / INCOME GAP [ $ ]
0.50
INEQUALITY / GINI INDEX
10,260
TOTAL POPULATION
5,235
MALE POPULATION
5,025
FEMALE POPULATION
104.18
MALES / 100 FEMALES
95.99
FEMALES / 100 MALES
35.0
MEDIAN AGE
3.9
AVG FAMILY SIZE
3.6
AVG HOUSEHOLD SIZE
4,425
LABOR FORCE [ PEOPLE ]
59.2%
PERCENT IN LABOR FORCE
1.6%
UNEMPLOYMENT RATE
Alpine Zip Codes
Income in Alpine
Income Overview in Alpine
Per Capita Income in Alpine is $58,980, while median incomes of families and households are $171,063 and $161,602 respectively.
| Characteristic | Number | Measure |
| Per Capita Income | 10,260 | $58,980 |
| Median Family Income | 2,472 | $171,063 |
| Mean Family Income | 2,472 | $230,844 |
| Median Household Income | 2,837 | $161,602 |
| Mean Household Income | 2,837 | $210,608 |
| Income Deficit | 2,472 | $0 |
| Wage / Income Gap (%) | 10,260 | 70.80% |
| Wage / Income Gap ($) | 10,260 | 29.20¢ per $1 |
| Gini / Inequality Index | 10,260 | 0.50 |
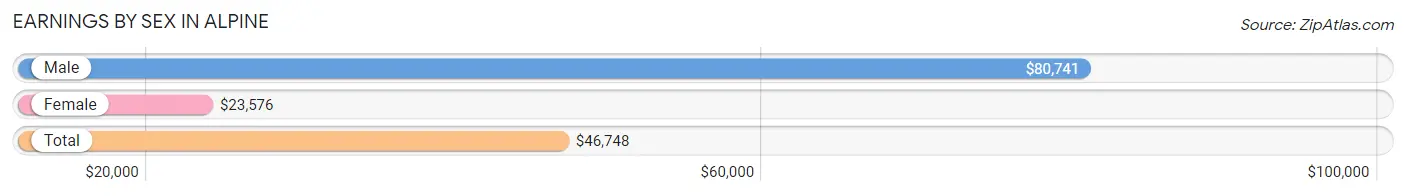
Earnings by Sex in Alpine
Average Earnings in Alpine are $46,748, $80,741 for men and $23,576 for women, a difference of 70.8%.
| Sex | Number | Average Earnings |
| Male | 2,954 (61.6%) | $80,741 |
| Female | 1,841 (38.4%) | $23,576 |
| Total | 4,795 (100.0%) | $46,748 |
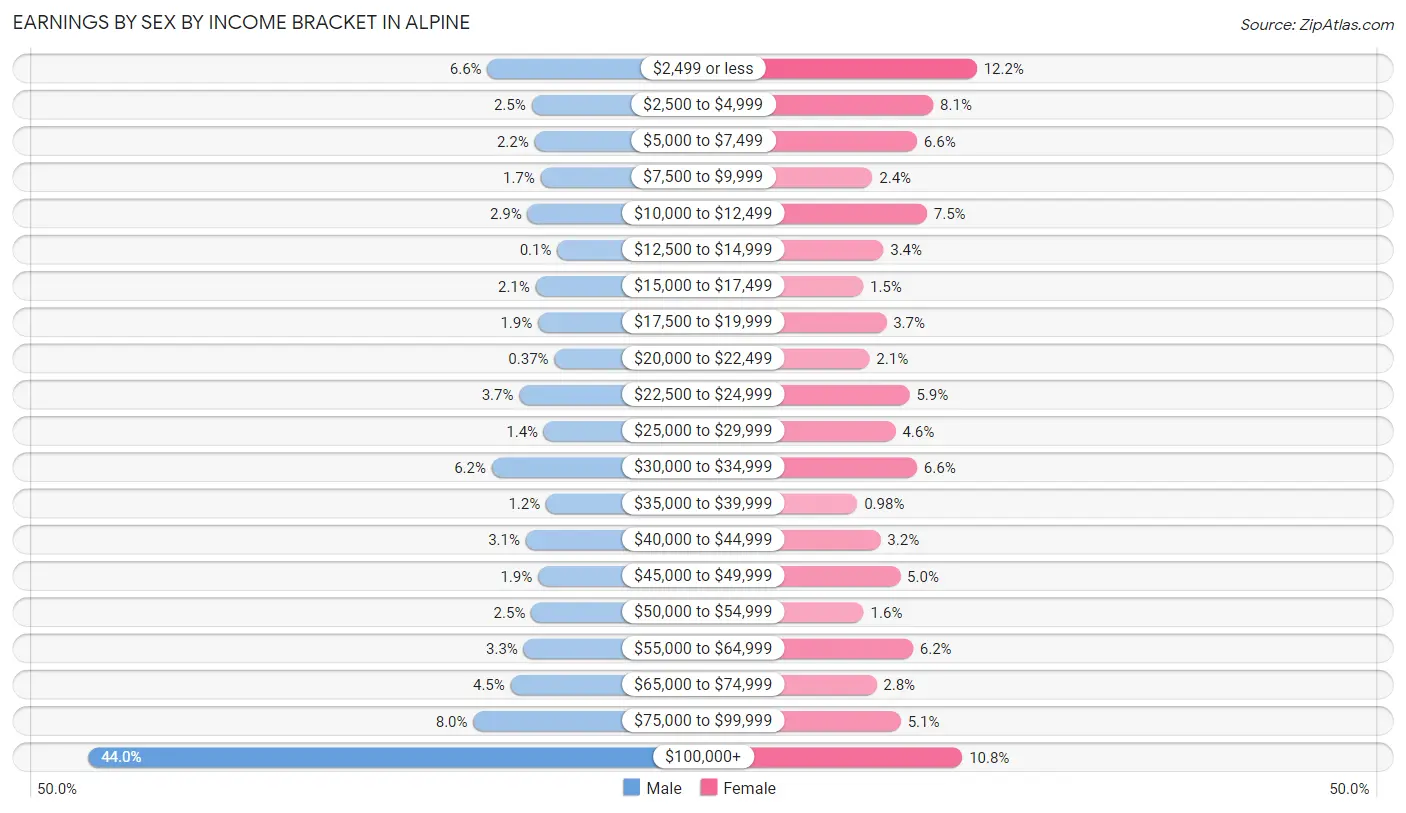
Earnings by Sex by Income Bracket in Alpine
The most common earnings brackets in Alpine are $100,000+ for men (1,301 | 44.0%) and $2,499 or less for women (224 | 12.2%).
| Income | Male | Female |
| $2,499 or less | 196 (6.6%) | 224 (12.2%) |
| $2,500 to $4,999 | 74 (2.5%) | 149 (8.1%) |
| $5,000 to $7,499 | 66 (2.2%) | 121 (6.6%) |
| $7,500 to $9,999 | 49 (1.7%) | 44 (2.4%) |
| $10,000 to $12,499 | 85 (2.9%) | 138 (7.5%) |
| $12,500 to $14,999 | 3 (0.1%) | 63 (3.4%) |
| $15,000 to $17,499 | 63 (2.1%) | 28 (1.5%) |
| $17,500 to $19,999 | 56 (1.9%) | 68 (3.7%) |
| $20,000 to $22,499 | 11 (0.4%) | 39 (2.1%) |
| $22,500 to $24,999 | 108 (3.7%) | 108 (5.9%) |
| $25,000 to $29,999 | 40 (1.3%) | 84 (4.6%) |
| $30,000 to $34,999 | 184 (6.2%) | 121 (6.6%) |
| $35,000 to $39,999 | 34 (1.1%) | 18 (1.0%) |
| $40,000 to $44,999 | 90 (3.0%) | 58 (3.2%) |
| $45,000 to $49,999 | 56 (1.9%) | 92 (5.0%) |
| $50,000 to $54,999 | 75 (2.5%) | 29 (1.6%) |
| $55,000 to $64,999 | 96 (3.3%) | 114 (6.2%) |
| $65,000 to $74,999 | 132 (4.5%) | 51 (2.8%) |
| $75,000 to $99,999 | 235 (8.0%) | 93 (5.1%) |
| $100,000+ | 1,301 (44.0%) | 199 (10.8%) |
| Total | 2,954 (100.0%) | 1,841 (100.0%) |
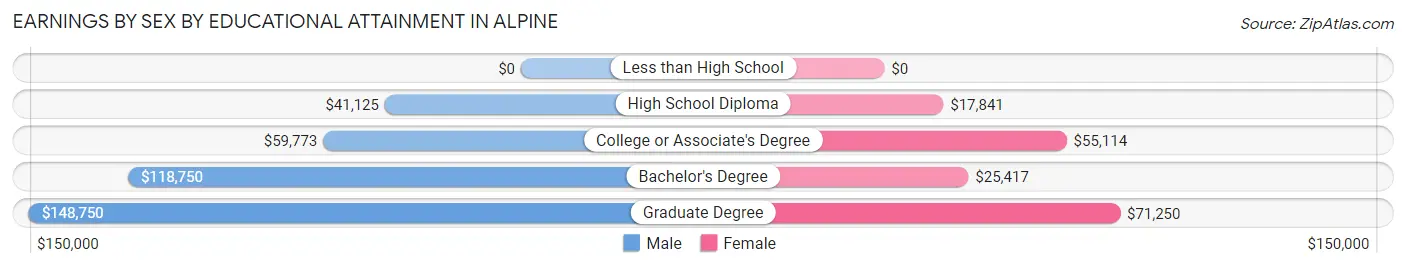
Earnings by Sex by Educational Attainment in Alpine
Average earnings in Alpine are $104,130 for men and $39,583 for women, a difference of 62.0%. Men with an educational attainment of graduate degree enjoy the highest average annual earnings of $148,750, while those with high school diploma education earn the least with $41,125. Women with an educational attainment of graduate degree earn the most with the average annual earnings of $71,250, while those with high school diploma education have the smallest earnings of $17,841.
| Educational Attainment | Male Income | Female Income |
| Less than High School | - | - |
| High School Diploma | $41,125 | $17,841 |
| College or Associate's Degree | $59,773 | $55,114 |
| Bachelor's Degree | $118,750 | $25,417 |
| Graduate Degree | $148,750 | $71,250 |
| Total | $104,130 | $39,583 |
Family Income in Alpine
Family Income Brackets in Alpine
According to the Alpine family income data, there are 934 families falling into the $200,000+ income range, which is the most common income bracket and makes up 37.8% of all families. Conversely, the $10,000 to $14,999 income bracket is the least frequent group with only 5 families (0.2%) belonging to this category.
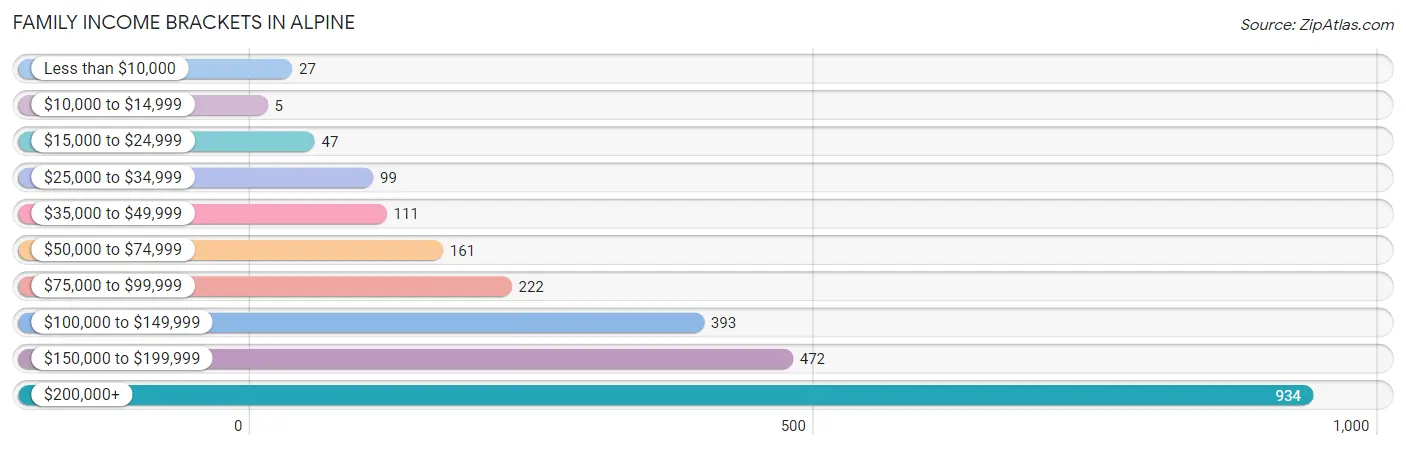
| Income Bracket | # Families | % Families |
| Less than $10,000 | 27 | 1.1% |
| $10,000 to $14,999 | 5 | 0.2% |
| $15,000 to $24,999 | 47 | 1.9% |
| $25,000 to $34,999 | 99 | 4.0% |
| $35,000 to $49,999 | 111 | 4.5% |
| $50,000 to $74,999 | 161 | 6.5% |
| $75,000 to $99,999 | 222 | 9.0% |
| $100,000 to $149,999 | 393 | 15.9% |
| $150,000 to $199,999 | 472 | 19.1% |
| $200,000+ | 934 | 37.8% |
Family Income by Famaliy Size in Alpine
4-person families (461 | 18.6%) account for the highest median family income in Alpine with $200,656 per family, while 2-person families (852 | 34.5%) have the highest median income of $61,696 per family member.
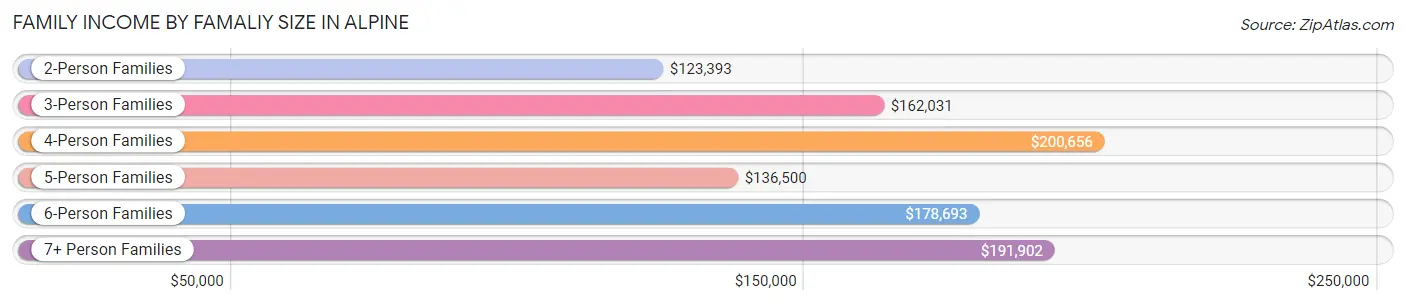
| Income Bracket | # Families | Median Income |
| 2-Person Families | 852 (34.5%) | $123,393 |
| 3-Person Families | 341 (13.8%) | $162,031 |
| 4-Person Families | 461 (18.6%) | $200,656 |
| 5-Person Families | 294 (11.9%) | $136,500 |
| 6-Person Families | 289 (11.7%) | $178,693 |
| 7+ Person Families | 235 (9.5%) | $191,902 |
| Total | 2,472 (100.0%) | $171,063 |
Family Income by Number of Earners in Alpine
The median family income in Alpine is $171,063, with families comprising 3+ earners (531) having the highest median family income of $213,092, while families with no earners (331) have the lowest median family income of $84,844, accounting for 21.5% and 13.4% of families, respectively.
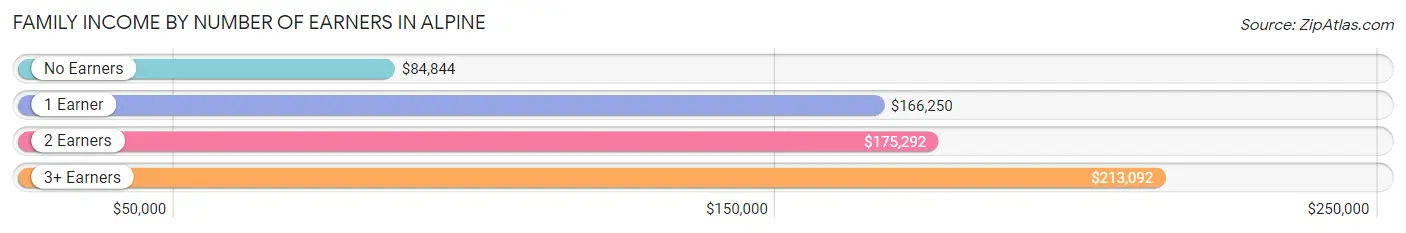
| Number of Earners | # Families | Median Income |
| No Earners | 331 (13.4%) | $84,844 |
| 1 Earner | 717 (29.0%) | $166,250 |
| 2 Earners | 893 (36.1%) | $175,292 |
| 3+ Earners | 531 (21.5%) | $213,092 |
| Total | 2,472 (100.0%) | $171,063 |
Household Income in Alpine
Household Income Brackets in Alpine
With 993 households falling in the category, the $200,000+ income range is the most frequent in Alpine, accounting for 35.0% of all households. In contrast, only 14 households (0.5%) fall into the $10,000 to $14,999 income bracket, making it the least populous group.
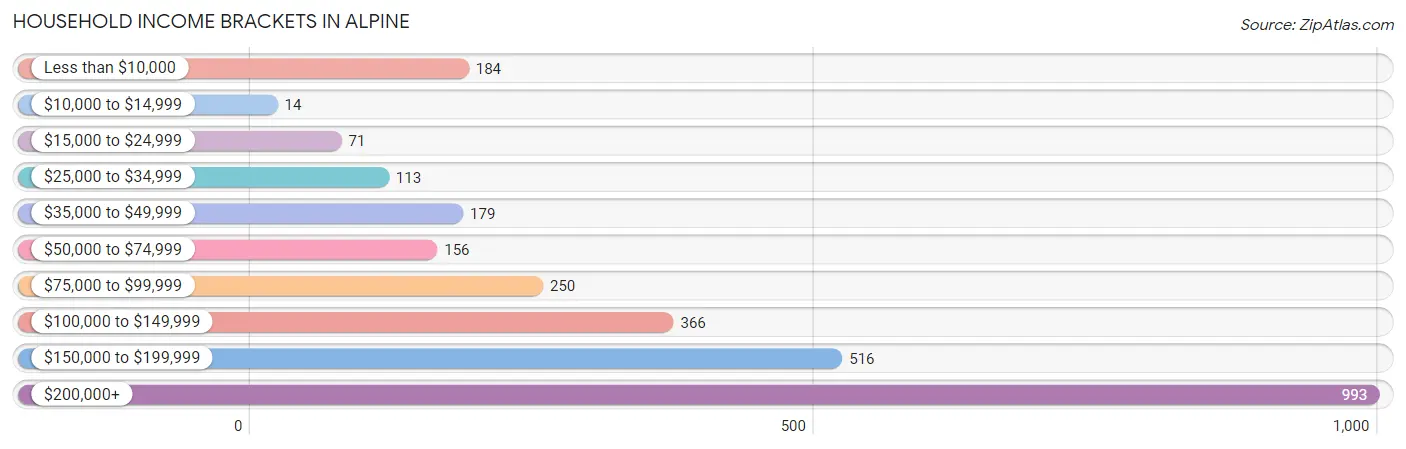
| Income Bracket | # Households | % Households |
| Less than $10,000 | 184 | 6.5% |
| $10,000 to $14,999 | 14 | 0.5% |
| $15,000 to $24,999 | 71 | 2.5% |
| $25,000 to $34,999 | 113 | 4.0% |
| $35,000 to $49,999 | 179 | 6.3% |
| $50,000 to $74,999 | 156 | 5.5% |
| $75,000 to $99,999 | 250 | 8.8% |
| $100,000 to $149,999 | 366 | 12.9% |
| $150,000 to $199,999 | 516 | 18.2% |
| $200,000+ | 993 | 35.0% |
Household Income by Householder Age in Alpine
The median household income in Alpine is $161,602, with the highest median household income of $193,750 found in the 45 to 64 years age bracket for the primary householder. A total of 1,274 households (44.9%) fall into this category. Meanwhile, the 15 to 24 years age bracket for the primary householder has the lowest median household income of $73,750, with 68 households (2.4%) in this group.
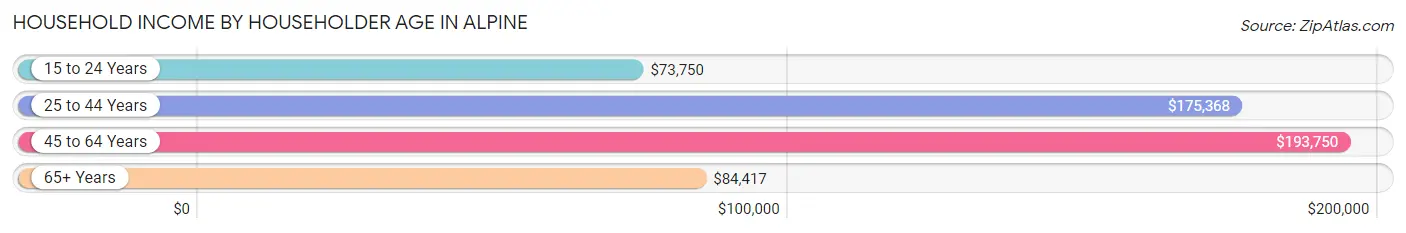
| Income Bracket | # Households | Median Income |
| 15 to 24 Years | 68 (2.4%) | $73,750 |
| 25 to 44 Years | 612 (21.6%) | $175,368 |
| 45 to 64 Years | 1,274 (44.9%) | $193,750 |
| 65+ Years | 883 (31.1%) | $84,417 |
| Total | 2,837 (100.0%) | $161,602 |
Poverty in Alpine
Income Below Poverty by Sex and Age in Alpine
With 7.6% poverty level for males and 5.3% for females among the residents of Alpine, 75 year old and over males and 45 to 54 year old females are the most vulnerable to poverty, with 131 males (33.5%) and 77 females (11.7%) in their respective age groups living below the poverty level.
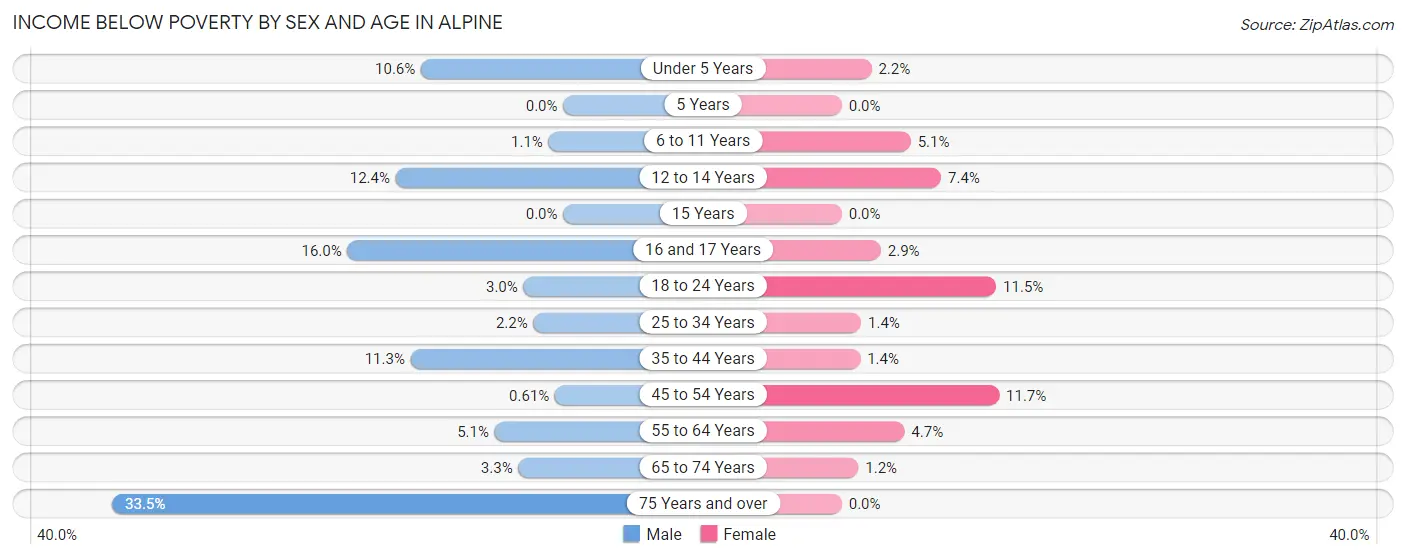
| Age Bracket | Male | Female |
| Under 5 Years | 32 (10.6%) | 4 (2.2%) |
| 5 Years | 0 (0.0%) | 0 (0.0%) |
| 6 to 11 Years | 5 (1.1%) | 30 (5.1%) |
| 12 to 14 Years | 51 (12.4%) | 33 (7.4%) |
| 15 Years | 0 (0.0%) | 0 (0.0%) |
| 16 and 17 Years | 41 (16.0%) | 8 (2.9%) |
| 18 to 24 Years | 15 (2.9%) | 66 (11.5%) |
| 25 to 34 Years | 10 (2.2%) | 4 (1.4%) |
| 35 to 44 Years | 58 (11.3%) | 7 (1.4%) |
| 45 to 54 Years | 4 (0.6%) | 77 (11.7%) |
| 55 to 64 Years | 35 (5.1%) | 31 (4.6%) |
| 65 to 74 Years | 15 (3.3%) | 4 (1.2%) |
| 75 Years and over | 131 (33.5%) | 0 (0.0%) |
| Total | 397 (7.6%) | 264 (5.3%) |
Income Above Poverty by Sex and Age in Alpine
According to the poverty statistics in Alpine, males aged 5 years and females aged 5 years are the age groups that are most secure financially, with 100.0% of males and 100.0% of females in these age groups living above the poverty line.
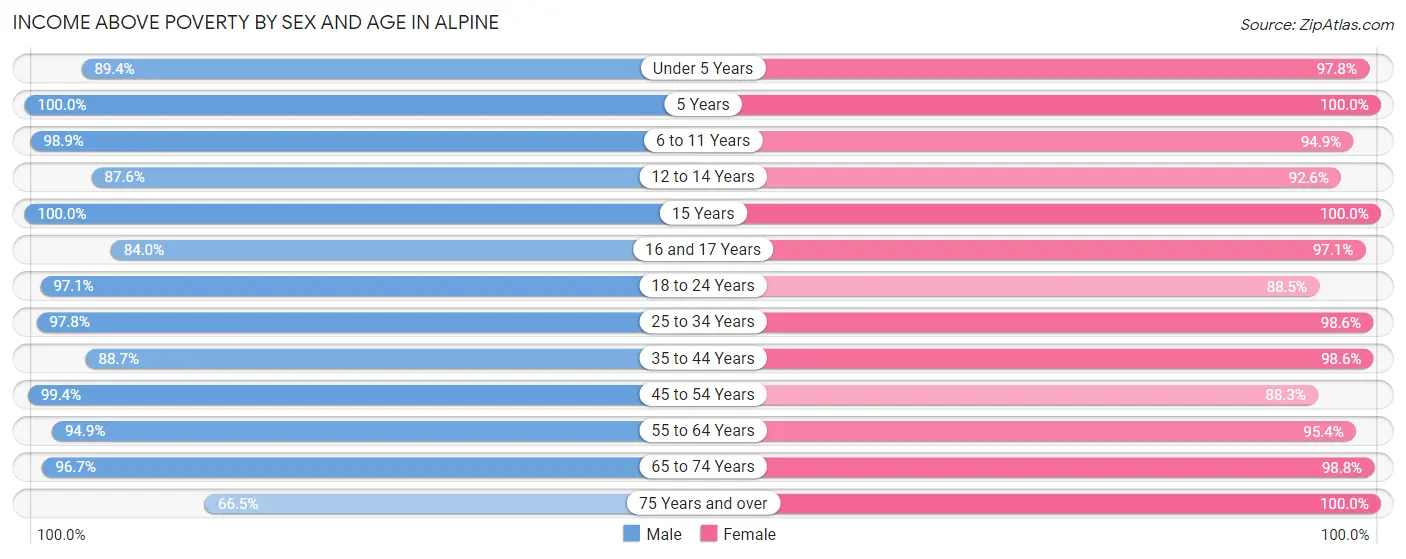
| Age Bracket | Male | Female |
| Under 5 Years | 271 (89.4%) | 178 (97.8%) |
| 5 Years | 62 (100.0%) | 90 (100.0%) |
| 6 to 11 Years | 452 (98.9%) | 556 (94.9%) |
| 12 to 14 Years | 359 (87.6%) | 415 (92.6%) |
| 15 Years | 87 (100.0%) | 143 (100.0%) |
| 16 and 17 Years | 215 (84.0%) | 268 (97.1%) |
| 18 to 24 Years | 493 (97.1%) | 510 (88.5%) |
| 25 to 34 Years | 442 (97.8%) | 276 (98.6%) |
| 35 to 44 Years | 454 (88.7%) | 505 (98.6%) |
| 45 to 54 Years | 655 (99.4%) | 582 (88.3%) |
| 55 to 64 Years | 653 (94.9%) | 635 (95.4%) |
| 65 to 74 Years | 435 (96.7%) | 321 (98.8%) |
| 75 Years and over | 260 (66.5%) | 265 (100.0%) |
| Total | 4,838 (92.4%) | 4,744 (94.7%) |
Income Below Poverty Among Married-Couple Families in Alpine
The poverty statistics for married-couple families in Alpine show that 3.7% or 86 of the total 2,348 families live below the poverty line. Families with 3 or 4 children have the highest poverty rate of 12.1%, comprising of 55 families. On the other hand, families with 5 or more children have the lowest poverty rate of 0.0%, which includes 0 families.
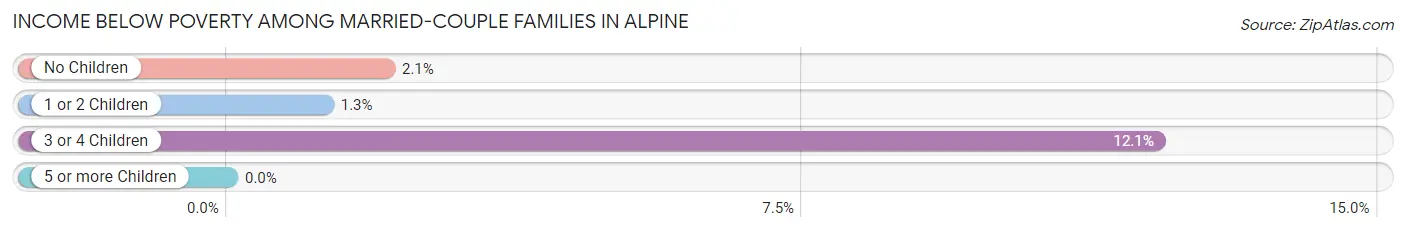
| Children | Above Poverty | Below Poverty |
| No Children | 1,144 (98.0%) | 24 (2.1%) |
| 1 or 2 Children | 551 (98.8%) | 7 (1.3%) |
| 3 or 4 Children | 399 (87.9%) | 55 (12.1%) |
| 5 or more Children | 168 (100.0%) | 0 (0.0%) |
| Total | 2,262 (96.3%) | 86 (3.7%) |
Income Below Poverty Among Single-Parent Households in Alpine
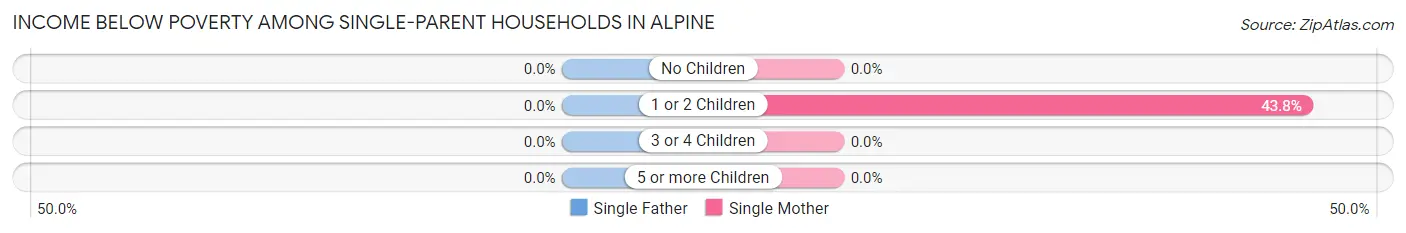
| Children | Single Father | Single Mother |
| No Children | 0 (0.0%) | 0 (0.0%) |
| 1 or 2 Children | 0 (0.0%) | 21 (43.8%) |
| 3 or 4 Children | 0 (0.0%) | 0 (0.0%) |
| 5 or more Children | 0 (0.0%) | 0 (0.0%) |
| Total | 0 (0.0%) | 21 (21.0%) |
Income Below Poverty Among Married-Couple vs Single-Parent Households in Alpine
The poverty data for Alpine shows that 86 of the married-couple family households (3.7%) and 21 of the single-parent households (16.9%) are living below the poverty level. Within the married-couple family households, those with 3 or 4 children have the highest poverty rate, with 55 households (12.1%) falling below the poverty line. Among the single-parent households, those with 1 or 2 children have the highest poverty rate, with 21 household (32.3%) living below poverty.
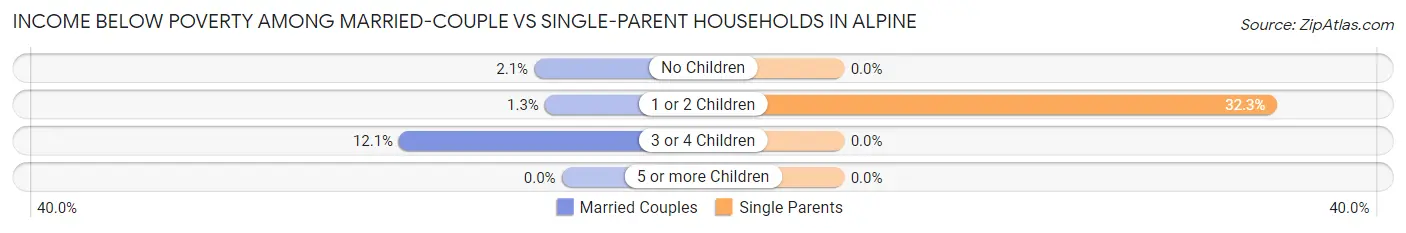
| Children | Married-Couple Families | Single-Parent Households |
| No Children | 24 (2.1%) | 0 (0.0%) |
| 1 or 2 Children | 7 (1.3%) | 21 (32.3%) |
| 3 or 4 Children | 55 (12.1%) | 0 (0.0%) |
| 5 or more Children | 0 (0.0%) | 0 (0.0%) |
| Total | 86 (3.7%) | 21 (16.9%) |
Race in Alpine
The most populous races in Alpine are White / Caucasian (9,525 | 92.8%), Two or more Races (508 | 5.0%), and Hispanic or Latino (349 | 3.4%).
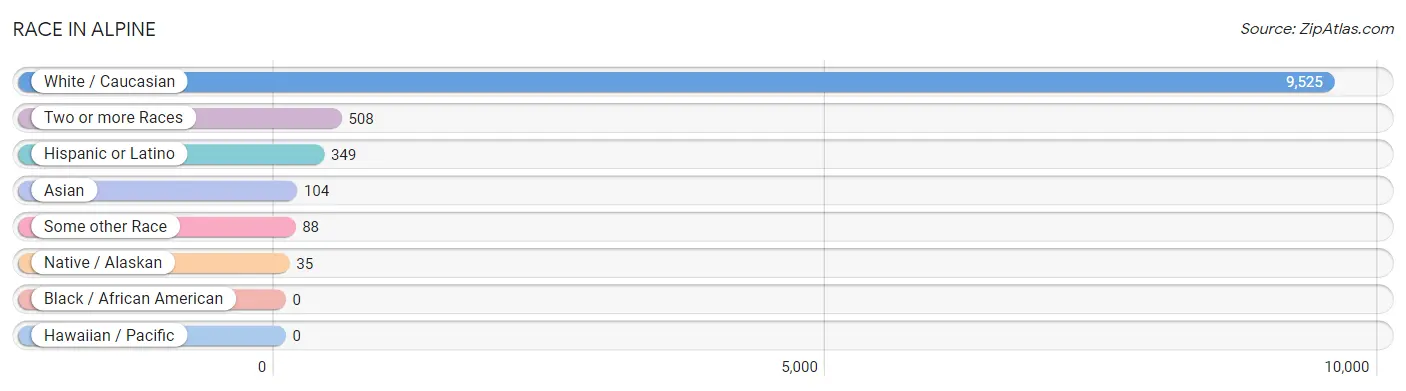
| Race | # Population | % Population |
| Asian | 104 | 1.0% |
| Black / African American | 0 | 0.0% |
| Hawaiian / Pacific | 0 | 0.0% |
| Hispanic or Latino | 349 | 3.4% |
| Native / Alaskan | 35 | 0.3% |
| White / Caucasian | 9,525 | 92.8% |
| Two or more Races | 508 | 5.0% |
| Some other Race | 88 | 0.9% |
| Total | 10,260 | 100.0% |
Ancestry in Alpine
The most populous ancestries reported in Alpine are English (3,888 | 37.9%), German (1,171 | 11.4%), Scottish (580 | 5.7%), European (537 | 5.2%), and Danish (534 | 5.2%), together accounting for 65.4% of all Alpine residents.
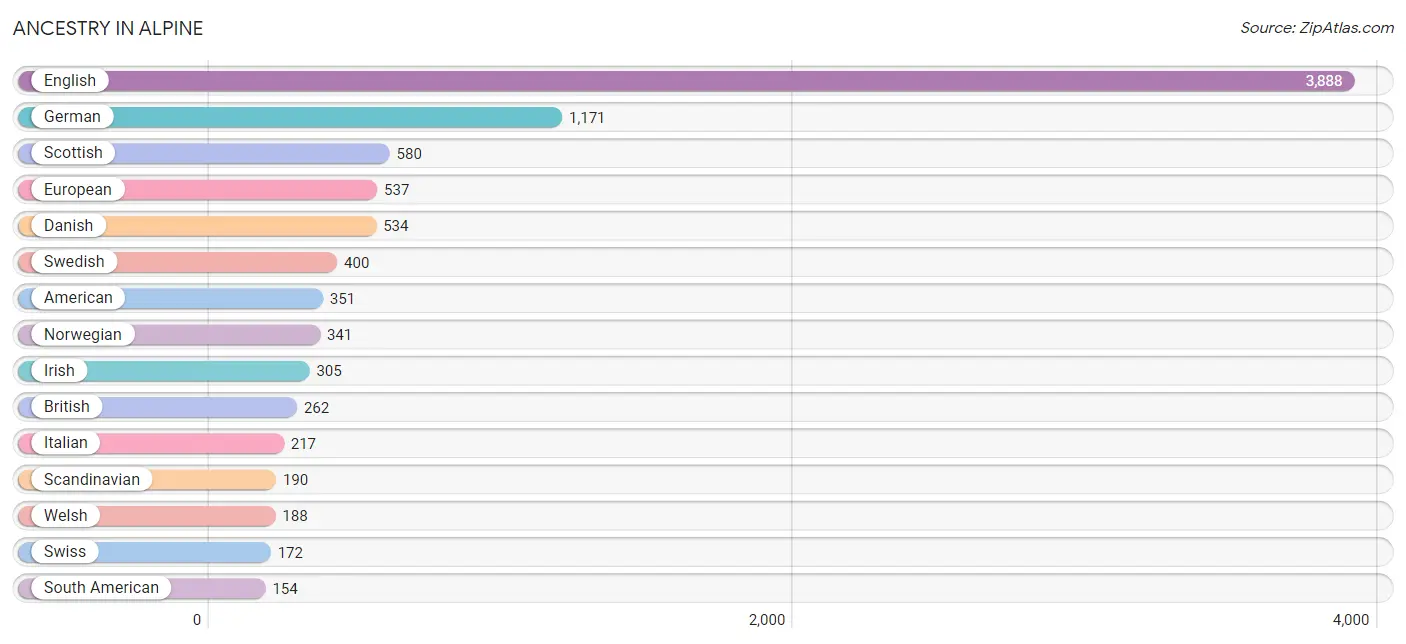
| Ancestry | # Population | % Population |
| American | 351 | 3.4% |
| Apache | 5 | 0.1% |
| Arab | 46 | 0.4% |
| Argentinean | 62 | 0.6% |
| Armenian | 34 | 0.3% |
| Australian | 5 | 0.1% |
| Austrian | 8 | 0.1% |
| Bangladeshi | 14 | 0.1% |
| Belgian | 10 | 0.1% |
| Bhutanese | 104 | 1.0% |
| British | 262 | 2.5% |
| Canadian | 8 | 0.1% |
| Central American | 10 | 0.1% |
| Central American Indian | 4 | 0.0% |
| Cherokee | 10 | 0.1% |
| Chilean | 5 | 0.1% |
| Comanche | 9 | 0.1% |
| Cuban | 12 | 0.1% |
| Danish | 534 | 5.2% |
| Dutch | 137 | 1.3% |
| Eastern European | 6 | 0.1% |
| Egyptian | 31 | 0.3% |
| English | 3,888 | 37.9% |
| European | 537 | 5.2% |
| Finnish | 58 | 0.6% |
| French | 95 | 0.9% |
| German | 1,171 | 11.4% |
| German Russian | 10 | 0.1% |
| Greek | 34 | 0.3% |
| Guatemalan | 5 | 0.1% |
| Hungarian | 18 | 0.2% |
| Icelander | 19 | 0.2% |
| Indian (Asian) | 59 | 0.6% |
| Irish | 305 | 3.0% |
| Italian | 217 | 2.1% |
| Lebanese | 6 | 0.1% |
| Mexican | 124 | 1.2% |
| Moroccan | 9 | 0.1% |
| Navajo | 26 | 0.3% |
| Norwegian | 341 | 3.3% |
| Pakistani | 9 | 0.1% |
| Peruvian | 8 | 0.1% |
| Polish | 21 | 0.2% |
| Portuguese | 43 | 0.4% |
| Puerto Rican | 35 | 0.3% |
| Russian | 10 | 0.1% |
| Salvadoran | 5 | 0.1% |
| Samoan | 123 | 1.2% |
| Scandinavian | 190 | 1.8% |
| Scotch-Irish | 28 | 0.3% |
| Scottish | 580 | 5.7% |
| South American | 154 | 1.5% |
| Spaniard | 10 | 0.1% |
| Spanish | 4 | 0.0% |
| Sri Lankan | 8 | 0.1% |
| Swedish | 400 | 3.9% |
| Swiss | 172 | 1.7% |
| Thai | 7 | 0.1% |
| Venezuelan | 79 | 0.8% |
| Welsh | 188 | 1.8% |
| Yugoslavian | 10 | 0.1% | View All 61 Rows |
Immigrants in Alpine
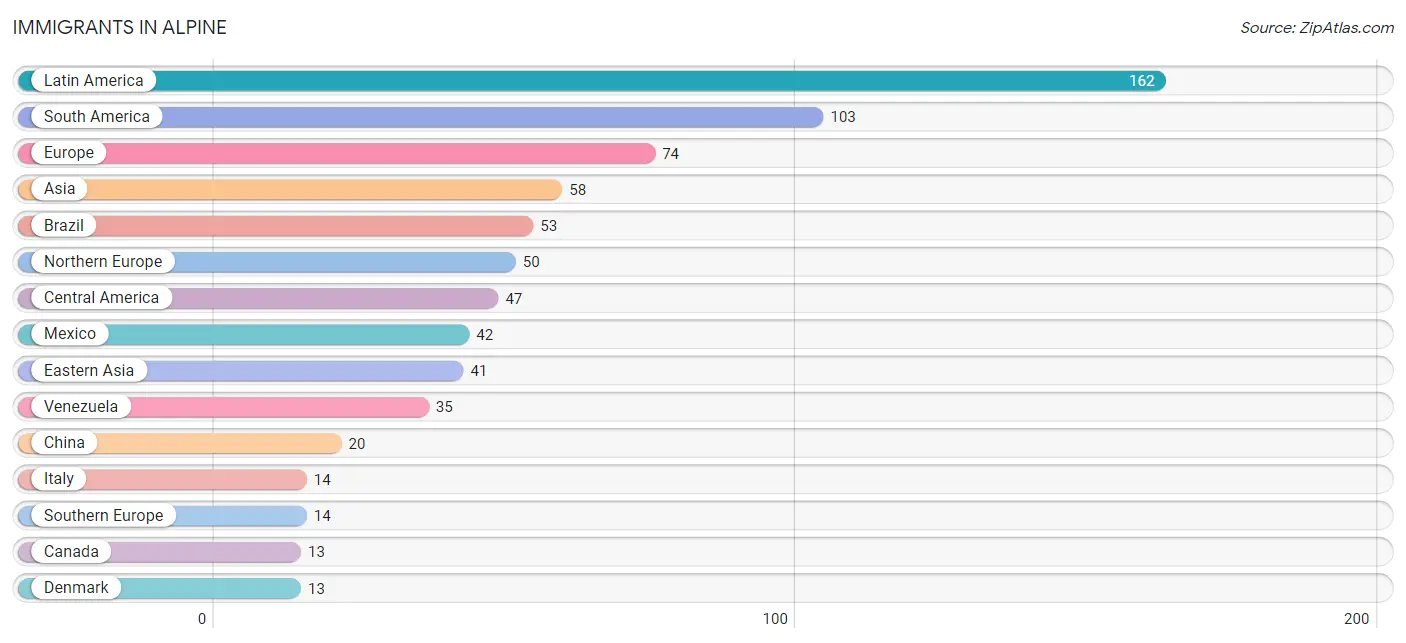
The most numerous immigrant groups reported in Alpine came from Latin America (162 | 1.6%), South America (103 | 1.0%), Europe (74 | 0.7%), Asia (58 | 0.6%), and Brazil (53 | 0.5%), together accounting for 4.4% of all Alpine residents.
| Immigration Origin | # Population | % Population |
| Argentina | 10 | 0.1% |
| Asia | 58 | 0.6% |
| Australia | 5 | 0.1% |
| Belgium | 10 | 0.1% |
| Brazil | 53 | 0.5% |
| Canada | 13 | 0.1% |
| Caribbean | 12 | 0.1% |
| Central America | 47 | 0.5% |
| Chile | 5 | 0.1% |
| China | 20 | 0.2% |
| Cuba | 12 | 0.1% |
| Denmark | 13 | 0.1% |
| Eastern Asia | 41 | 0.4% |
| Europe | 74 | 0.7% |
| Guatemala | 5 | 0.1% |
| India | 7 | 0.1% |
| Ireland | 5 | 0.1% |
| Italy | 14 | 0.1% |
| Kazakhstan | 6 | 0.1% |
| Latin America | 162 | 1.6% |
| Mexico | 42 | 0.4% |
| Northern Europe | 50 | 0.5% |
| Oceania | 5 | 0.1% |
| South America | 103 | 1.0% |
| South Central Asia | 13 | 0.1% |
| South Eastern Asia | 4 | 0.0% |
| Southern Europe | 14 | 0.1% |
| Taiwan | 5 | 0.1% |
| Venezuela | 35 | 0.3% |
| Vietnam | 4 | 0.0% |
| Western Europe | 10 | 0.1% | View All 31 Rows |
Sex and Age in Alpine
Sex and Age in Alpine
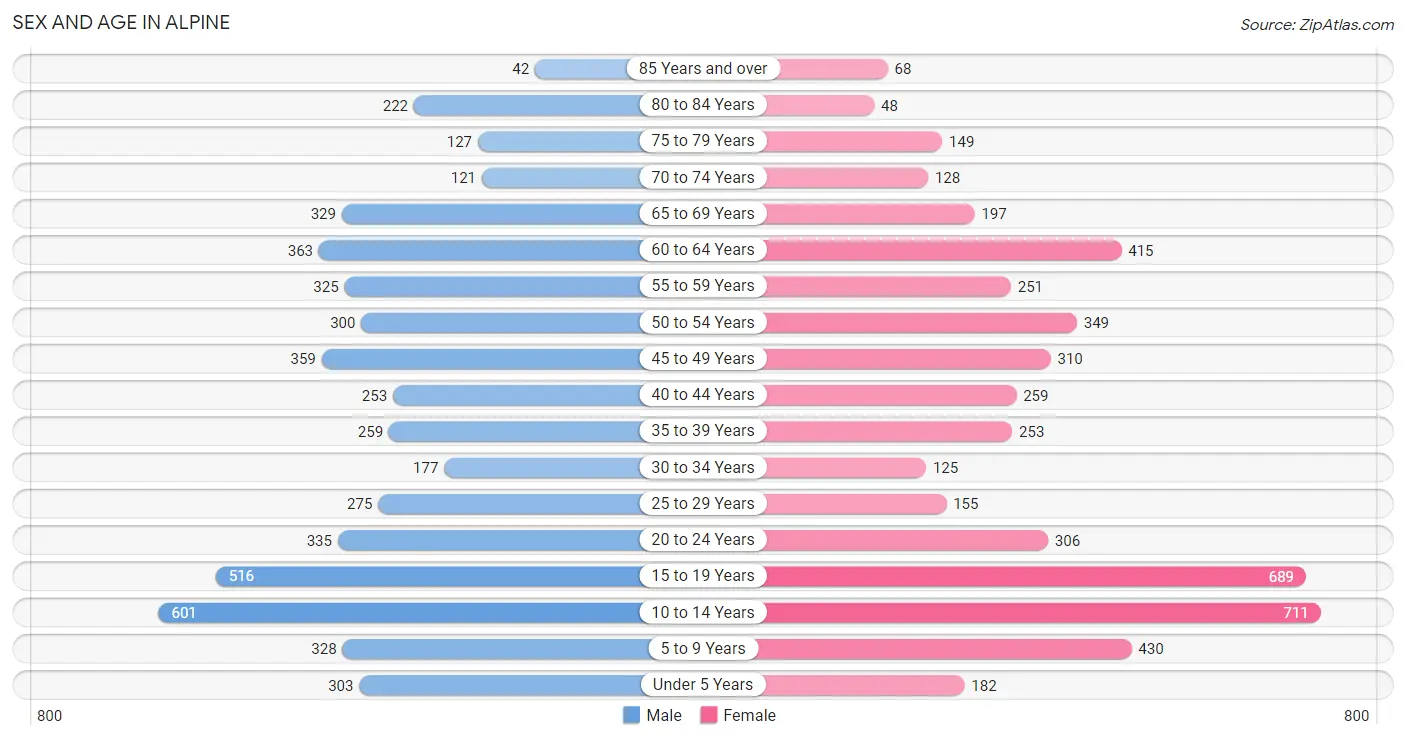
The most populous age groups in Alpine are 10 to 14 Years (601 | 11.5%) for men and 10 to 14 Years (711 | 14.1%) for women.
| Age Bracket | Male | Female |
| Under 5 Years | 303 (5.8%) | 182 (3.6%) |
| 5 to 9 Years | 328 (6.3%) | 430 (8.6%) |
| 10 to 14 Years | 601 (11.5%) | 711 (14.1%) |
| 15 to 19 Years | 516 (9.9%) | 689 (13.7%) |
| 20 to 24 Years | 335 (6.4%) | 306 (6.1%) |
| 25 to 29 Years | 275 (5.2%) | 155 (3.1%) |
| 30 to 34 Years | 177 (3.4%) | 125 (2.5%) |
| 35 to 39 Years | 259 (5.0%) | 253 (5.0%) |
| 40 to 44 Years | 253 (4.8%) | 259 (5.1%) |
| 45 to 49 Years | 359 (6.9%) | 310 (6.2%) |
| 50 to 54 Years | 300 (5.7%) | 349 (7.0%) |
| 55 to 59 Years | 325 (6.2%) | 251 (5.0%) |
| 60 to 64 Years | 363 (6.9%) | 415 (8.3%) |
| 65 to 69 Years | 329 (6.3%) | 197 (3.9%) |
| 70 to 74 Years | 121 (2.3%) | 128 (2.5%) |
| 75 to 79 Years | 127 (2.4%) | 149 (3.0%) |
| 80 to 84 Years | 222 (4.2%) | 48 (1.0%) |
| 85 Years and over | 42 (0.8%) | 68 (1.3%) |
| Total | 5,235 (100.0%) | 5,025 (100.0%) |
Families and Households in Alpine
Median Family Size in Alpine
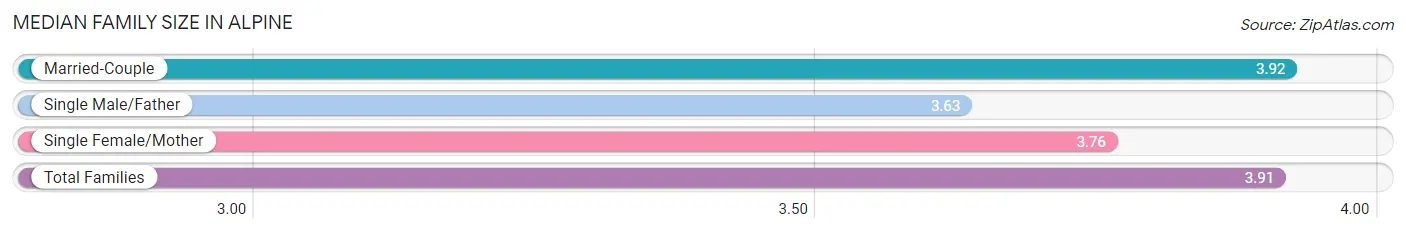
The median family size in Alpine is 3.91 persons per family, with married-couple families (2,348 | 95.0%) accounting for the largest median family size of 3.92 persons per family. On the other hand, single male/father families (24 | 1.0%) represent the smallest median family size with 3.63 persons per family.
| Family Type | # Families | Family Size |
| Married-Couple | 2,348 (95.0%) | 3.92 |
| Single Male/Father | 24 (1.0%) | 3.63 |
| Single Female/Mother | 100 (4.1%) | 3.76 |
| Total Families | 2,472 (100.0%) | 3.91 |
Median Household Size in Alpine
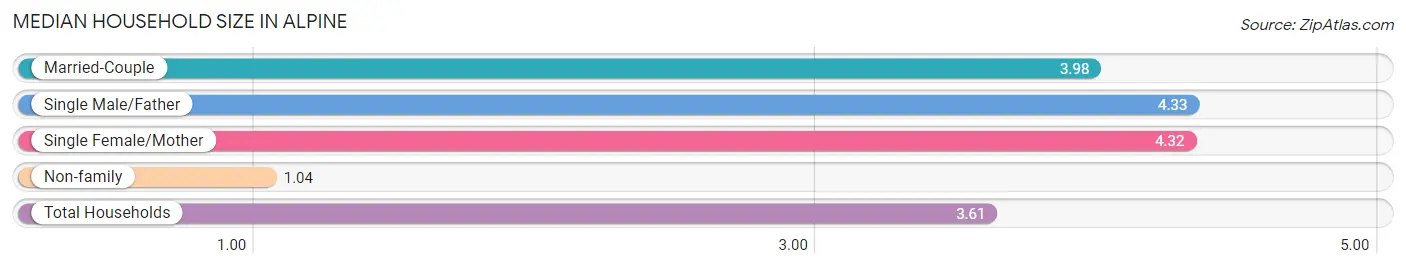
The median household size in Alpine is 3.61 persons per household, with single male/father households (24 | 0.9%) accounting for the largest median household size of 4.33 persons per household. non-family households (365 | 12.9%) represent the smallest median household size with 1.04 persons per household.
| Household Type | # Households | Household Size |
| Married-Couple | 2,348 (82.8%) | 3.98 |
| Single Male/Father | 24 (0.9%) | 4.33 |
| Single Female/Mother | 100 (3.5%) | 4.32 |
| Non-family | 365 (12.9%) | 1.04 |
| Total Households | 2,837 (100.0%) | 3.61 |
Household Size by Marriage Status in Alpine
Out of a total of 2,837 households in Alpine, 2,472 (87.1%) are family households, while 365 (12.9%) are nonfamily households. The most numerous type of family households are 2-person households, comprising 788, and the most common type of nonfamily households are 1-person households, comprising 353.
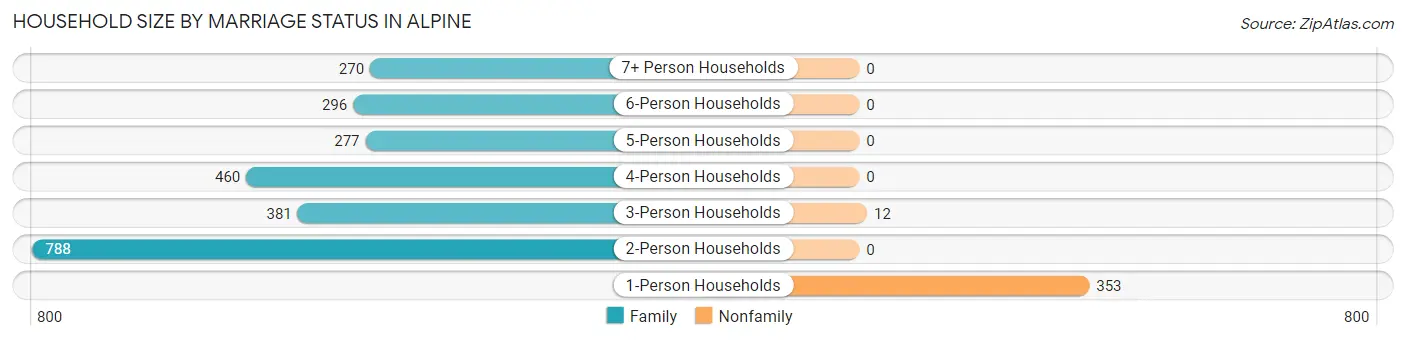
| Household Size | Family Households | Nonfamily Households |
| 1-Person Households | - | 353 (12.4%) |
| 2-Person Households | 788 (27.8%) | 0 (0.0%) |
| 3-Person Households | 381 (13.4%) | 12 (0.4%) |
| 4-Person Households | 460 (16.2%) | 0 (0.0%) |
| 5-Person Households | 277 (9.8%) | 0 (0.0%) |
| 6-Person Households | 296 (10.4%) | 0 (0.0%) |
| 7+ Person Households | 270 (9.5%) | 0 (0.0%) |
| Total | 2,472 (87.1%) | 365 (12.9%) |
Female Fertility in Alpine
Fertility by Age in Alpine
Average fertility rate in Alpine is 34.0 births per 1,000 women. Women in the age bracket of 20 to 34 years have the highest fertility rate with 111.0 births per 1,000 women. Women in the age bracket of 20 to 34 years acount for 87.8% of all women with births.
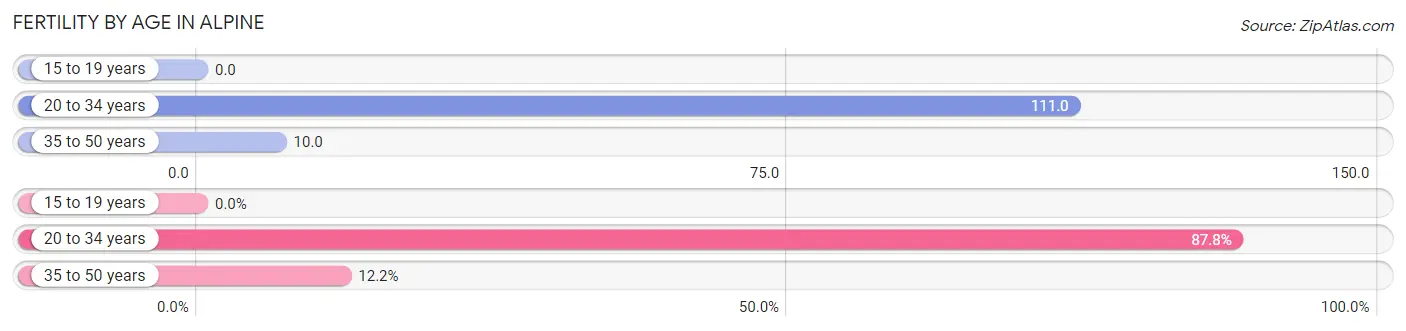
| Age Bracket | Women with Births | Births / 1,000 Women |
| 15 to 19 years | 0 (0.0%) | 0.0 |
| 20 to 34 years | 65 (87.8%) | 111.0 |
| 35 to 50 years | 9 (12.2%) | 10.0 |
| Total | 74 (100.0%) | 34.0 |
Fertility by Age by Marriage Status in Alpine
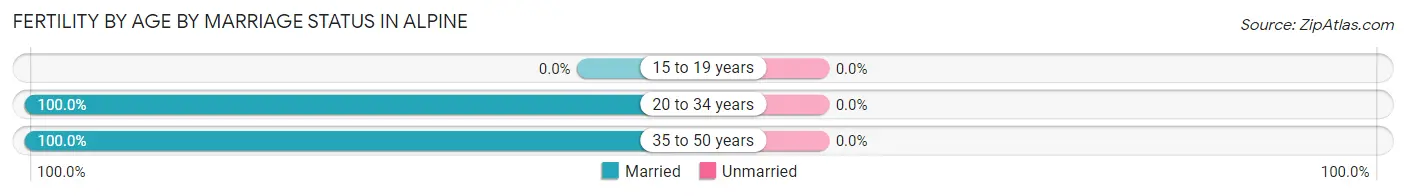
| Age Bracket | Married | Unmarried |
| 15 to 19 years | 0 (0.0%) | 0 (0.0%) |
| 20 to 34 years | 65 (100.0%) | 0 (0.0%) |
| 35 to 50 years | 9 (100.0%) | 0 (0.0%) |
| Total | 74 (100.0%) | 0 (0.0%) |
Fertility by Education in Alpine
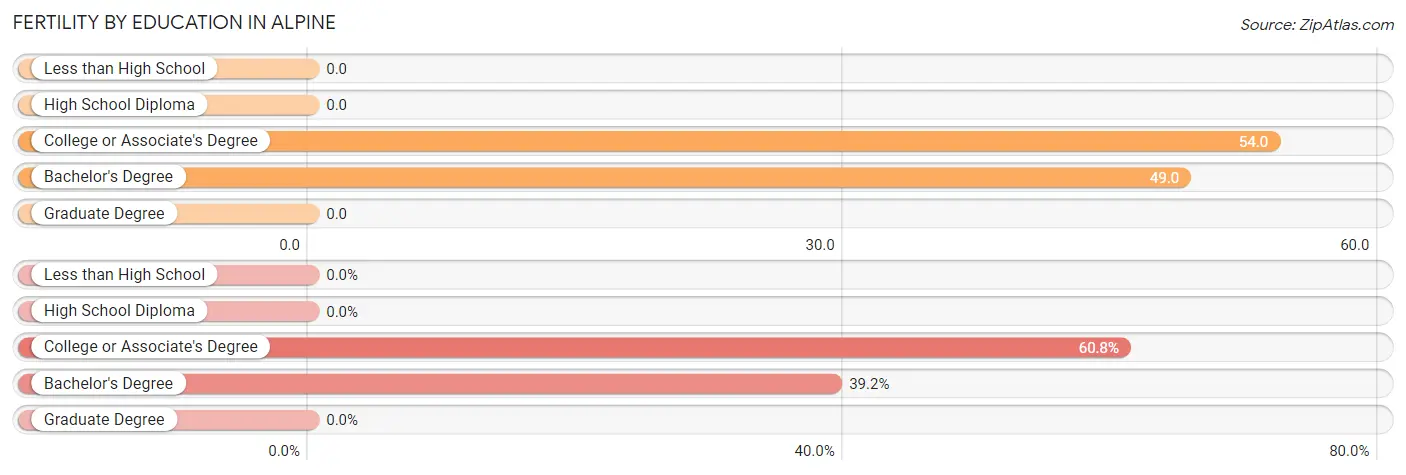
| Educational Attainment | Women with Births | Births / 1,000 Women |
| Less than High School | 0 (0.0%) | 0.0 |
| High School Diploma | 0 (0.0%) | 0.0 |
| College or Associate's Degree | 45 (60.8%) | 54.0 |
| Bachelor's Degree | 29 (39.2%) | 49.0 |
| Graduate Degree | 0 (0.0%) | 0.0 |
| Total | 74 (100.0%) | 34.0 |
Fertility by Education by Marriage Status in Alpine
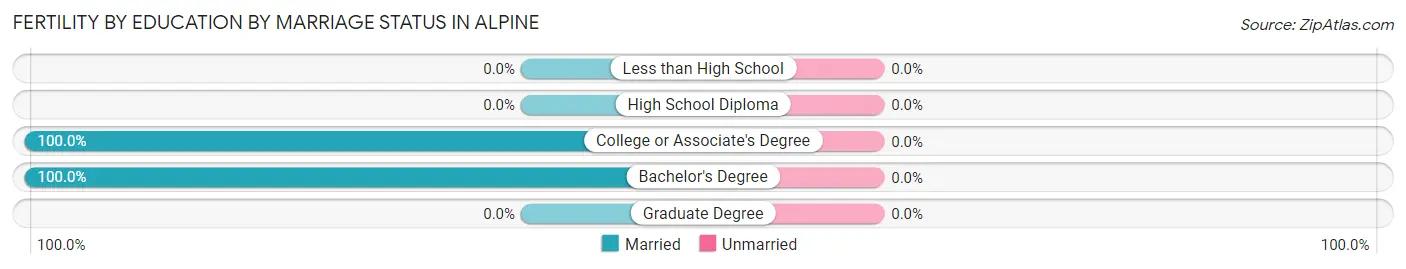
| Educational Attainment | Married | Unmarried |
| Less than High School | 0 (0.0%) | 0 (0.0%) |
| High School Diploma | 0 (0.0%) | 0 (0.0%) |
| College or Associate's Degree | 45 (100.0%) | 0 (0.0%) |
| Bachelor's Degree | 29 (100.0%) | 0 (0.0%) |
| Graduate Degree | 0 (0.0%) | 0 (0.0%) |
| Total | 74 (100.0%) | 0 (0.0%) |
Employment Characteristics in Alpine
Employment by Class of Employer in Alpine
Among the 4,270 employed individuals in Alpine, private company employees (2,699 | 63.2%), self-employed (incorporated) (474 | 11.1%), and self-employed (not incorporated) (394 | 9.2%) make up the most common classes of employment.
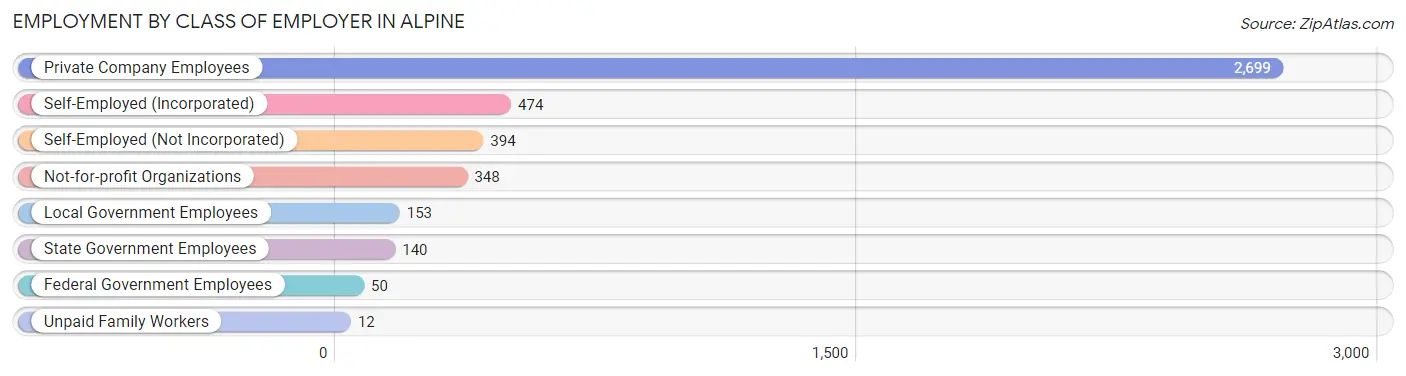
| Employer Class | # Employees | % Employees |
| Private Company Employees | 2,699 | 63.2% |
| Self-Employed (Incorporated) | 474 | 11.1% |
| Self-Employed (Not Incorporated) | 394 | 9.2% |
| Not-for-profit Organizations | 348 | 8.2% |
| Local Government Employees | 153 | 3.6% |
| State Government Employees | 140 | 3.3% |
| Federal Government Employees | 50 | 1.2% |
| Unpaid Family Workers | 12 | 0.3% |
| Total | 4,270 | 100.0% |
Employment Status by Age in Alpine
According to the labor force statistics for Alpine, out of the total population over 16 years of age (7,475), 59.2% or 4,425 individuals are in the labor force, with 1.6% or 71 of them unemployed. The age group with the highest labor force participation rate is 20 to 24 years, with 86.9% or 557 individuals in the labor force. Within the labor force, the 30 to 34 years age range has the highest percentage of unemployed individuals, with 8.3% or 18 of them being unemployed.
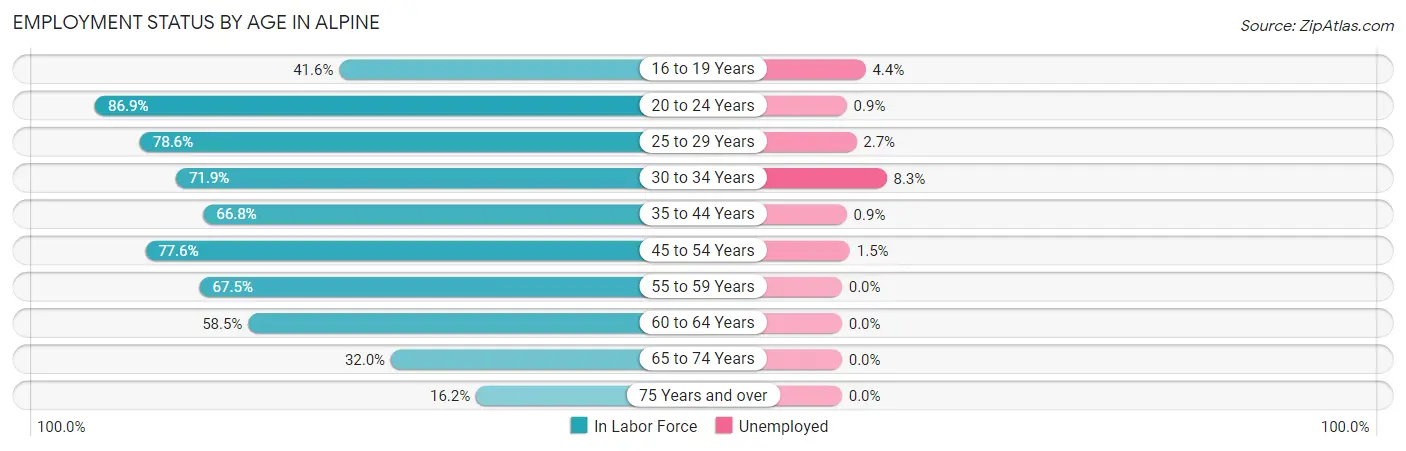
| Age Bracket | In Labor Force | Unemployed |
| 16 to 19 Years | 406 (41.6%) | 18 (4.4%) |
| 20 to 24 Years | 557 (86.9%) | 5 (0.9%) |
| 25 to 29 Years | 338 (78.6%) | 9 (2.7%) |
| 30 to 34 Years | 217 (71.9%) | 18 (8.3%) |
| 35 to 44 Years | 684 (66.8%) | 6 (0.9%) |
| 45 to 54 Years | 1,023 (77.6%) | 15 (1.5%) |
| 55 to 59 Years | 389 (67.5%) | 0 (0.0%) |
| 60 to 64 Years | 455 (58.5%) | 0 (0.0%) |
| 65 to 74 Years | 248 (32.0%) | 0 (0.0%) |
| 75 Years and over | 106 (16.2%) | 0 (0.0%) |
| Total | 4,425 (59.2%) | 71 (1.6%) |
Employment Status by Educational Attainment in Alpine
According to labor force statistics for Alpine, 70.1% of individuals (3,104) out of the total population between 25 and 64 years of age (4,428) are in the labor force, with 1.5% or 47 of them being unemployed. The group with the highest labor force participation rate are those with the educational attainment of bachelor's degree or higher, with 76.3% or 1,962 individuals in the labor force. Within the labor force, individuals with bachelor's degree or higher education have the highest percentage of unemployment, with 2.5% or 49 of them being unemployed.
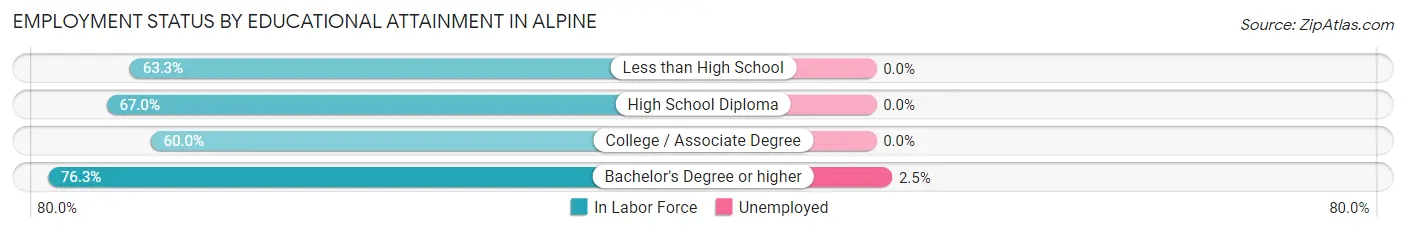
| Educational Attainment | In Labor Force | Unemployed |
| Less than High School | 31 (63.3%) | 0 (0.0%) |
| High School Diploma | 268 (67.0%) | 0 (0.0%) |
| College / Associate Degree | 845 (60.0%) | 0 (0.0%) |
| Bachelor's Degree or higher | 1,962 (76.3%) | 64 (2.5%) |
| Total | 3,104 (70.1%) | 66 (1.5%) |
Employment Occupations by Sex in Alpine
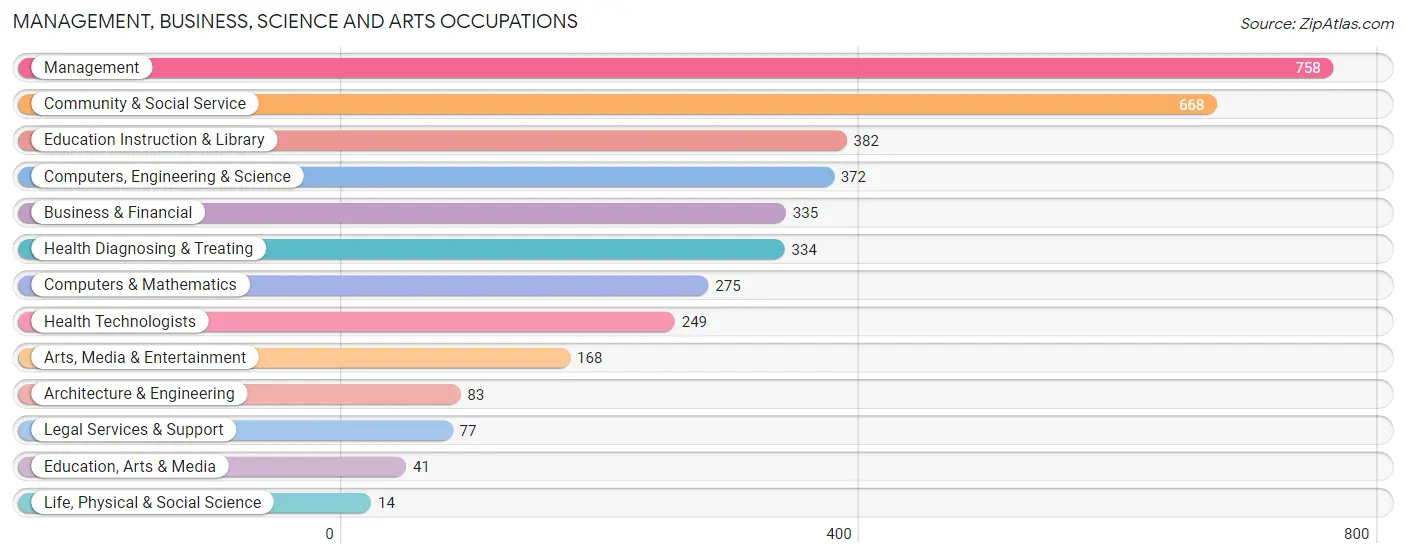
Management, Business, Science and Arts Occupations
The most common Management, Business, Science and Arts occupations in Alpine are Management (758 | 17.4%), Community & Social Service (668 | 15.4%), Education Instruction & Library (382 | 8.8%), Computers, Engineering & Science (372 | 8.6%), and Business & Financial (335 | 7.7%).
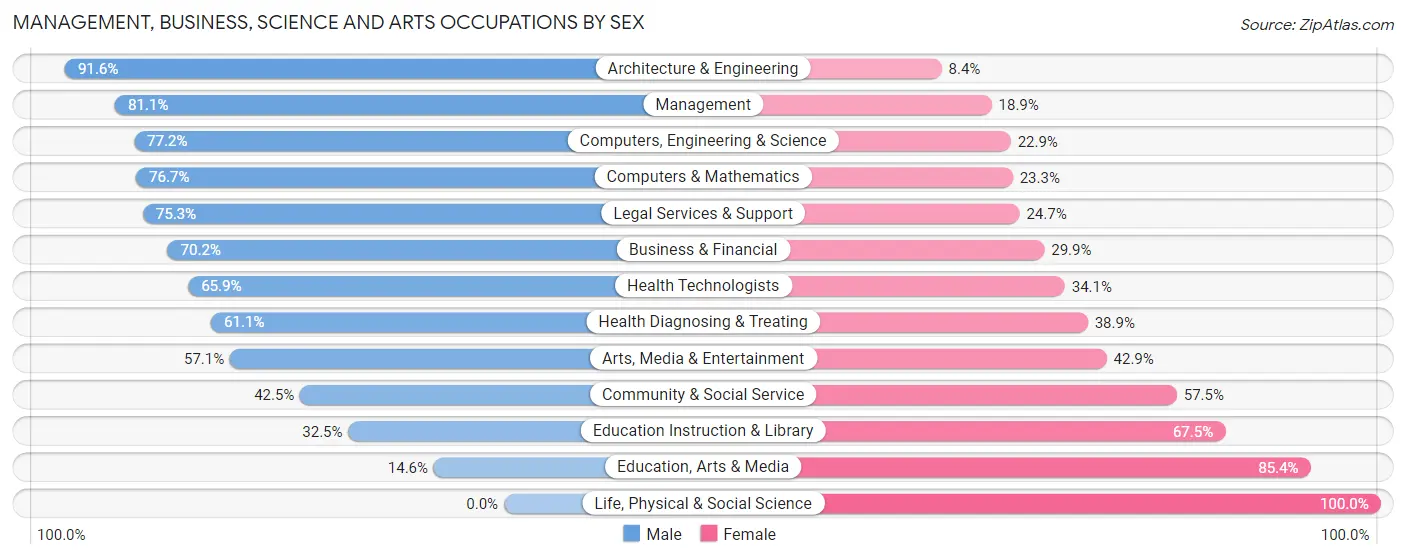
Management, Business, Science and Arts Occupations by Sex
Within the Management, Business, Science and Arts occupations in Alpine, the most male-oriented occupations are Architecture & Engineering (91.6%), Management (81.1%), and Computers, Engineering & Science (77.1%), while the most female-oriented occupations are Life, Physical & Social Science (100.0%), Education, Arts & Media (85.4%), and Education Instruction & Library (67.5%).
| Occupation | Male | Female |
| Management | 615 (81.1%) | 143 (18.9%) |
| Business & Financial | 235 (70.2%) | 100 (29.8%) |
| Computers, Engineering & Science | 287 (77.1%) | 85 (22.9%) |
| Computers & Mathematics | 211 (76.7%) | 64 (23.3%) |
| Architecture & Engineering | 76 (91.6%) | 7 (8.4%) |
| Life, Physical & Social Science | 0 (0.0%) | 14 (100.0%) |
| Community & Social Service | 284 (42.5%) | 384 (57.5%) |
| Education, Arts & Media | 6 (14.6%) | 35 (85.4%) |
| Legal Services & Support | 58 (75.3%) | 19 (24.7%) |
| Education Instruction & Library | 124 (32.5%) | 258 (67.5%) |
| Arts, Media & Entertainment | 96 (57.1%) | 72 (42.9%) |
| Health Diagnosing & Treating | 204 (61.1%) | 130 (38.9%) |
| Health Technologists | 164 (65.9%) | 85 (34.1%) |
| Total (Category) | 1,625 (65.9%) | 842 (34.1%) |
| Total (Overall) | 2,742 (63.1%) | 1,605 (36.9%) |
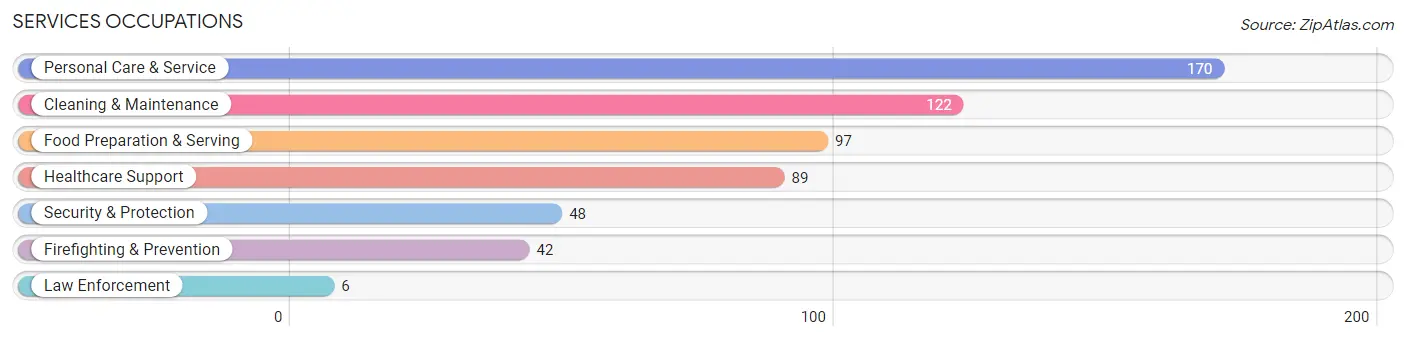
Services Occupations
The most common Services occupations in Alpine are Personal Care & Service (170 | 3.9%), Cleaning & Maintenance (122 | 2.8%), Food Preparation & Serving (97 | 2.2%), Healthcare Support (89 | 2.1%), and Security & Protection (48 | 1.1%).
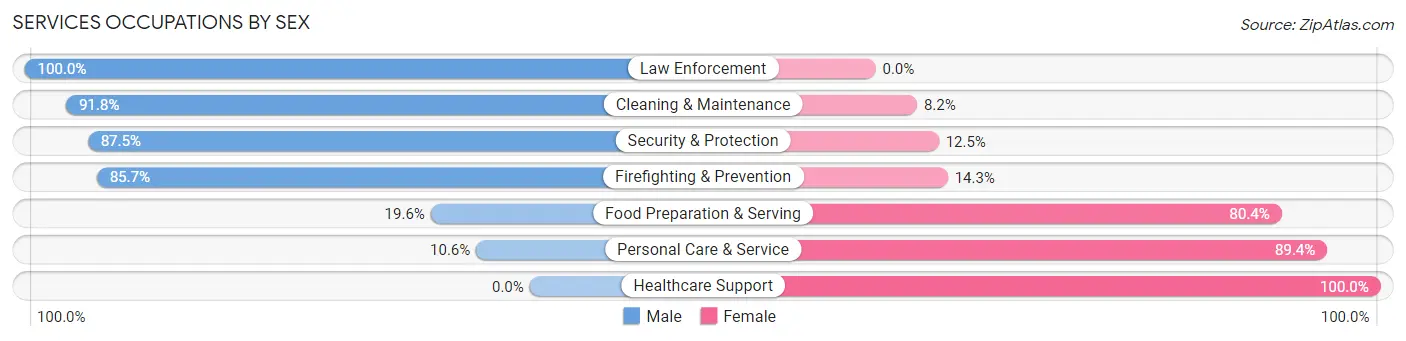
Services Occupations by Sex
Within the Services occupations in Alpine, the most male-oriented occupations are Law Enforcement (100.0%), Cleaning & Maintenance (91.8%), and Security & Protection (87.5%), while the most female-oriented occupations are Healthcare Support (100.0%), Personal Care & Service (89.4%), and Food Preparation & Serving (80.4%).
| Occupation | Male | Female |
| Healthcare Support | 0 (0.0%) | 89 (100.0%) |
| Security & Protection | 42 (87.5%) | 6 (12.5%) |
| Firefighting & Prevention | 36 (85.7%) | 6 (14.3%) |
| Law Enforcement | 6 (100.0%) | 0 (0.0%) |
| Food Preparation & Serving | 19 (19.6%) | 78 (80.4%) |
| Cleaning & Maintenance | 112 (91.8%) | 10 (8.2%) |
| Personal Care & Service | 18 (10.6%) | 152 (89.4%) |
| Total (Category) | 191 (36.3%) | 335 (63.7%) |
| Total (Overall) | 2,742 (63.1%) | 1,605 (36.9%) |
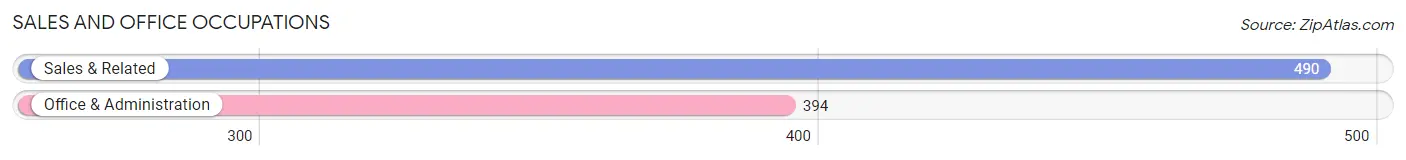
Sales and Office Occupations
The most common Sales and Office occupations in Alpine are Sales & Related (490 | 11.3%), and Office & Administration (394 | 9.1%).
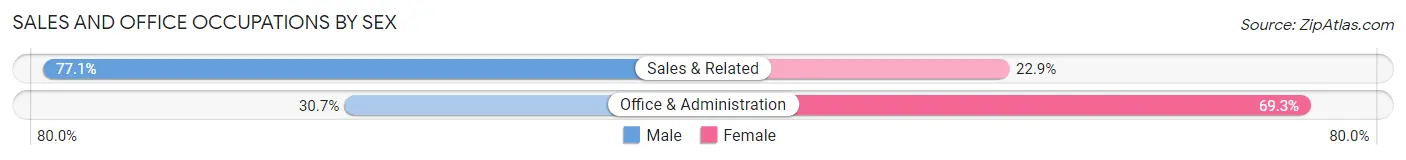
Sales and Office Occupations by Sex
| Occupation | Male | Female |
| Sales & Related | 378 (77.1%) | 112 (22.9%) |
| Office & Administration | 121 (30.7%) | 273 (69.3%) |
| Total (Category) | 499 (56.5%) | 385 (43.5%) |
| Total (Overall) | 2,742 (63.1%) | 1,605 (36.9%) |
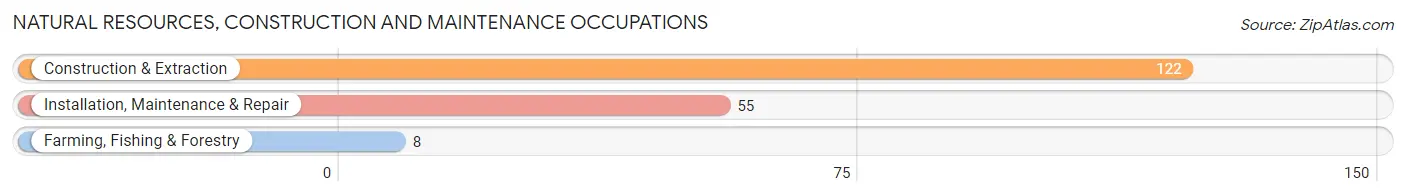
Natural Resources, Construction and Maintenance Occupations
The most common Natural Resources, Construction and Maintenance occupations in Alpine are Construction & Extraction (122 | 2.8%), Installation, Maintenance & Repair (55 | 1.3%), and Farming, Fishing & Forestry (8 | 0.2%).
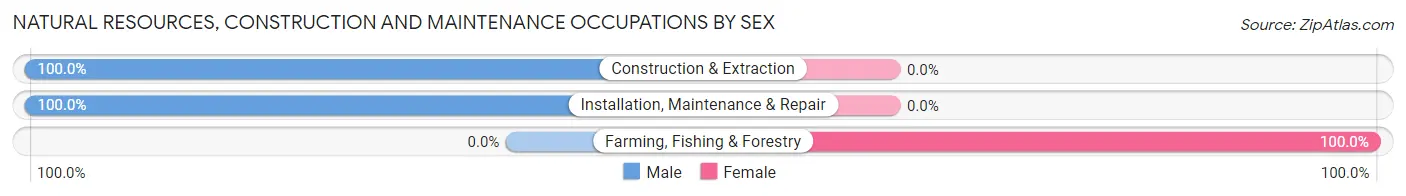
Natural Resources, Construction and Maintenance Occupations by Sex
| Occupation | Male | Female |
| Farming, Fishing & Forestry | 0 (0.0%) | 8 (100.0%) |
| Construction & Extraction | 122 (100.0%) | 0 (0.0%) |
| Installation, Maintenance & Repair | 55 (100.0%) | 0 (0.0%) |
| Total (Category) | 177 (95.7%) | 8 (4.3%) |
| Total (Overall) | 2,742 (63.1%) | 1,605 (36.9%) |
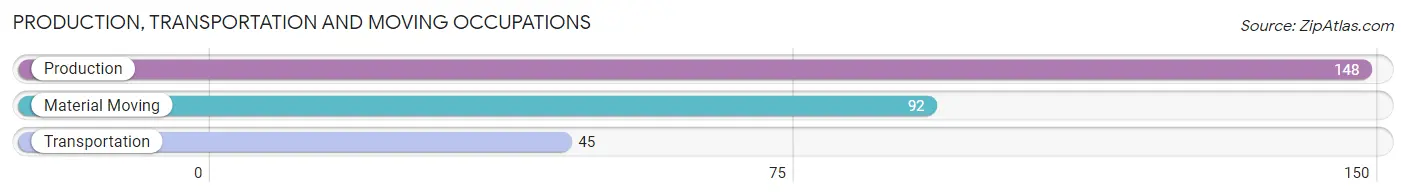
Production, Transportation and Moving Occupations
The most common Production, Transportation and Moving occupations in Alpine are Production (148 | 3.4%), Material Moving (92 | 2.1%), and Transportation (45 | 1.0%).
Production, Transportation and Moving Occupations by Sex
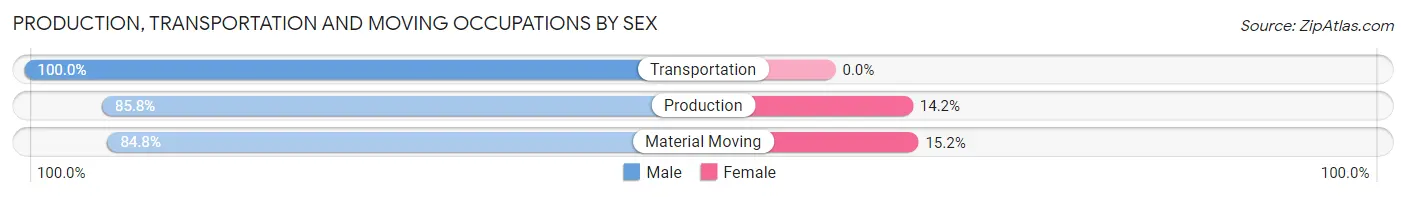
| Occupation | Male | Female |
| Production | 127 (85.8%) | 21 (14.2%) |
| Transportation | 45 (100.0%) | 0 (0.0%) |
| Material Moving | 78 (84.8%) | 14 (15.2%) |
| Total (Category) | 250 (87.7%) | 35 (12.3%) |
| Total (Overall) | 2,742 (63.1%) | 1,605 (36.9%) |
Employment Industries by Sex in Alpine
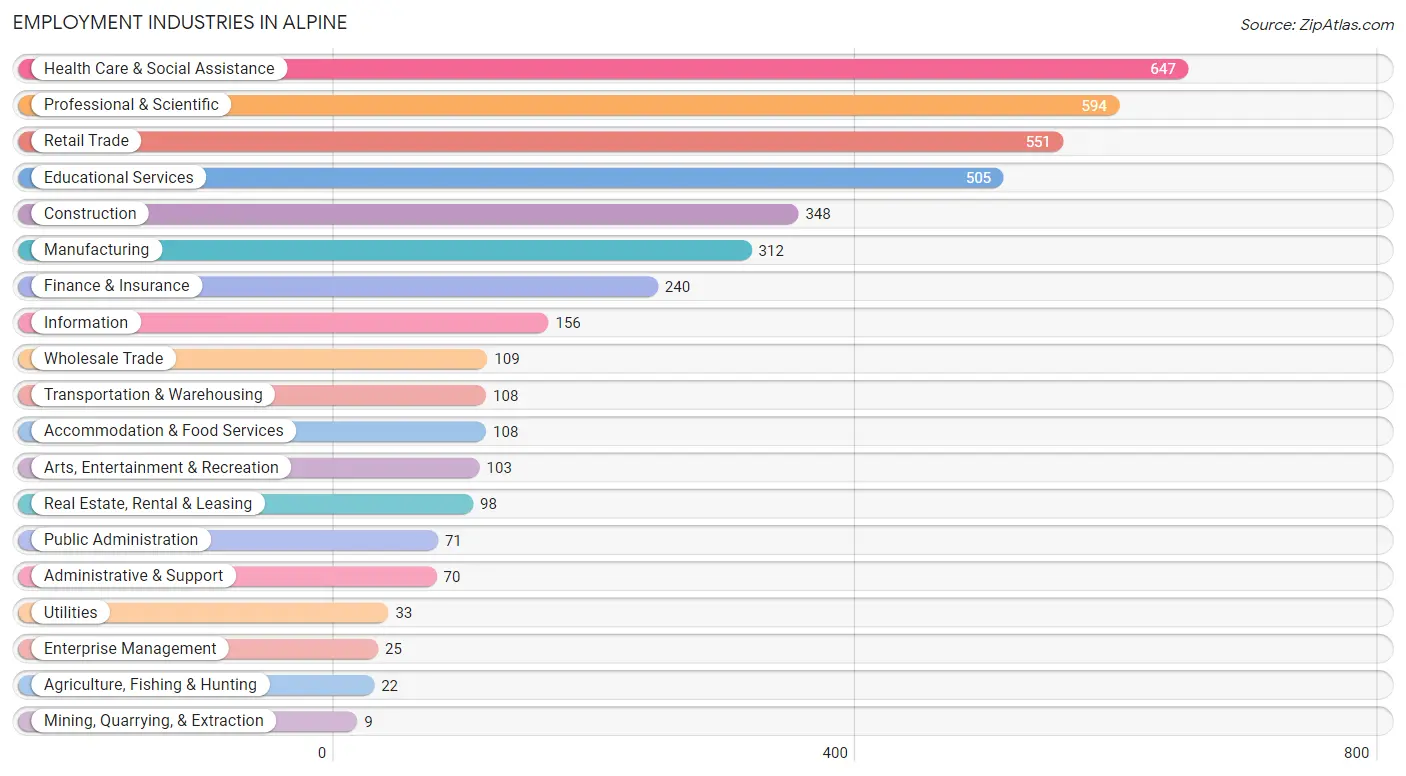
Employment Industries in Alpine
The major employment industries in Alpine include Health Care & Social Assistance (647 | 14.9%), Professional & Scientific (594 | 13.7%), Retail Trade (551 | 12.7%), Educational Services (505 | 11.6%), and Construction (348 | 8.0%).
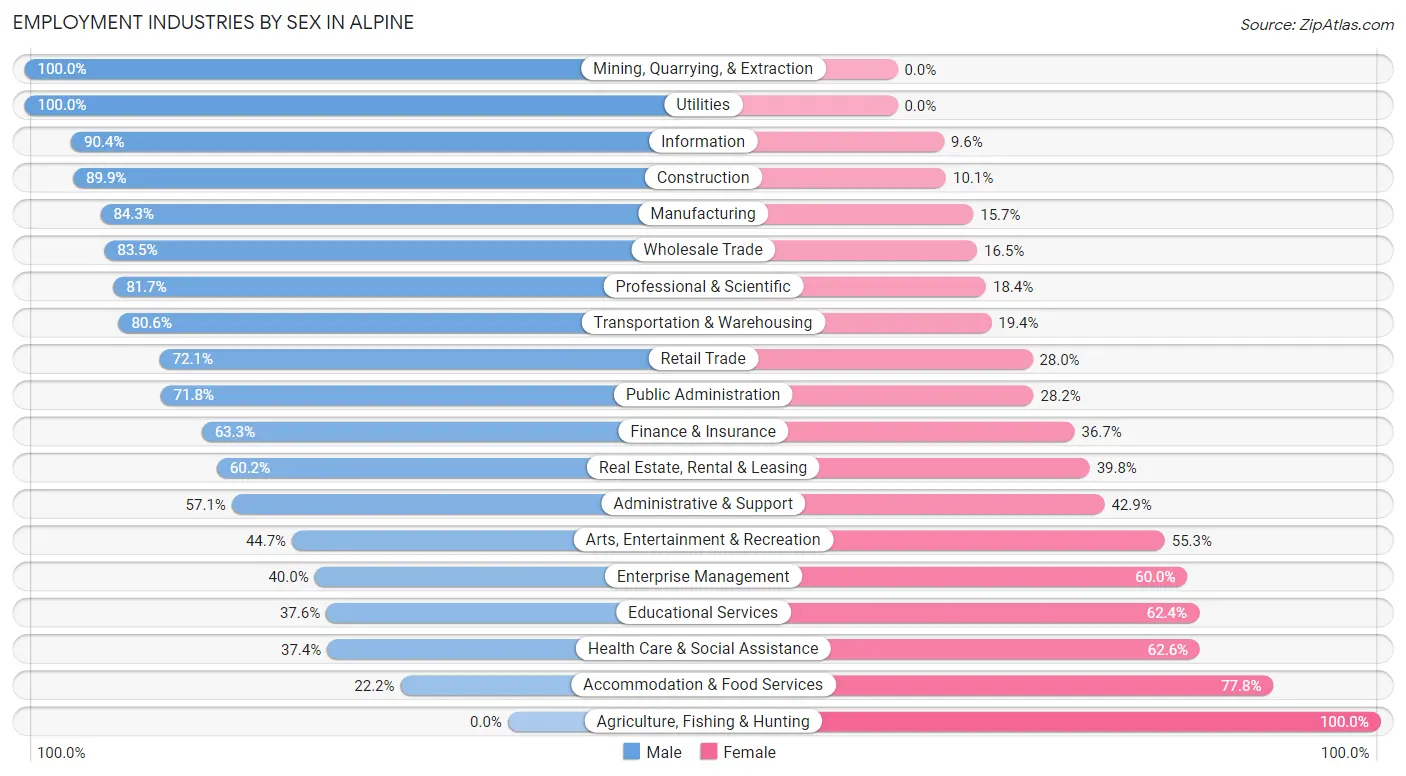
Employment Industries by Sex in Alpine
The Alpine industries that see more men than women are Mining, Quarrying, & Extraction (100.0%), Utilities (100.0%), and Information (90.4%), whereas the industries that tend to have a higher number of women are Agriculture, Fishing & Hunting (100.0%), Accommodation & Food Services (77.8%), and Health Care & Social Assistance (62.6%).
| Industry | Male | Female |
| Agriculture, Fishing & Hunting | 0 (0.0%) | 22 (100.0%) |
| Mining, Quarrying, & Extraction | 9 (100.0%) | 0 (0.0%) |
| Construction | 313 (89.9%) | 35 (10.1%) |
| Manufacturing | 263 (84.3%) | 49 (15.7%) |
| Wholesale Trade | 91 (83.5%) | 18 (16.5%) |
| Retail Trade | 397 (72.1%) | 154 (28.0%) |
| Transportation & Warehousing | 87 (80.6%) | 21 (19.4%) |
| Utilities | 33 (100.0%) | 0 (0.0%) |
| Information | 141 (90.4%) | 15 (9.6%) |
| Finance & Insurance | 152 (63.3%) | 88 (36.7%) |
| Real Estate, Rental & Leasing | 59 (60.2%) | 39 (39.8%) |
| Professional & Scientific | 485 (81.7%) | 109 (18.3%) |
| Enterprise Management | 10 (40.0%) | 15 (60.0%) |
| Administrative & Support | 40 (57.1%) | 30 (42.9%) |
| Educational Services | 190 (37.6%) | 315 (62.4%) |
| Health Care & Social Assistance | 242 (37.4%) | 405 (62.6%) |
| Arts, Entertainment & Recreation | 46 (44.7%) | 57 (55.3%) |
| Accommodation & Food Services | 24 (22.2%) | 84 (77.8%) |
| Public Administration | 51 (71.8%) | 20 (28.2%) |
| Total | 2,742 (63.1%) | 1,605 (36.9%) |
Education in Alpine
School Enrollment in Alpine
The most common levels of schooling among the 3,721 students in Alpine are middle school (1,045 | 28.1%), high school (957 | 25.7%), and college / undergraduate (662 | 17.8%).
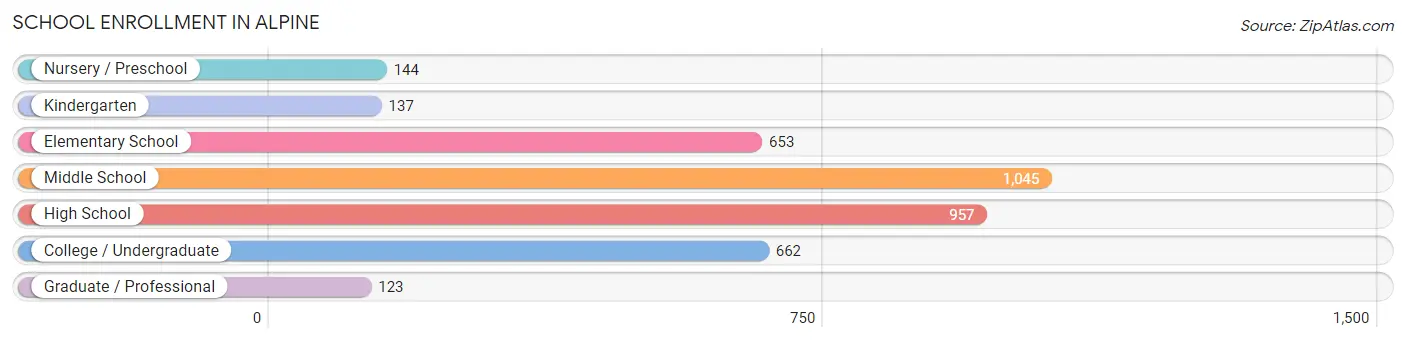
| School Level | # Students | % Students |
| Nursery / Preschool | 144 | 3.9% |
| Kindergarten | 137 | 3.7% |
| Elementary School | 653 | 17.5% |
| Middle School | 1,045 | 28.1% |
| High School | 957 | 25.7% |
| College / Undergraduate | 662 | 17.8% |
| Graduate / Professional | 123 | 3.3% |
| Total | 3,721 | 100.0% |
School Enrollment by Age by Funding Source in Alpine
Out of a total of 3,721 students who are enrolled in schools in Alpine, 554 (14.9%) attend a private institution, while the remaining 3,167 (85.1%) are enrolled in public schools. The age group of 35 years and over has the highest likelihood of being enrolled in private schools, with 102 (67.1% in the age bracket) enrolled. Conversely, the age group of 15 to 17 year olds has the lowest likelihood of being enrolled in a private school, with 720 (97.8% in the age bracket) attending a public institution.
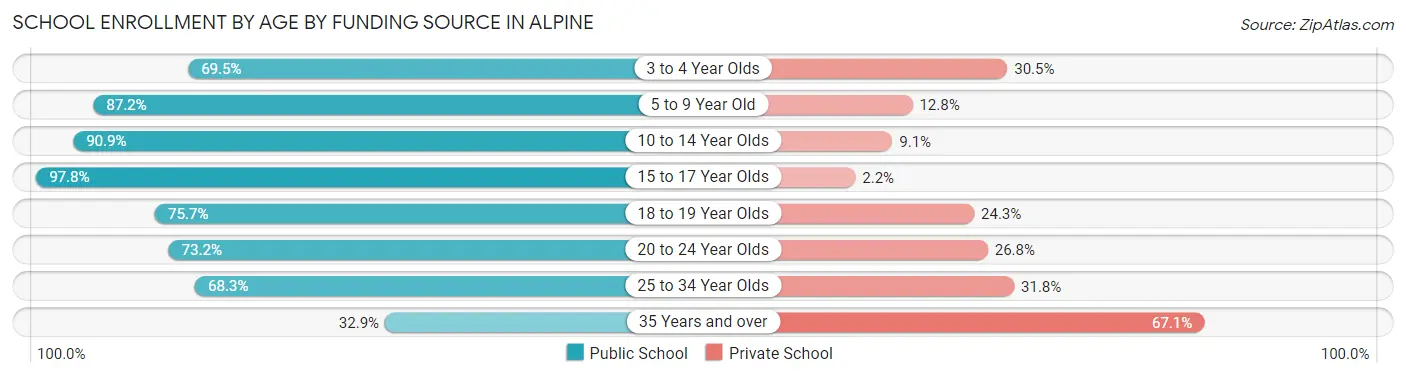
| Age Bracket | Public School | Private School |
| 3 to 4 Year Olds | 73 (69.5%) | 32 (30.5%) |
| 5 to 9 Year Old | 619 (87.2%) | 91 (12.8%) |
| 10 to 14 Year Olds | 1,154 (90.9%) | 115 (9.1%) |
| 15 to 17 Year Olds | 720 (97.8%) | 16 (2.2%) |
| 18 to 19 Year Olds | 215 (75.7%) | 69 (24.3%) |
| 20 to 24 Year Olds | 248 (73.2%) | 91 (26.8%) |
| 25 to 34 Year Olds | 86 (68.2%) | 40 (31.8%) |
| 35 Years and over | 50 (32.9%) | 102 (67.1%) |
| Total | 3,167 (85.1%) | 554 (14.9%) |
Educational Attainment by Field of Study in Alpine
Business (585 | 16.4%), education (400 | 11.2%), science & technology (331 | 9.3%), social sciences (297 | 8.3%), and engineering (295 | 8.3%) are the most common fields of study among 3,565 individuals in Alpine who have obtained a bachelor's degree or higher.
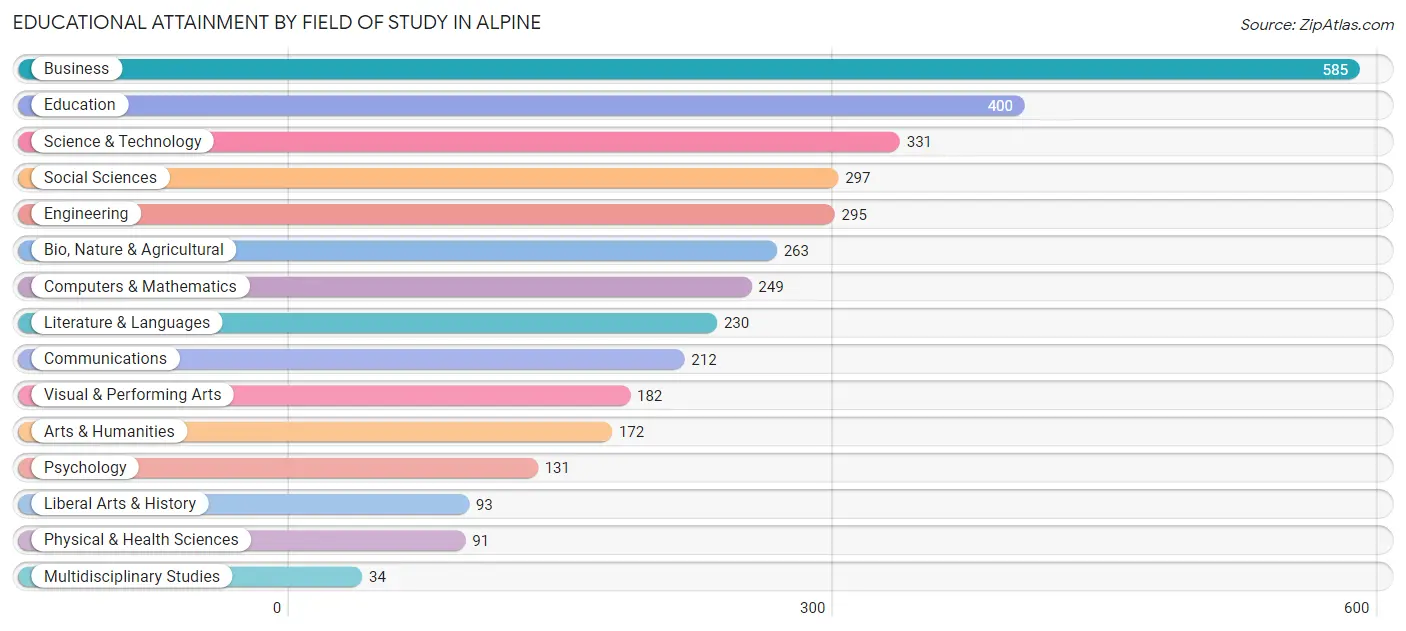
| Field of Study | # Graduates | % Graduates |
| Computers & Mathematics | 249 | 7.0% |
| Bio, Nature & Agricultural | 263 | 7.4% |
| Physical & Health Sciences | 91 | 2.5% |
| Psychology | 131 | 3.7% |
| Social Sciences | 297 | 8.3% |
| Engineering | 295 | 8.3% |
| Multidisciplinary Studies | 34 | 0.9% |
| Science & Technology | 331 | 9.3% |
| Business | 585 | 16.4% |
| Education | 400 | 11.2% |
| Literature & Languages | 230 | 6.5% |
| Liberal Arts & History | 93 | 2.6% |
| Visual & Performing Arts | 182 | 5.1% |
| Communications | 212 | 5.9% |
| Arts & Humanities | 172 | 4.8% |
| Total | 3,565 | 100.0% |
Transportation & Commute in Alpine
Vehicle Availability by Sex in Alpine
The most prevalent vehicle ownership categories in Alpine are males with 3 vehicles (847, accounting for 31.2%) and females with 3 vehicles (562, making up 54.4%).
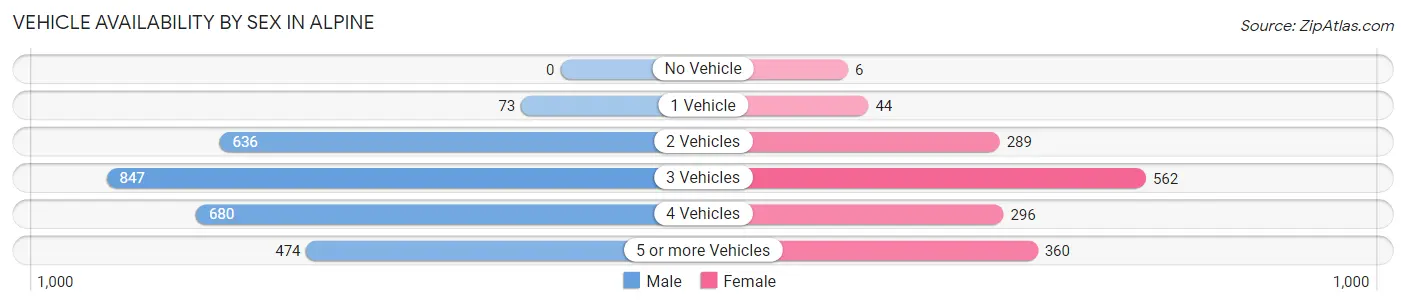
| Vehicles Available | Male | Female |
| No Vehicle | 0 (0.0%) | 6 (0.4%) |
| 1 Vehicle | 73 (2.7%) | 44 (2.8%) |
| 2 Vehicles | 636 (23.5%) | 289 (18.6%) |
| 3 Vehicles | 847 (31.2%) | 562 (36.1%) |
| 4 Vehicles | 680 (25.1%) | 296 (19.0%) |
| 5 or more Vehicles | 474 (17.5%) | 360 (23.1%) |
| Total | 2,710 (100.0%) | 1,557 (100.0%) |
Commute Time in Alpine
The most frequently occuring commute durations in Alpine are 15 to 19 minutes (546 commuters, 16.8%), 20 to 24 minutes (471 commuters, 14.5%), and 10 to 14 minutes (374 commuters, 11.5%).
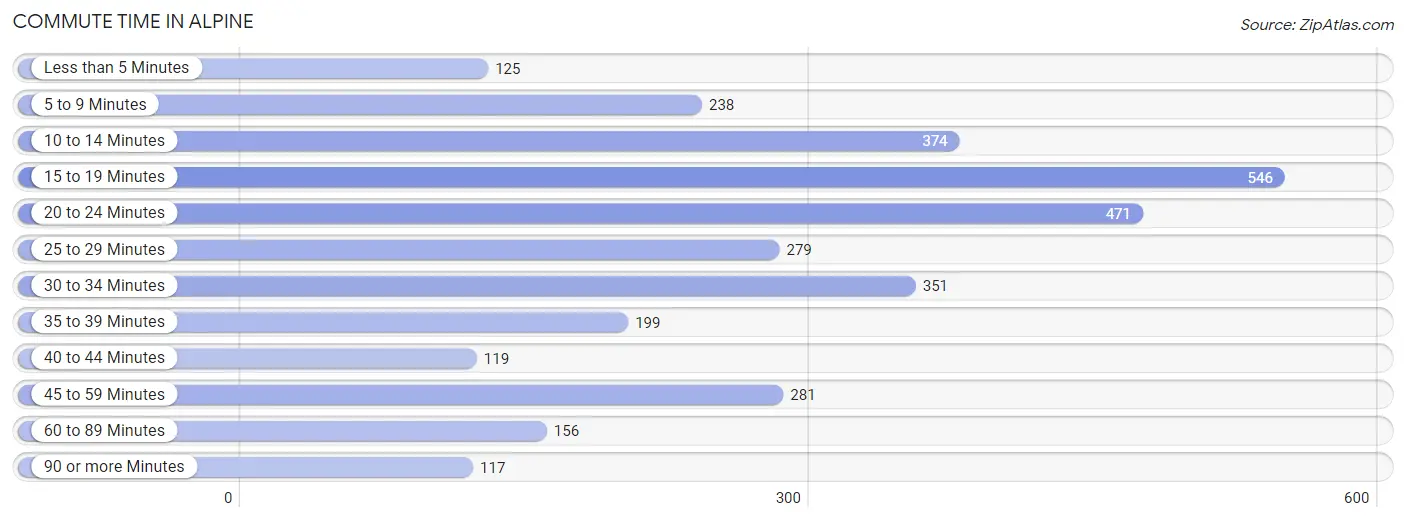
| Commute Time | # Commuters | % Commuters |
| Less than 5 Minutes | 125 | 3.8% |
| 5 to 9 Minutes | 238 | 7.3% |
| 10 to 14 Minutes | 374 | 11.5% |
| 15 to 19 Minutes | 546 | 16.8% |
| 20 to 24 Minutes | 471 | 14.5% |
| 25 to 29 Minutes | 279 | 8.6% |
| 30 to 34 Minutes | 351 | 10.8% |
| 35 to 39 Minutes | 199 | 6.1% |
| 40 to 44 Minutes | 119 | 3.6% |
| 45 to 59 Minutes | 281 | 8.6% |
| 60 to 89 Minutes | 156 | 4.8% |
| 90 or more Minutes | 117 | 3.6% |
Commute Time by Sex in Alpine
The most common commute times in Alpine are 15 to 19 minutes (366 commuters, 17.2%) for males and 15 to 19 minutes (180 commuters, 15.9%) for females.
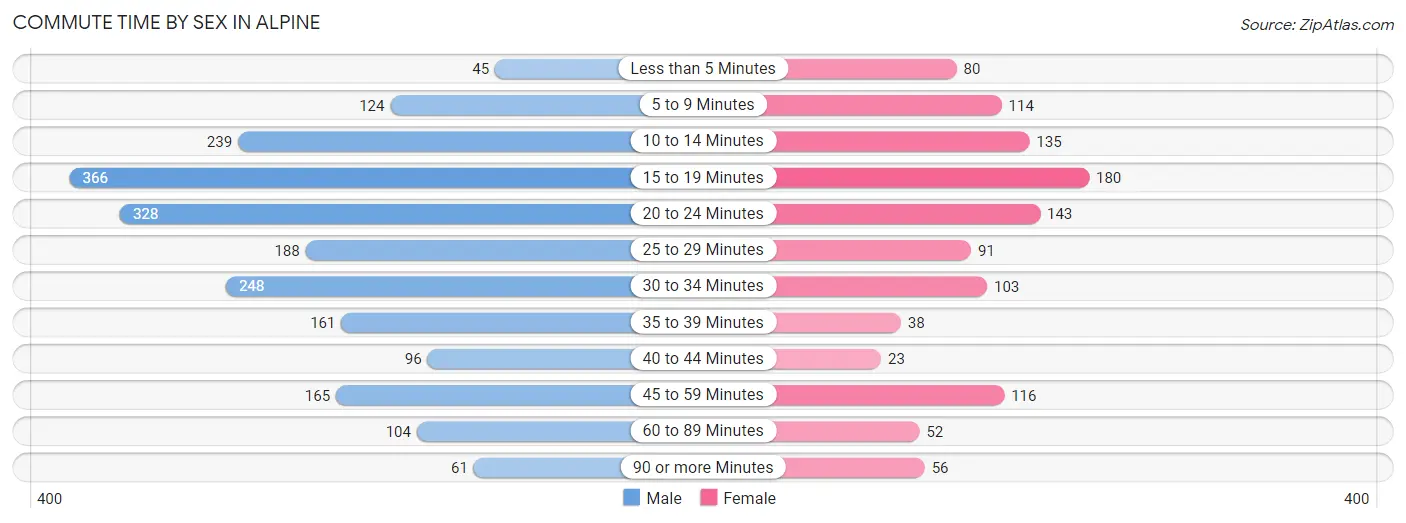
| Commute Time | Male | Female |
| Less than 5 Minutes | 45 (2.1%) | 80 (7.1%) |
| 5 to 9 Minutes | 124 (5.8%) | 114 (10.1%) |
| 10 to 14 Minutes | 239 (11.3%) | 135 (11.9%) |
| 15 to 19 Minutes | 366 (17.2%) | 180 (15.9%) |
| 20 to 24 Minutes | 328 (15.4%) | 143 (12.6%) |
| 25 to 29 Minutes | 188 (8.8%) | 91 (8.1%) |
| 30 to 34 Minutes | 248 (11.7%) | 103 (9.1%) |
| 35 to 39 Minutes | 161 (7.6%) | 38 (3.4%) |
| 40 to 44 Minutes | 96 (4.5%) | 23 (2.0%) |
| 45 to 59 Minutes | 165 (7.8%) | 116 (10.3%) |
| 60 to 89 Minutes | 104 (4.9%) | 52 (4.6%) |
| 90 or more Minutes | 61 (2.9%) | 56 (5.0%) |
Time of Departure to Work by Sex in Alpine
The most frequent times of departure to work in Alpine are 8:00 AM to 8:29 AM (382, 18.0%) for males and 7:00 AM to 7:29 AM (225, 19.9%) for females.
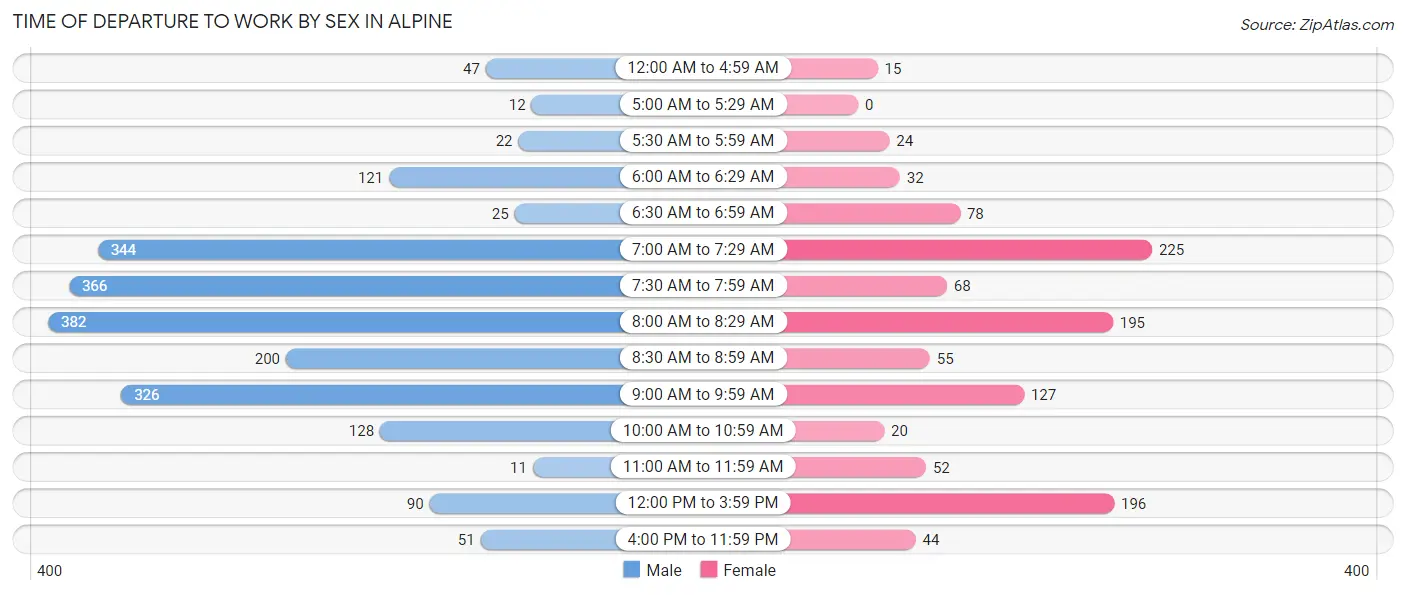
| Time of Departure | Male | Female |
| 12:00 AM to 4:59 AM | 47 (2.2%) | 15 (1.3%) |
| 5:00 AM to 5:29 AM | 12 (0.6%) | 0 (0.0%) |
| 5:30 AM to 5:59 AM | 22 (1.0%) | 24 (2.1%) |
| 6:00 AM to 6:29 AM | 121 (5.7%) | 32 (2.8%) |
| 6:30 AM to 6:59 AM | 25 (1.2%) | 78 (6.9%) |
| 7:00 AM to 7:29 AM | 344 (16.2%) | 225 (19.9%) |
| 7:30 AM to 7:59 AM | 366 (17.2%) | 68 (6.0%) |
| 8:00 AM to 8:29 AM | 382 (18.0%) | 195 (17.2%) |
| 8:30 AM to 8:59 AM | 200 (9.4%) | 55 (4.9%) |
| 9:00 AM to 9:59 AM | 326 (15.3%) | 127 (11.2%) |
| 10:00 AM to 10:59 AM | 128 (6.0%) | 20 (1.8%) |
| 11:00 AM to 11:59 AM | 11 (0.5%) | 52 (4.6%) |
| 12:00 PM to 3:59 PM | 90 (4.2%) | 196 (17.3%) |
| 4:00 PM to 11:59 PM | 51 (2.4%) | 44 (3.9%) |
| Total | 2,125 (100.0%) | 1,131 (100.0%) |
Housing Occupancy in Alpine
Occupancy by Ownership in Alpine
Of the total 2,837 dwellings in Alpine, owner-occupied units account for 2,449 (86.3%), while renter-occupied units make up 388 (13.7%).
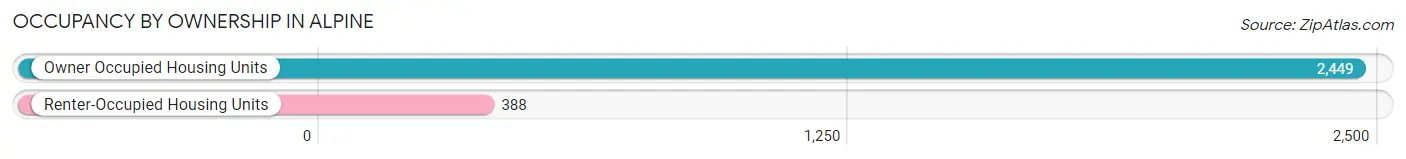
| Occupancy | # Housing Units | % Housing Units |
| Owner Occupied Housing Units | 2,449 | 86.3% |
| Renter-Occupied Housing Units | 388 | 13.7% |
| Total Occupied Housing Units | 2,837 | 100.0% |
Occupancy by Household Size in Alpine
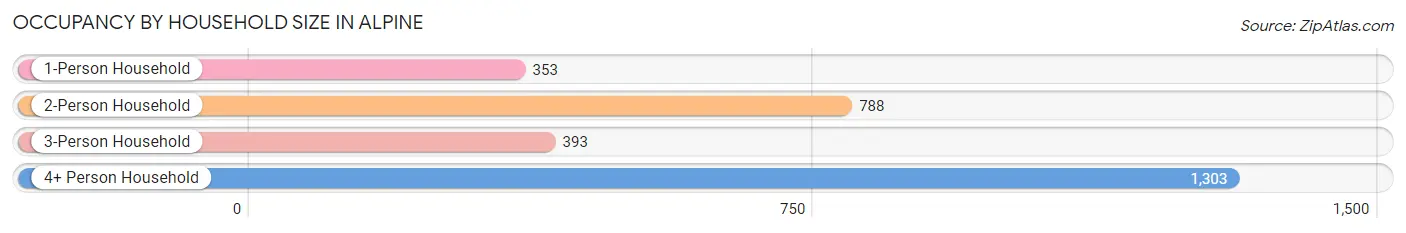
| Household Size | # Housing Units | % Housing Units |
| 1-Person Household | 353 | 12.4% |
| 2-Person Household | 788 | 27.8% |
| 3-Person Household | 393 | 13.9% |
| 4+ Person Household | 1,303 | 45.9% |
| Total Housing Units | 2,837 | 100.0% |
Occupancy by Ownership by Household Size in Alpine
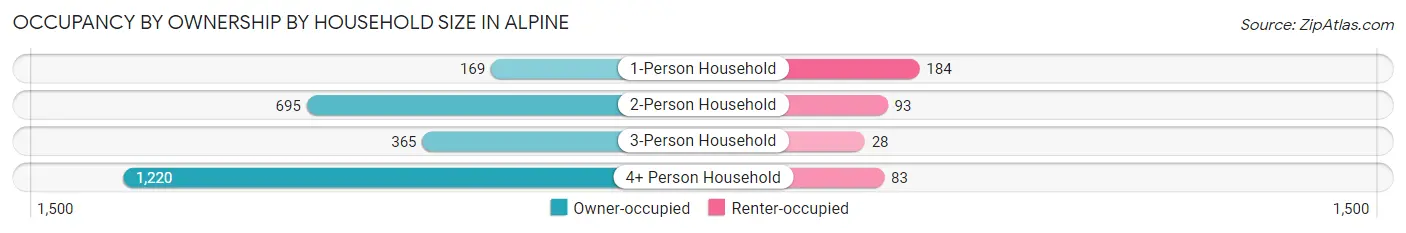
| Household Size | Owner-occupied | Renter-occupied |
| 1-Person Household | 169 (47.9%) | 184 (52.1%) |
| 2-Person Household | 695 (88.2%) | 93 (11.8%) |
| 3-Person Household | 365 (92.9%) | 28 (7.1%) |
| 4+ Person Household | 1,220 (93.6%) | 83 (6.4%) |
| Total Housing Units | 2,449 (86.3%) | 388 (13.7%) |
Occupancy by Educational Attainment in Alpine
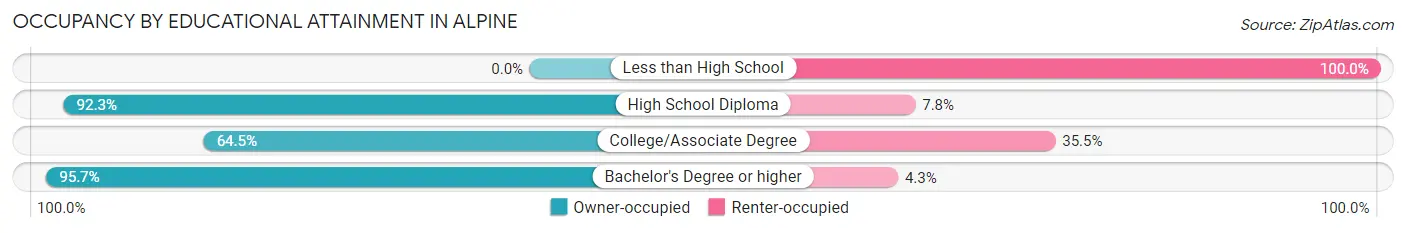
| Household Size | Owner-occupied | Renter-occupied |
| Less than High School | 0 (0.0%) | 24 (100.0%) |
| High School Diploma | 262 (92.2%) | 22 (7.7%) |
| College/Associate Degree | 481 (64.5%) | 265 (35.5%) |
| Bachelor's Degree or higher | 1,706 (95.7%) | 77 (4.3%) |
Occupancy by Age of Householder in Alpine
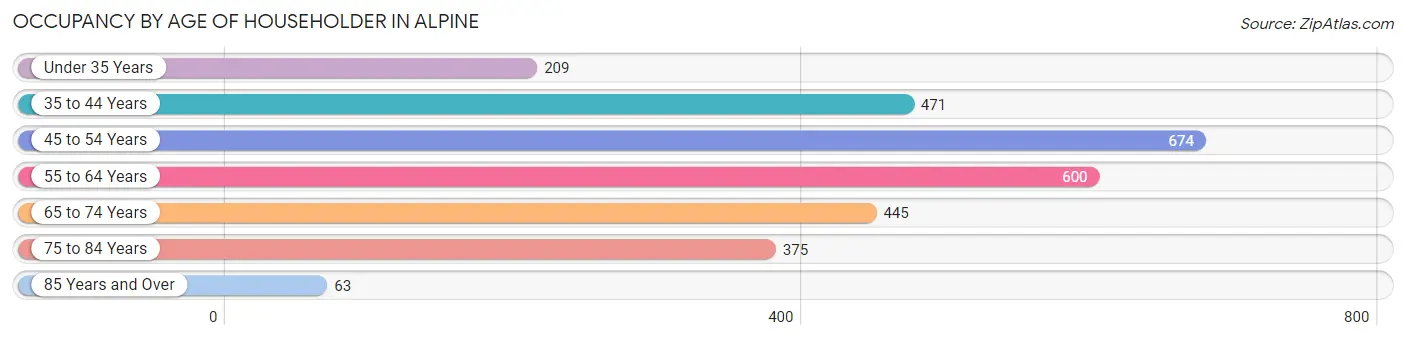
| Age Bracket | # Households | % Households |
| Under 35 Years | 209 | 7.4% |
| 35 to 44 Years | 471 | 16.6% |
| 45 to 54 Years | 674 | 23.8% |
| 55 to 64 Years | 600 | 21.1% |
| 65 to 74 Years | 445 | 15.7% |
| 75 to 84 Years | 375 | 13.2% |
| 85 Years and Over | 63 | 2.2% |
| Total | 2,837 | 100.0% |
Housing Finances in Alpine
Median Income by Occupancy in Alpine
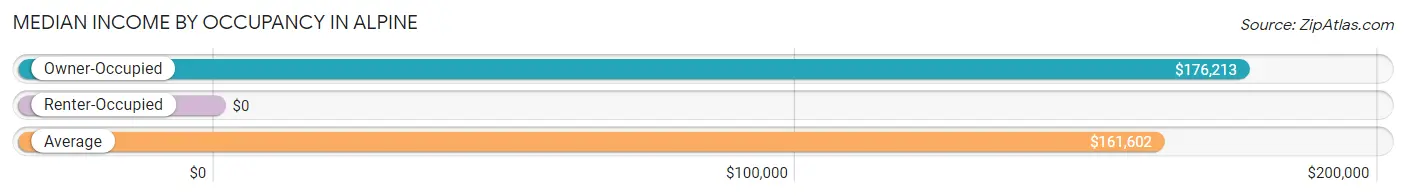
| Occupancy Type | # Households | Median Income |
| Owner-Occupied | 2,449 (86.3%) | $176,213 |
| Renter-Occupied | 388 (13.7%) | $0 |
| Average | 2,837 (100.0%) | $161,602 |
Occupancy by Householder Income Bracket in Alpine
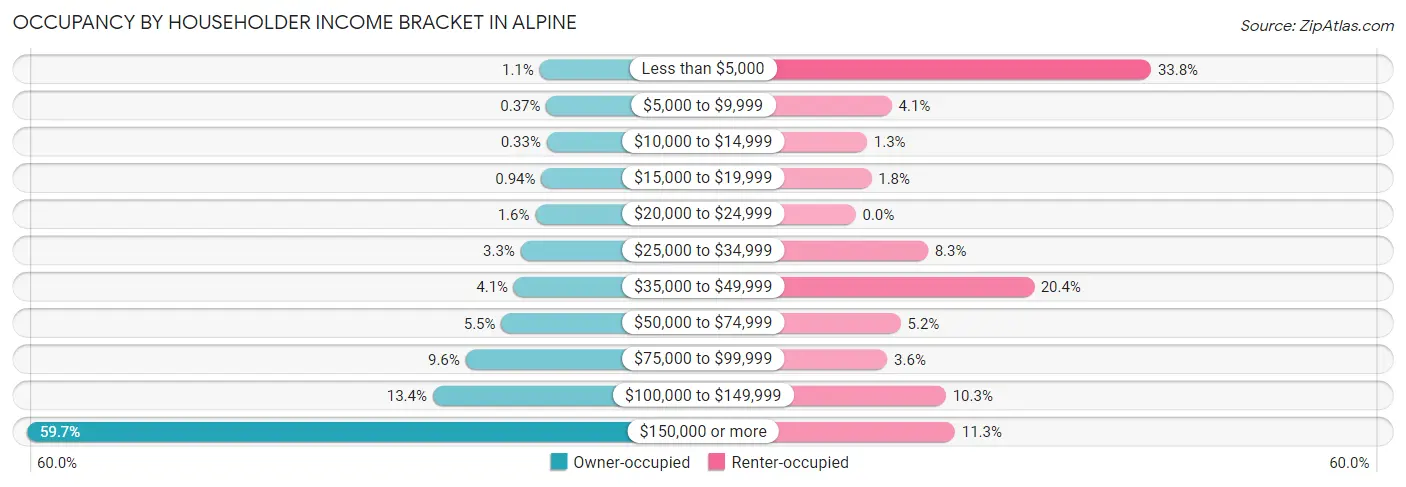
| Income Bracket | Owner-occupied | Renter-occupied |
| Less than $5,000 | 28 (1.1%) | 131 (33.8%) |
| $5,000 to $9,999 | 9 (0.4%) | 16 (4.1%) |
| $10,000 to $14,999 | 8 (0.3%) | 5 (1.3%) |
| $15,000 to $19,999 | 23 (0.9%) | 7 (1.8%) |
| $20,000 to $24,999 | 40 (1.6%) | 0 (0.0%) |
| $25,000 to $34,999 | 81 (3.3%) | 32 (8.3%) |
| $35,000 to $49,999 | 100 (4.1%) | 79 (20.4%) |
| $50,000 to $74,999 | 135 (5.5%) | 20 (5.1%) |
| $75,000 to $99,999 | 235 (9.6%) | 14 (3.6%) |
| $100,000 to $149,999 | 327 (13.4%) | 40 (10.3%) |
| $150,000 or more | 1,463 (59.7%) | 44 (11.3%) |
| Total | 2,449 (100.0%) | 388 (100.0%) |
Monthly Housing Cost Tiers in Alpine
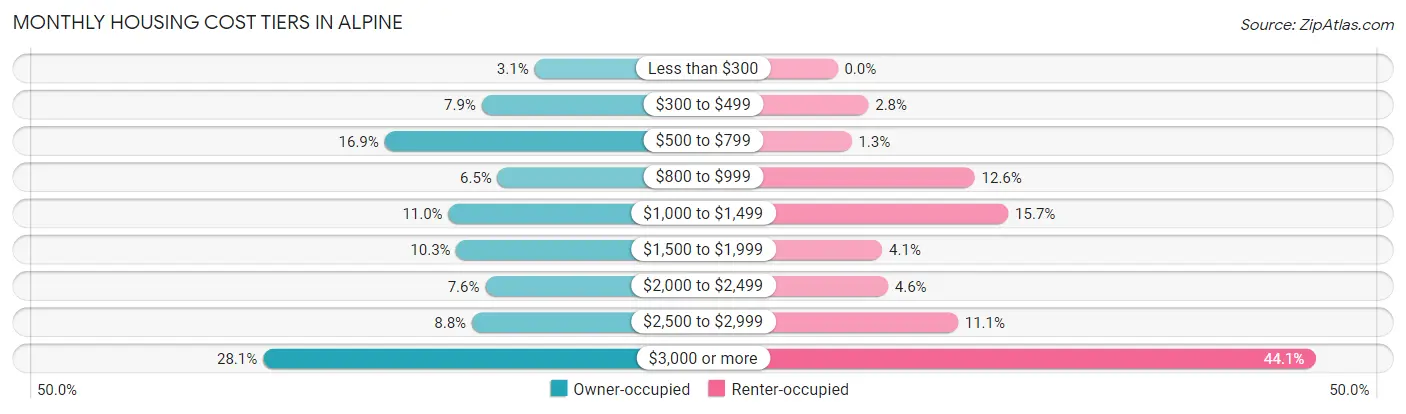
| Monthly Cost | Owner-occupied | Renter-occupied |
| Less than $300 | 75 (3.1%) | 0 (0.0%) |
| $300 to $499 | 194 (7.9%) | 11 (2.8%) |
| $500 to $799 | 413 (16.9%) | 5 (1.3%) |
| $800 to $999 | 158 (6.5%) | 49 (12.6%) |
| $1,000 to $1,499 | 269 (11.0%) | 61 (15.7%) |
| $1,500 to $1,999 | 251 (10.2%) | 16 (4.1%) |
| $2,000 to $2,499 | 186 (7.6%) | 18 (4.6%) |
| $2,500 to $2,999 | 216 (8.8%) | 43 (11.1%) |
| $3,000 or more | 687 (28.1%) | 171 (44.1%) |
| Total | 2,449 (100.0%) | 388 (100.0%) |
Physical Housing Characteristics in Alpine
Housing Structures in Alpine
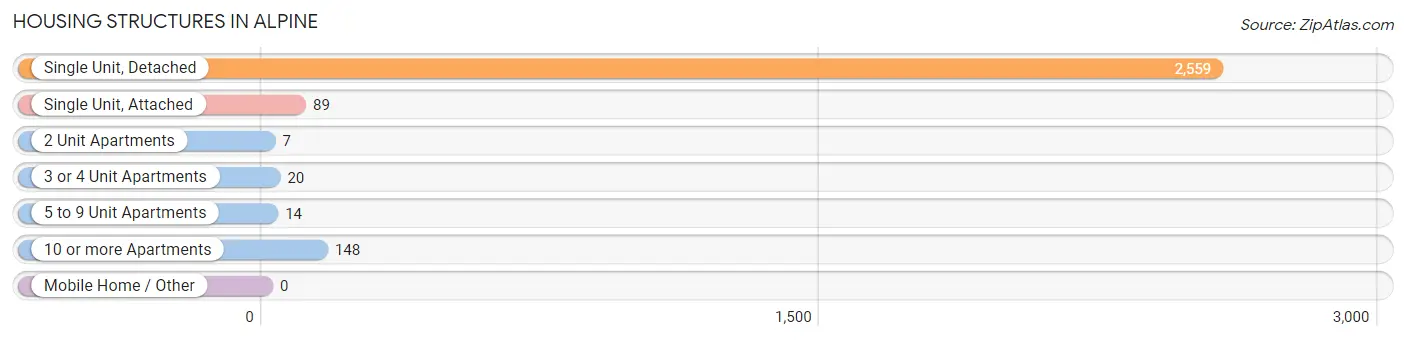
| Structure Type | # Housing Units | % Housing Units |
| Single Unit, Detached | 2,559 | 90.2% |
| Single Unit, Attached | 89 | 3.1% |
| 2 Unit Apartments | 7 | 0.3% |
| 3 or 4 Unit Apartments | 20 | 0.7% |
| 5 to 9 Unit Apartments | 14 | 0.5% |
| 10 or more Apartments | 148 | 5.2% |
| Mobile Home / Other | 0 | 0.0% |
| Total | 2,837 | 100.0% |
Housing Structures by Occupancy in Alpine
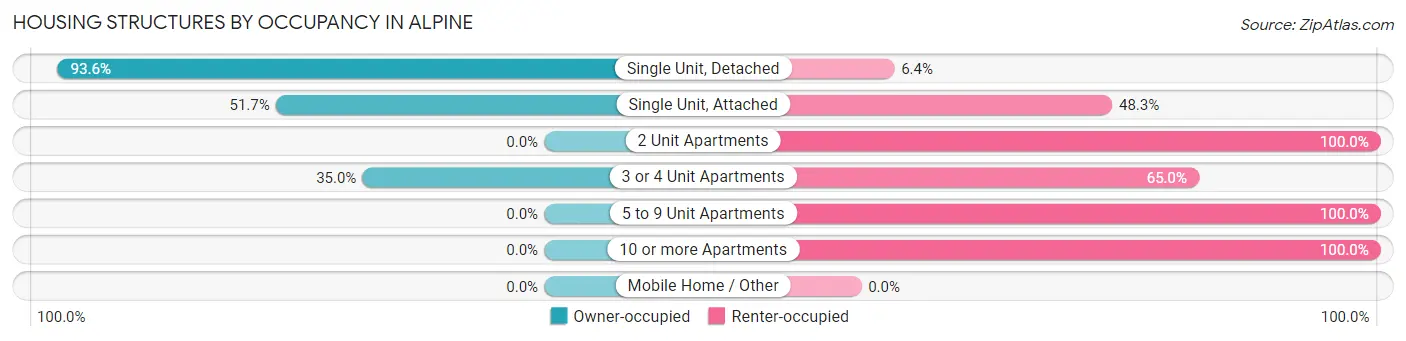
| Structure Type | Owner-occupied | Renter-occupied |
| Single Unit, Detached | 2,396 (93.6%) | 163 (6.4%) |
| Single Unit, Attached | 46 (51.7%) | 43 (48.3%) |
| 2 Unit Apartments | 0 (0.0%) | 7 (100.0%) |
| 3 or 4 Unit Apartments | 7 (35.0%) | 13 (65.0%) |
| 5 to 9 Unit Apartments | 0 (0.0%) | 14 (100.0%) |
| 10 or more Apartments | 0 (0.0%) | 148 (100.0%) |
| Mobile Home / Other | 0 (0.0%) | 0 (0.0%) |
| Total | 2,449 (86.3%) | 388 (13.7%) |
Housing Structures by Number of Rooms in Alpine
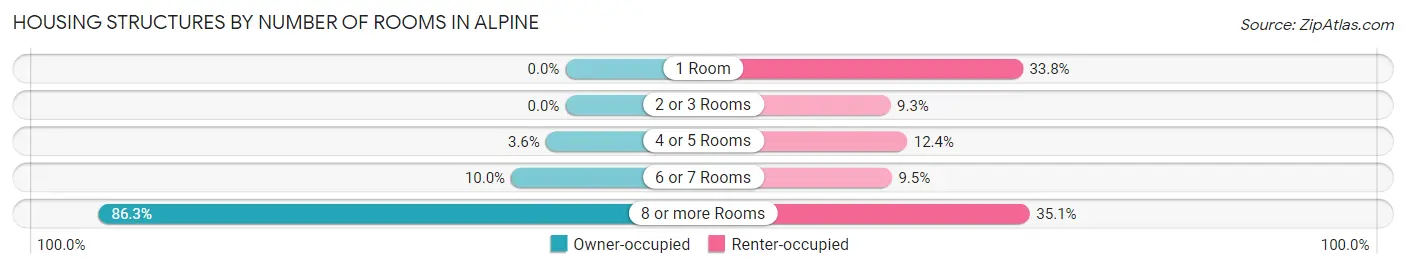
| Number of Rooms | Owner-occupied | Renter-occupied |
| 1 Room | 0 (0.0%) | 131 (33.8%) |
| 2 or 3 Rooms | 0 (0.0%) | 36 (9.3%) |
| 4 or 5 Rooms | 89 (3.6%) | 48 (12.4%) |
| 6 or 7 Rooms | 246 (10.0%) | 37 (9.5%) |
| 8 or more Rooms | 2,114 (86.3%) | 136 (35.0%) |
| Total | 2,449 (100.0%) | 388 (100.0%) |
Housing Structure by Heating Type in Alpine
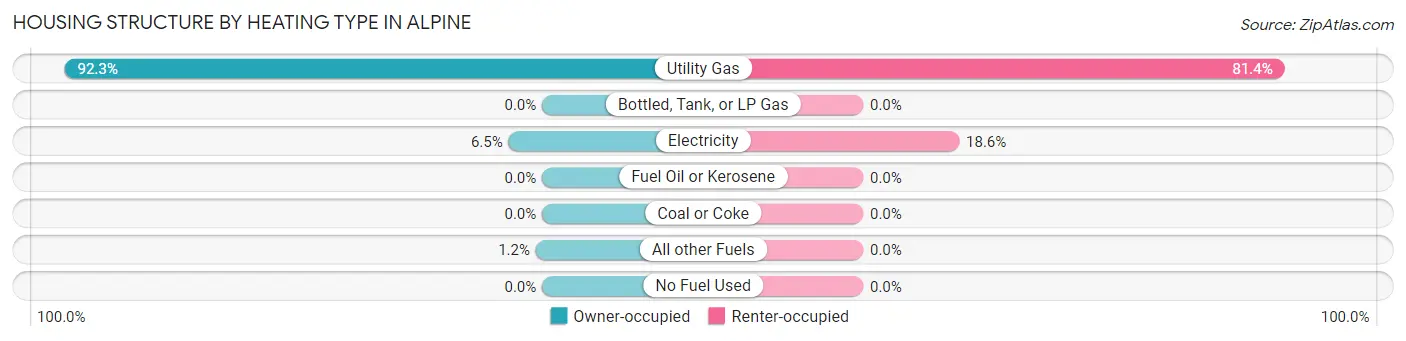
| Heating Type | Owner-occupied | Renter-occupied |
| Utility Gas | 2,260 (92.3%) | 316 (81.4%) |
| Bottled, Tank, or LP Gas | 0 (0.0%) | 0 (0.0%) |
| Electricity | 159 (6.5%) | 72 (18.6%) |
| Fuel Oil or Kerosene | 0 (0.0%) | 0 (0.0%) |
| Coal or Coke | 0 (0.0%) | 0 (0.0%) |
| All other Fuels | 30 (1.2%) | 0 (0.0%) |
| No Fuel Used | 0 (0.0%) | 0 (0.0%) |
| Total | 2,449 (100.0%) | 388 (100.0%) |
Household Vehicle Usage in Alpine
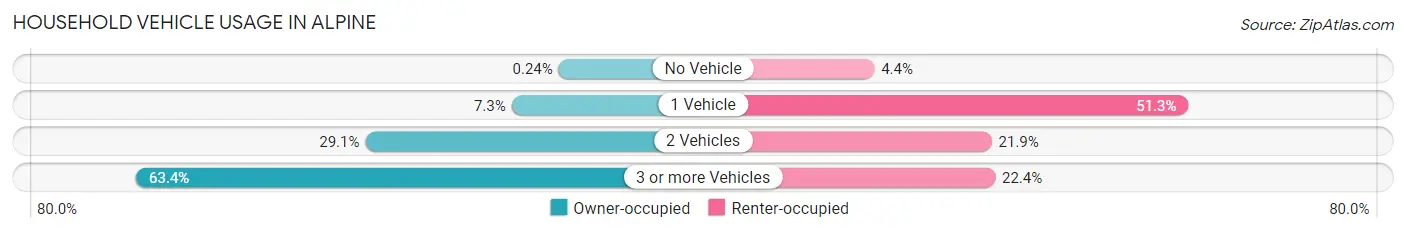
| Vehicles per Household | Owner-occupied | Renter-occupied |
| No Vehicle | 6 (0.2%) | 17 (4.4%) |
| 1 Vehicle | 178 (7.3%) | 199 (51.3%) |
| 2 Vehicles | 713 (29.1%) | 85 (21.9%) |
| 3 or more Vehicles | 1,552 (63.4%) | 87 (22.4%) |
| Total | 2,449 (100.0%) | 388 (100.0%) |
Real Estate & Mortgages in Alpine
Real Estate and Mortgage Overview in Alpine
| Characteristic | Without Mortgage | With Mortgage |
| Housing Units | 1,034 | 1,415 |
| Median Property Value | $806,300 | $822,600 |
| Median Household Income | $181,316 | $845 |
| Monthly Housing Costs | $669 | $660 |
| Real Estate Taxes | $3,772 | $24 |
Property Value by Mortgage Status in Alpine
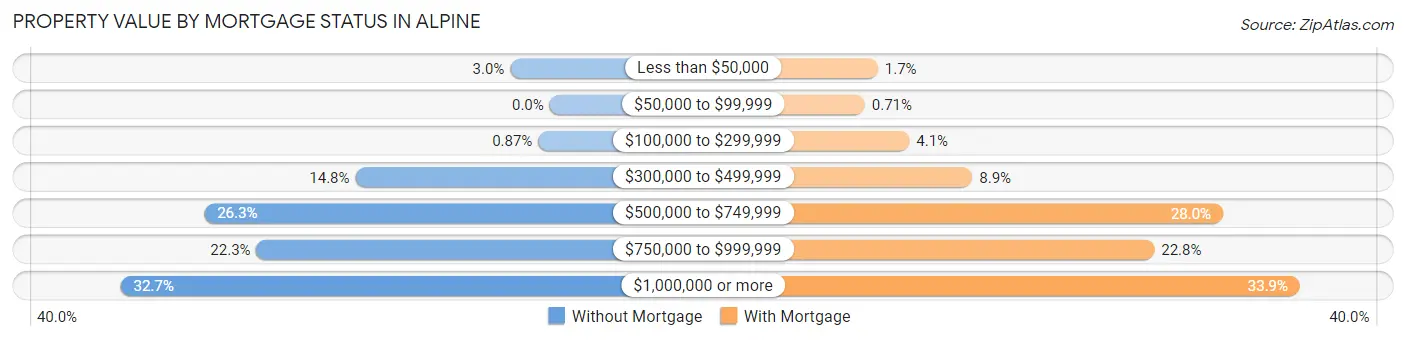
| Property Value | Without Mortgage | With Mortgage |
| Less than $50,000 | 31 (3.0%) | 24 (1.7%) |
| $50,000 to $99,999 | 0 (0.0%) | 10 (0.7%) |
| $100,000 to $299,999 | 9 (0.9%) | 58 (4.1%) |
| $300,000 to $499,999 | 153 (14.8%) | 126 (8.9%) |
| $500,000 to $749,999 | 272 (26.3%) | 396 (28.0%) |
| $750,000 to $999,999 | 231 (22.3%) | 322 (22.8%) |
| $1,000,000 or more | 338 (32.7%) | 479 (33.9%) |
| Total | 1,034 (100.0%) | 1,415 (100.0%) |
Household Income by Mortgage Status in Alpine
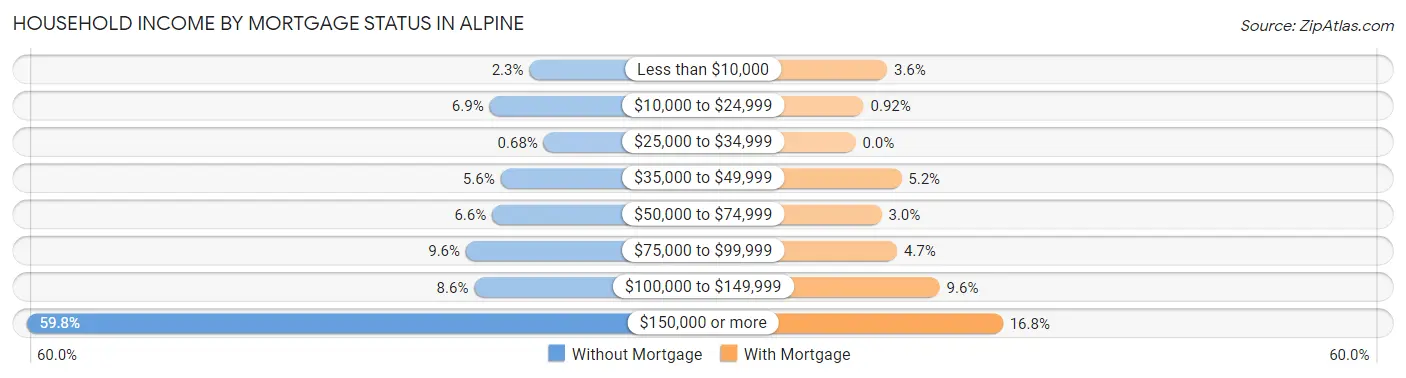
| Household Income | Without Mortgage | With Mortgage |
| Less than $10,000 | 24 (2.3%) | 51 (3.6%) |
| $10,000 to $24,999 | 71 (6.9%) | 13 (0.9%) |
| $25,000 to $34,999 | 7 (0.7%) | 0 (0.0%) |
| $35,000 to $49,999 | 58 (5.6%) | 74 (5.2%) |
| $50,000 to $74,999 | 68 (6.6%) | 42 (3.0%) |
| $75,000 to $99,999 | 99 (9.6%) | 67 (4.7%) |
| $100,000 to $149,999 | 89 (8.6%) | 136 (9.6%) |
| $150,000 or more | 618 (59.8%) | 238 (16.8%) |
| Total | 1,034 (100.0%) | 1,415 (100.0%) |
Property Value to Household Income Ratio in Alpine
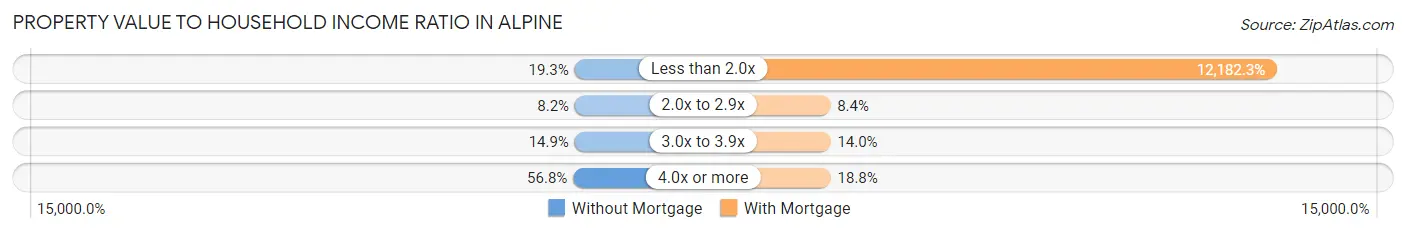
| Value-to-Income Ratio | Without Mortgage | With Mortgage |
| Less than 2.0x | 199 (19.3%) | 172,379 (12,182.3%) |
| 2.0x to 2.9x | 85 (8.2%) | 119 (8.4%) |
| 3.0x to 3.9x | 154 (14.9%) | 198 (14.0%) |
| 4.0x or more | 587 (56.8%) | 266 (18.8%) |
| Total | 1,034 (100.0%) | 1,415 (100.0%) |
Real Estate Taxes by Mortgage Status in Alpine
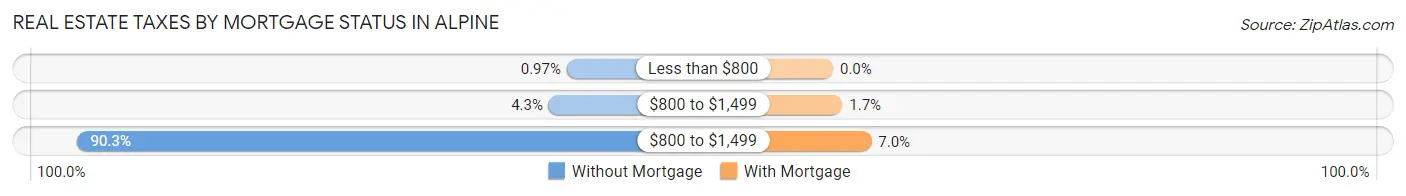
| Property Taxes | Without Mortgage | With Mortgage |
| Less than $800 | 10 (1.0%) | 0 (0.0%) |
| $800 to $1,499 | 44 (4.3%) | 24 (1.7%) |
| $800 to $1,499 | 934 (90.3%) | 99 (7.0%) |
| Total | 1,034 (100.0%) | 1,415 (100.0%) |
Health & Disability in Alpine
Health Insurance Coverage by Age in Alpine
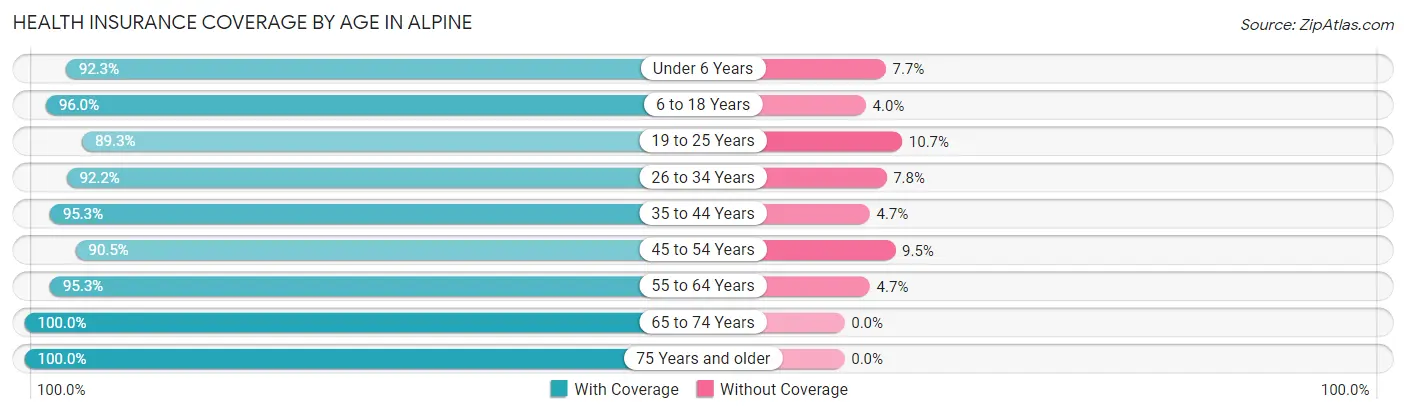
| Age Bracket | With Coverage | Without Coverage |
| Under 6 Years | 588 (92.3%) | 49 (7.7%) |
| 6 to 18 Years | 2,782 (96.0%) | 115 (4.0%) |
| 19 to 25 Years | 947 (89.3%) | 114 (10.7%) |
| 26 to 34 Years | 496 (92.2%) | 42 (7.8%) |
| 35 to 44 Years | 971 (95.3%) | 48 (4.7%) |
| 45 to 54 Years | 1,193 (90.5%) | 125 (9.5%) |
| 55 to 64 Years | 1,290 (95.3%) | 64 (4.7%) |
| 65 to 74 Years | 775 (100.0%) | 0 (0.0%) |
| 75 Years and older | 656 (100.0%) | 0 (0.0%) |
| Total | 9,698 (94.6%) | 557 (5.4%) |
Health Insurance Coverage by Citizenship Status in Alpine
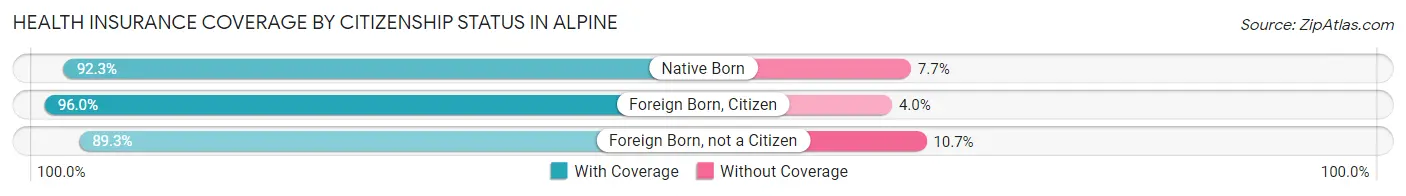
| Citizenship Status | With Coverage | Without Coverage |
| Native Born | 588 (92.3%) | 49 (7.7%) |
| Foreign Born, Citizen | 2,782 (96.0%) | 115 (4.0%) |
| Foreign Born, not a Citizen | 947 (89.3%) | 114 (10.7%) |
Health Insurance Coverage by Household Income in Alpine
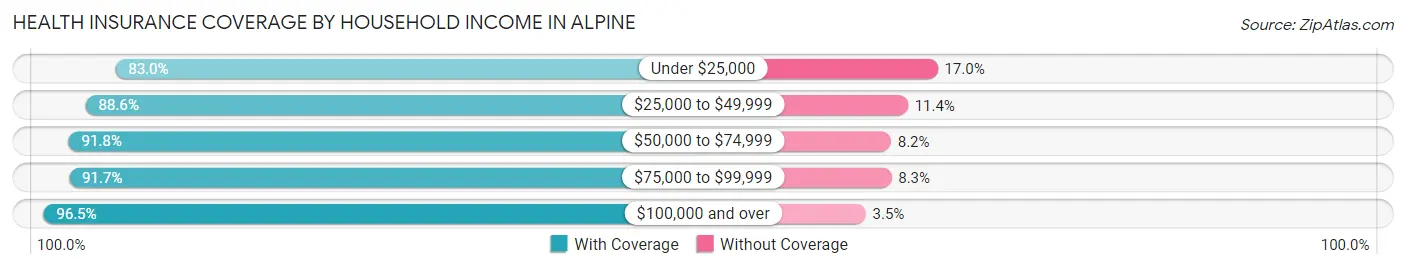
| Household Income | With Coverage | Without Coverage |
| Under $25,000 | 342 (83.0%) | 70 (17.0%) |
| $25,000 to $49,999 | 730 (88.6%) | 94 (11.4%) |
| $50,000 to $74,999 | 468 (91.8%) | 42 (8.2%) |
| $75,000 to $99,999 | 936 (91.7%) | 85 (8.3%) |
| $100,000 and over | 7,219 (96.5%) | 263 (3.5%) |
Public vs Private Health Insurance Coverage by Age in Alpine
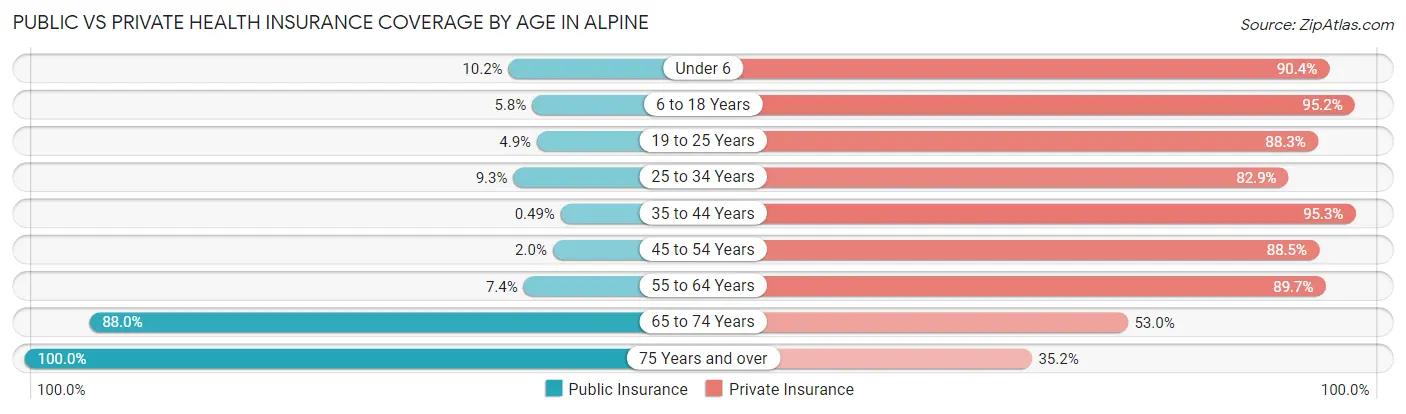
| Age Bracket | Public Insurance | Private Insurance |
| Under 6 | 65 (10.2%) | 576 (90.4%) |
| 6 to 18 Years | 168 (5.8%) | 2,757 (95.2%) |
| 19 to 25 Years | 52 (4.9%) | 937 (88.3%) |
| 25 to 34 Years | 50 (9.3%) | 446 (82.9%) |
| 35 to 44 Years | 5 (0.5%) | 971 (95.3%) |
| 45 to 54 Years | 26 (2.0%) | 1,167 (88.5%) |
| 55 to 64 Years | 100 (7.4%) | 1,215 (89.7%) |
| 65 to 74 Years | 682 (88.0%) | 411 (53.0%) |
| 75 Years and over | 656 (100.0%) | 231 (35.2%) |
| Total | 1,804 (17.6%) | 8,711 (84.9%) |
Disability Status by Sex by Age in Alpine
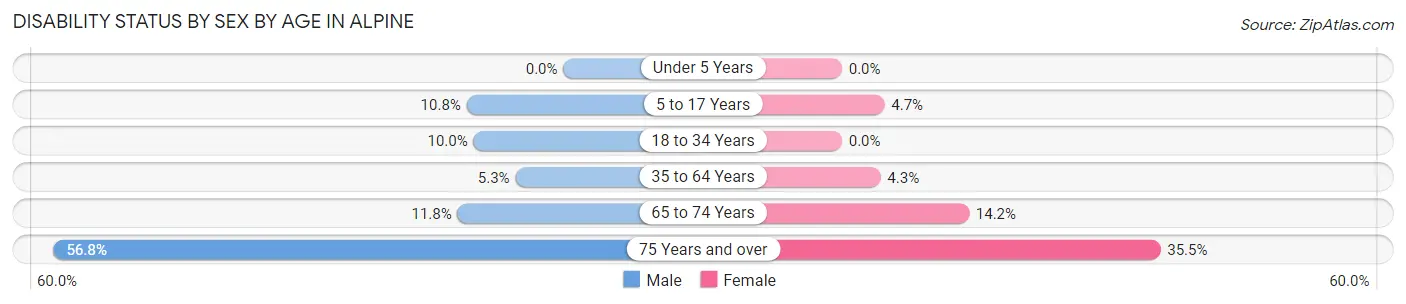
| Age Bracket | Male | Female |
| Under 5 Years | 0 (0.0%) | 0 (0.0%) |
| 5 to 17 Years | 137 (10.8%) | 74 (4.7%) |
| 18 to 34 Years | 96 (10.0%) | 0 (0.0%) |
| 35 to 64 Years | 99 (5.3%) | 79 (4.3%) |
| 65 to 74 Years | 53 (11.8%) | 46 (14.1%) |
| 75 Years and over | 222 (56.8%) | 94 (35.5%) |
Disability Class by Sex by Age in Alpine
Disability Class: Hearing Difficulty
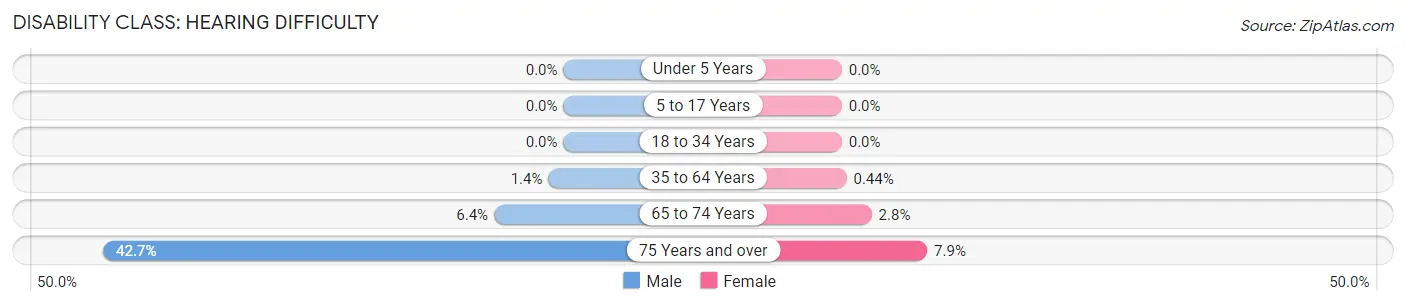
| Age Bracket | Male | Female |
| Under 5 Years | 0 (0.0%) | 0 (0.0%) |
| 5 to 17 Years | 0 (0.0%) | 0 (0.0%) |
| 18 to 34 Years | 0 (0.0%) | 0 (0.0%) |
| 35 to 64 Years | 26 (1.4%) | 8 (0.4%) |
| 65 to 74 Years | 29 (6.4%) | 9 (2.8%) |
| 75 Years and over | 167 (42.7%) | 21 (7.9%) |
Disability Class: Vision Difficulty
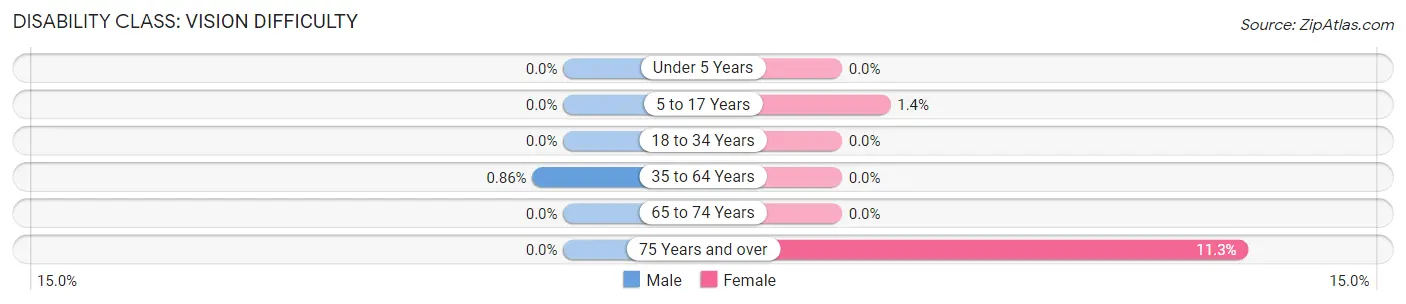
| Age Bracket | Male | Female |
| Under 5 Years | 0 (0.0%) | 0 (0.0%) |
| 5 to 17 Years | 0 (0.0%) | 21 (1.3%) |
| 18 to 34 Years | 0 (0.0%) | 0 (0.0%) |
| 35 to 64 Years | 16 (0.9%) | 0 (0.0%) |
| 65 to 74 Years | 0 (0.0%) | 0 (0.0%) |
| 75 Years and over | 0 (0.0%) | 30 (11.3%) |
Disability Class: Cognitive Difficulty
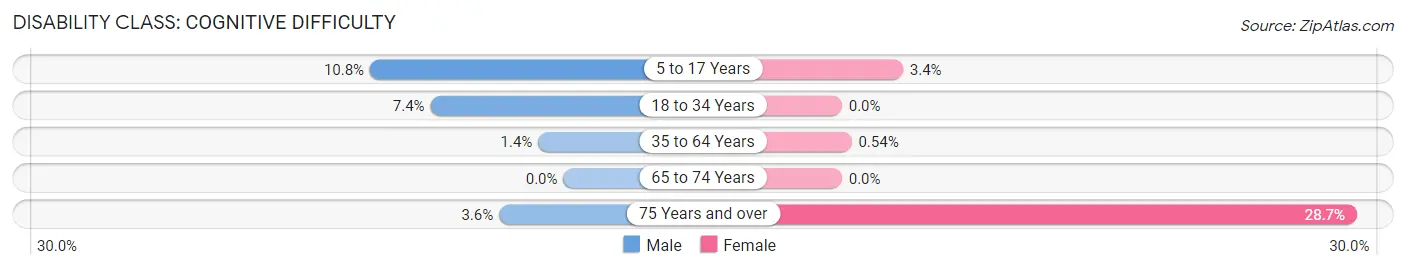
| Age Bracket | Male | Female |
| 5 to 17 Years | 137 (10.8%) | 53 (3.4%) |
| 18 to 34 Years | 71 (7.4%) | 0 (0.0%) |
| 35 to 64 Years | 26 (1.4%) | 10 (0.5%) |
| 65 to 74 Years | 0 (0.0%) | 0 (0.0%) |
| 75 Years and over | 14 (3.6%) | 76 (28.7%) |
Disability Class: Ambulatory Difficulty
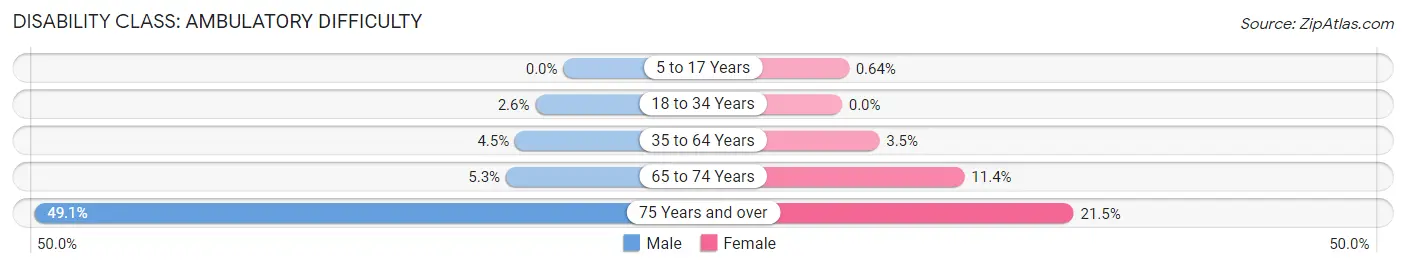
| Age Bracket | Male | Female |
| 5 to 17 Years | 0 (0.0%) | 10 (0.6%) |
| 18 to 34 Years | 25 (2.6%) | 0 (0.0%) |
| 35 to 64 Years | 83 (4.5%) | 64 (3.5%) |
| 65 to 74 Years | 24 (5.3%) | 37 (11.4%) |
| 75 Years and over | 192 (49.1%) | 57 (21.5%) |
Disability Class: Self-Care Difficulty
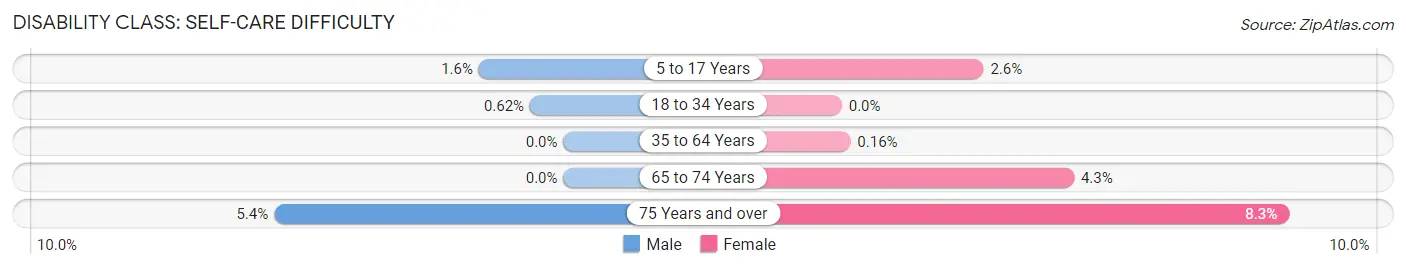
| Age Bracket | Male | Female |
| 5 to 17 Years | 20 (1.6%) | 41 (2.6%) |
| 18 to 34 Years | 6 (0.6%) | 0 (0.0%) |
| 35 to 64 Years | 0 (0.0%) | 3 (0.2%) |
| 65 to 74 Years | 0 (0.0%) | 14 (4.3%) |
| 75 Years and over | 21 (5.4%) | 22 (8.3%) |
Technology Access in Alpine
Computing Device Access in Alpine
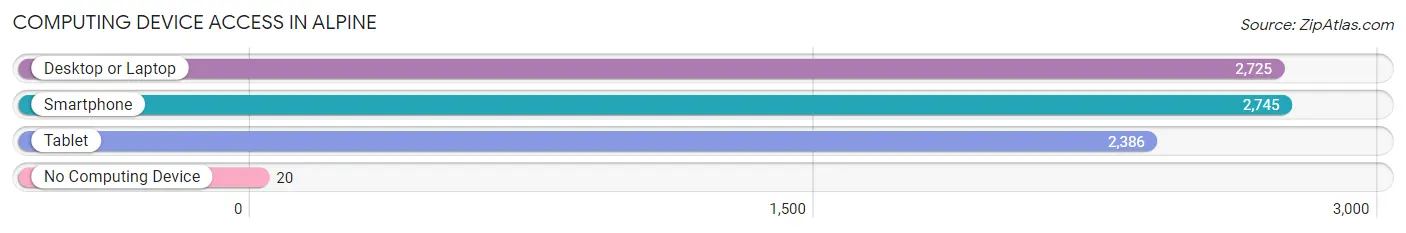
| Device Type | # Households | % Households |
| Desktop or Laptop | 2,725 | 96.1% |
| Smartphone | 2,745 | 96.8% |
| Tablet | 2,386 | 84.1% |
| No Computing Device | 20 | 0.7% |
| Total | 2,837 | 100.0% |
Internet Access in Alpine
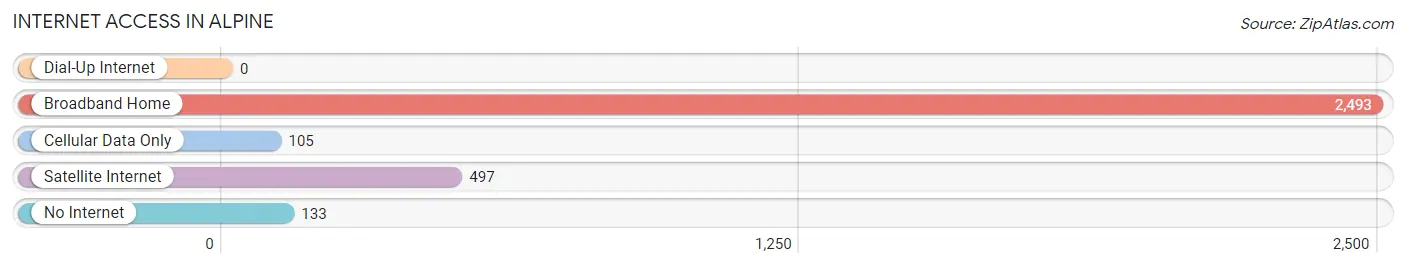
| Internet Type | # Households | % Households |
| Dial-Up Internet | 0 | 0.0% |
| Broadband Home | 2,493 | 87.9% |
| Cellular Data Only | 105 | 3.7% |
| Satellite Internet | 497 | 17.5% |
| No Internet | 133 | 4.7% |
| Total | 2,837 | 100.0% |
Alpine Summary
Alpine is a city located in Utah County, Utah, United States. It is part of the Provo-Orem Metropolitan Statistical Area. The population was 9,555 at the 2010 census. Alpine is located on the slopes of the Wasatch Range, about twenty miles southeast of Salt Lake City.
Geography
Alpine is located at 40°17'25" North, 111°37'48" West (40.290278, -111.630056). According to the United States Census Bureau, the city has a total area of 5.7 square miles, all of it land.
Demographics
As of the census of 2000, there were 8,527 people, 2,541 households, and 2,092 families residing in the city. The population density was 1,491.3 people per square mile (575.3/km²). There were 2,637 housing units at an average density of 459.3 per square mile (177.5/km²). The racial makeup of the city was 94.90% White, 0.17% African American, 0.30% Native American, 0.90% Asian, 0.05% Pacific Islander, 2.17% from other races, and 1.51% from two or more races. Hispanic or Latino of any race were 4.90% of the population.
Economy
Alpine is home to several businesses, including a number of tech companies, such as Adobe, Ancestry.com, and Vivint. The city is also home to a number of retail stores, restaurants, and other businesses.
The city is also home to a number of educational institutions, including Utah Valley University, Brigham Young University, and Utah Valley Community College.
The city is served by the Utah Transit Authority, which provides bus service to the surrounding area.
The city is also home to a number of parks and recreational facilities, including the Alpine City Park, the Alpine Golf Course, and the Alpine Aquatic Center.
Conclusion
Alpine is a city located in Utah County, Utah, United States. It is part of the Provo-Orem Metropolitan Statistical Area. The population was 9,555 at the 2010 census. Alpine is located on the slopes of the Wasatch Range, about twenty miles southeast of Salt Lake City. The city is home to a number of businesses, educational institutions, and recreational facilities. The city is served by the Utah Transit Authority, which provides bus service to the surrounding area.
Common Questions
What is Per Capita Income in Alpine?
Per Capita income in Alpine is $58,980.
What is the Median Family Income in Alpine?
Median Family Income in Alpine is $171,063.
What is the Median Household income in Alpine?
Median Household Income in Alpine is $161,602.
What is Income or Wage Gap in Alpine?
Income or Wage Gap in Alpine is 70.8%.
Women in Alpine earn 29.2 cents for every dollar earned by a man.
What is Inequality or Gini Index in Alpine?
Inequality or Gini Index in Alpine is 0.50.
What is the Total Population of Alpine?
Total Population of Alpine is 10,260.
What is the Total Male Population of Alpine?
Total Male Population of Alpine is 5,235.
What is the Total Female Population of Alpine?
Total Female Population of Alpine is 5,025.
What is the Ratio of Males per 100 Females in Alpine?
There are 104.18 Males per 100 Females in Alpine.
What is the Ratio of Females per 100 Males in Alpine?
There are 95.99 Females per 100 Males in Alpine.
What is the Median Population Age in Alpine?
Median Population Age in Alpine is 35.0 Years.
What is the Average Family Size in Alpine
Average Family Size in Alpine is 3.9 People.
What is the Average Household Size in Alpine
Average Household Size in Alpine is 3.6 People.
How Large is the Labor Force in Alpine?
There are 4,425 People in the Labor Forcein in Alpine.
What is the Percentage of People in the Labor Force in Alpine?
59.2% of People are in the Labor Force in Alpine.
What is the Unemployment Rate in Alpine?
Unemployment Rate in Alpine is 1.6%.