Price, UT Map & Demographics
Price Map
Price Overview
$23,727
PER CAPITA INCOME
$58,750
AVG FAMILY INCOME
$47,724
AVG HOUSEHOLD INCOME
62.0%
WAGE / INCOME GAP [ % ]
38.0¢/ $1
WAGE / INCOME GAP [ $ ]
0.44
INEQUALITY / GINI INDEX
8,174
TOTAL POPULATION
4,078
MALE POPULATION
4,096
FEMALE POPULATION
99.56
MALES / 100 FEMALES
100.44
FEMALES / 100 MALES
36.1
MEDIAN AGE
3.1
AVG FAMILY SIZE
2.4
AVG HOUSEHOLD SIZE
3,746
LABOR FORCE [ PEOPLE ]
58.8%
PERCENT IN LABOR FORCE
8.2%
UNEMPLOYMENT RATE
Price Zip Codes
Price Area Codes
Income in Price
Income Overview in Price
Per Capita Income in Price is $23,727, while median incomes of families and households are $58,750 and $47,724 respectively.
| Characteristic | Number | Measure |
| Per Capita Income | 8,174 | $23,727 |
| Median Family Income | 2,016 | $58,750 |
| Mean Family Income | 2,016 | $75,865 |
| Median Household Income | 3,242 | $47,724 |
| Mean Household Income | 3,242 | $59,817 |
| Income Deficit | 2,016 | $0 |
| Wage / Income Gap (%) | 8,174 | 61.99% |
| Wage / Income Gap ($) | 8,174 | 38.01¢ per $1 |
| Gini / Inequality Index | 8,174 | 0.44 |
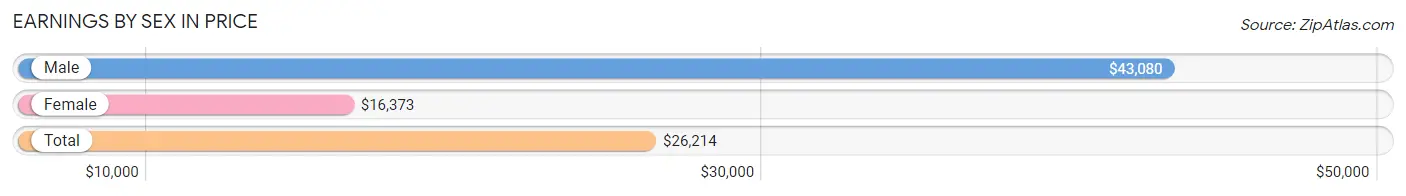
Earnings by Sex in Price
Average Earnings in Price are $26,214, $43,080 for men and $16,373 for women, a difference of 62.0%.
| Sex | Number | Average Earnings |
| Male | 2,076 (52.4%) | $43,080 |
| Female | 1,882 (47.5%) | $16,373 |
| Total | 3,958 (100.0%) | $26,214 |
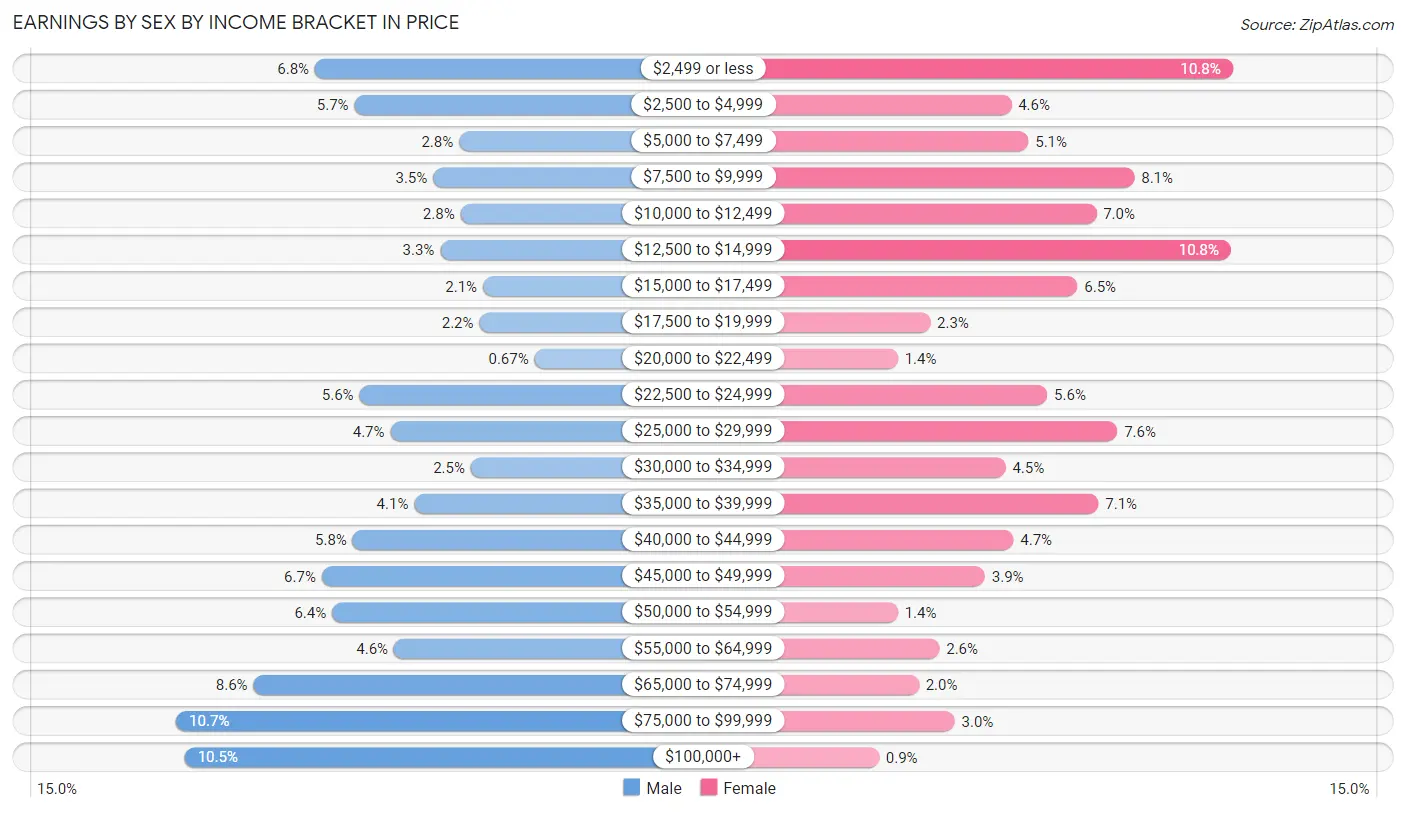
Earnings by Sex by Income Bracket in Price
The most common earnings brackets in Price are $75,000 to $99,999 for men (223 | 10.7%) and $2,499 or less for women (204 | 10.8%).
| Income | Male | Female |
| $2,499 or less | 142 (6.8%) | 204 (10.8%) |
| $2,500 to $4,999 | 119 (5.7%) | 87 (4.6%) |
| $5,000 to $7,499 | 58 (2.8%) | 96 (5.1%) |
| $7,500 to $9,999 | 73 (3.5%) | 152 (8.1%) |
| $10,000 to $12,499 | 57 (2.8%) | 132 (7.0%) |
| $12,500 to $14,999 | 69 (3.3%) | 203 (10.8%) |
| $15,000 to $17,499 | 44 (2.1%) | 122 (6.5%) |
| $17,500 to $19,999 | 46 (2.2%) | 44 (2.3%) |
| $20,000 to $22,499 | 14 (0.7%) | 27 (1.4%) |
| $22,500 to $24,999 | 116 (5.6%) | 106 (5.6%) |
| $25,000 to $29,999 | 98 (4.7%) | 143 (7.6%) |
| $30,000 to $34,999 | 51 (2.5%) | 84 (4.5%) |
| $35,000 to $39,999 | 84 (4.1%) | 133 (7.1%) |
| $40,000 to $44,999 | 120 (5.8%) | 88 (4.7%) |
| $45,000 to $49,999 | 138 (6.7%) | 73 (3.9%) |
| $50,000 to $54,999 | 132 (6.4%) | 27 (1.4%) |
| $55,000 to $64,999 | 96 (4.6%) | 49 (2.6%) |
| $65,000 to $74,999 | 178 (8.6%) | 38 (2.0%) |
| $75,000 to $99,999 | 223 (10.7%) | 57 (3.0%) |
| $100,000+ | 218 (10.5%) | 17 (0.9%) |
| Total | 2,076 (100.0%) | 1,882 (100.0%) |
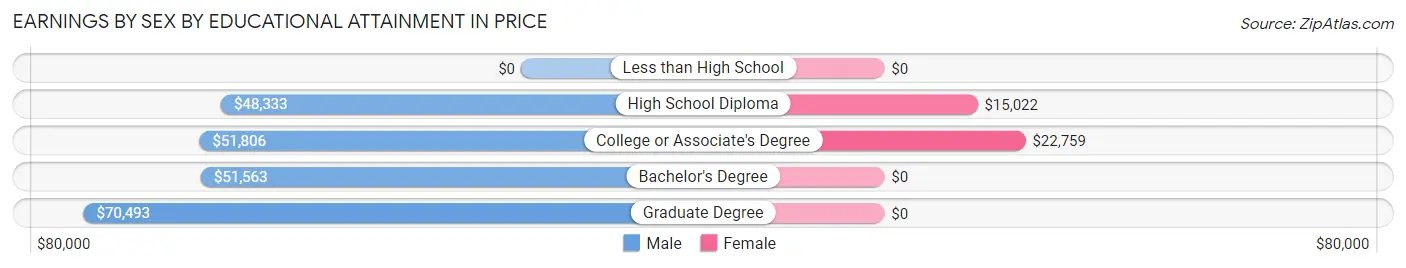
Earnings by Sex by Educational Attainment in Price
Average earnings in Price are $50,233 for men and $19,132 for women, a difference of 61.9%. Men with an educational attainment of graduate degree enjoy the highest average annual earnings of $70,493, while those with high school diploma education earn the least with $48,333. Women with an educational attainment of college or associate's degree earn the most with the average annual earnings of $22,759, while those with high school diploma education have the smallest earnings of $15,022.
| Educational Attainment | Male Income | Female Income |
| Less than High School | - | - |
| High School Diploma | $48,333 | $15,022 |
| College or Associate's Degree | $51,806 | $22,759 |
| Bachelor's Degree | $51,563 | $0 |
| Graduate Degree | $70,493 | $0 |
| Total | $50,233 | $19,132 |
Family Income in Price
Family Income Brackets in Price
According to the Price family income data, there are 375 families falling into the $100,000 to $149,999 income range, which is the most common income bracket and makes up 18.6% of all families. Conversely, the $200,000+ income bracket is the least frequent group with only 28 families (1.4%) belonging to this category.
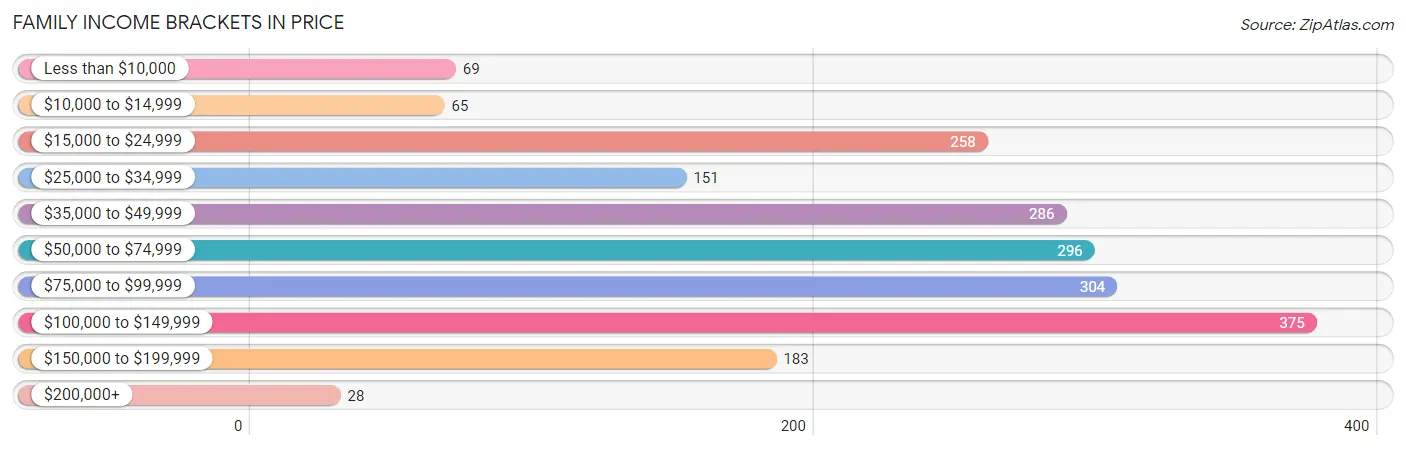
| Income Bracket | # Families | % Families |
| Less than $10,000 | 69 | 3.4% |
| $10,000 to $14,999 | 65 | 3.2% |
| $15,000 to $24,999 | 258 | 12.8% |
| $25,000 to $34,999 | 151 | 7.5% |
| $35,000 to $49,999 | 286 | 14.2% |
| $50,000 to $74,999 | 296 | 14.7% |
| $75,000 to $99,999 | 304 | 15.1% |
| $100,000 to $149,999 | 375 | 18.6% |
| $150,000 to $199,999 | 183 | 9.1% |
| $200,000+ | 28 | 1.4% |
Family Income by Famaliy Size in Price
6-person families (100 | 5.0%) account for the highest median family income in Price with $91,071 per family, while 2-person families (784 | 38.9%) have the highest median income of $28,000 per family member.
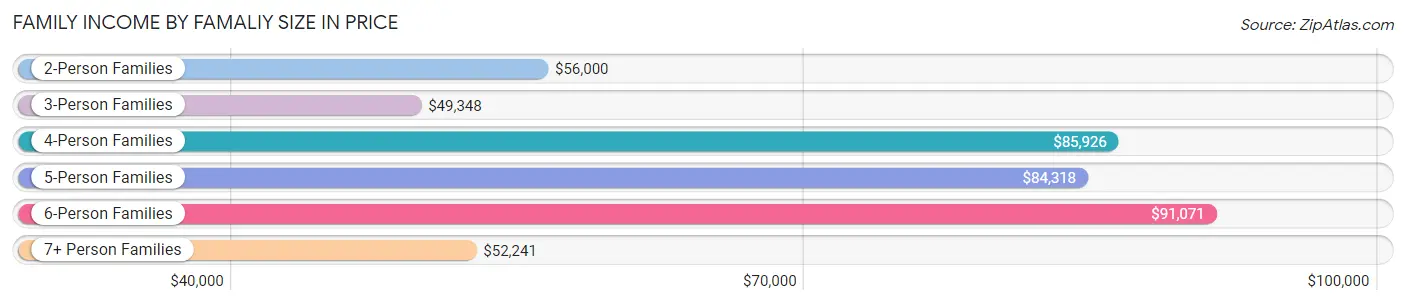
| Income Bracket | # Families | Median Income |
| 2-Person Families | 784 (38.9%) | $56,000 |
| 3-Person Families | 540 (26.8%) | $49,348 |
| 4-Person Families | 340 (16.9%) | $85,926 |
| 5-Person Families | 200 (9.9%) | $84,318 |
| 6-Person Families | 100 (5.0%) | $91,071 |
| 7+ Person Families | 52 (2.6%) | $52,241 |
| Total | 2,016 (100.0%) | $58,750 |
Family Income by Number of Earners in Price
The median family income in Price is $58,750, with families comprising 3+ earners (214) having the highest median family income of $117,763, while families with no earners (302) have the lowest median family income of $28,750, accounting for 10.6% and 15.0% of families, respectively.
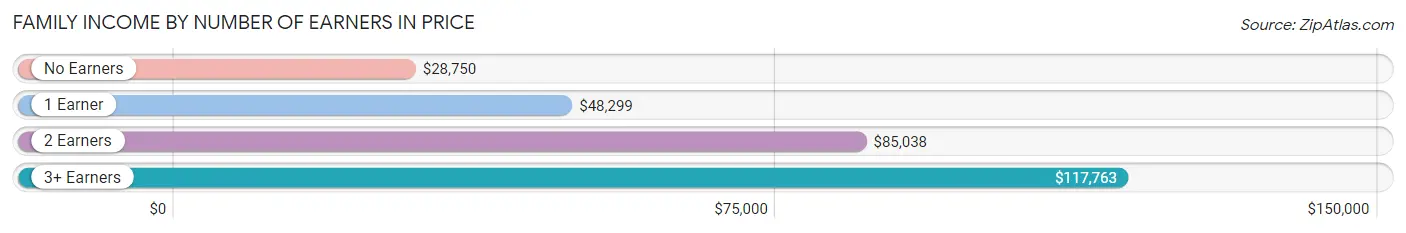
| Number of Earners | # Families | Median Income |
| No Earners | 302 (15.0%) | $28,750 |
| 1 Earner | 616 (30.6%) | $48,299 |
| 2 Earners | 884 (43.9%) | $85,038 |
| 3+ Earners | 214 (10.6%) | $117,763 |
| Total | 2,016 (100.0%) | $58,750 |
Household Income in Price
Household Income Brackets in Price
With 567 households falling in the category, the $50,000 to $74,999 income range is the most frequent in Price, accounting for 17.5% of all households. In contrast, only 29 households (0.9%) fall into the $200,000+ income bracket, making it the least populous group.
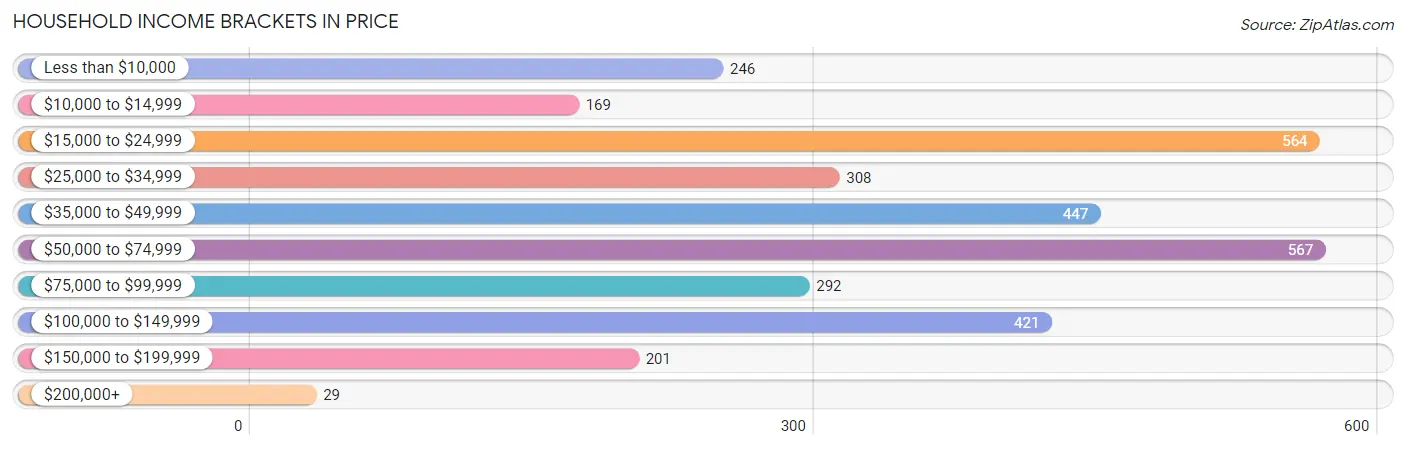
| Income Bracket | # Households | % Households |
| Less than $10,000 | 246 | 7.6% |
| $10,000 to $14,999 | 169 | 5.2% |
| $15,000 to $24,999 | 564 | 17.4% |
| $25,000 to $34,999 | 308 | 9.5% |
| $35,000 to $49,999 | 447 | 13.8% |
| $50,000 to $74,999 | 567 | 17.5% |
| $75,000 to $99,999 | 292 | 9.0% |
| $100,000 to $149,999 | 421 | 13.0% |
| $150,000 to $199,999 | 201 | 6.2% |
| $200,000+ | 29 | 0.9% |
Household Income by Householder Age in Price
The median household income in Price is $47,724, with the highest median household income of $53,015 found in the 25 to 44 years age bracket for the primary householder. A total of 989 households (30.5%) fall into this category. Meanwhile, the 15 to 24 years age bracket for the primary householder has the lowest median household income of $0, with 248 households (7.6%) in this group.
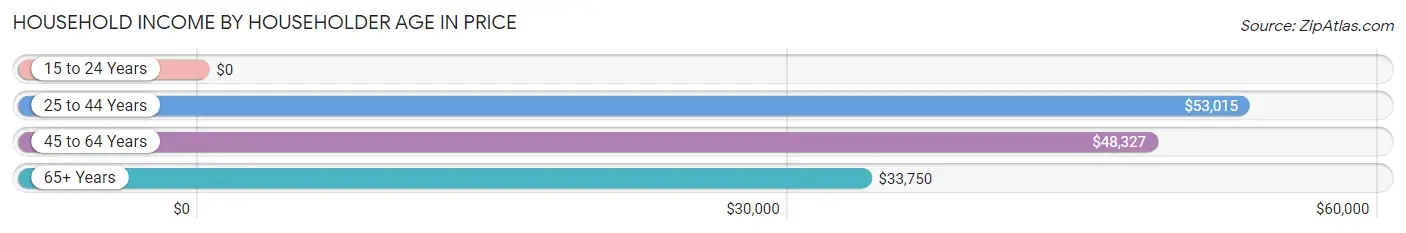
| Income Bracket | # Households | Median Income |
| 15 to 24 Years | 248 (7.6%) | $0 |
| 25 to 44 Years | 989 (30.5%) | $53,015 |
| 45 to 64 Years | 1,085 (33.5%) | $48,327 |
| 65+ Years | 920 (28.4%) | $33,750 |
| Total | 3,242 (100.0%) | $47,724 |
Poverty in Price
Income Below Poverty by Sex and Age in Price
With 15.4% poverty level for males and 18.9% for females among the residents of Price, 25 to 34 year old males and 16 and 17 year old females are the most vulnerable to poverty, with 118 males (24.0%) and 44 females (44.9%) in their respective age groups living below the poverty level.
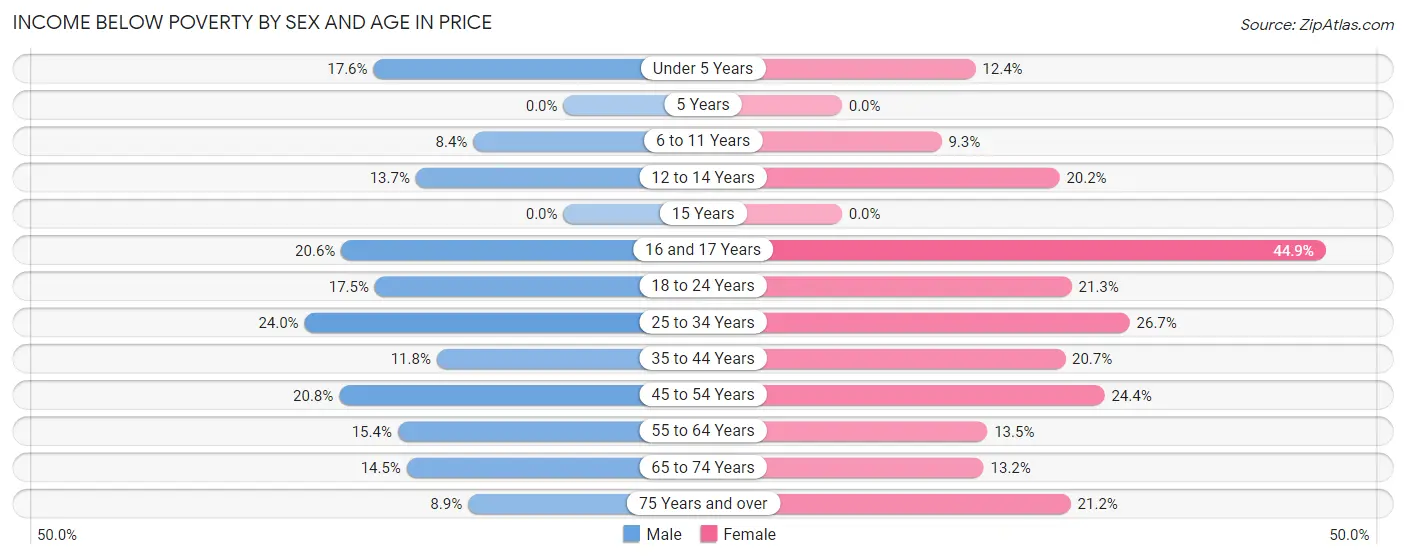
| Age Bracket | Male | Female |
| Under 5 Years | 52 (17.6%) | 31 (12.4%) |
| 5 Years | 0 (0.0%) | 0 (0.0%) |
| 6 to 11 Years | 22 (8.4%) | 27 (9.2%) |
| 12 to 14 Years | 20 (13.7%) | 40 (20.2%) |
| 15 Years | 0 (0.0%) | 0 (0.0%) |
| 16 and 17 Years | 40 (20.6%) | 44 (44.9%) |
| 18 to 24 Years | 49 (17.5%) | 93 (21.3%) |
| 25 to 34 Years | 118 (24.0%) | 133 (26.7%) |
| 35 to 44 Years | 53 (11.7%) | 104 (20.7%) |
| 45 to 54 Years | 103 (20.8%) | 99 (24.4%) |
| 55 to 64 Years | 75 (15.4%) | 59 (13.5%) |
| 65 to 74 Years | 49 (14.5%) | 60 (13.2%) |
| 75 Years and over | 20 (8.8%) | 55 (21.2%) |
| Total | 601 (15.4%) | 745 (18.9%) |
Income Above Poverty by Sex and Age in Price
According to the poverty statistics in Price, males aged 5 years and females aged 5 years are the age groups that are most secure financially, with 100.0% of males and 100.0% of females in these age groups living above the poverty line.
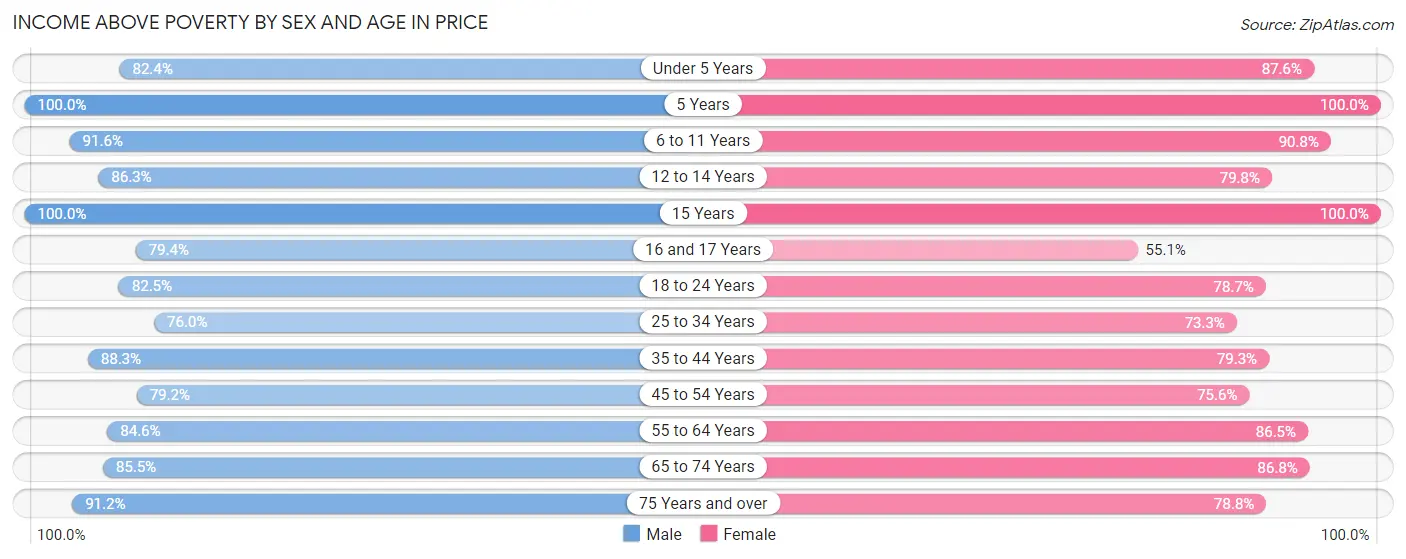
| Age Bracket | Male | Female |
| Under 5 Years | 243 (82.4%) | 219 (87.6%) |
| 5 Years | 164 (100.0%) | 60 (100.0%) |
| 6 to 11 Years | 241 (91.6%) | 265 (90.7%) |
| 12 to 14 Years | 126 (86.3%) | 158 (79.8%) |
| 15 Years | 64 (100.0%) | 48 (100.0%) |
| 16 and 17 Years | 154 (79.4%) | 54 (55.1%) |
| 18 to 24 Years | 231 (82.5%) | 343 (78.7%) |
| 25 to 34 Years | 373 (76.0%) | 365 (73.3%) |
| 35 to 44 Years | 398 (88.2%) | 398 (79.3%) |
| 45 to 54 Years | 392 (79.2%) | 307 (75.6%) |
| 55 to 64 Years | 413 (84.6%) | 378 (86.5%) |
| 65 to 74 Years | 288 (85.5%) | 396 (86.8%) |
| 75 Years and over | 206 (91.1%) | 204 (78.8%) |
| Total | 3,293 (84.6%) | 3,195 (81.1%) |
Income Below Poverty Among Married-Couple Families in Price
The poverty statistics for married-couple families in Price show that 13.5% or 210 of the total 1,552 families live below the poverty line. Families with 3 or 4 children have the highest poverty rate of 27.9%, comprising of 66 families. On the other hand, families with 5 or more children have the lowest poverty rate of 0.0%, which includes 0 families.
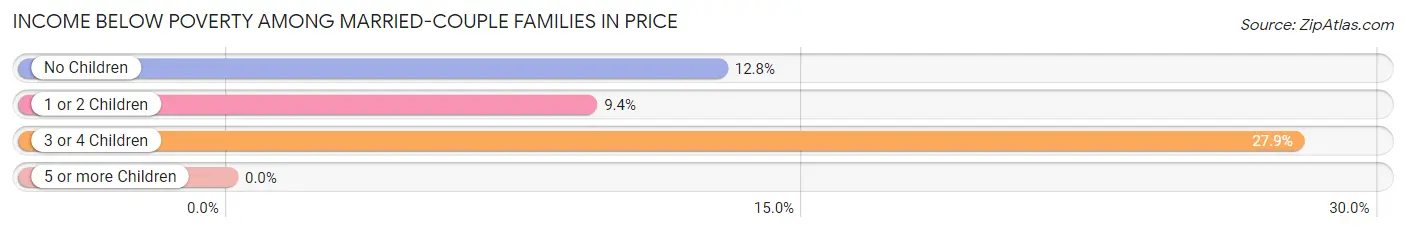
| Children | Above Poverty | Below Poverty |
| No Children | 641 (87.2%) | 94 (12.8%) |
| 1 or 2 Children | 483 (90.6%) | 50 (9.4%) |
| 3 or 4 Children | 171 (72.2%) | 66 (27.9%) |
| 5 or more Children | 47 (100.0%) | 0 (0.0%) |
| Total | 1,342 (86.5%) | 210 (13.5%) |
Income Below Poverty Among Single-Parent Households in Price
According to the poverty data in Price, 4.3% or 9 single-father households and 37.1% or 94 single-mother households are living below the poverty line. Among single-father households, those with 3 or 4 children have the highest poverty rate, with 9 households (100.0%) experiencing poverty. Likewise, among single-mother households, those with 1 or 2 children have the highest poverty rate, with 73 households (41.5%) falling below the poverty line.
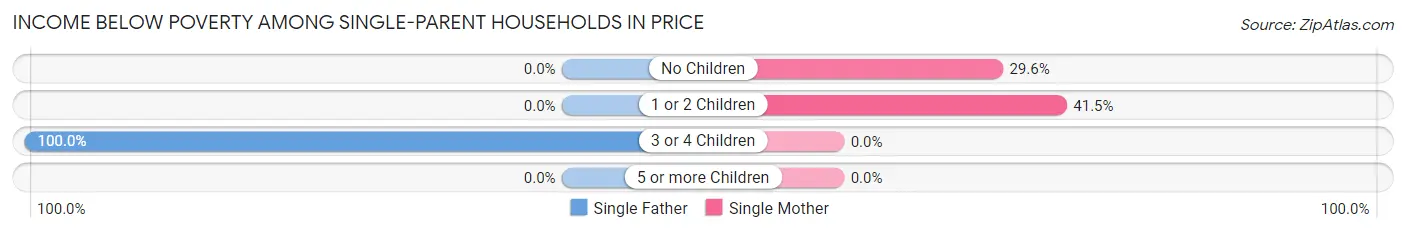
| Children | Single Father | Single Mother |
| No Children | 0 (0.0%) | 21 (29.6%) |
| 1 or 2 Children | 0 (0.0%) | 73 (41.5%) |
| 3 or 4 Children | 9 (100.0%) | 0 (0.0%) |
| 5 or more Children | 0 (0.0%) | 0 (0.0%) |
| Total | 9 (4.3%) | 94 (37.1%) |
Income Below Poverty Among Married-Couple vs Single-Parent Households in Price
The poverty data for Price shows that 210 of the married-couple family households (13.5%) and 103 of the single-parent households (22.2%) are living below the poverty level. Within the married-couple family households, those with 3 or 4 children have the highest poverty rate, with 66 households (27.9%) falling below the poverty line. Among the single-parent households, those with 3 or 4 children have the highest poverty rate, with 9 household (60.0%) living below poverty.
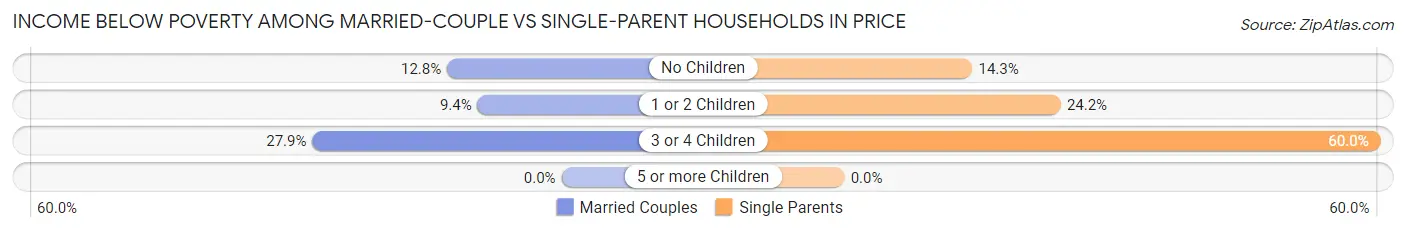
| Children | Married-Couple Families | Single-Parent Households |
| No Children | 94 (12.8%) | 21 (14.3%) |
| 1 or 2 Children | 50 (9.4%) | 73 (24.2%) |
| 3 or 4 Children | 66 (27.9%) | 9 (60.0%) |
| 5 or more Children | 0 (0.0%) | 0 (0.0%) |
| Total | 210 (13.5%) | 103 (22.2%) |
Race in Price
The most populous races in Price are White / Caucasian (6,910 | 84.5%), Hispanic or Latino (1,652 | 20.2%), and Two or more Races (698 | 8.5%).
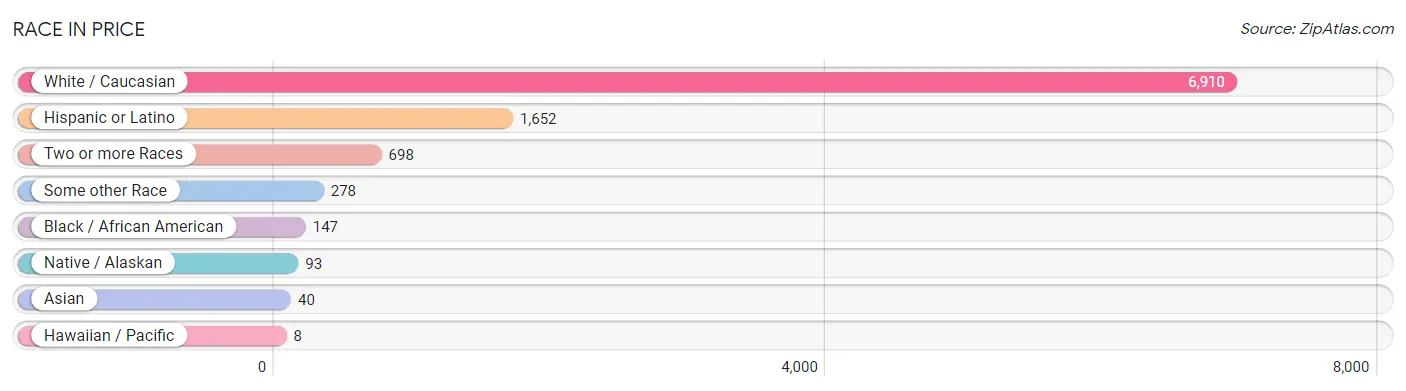
| Race | # Population | % Population |
| Asian | 40 | 0.5% |
| Black / African American | 147 | 1.8% |
| Hawaiian / Pacific | 8 | 0.1% |
| Hispanic or Latino | 1,652 | 20.2% |
| Native / Alaskan | 93 | 1.1% |
| White / Caucasian | 6,910 | 84.5% |
| Two or more Races | 698 | 8.5% |
| Some other Race | 278 | 3.4% |
| Total | 8,174 | 100.0% |
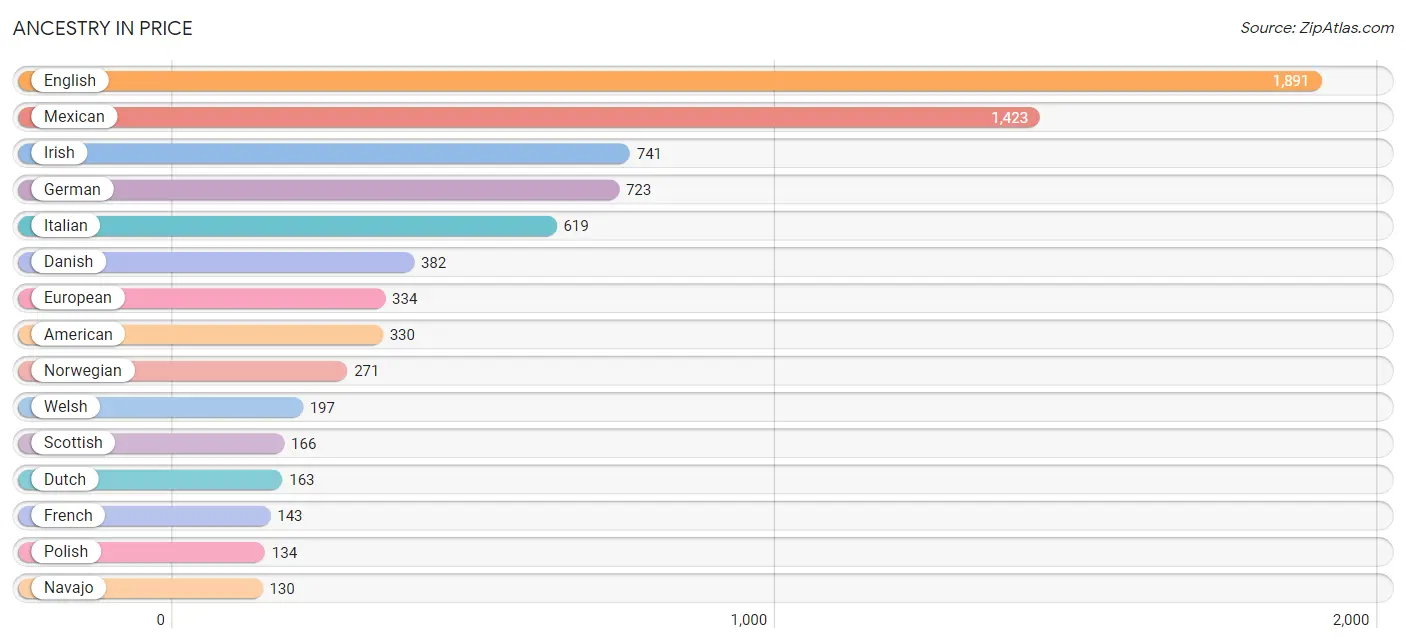
Ancestry in Price
The most populous ancestries reported in Price are English (1,891 | 23.1%), Mexican (1,423 | 17.4%), Irish (741 | 9.1%), German (723 | 8.8%), and Italian (619 | 7.6%), together accounting for 66.0% of all Price residents.
| Ancestry | # Population | % Population |
| American | 330 | 4.0% |
| Apache | 10 | 0.1% |
| Argentinean | 22 | 0.3% |
| Austrian | 56 | 0.7% |
| Basque | 11 | 0.1% |
| Brazilian | 8 | 0.1% |
| British | 41 | 0.5% |
| Burmese | 21 | 0.3% |
| Cherokee | 13 | 0.2% |
| Choctaw | 6 | 0.1% |
| Croatian | 10 | 0.1% |
| Danish | 382 | 4.7% |
| Dutch | 163 | 2.0% |
| English | 1,891 | 23.1% |
| European | 334 | 4.1% |
| French | 143 | 1.8% |
| French Canadian | 40 | 0.5% |
| German | 723 | 8.8% |
| Greek | 79 | 1.0% |
| Hungarian | 11 | 0.1% |
| Icelander | 16 | 0.2% |
| Indian (Asian) | 1 | 0.0% |
| Irish | 741 | 9.1% |
| Italian | 619 | 7.6% |
| Korean | 39 | 0.5% |
| Mexican | 1,423 | 17.4% |
| Mexican American Indian | 24 | 0.3% |
| Native Hawaiian | 8 | 0.1% |
| Navajo | 130 | 1.6% |
| Northern European | 9 | 0.1% |
| Norwegian | 271 | 3.3% |
| Polish | 134 | 1.6% |
| Portuguese | 11 | 0.1% |
| Pueblo | 15 | 0.2% |
| Scandinavian | 63 | 0.8% |
| Scotch-Irish | 67 | 0.8% |
| Scottish | 166 | 2.0% |
| Sioux | 13 | 0.2% |
| Slavic | 3 | 0.0% |
| Slovak | 8 | 0.1% |
| Slovene | 19 | 0.2% |
| South American | 22 | 0.3% |
| Spaniard | 125 | 1.5% |
| Spanish | 50 | 0.6% |
| Swedish | 104 | 1.3% |
| Swiss | 24 | 0.3% |
| Ute | 14 | 0.2% |
| Welsh | 197 | 2.4% | View All 48 Rows |
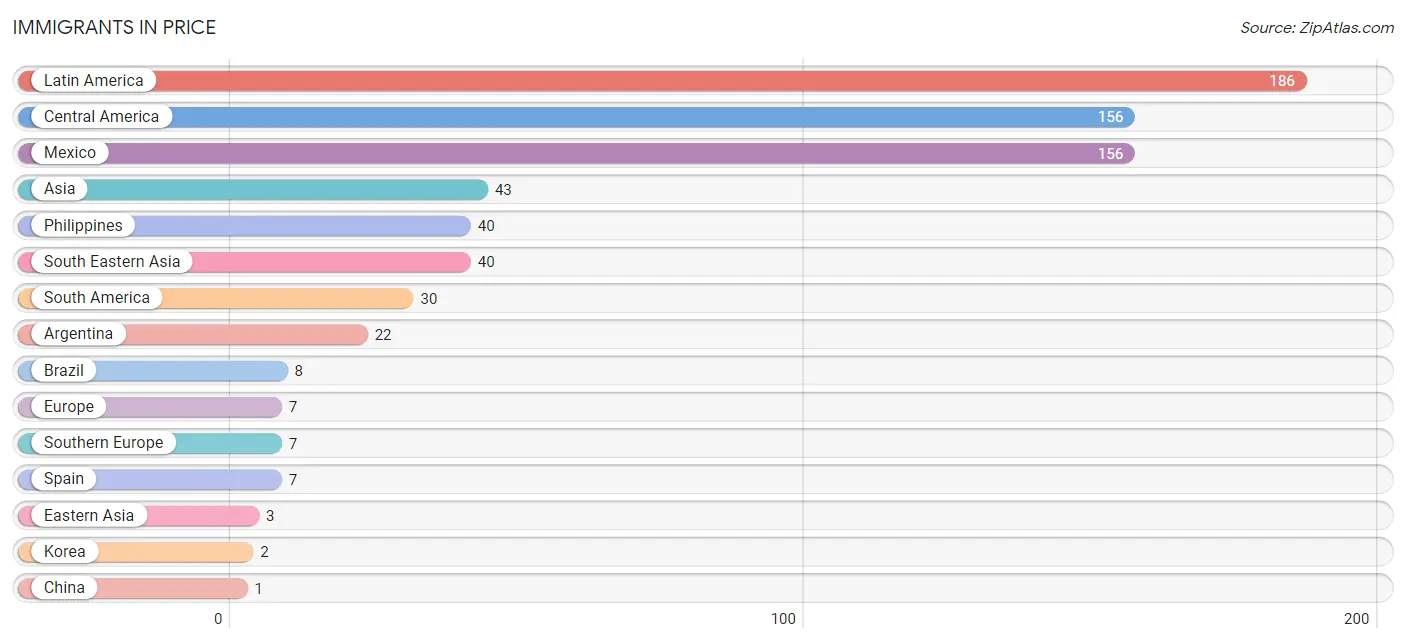
Immigrants in Price
The most numerous immigrant groups reported in Price came from Latin America (186 | 2.3%), Central America (156 | 1.9%), Mexico (156 | 1.9%), Asia (43 | 0.5%), and Philippines (40 | 0.5%), together accounting for 7.1% of all Price residents.
| Immigration Origin | # Population | % Population |
| Argentina | 22 | 0.3% |
| Asia | 43 | 0.5% |
| Brazil | 8 | 0.1% |
| Central America | 156 | 1.9% |
| China | 1 | 0.0% |
| Eastern Asia | 3 | 0.0% |
| Europe | 7 | 0.1% |
| Korea | 2 | 0.0% |
| Latin America | 186 | 2.3% |
| Mexico | 156 | 1.9% |
| Philippines | 40 | 0.5% |
| South America | 30 | 0.4% |
| South Eastern Asia | 40 | 0.5% |
| Southern Europe | 7 | 0.1% |
| Spain | 7 | 0.1% | View All 15 Rows |
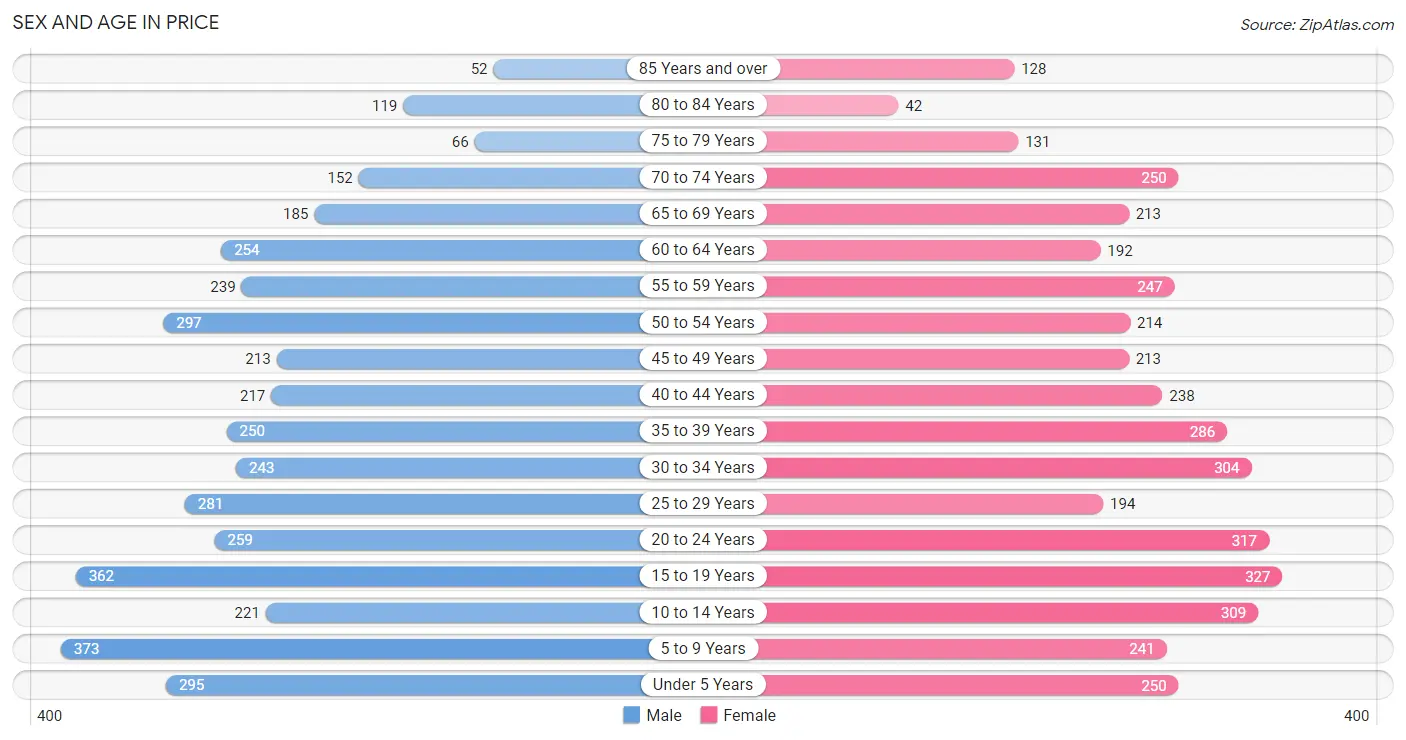
Sex and Age in Price
Sex and Age in Price
The most populous age groups in Price are 5 to 9 Years (373 | 9.1%) for men and 15 to 19 Years (327 | 8.0%) for women.
| Age Bracket | Male | Female |
| Under 5 Years | 295 (7.2%) | 250 (6.1%) |
| 5 to 9 Years | 373 (9.1%) | 241 (5.9%) |
| 10 to 14 Years | 221 (5.4%) | 309 (7.5%) |
| 15 to 19 Years | 362 (8.9%) | 327 (8.0%) |
| 20 to 24 Years | 259 (6.4%) | 317 (7.7%) |
| 25 to 29 Years | 281 (6.9%) | 194 (4.7%) |
| 30 to 34 Years | 243 (6.0%) | 304 (7.4%) |
| 35 to 39 Years | 250 (6.1%) | 286 (7.0%) |
| 40 to 44 Years | 217 (5.3%) | 238 (5.8%) |
| 45 to 49 Years | 213 (5.2%) | 213 (5.2%) |
| 50 to 54 Years | 297 (7.3%) | 214 (5.2%) |
| 55 to 59 Years | 239 (5.9%) | 247 (6.0%) |
| 60 to 64 Years | 254 (6.2%) | 192 (4.7%) |
| 65 to 69 Years | 185 (4.5%) | 213 (5.2%) |
| 70 to 74 Years | 152 (3.7%) | 250 (6.1%) |
| 75 to 79 Years | 66 (1.6%) | 131 (3.2%) |
| 80 to 84 Years | 119 (2.9%) | 42 (1.0%) |
| 85 Years and over | 52 (1.3%) | 128 (3.1%) |
| Total | 4,078 (100.0%) | 4,096 (100.0%) |
Families and Households in Price
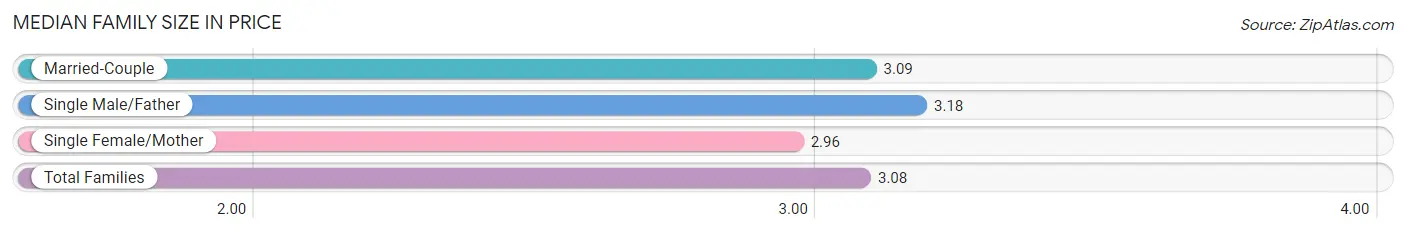
Median Family Size in Price
The median family size in Price is 3.08 persons per family, with single male/father families (211 | 10.5%) accounting for the largest median family size of 3.18 persons per family. On the other hand, single female/mother families (253 | 12.6%) represent the smallest median family size with 2.96 persons per family.
| Family Type | # Families | Family Size |
| Married-Couple | 1,552 (77.0%) | 3.09 |
| Single Male/Father | 211 (10.5%) | 3.18 |
| Single Female/Mother | 253 (12.6%) | 2.96 |
| Total Families | 2,016 (100.0%) | 3.08 |
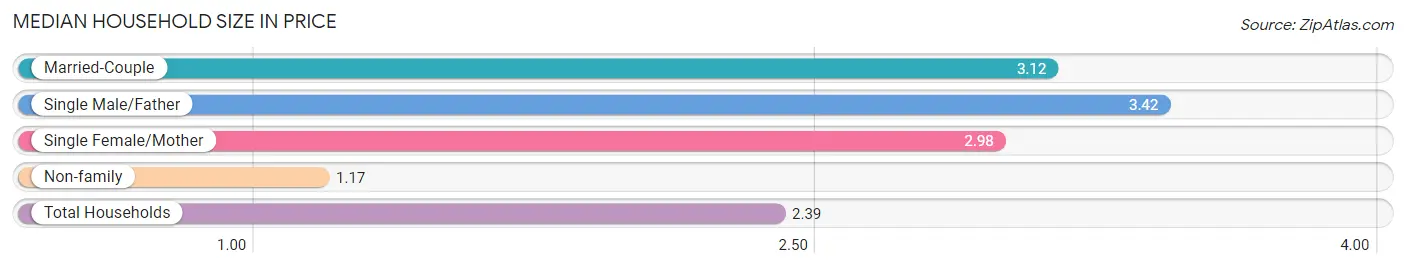
Median Household Size in Price
The median household size in Price is 2.39 persons per household, with single male/father households (211 | 6.5%) accounting for the largest median household size of 3.42 persons per household. non-family households (1,226 | 37.8%) represent the smallest median household size with 1.17 persons per household.
| Household Type | # Households | Household Size |
| Married-Couple | 1,552 (47.9%) | 3.12 |
| Single Male/Father | 211 (6.5%) | 3.42 |
| Single Female/Mother | 253 (7.8%) | 2.98 |
| Non-family | 1,226 (37.8%) | 1.17 |
| Total Households | 3,242 (100.0%) | 2.39 |
Household Size by Marriage Status in Price
Out of a total of 3,242 households in Price, 2,016 (62.2%) are family households, while 1,226 (37.8%) are nonfamily households. The most numerous type of family households are 2-person households, comprising 747, and the most common type of nonfamily households are 1-person households, comprising 1,075.
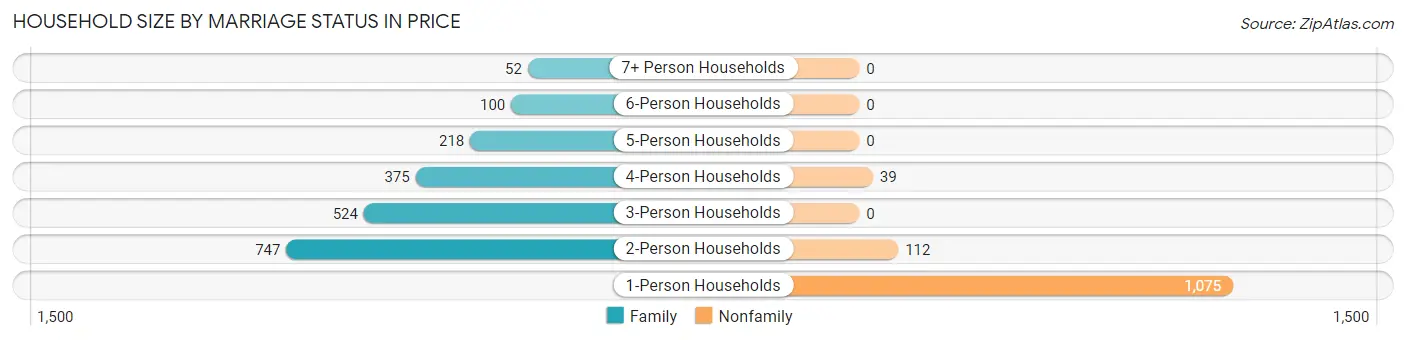
| Household Size | Family Households | Nonfamily Households |
| 1-Person Households | - | 1,075 (33.2%) |
| 2-Person Households | 747 (23.0%) | 112 (3.5%) |
| 3-Person Households | 524 (16.2%) | 0 (0.0%) |
| 4-Person Households | 375 (11.6%) | 39 (1.2%) |
| 5-Person Households | 218 (6.7%) | 0 (0.0%) |
| 6-Person Households | 100 (3.1%) | 0 (0.0%) |
| 7+ Person Households | 52 (1.6%) | 0 (0.0%) |
| Total | 2,016 (62.2%) | 1,226 (37.8%) |
Female Fertility in Price
Fertility by Age in Price
Average fertility rate in Price is 91.0 births per 1,000 women. Women in the age bracket of 20 to 34 years have the highest fertility rate with 191.0 births per 1,000 women. Women in the age bracket of 20 to 34 years acount for 88.1% of all women with births.
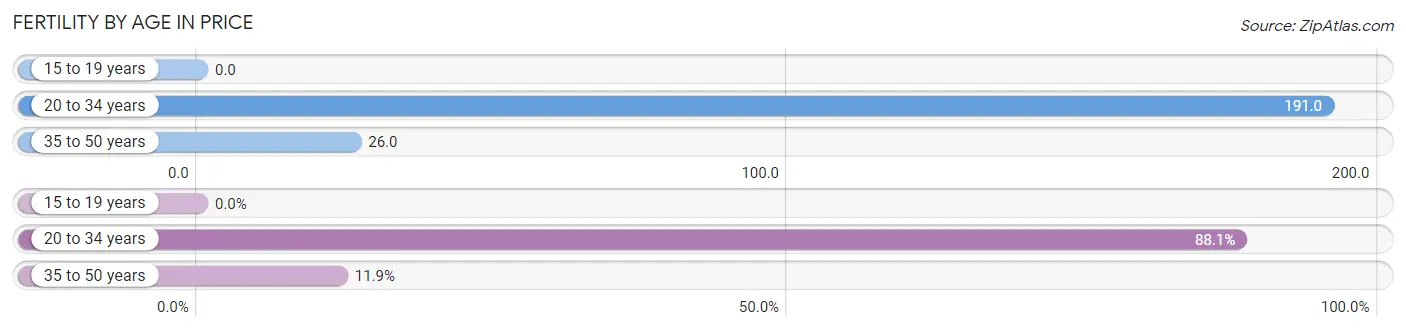
| Age Bracket | Women with Births | Births / 1,000 Women |
| 15 to 19 years | 0 (0.0%) | 0.0 |
| 20 to 34 years | 156 (88.1%) | 191.0 |
| 35 to 50 years | 21 (11.9%) | 26.0 |
| Total | 177 (100.0%) | 91.0 |
Fertility by Age by Marriage Status in Price
76.3% of women with births (177) in Price are married. The highest percentage of unmarried women with births falls into 35 to 50 years age bracket with 100.0% of them unmarried at the time of birth, while the lowest percentage of unmarried women with births belong to 20 to 34 years age bracket with 13.5% of them unmarried.
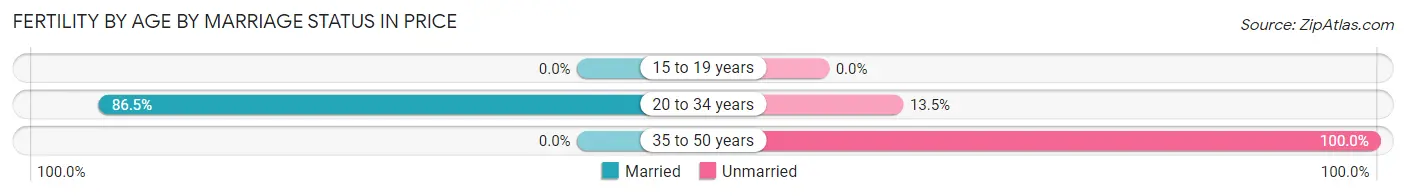
| Age Bracket | Married | Unmarried |
| 15 to 19 years | 0 (0.0%) | 0 (0.0%) |
| 20 to 34 years | 135 (86.5%) | 21 (13.5%) |
| 35 to 50 years | 0 (0.0%) | 21 (100.0%) |
| Total | 135 (76.3%) | 42 (23.7%) |
Fertility by Education in Price
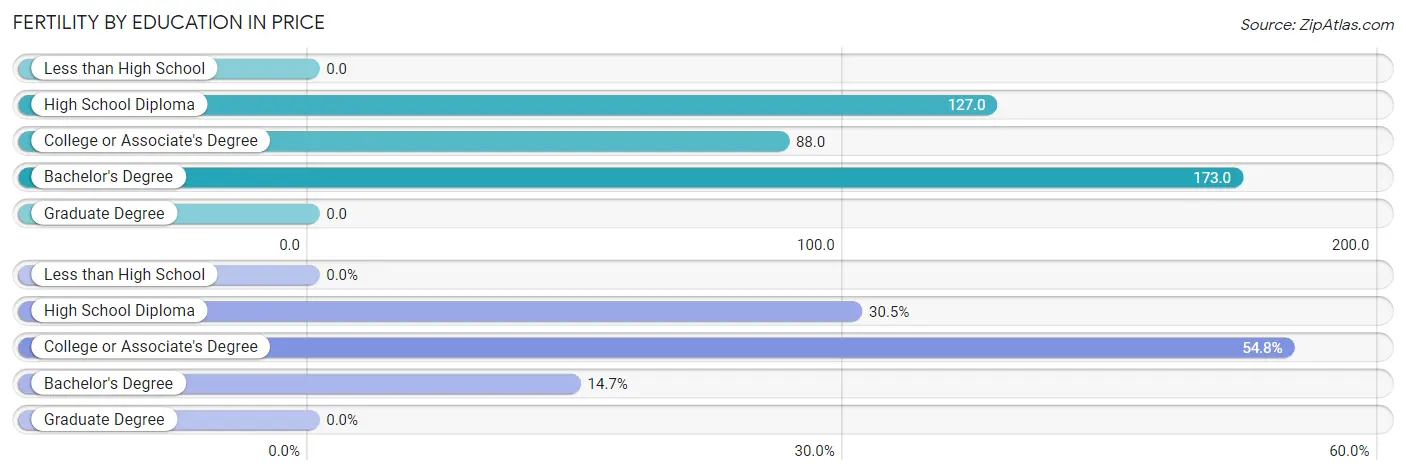
| Educational Attainment | Women with Births | Births / 1,000 Women |
| Less than High School | 0 (0.0%) | 0.0 |
| High School Diploma | 54 (30.5%) | 127.0 |
| College or Associate's Degree | 97 (54.8%) | 88.0 |
| Bachelor's Degree | 26 (14.7%) | 173.0 |
| Graduate Degree | 0 (0.0%) | 0.0 |
| Total | 177 (100.0%) | 91.0 |
Fertility by Education by Marriage Status in Price
23.7% of women with births in Price are unmarried. Women with the educational attainment of bachelor's degree are most likely to be married with 100.0% of them married at childbirth, while women with the educational attainment of college or associate's degree are least likely to be married with 27.8% of them unmarried at childbirth.
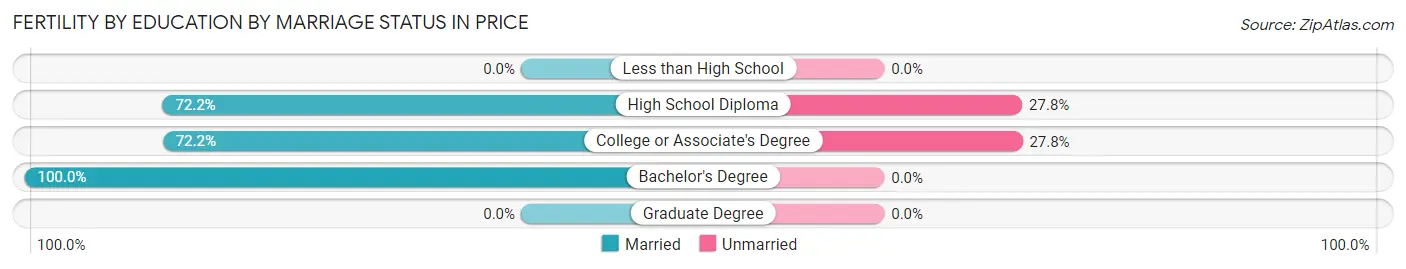
| Educational Attainment | Married | Unmarried |
| Less than High School | 0 (0.0%) | 0 (0.0%) |
| High School Diploma | 39 (72.2%) | 15 (27.8%) |
| College or Associate's Degree | 70 (72.2%) | 27 (27.8%) |
| Bachelor's Degree | 26 (100.0%) | 0 (0.0%) |
| Graduate Degree | 0 (0.0%) | 0 (0.0%) |
| Total | 135 (76.3%) | 42 (23.7%) |
Employment Characteristics in Price
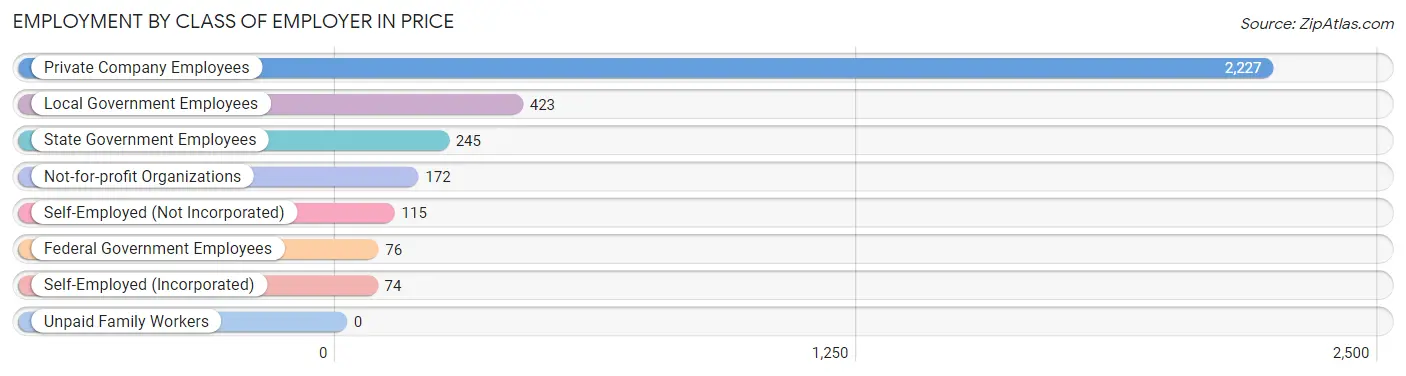
Employment by Class of Employer in Price
Among the 3,332 employed individuals in Price, private company employees (2,227 | 66.8%), local government employees (423 | 12.7%), and state government employees (245 | 7.3%) make up the most common classes of employment.
| Employer Class | # Employees | % Employees |
| Private Company Employees | 2,227 | 66.8% |
| Self-Employed (Incorporated) | 74 | 2.2% |
| Self-Employed (Not Incorporated) | 115 | 3.5% |
| Not-for-profit Organizations | 172 | 5.2% |
| Local Government Employees | 423 | 12.7% |
| State Government Employees | 245 | 7.3% |
| Federal Government Employees | 76 | 2.3% |
| Unpaid Family Workers | 0 | 0.0% |
| Total | 3,332 | 100.0% |
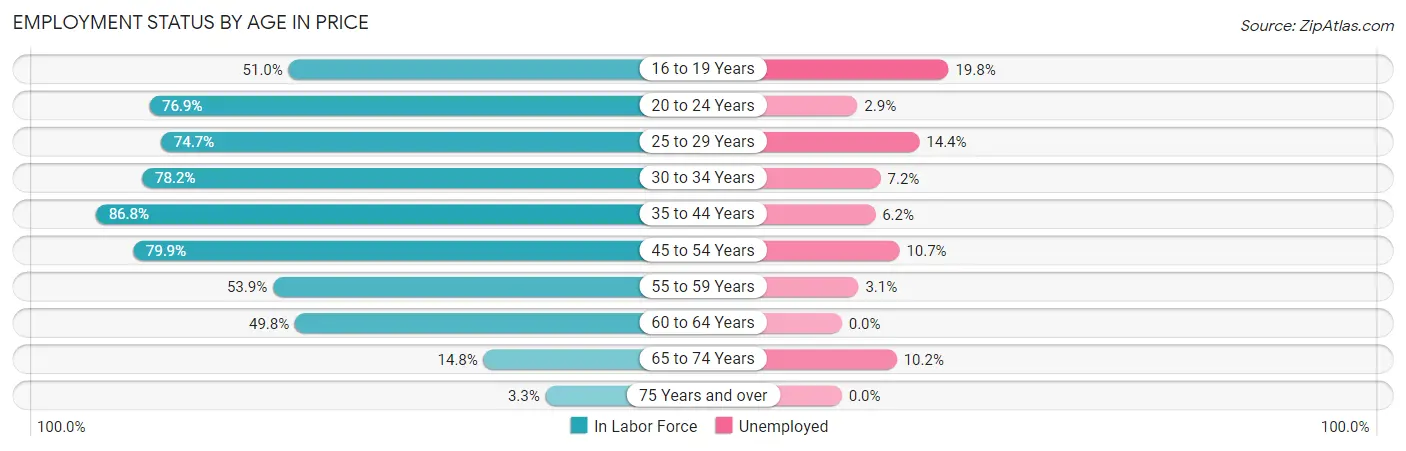
Employment Status by Age in Price
According to the labor force statistics for Price, out of the total population over 16 years of age (6,371), 58.8% or 3,746 individuals are in the labor force, with 8.2% or 307 of them unemployed. The age group with the highest labor force participation rate is 35 to 44 years, with 86.8% or 860 individuals in the labor force. Within the labor force, the 16 to 19 years age range has the highest percentage of unemployed individuals, with 19.8% or 58 of them being unemployed.
| Age Bracket | In Labor Force | Unemployed |
| 16 to 19 Years | 293 (51.0%) | 58 (19.8%) |
| 20 to 24 Years | 443 (76.9%) | 13 (2.9%) |
| 25 to 29 Years | 355 (74.7%) | 51 (14.4%) |
| 30 to 34 Years | 428 (78.2%) | 31 (7.2%) |
| 35 to 44 Years | 860 (86.8%) | 53 (6.2%) |
| 45 to 54 Years | 749 (79.9%) | 80 (10.7%) |
| 55 to 59 Years | 262 (53.9%) | 8 (3.1%) |
| 60 to 64 Years | 222 (49.8%) | 0 (0.0%) |
| 65 to 74 Years | 118 (14.8%) | 12 (10.2%) |
| 75 Years and over | 18 (3.3%) | 0 (0.0%) |
| Total | 3,746 (58.8%) | 307 (8.2%) |
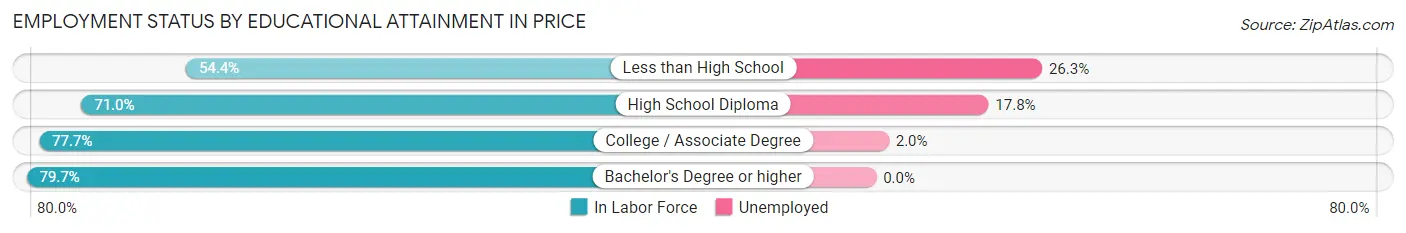
Employment Status by Educational Attainment in Price
According to labor force statistics for Price, 74.1% of individuals (2,877) out of the total population between 25 and 64 years of age (3,882) are in the labor force, with 7.7% or 222 of them being unemployed. The group with the highest labor force participation rate are those with the educational attainment of bachelor's degree or higher, with 79.7% or 389 individuals in the labor force. Within the labor force, individuals with less than high school education have the highest percentage of unemployment, with 26.3% or 44 of them being unemployed.
| Educational Attainment | In Labor Force | Unemployed |
| Less than High School | 167 (54.4%) | 81 (26.3%) |
| High School Diploma | 839 (71.0%) | 210 (17.8%) |
| College / Associate Degree | 1,480 (77.7%) | 38 (2.0%) |
| Bachelor's Degree or higher | 389 (79.7%) | 0 (0.0%) |
| Total | 2,877 (74.1%) | 299 (7.7%) |
Employment Occupations by Sex in Price
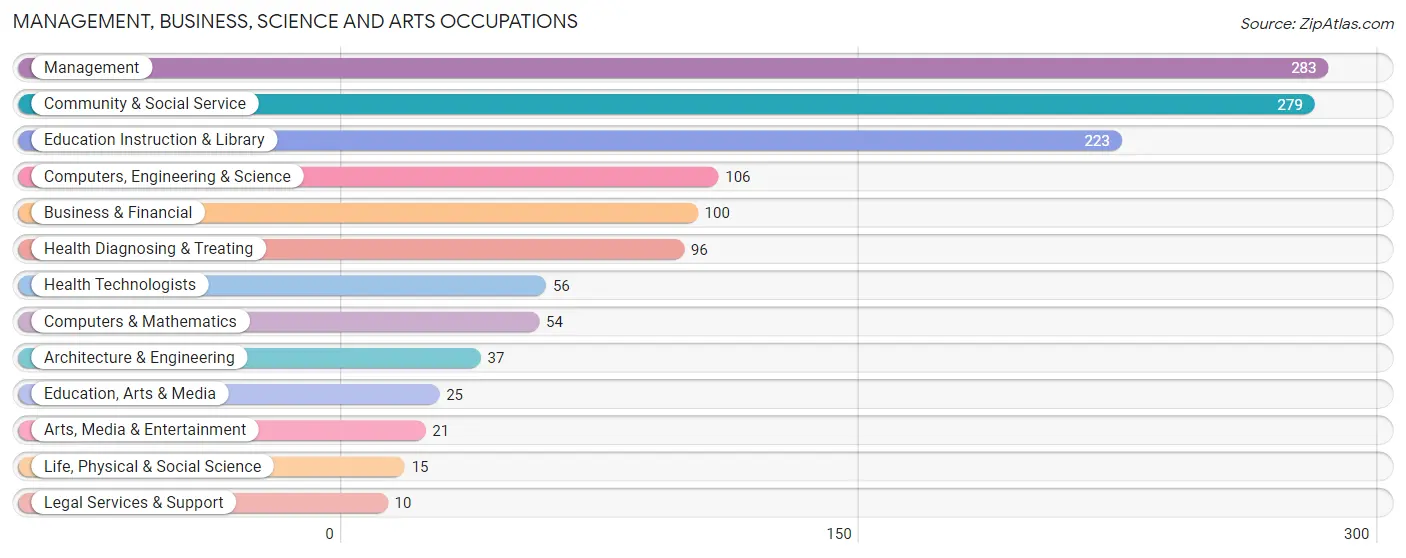
Management, Business, Science and Arts Occupations
The most common Management, Business, Science and Arts occupations in Price are Management (283 | 8.2%), Community & Social Service (279 | 8.1%), Education Instruction & Library (223 | 6.5%), Computers, Engineering & Science (106 | 3.1%), and Business & Financial (100 | 2.9%).
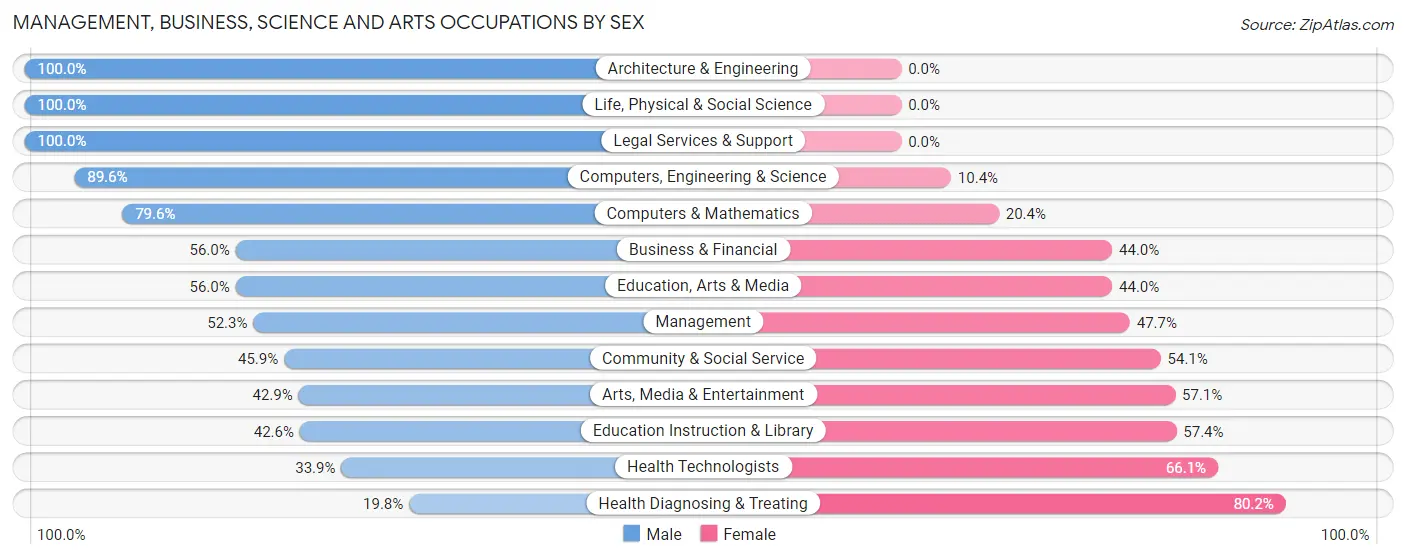
Management, Business, Science and Arts Occupations by Sex
Within the Management, Business, Science and Arts occupations in Price, the most male-oriented occupations are Architecture & Engineering (100.0%), Life, Physical & Social Science (100.0%), and Legal Services & Support (100.0%), while the most female-oriented occupations are Health Diagnosing & Treating (80.2%), Health Technologists (66.1%), and Education Instruction & Library (57.4%).
| Occupation | Male | Female |
| Management | 148 (52.3%) | 135 (47.7%) |
| Business & Financial | 56 (56.0%) | 44 (44.0%) |
| Computers, Engineering & Science | 95 (89.6%) | 11 (10.4%) |
| Computers & Mathematics | 43 (79.6%) | 11 (20.4%) |
| Architecture & Engineering | 37 (100.0%) | 0 (0.0%) |
| Life, Physical & Social Science | 15 (100.0%) | 0 (0.0%) |
| Community & Social Service | 128 (45.9%) | 151 (54.1%) |
| Education, Arts & Media | 14 (56.0%) | 11 (44.0%) |
| Legal Services & Support | 10 (100.0%) | 0 (0.0%) |
| Education Instruction & Library | 95 (42.6%) | 128 (57.4%) |
| Arts, Media & Entertainment | 9 (42.9%) | 12 (57.1%) |
| Health Diagnosing & Treating | 19 (19.8%) | 77 (80.2%) |
| Health Technologists | 19 (33.9%) | 37 (66.1%) |
| Total (Category) | 446 (51.6%) | 418 (48.4%) |
| Total (Overall) | 1,761 (51.3%) | 1,673 (48.7%) |
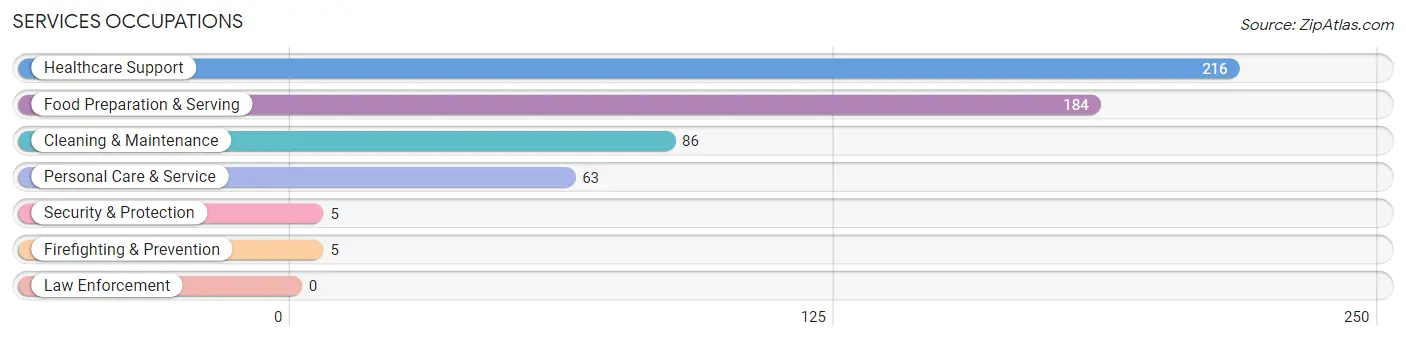
Services Occupations
The most common Services occupations in Price are Healthcare Support (216 | 6.3%), Food Preparation & Serving (184 | 5.4%), Cleaning & Maintenance (86 | 2.5%), Personal Care & Service (63 | 1.8%), and Security & Protection (5 | 0.2%).
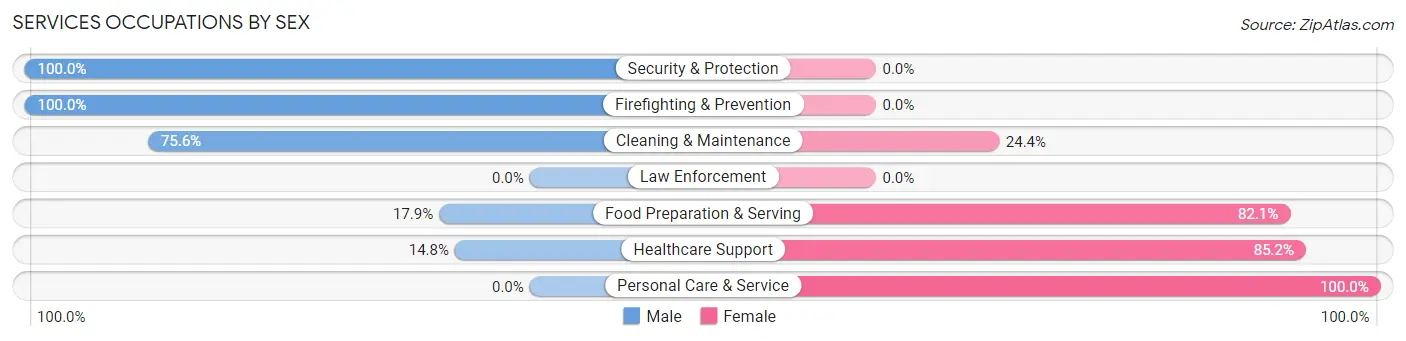
Services Occupations by Sex
Within the Services occupations in Price, the most male-oriented occupations are Security & Protection (100.0%), Firefighting & Prevention (100.0%), and Cleaning & Maintenance (75.6%), while the most female-oriented occupations are Personal Care & Service (100.0%), Healthcare Support (85.2%), and Food Preparation & Serving (82.1%).
| Occupation | Male | Female |
| Healthcare Support | 32 (14.8%) | 184 (85.2%) |
| Security & Protection | 5 (100.0%) | 0 (0.0%) |
| Firefighting & Prevention | 5 (100.0%) | 0 (0.0%) |
| Law Enforcement | 0 (0.0%) | 0 (0.0%) |
| Food Preparation & Serving | 33 (17.9%) | 151 (82.1%) |
| Cleaning & Maintenance | 65 (75.6%) | 21 (24.4%) |
| Personal Care & Service | 0 (0.0%) | 63 (100.0%) |
| Total (Category) | 135 (24.4%) | 419 (75.6%) |
| Total (Overall) | 1,761 (51.3%) | 1,673 (48.7%) |
Sales and Office Occupations
The most common Sales and Office occupations in Price are Office & Administration (639 | 18.6%), and Sales & Related (333 | 9.7%).
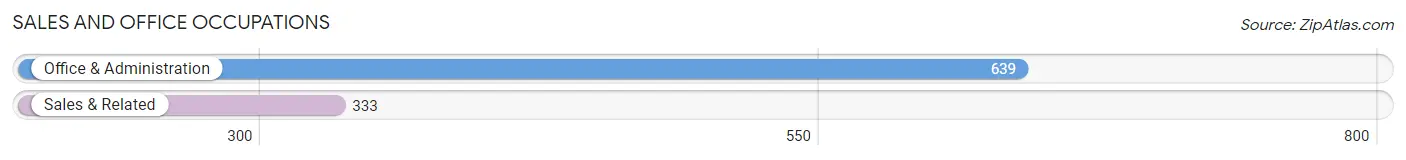
Sales and Office Occupations by Sex
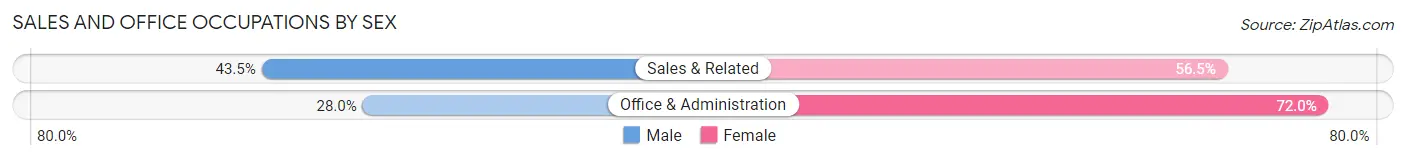
| Occupation | Male | Female |
| Sales & Related | 145 (43.5%) | 188 (56.5%) |
| Office & Administration | 179 (28.0%) | 460 (72.0%) |
| Total (Category) | 324 (33.3%) | 648 (66.7%) |
| Total (Overall) | 1,761 (51.3%) | 1,673 (48.7%) |
Natural Resources, Construction and Maintenance Occupations
The most common Natural Resources, Construction and Maintenance occupations in Price are Construction & Extraction (227 | 6.6%), and Installation, Maintenance & Repair (201 | 5.9%).
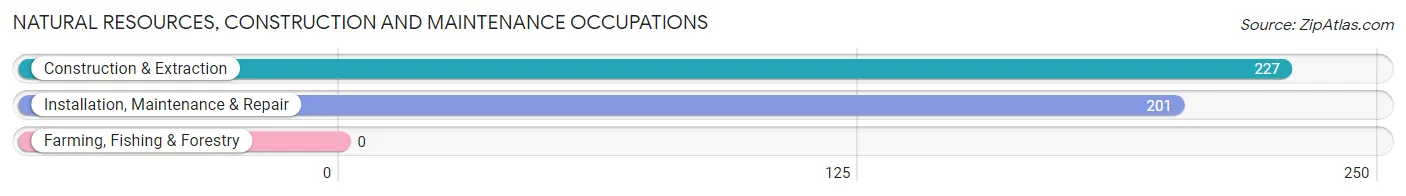
Natural Resources, Construction and Maintenance Occupations by Sex
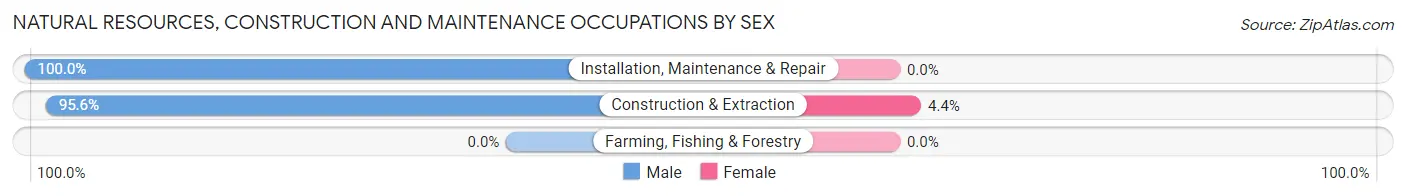
| Occupation | Male | Female |
| Farming, Fishing & Forestry | 0 (0.0%) | 0 (0.0%) |
| Construction & Extraction | 217 (95.6%) | 10 (4.4%) |
| Installation, Maintenance & Repair | 201 (100.0%) | 0 (0.0%) |
| Total (Category) | 418 (97.7%) | 10 (2.3%) |
| Total (Overall) | 1,761 (51.3%) | 1,673 (48.7%) |
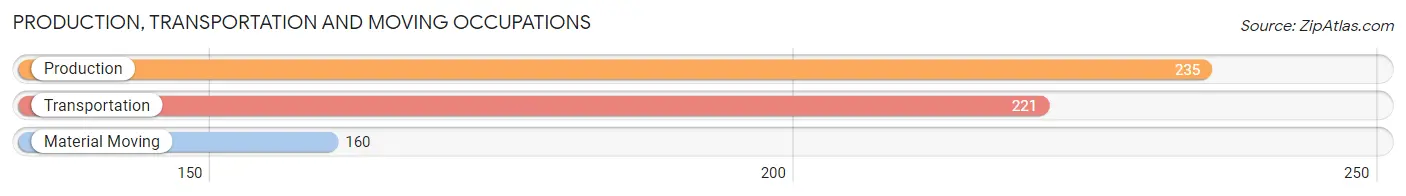
Production, Transportation and Moving Occupations
The most common Production, Transportation and Moving occupations in Price are Production (235 | 6.8%), Transportation (221 | 6.4%), and Material Moving (160 | 4.7%).
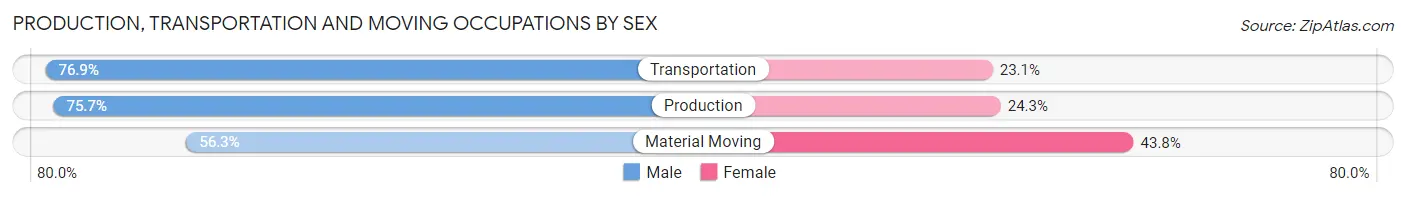
Production, Transportation and Moving Occupations by Sex
| Occupation | Male | Female |
| Production | 178 (75.7%) | 57 (24.3%) |
| Transportation | 170 (76.9%) | 51 (23.1%) |
| Material Moving | 90 (56.2%) | 70 (43.8%) |
| Total (Category) | 438 (71.1%) | 178 (28.9%) |
| Total (Overall) | 1,761 (51.3%) | 1,673 (48.7%) |
Employment Industries by Sex in Price
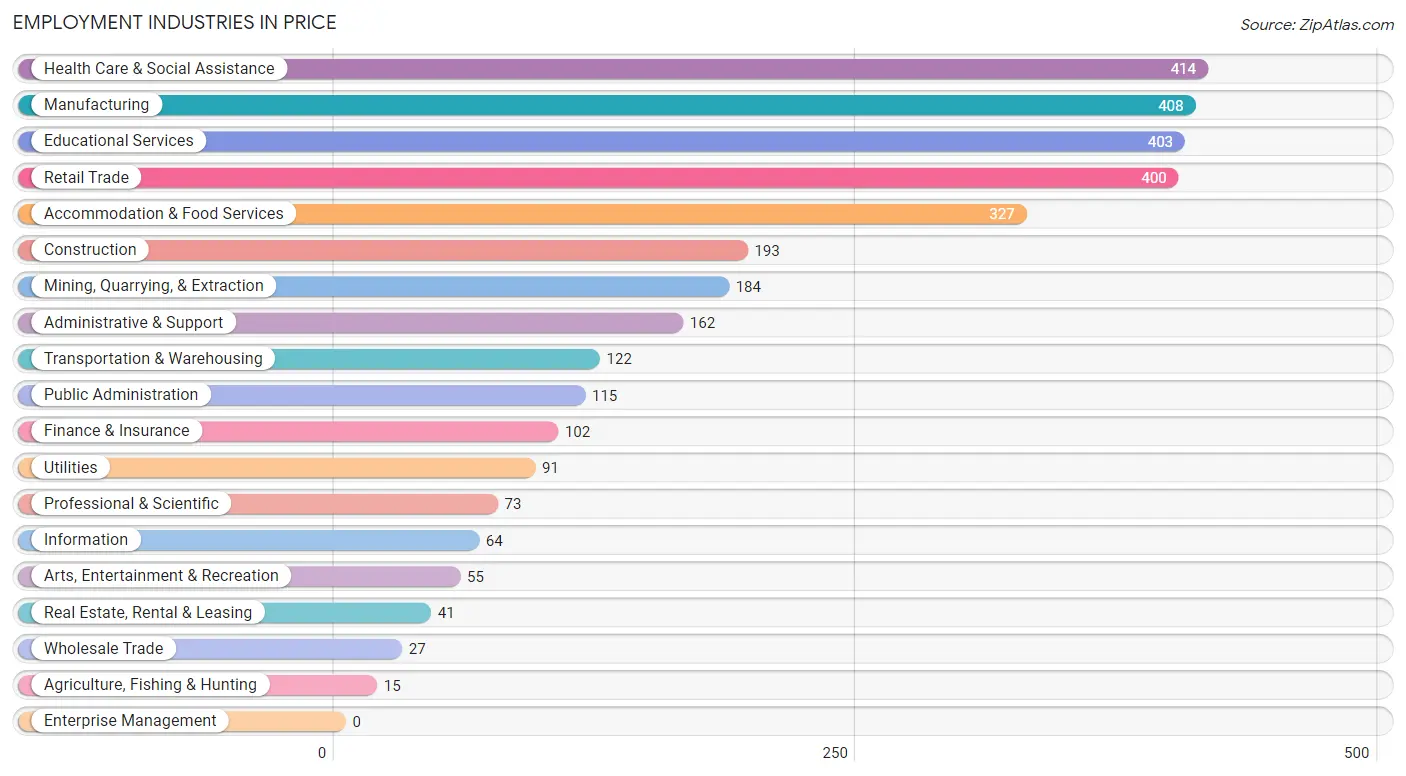
Employment Industries in Price
The major employment industries in Price include Health Care & Social Assistance (414 | 12.1%), Manufacturing (408 | 11.9%), Educational Services (403 | 11.7%), Retail Trade (400 | 11.7%), and Accommodation & Food Services (327 | 9.5%).
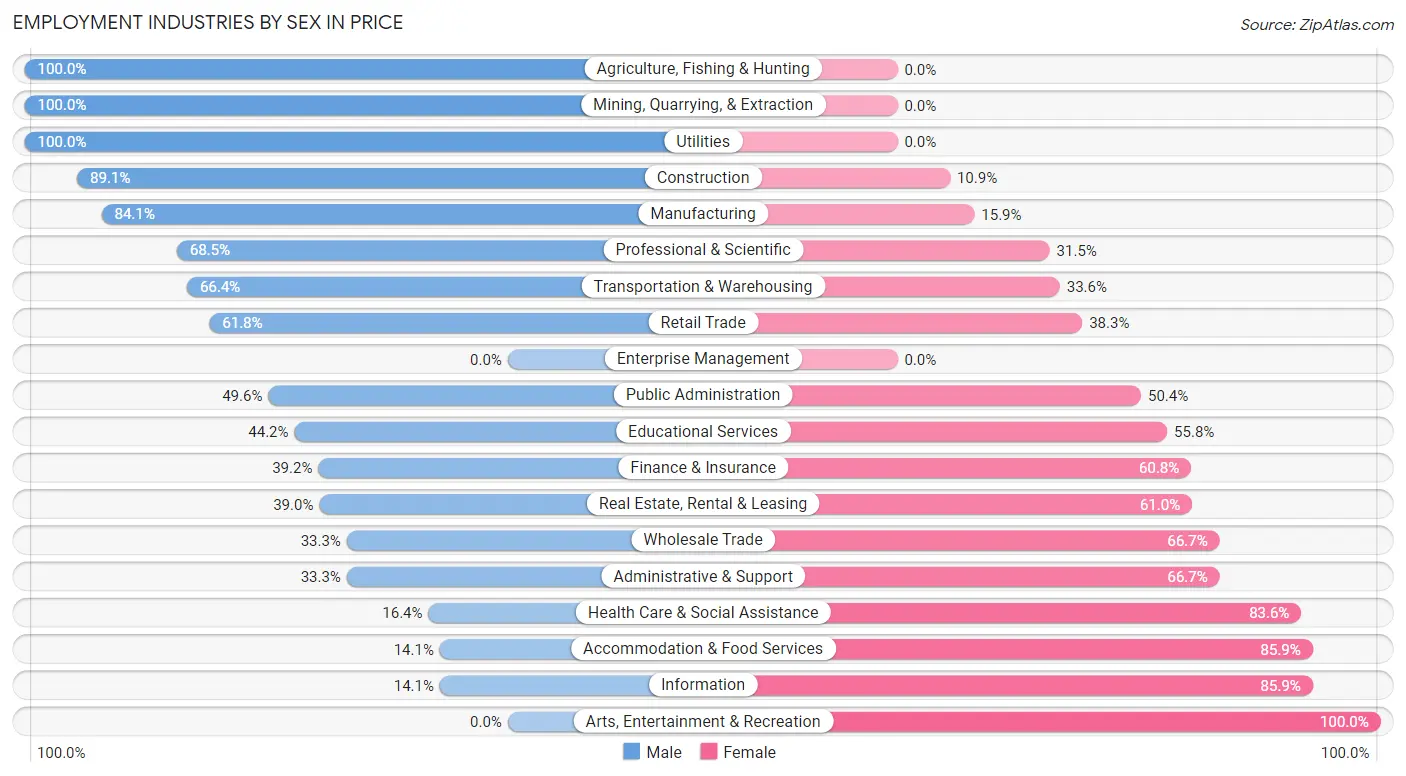
Employment Industries by Sex in Price
The Price industries that see more men than women are Agriculture, Fishing & Hunting (100.0%), Mining, Quarrying, & Extraction (100.0%), and Utilities (100.0%), whereas the industries that tend to have a higher number of women are Arts, Entertainment & Recreation (100.0%), Information (85.9%), and Accommodation & Food Services (85.9%).
| Industry | Male | Female |
| Agriculture, Fishing & Hunting | 15 (100.0%) | 0 (0.0%) |
| Mining, Quarrying, & Extraction | 184 (100.0%) | 0 (0.0%) |
| Construction | 172 (89.1%) | 21 (10.9%) |
| Manufacturing | 343 (84.1%) | 65 (15.9%) |
| Wholesale Trade | 9 (33.3%) | 18 (66.7%) |
| Retail Trade | 247 (61.8%) | 153 (38.3%) |
| Transportation & Warehousing | 81 (66.4%) | 41 (33.6%) |
| Utilities | 91 (100.0%) | 0 (0.0%) |
| Information | 9 (14.1%) | 55 (85.9%) |
| Finance & Insurance | 40 (39.2%) | 62 (60.8%) |
| Real Estate, Rental & Leasing | 16 (39.0%) | 25 (61.0%) |
| Professional & Scientific | 50 (68.5%) | 23 (31.5%) |
| Enterprise Management | 0 (0.0%) | 0 (0.0%) |
| Administrative & Support | 54 (33.3%) | 108 (66.7%) |
| Educational Services | 178 (44.2%) | 225 (55.8%) |
| Health Care & Social Assistance | 68 (16.4%) | 346 (83.6%) |
| Arts, Entertainment & Recreation | 0 (0.0%) | 55 (100.0%) |
| Accommodation & Food Services | 46 (14.1%) | 281 (85.9%) |
| Public Administration | 57 (49.6%) | 58 (50.4%) |
| Total | 1,761 (51.3%) | 1,673 (48.7%) |
Education in Price
School Enrollment in Price
The most common levels of schooling among the 2,139 students in Price are college / undergraduate (557 | 26.0%), high school (469 | 21.9%), and elementary school (398 | 18.6%).
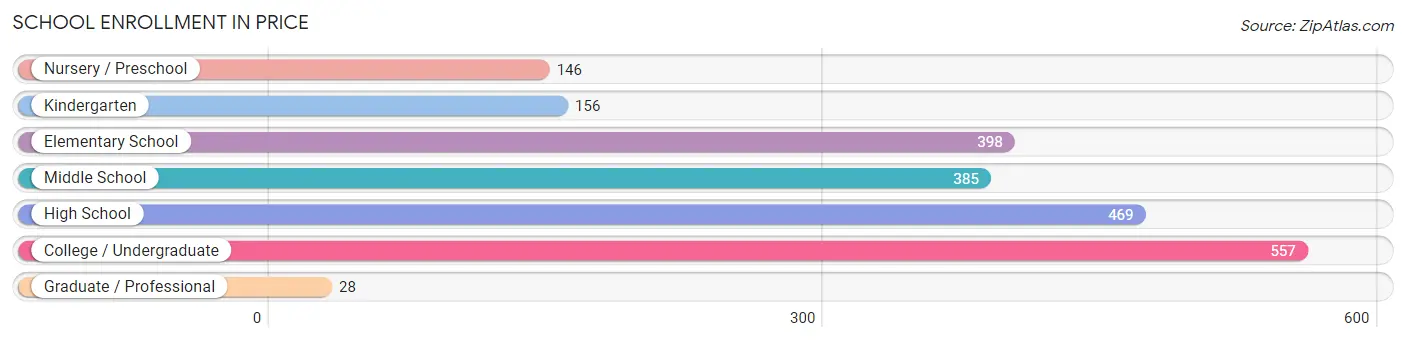
| School Level | # Students | % Students |
| Nursery / Preschool | 146 | 6.8% |
| Kindergarten | 156 | 7.3% |
| Elementary School | 398 | 18.6% |
| Middle School | 385 | 18.0% |
| High School | 469 | 21.9% |
| College / Undergraduate | 557 | 26.0% |
| Graduate / Professional | 28 | 1.3% |
| Total | 2,139 | 100.0% |
School Enrollment by Age by Funding Source in Price
Out of a total of 2,139 students who are enrolled in schools in Price, 188 (8.8%) attend a private institution, while the remaining 1,951 (91.2%) are enrolled in public schools. The age group of 18 to 19 year olds has the highest likelihood of being enrolled in private schools, with 56 (36.8% in the age bracket) enrolled. Conversely, the age group of 10 to 14 year olds has the lowest likelihood of being enrolled in a private school, with 487 (100.0% in the age bracket) attending a public institution.
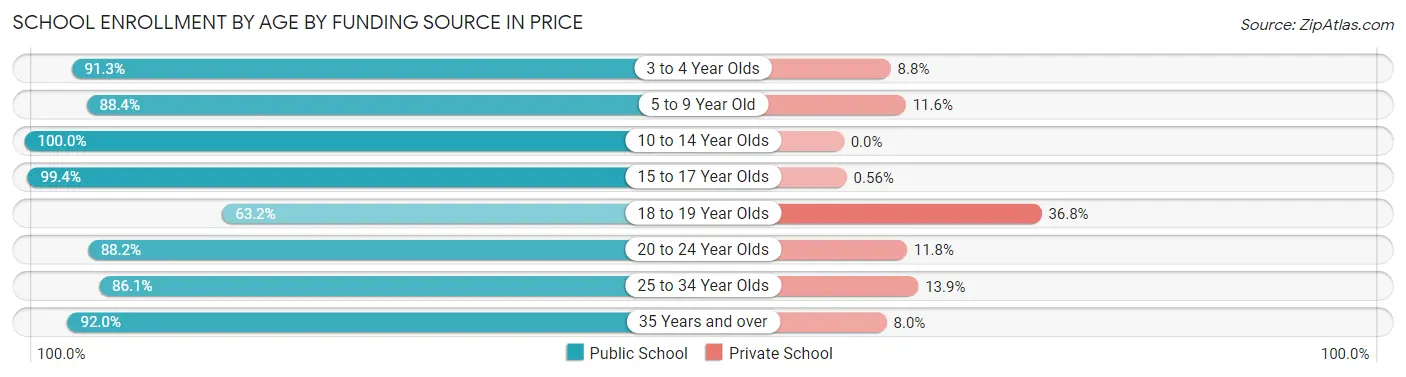
| Age Bracket | Public School | Private School |
| 3 to 4 Year Olds | 73 (91.2%) | 7 (8.7%) |
| 5 to 9 Year Old | 520 (88.4%) | 68 (11.6%) |
| 10 to 14 Year Olds | 487 (100.0%) | 0 (0.0%) |
| 15 to 17 Year Olds | 353 (99.4%) | 2 (0.6%) |
| 18 to 19 Year Olds | 96 (63.2%) | 56 (36.8%) |
| 20 to 24 Year Olds | 120 (88.2%) | 16 (11.8%) |
| 25 to 34 Year Olds | 186 (86.1%) | 30 (13.9%) |
| 35 Years and over | 115 (92.0%) | 10 (8.0%) |
| Total | 1,951 (91.2%) | 188 (8.8%) |
Educational Attainment by Field of Study in Price
Education (249 | 28.8%), science & technology (109 | 12.6%), bio, nature & agricultural (81 | 9.4%), business (78 | 9.0%), and social sciences (77 | 8.9%) are the most common fields of study among 863 individuals in Price who have obtained a bachelor's degree or higher.
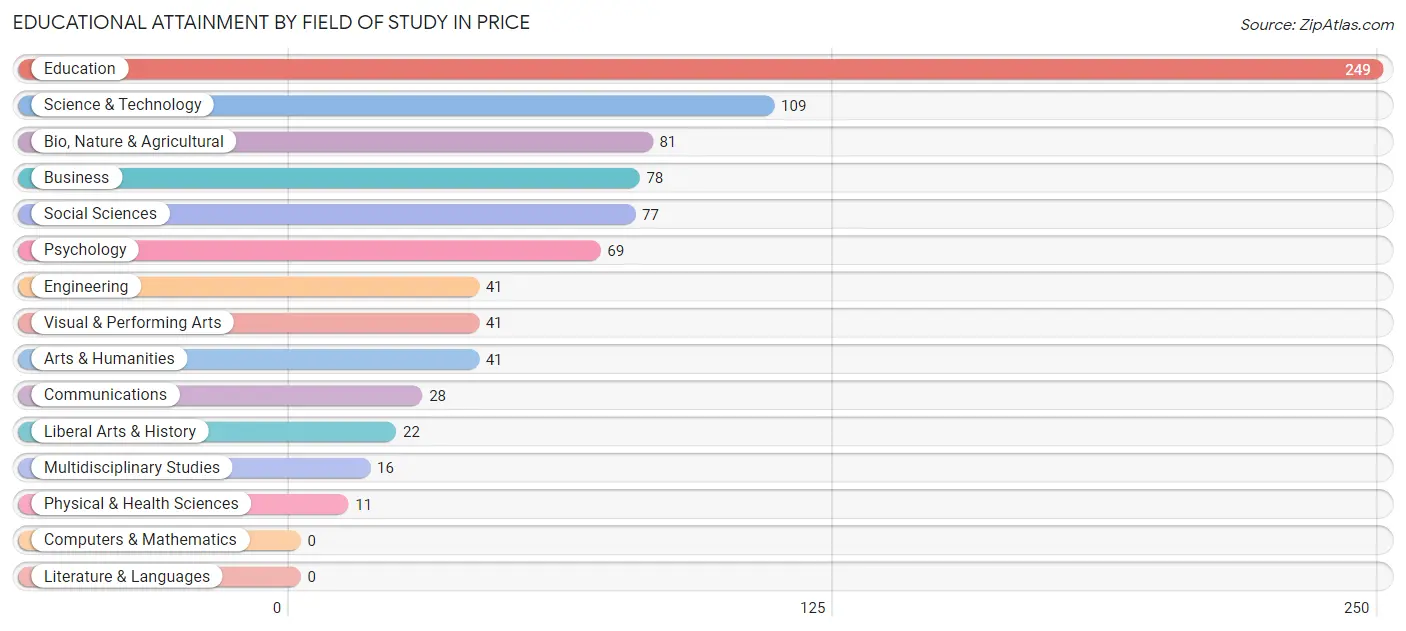
| Field of Study | # Graduates | % Graduates |
| Computers & Mathematics | 0 | 0.0% |
| Bio, Nature & Agricultural | 81 | 9.4% |
| Physical & Health Sciences | 11 | 1.3% |
| Psychology | 69 | 8.0% |
| Social Sciences | 77 | 8.9% |
| Engineering | 41 | 4.8% |
| Multidisciplinary Studies | 16 | 1.8% |
| Science & Technology | 109 | 12.6% |
| Business | 78 | 9.0% |
| Education | 249 | 28.8% |
| Literature & Languages | 0 | 0.0% |
| Liberal Arts & History | 22 | 2.5% |
| Visual & Performing Arts | 41 | 4.8% |
| Communications | 28 | 3.2% |
| Arts & Humanities | 41 | 4.8% |
| Total | 863 | 100.0% |
Transportation & Commute in Price
Vehicle Availability by Sex in Price
The most prevalent vehicle ownership categories in Price are males with 2 vehicles (678, accounting for 39.4%) and females with 2 vehicles (517, making up 44.2%).
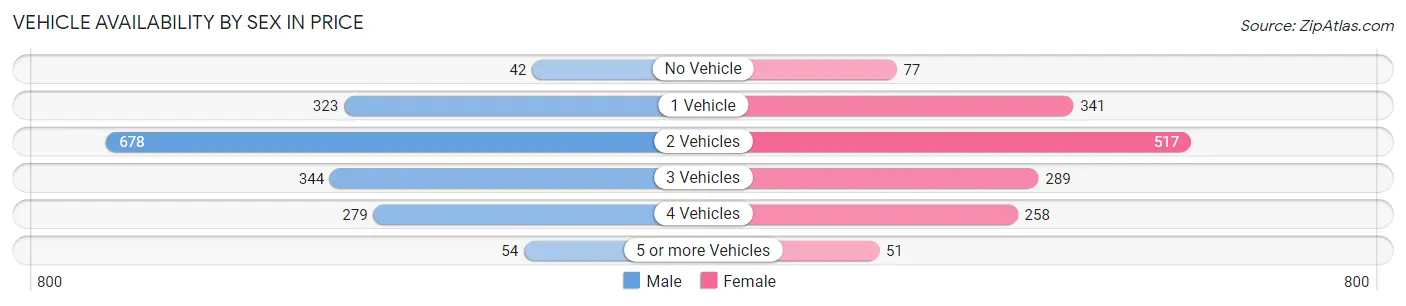
| Vehicles Available | Male | Female |
| No Vehicle | 42 (2.4%) | 77 (5.0%) |
| 1 Vehicle | 323 (18.8%) | 341 (22.2%) |
| 2 Vehicles | 678 (39.4%) | 517 (33.7%) |
| 3 Vehicles | 344 (20.0%) | 289 (18.9%) |
| 4 Vehicles | 279 (16.2%) | 258 (16.8%) |
| 5 or more Vehicles | 54 (3.1%) | 51 (3.3%) |
| Total | 1,720 (100.0%) | 1,533 (100.0%) |
Commute Time in Price
The most frequently occuring commute durations in Price are 5 to 9 minutes (1,178 commuters, 37.3%), less than 5 minutes (639 commuters, 20.2%), and 10 to 14 minutes (550 commuters, 17.4%).
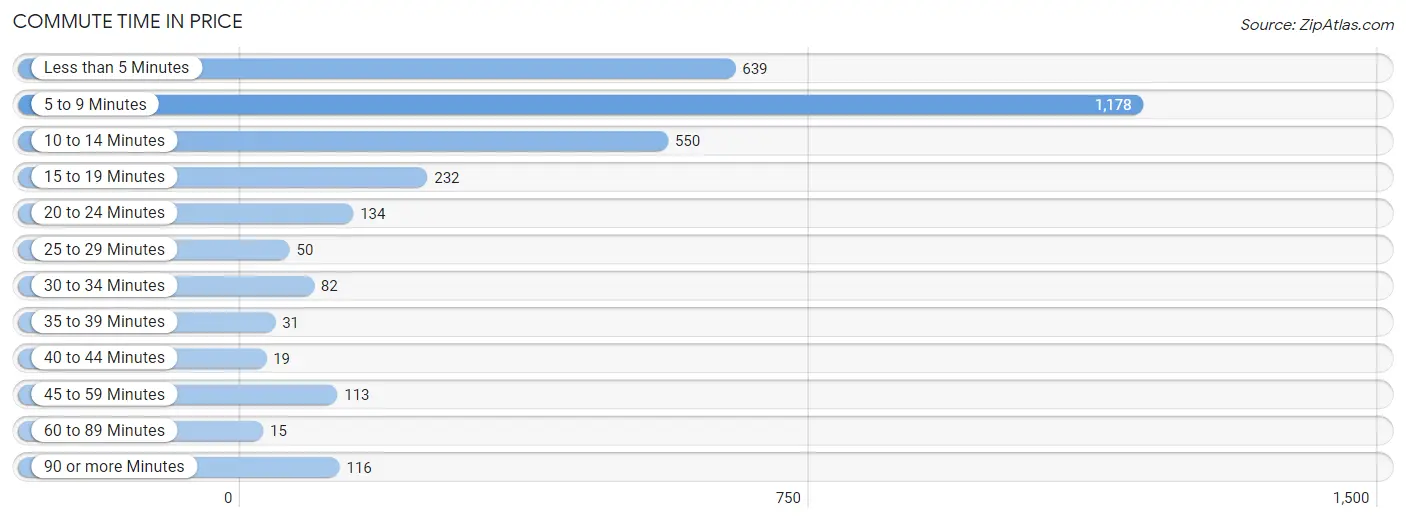
| Commute Time | # Commuters | % Commuters |
| Less than 5 Minutes | 639 | 20.2% |
| 5 to 9 Minutes | 1,178 | 37.3% |
| 10 to 14 Minutes | 550 | 17.4% |
| 15 to 19 Minutes | 232 | 7.3% |
| 20 to 24 Minutes | 134 | 4.2% |
| 25 to 29 Minutes | 50 | 1.6% |
| 30 to 34 Minutes | 82 | 2.6% |
| 35 to 39 Minutes | 31 | 1.0% |
| 40 to 44 Minutes | 19 | 0.6% |
| 45 to 59 Minutes | 113 | 3.6% |
| 60 to 89 Minutes | 15 | 0.5% |
| 90 or more Minutes | 116 | 3.7% |
Commute Time by Sex in Price
The most common commute times in Price are 5 to 9 minutes (643 commuters, 38.1%) for males and 5 to 9 minutes (535 commuters, 36.3%) for females.
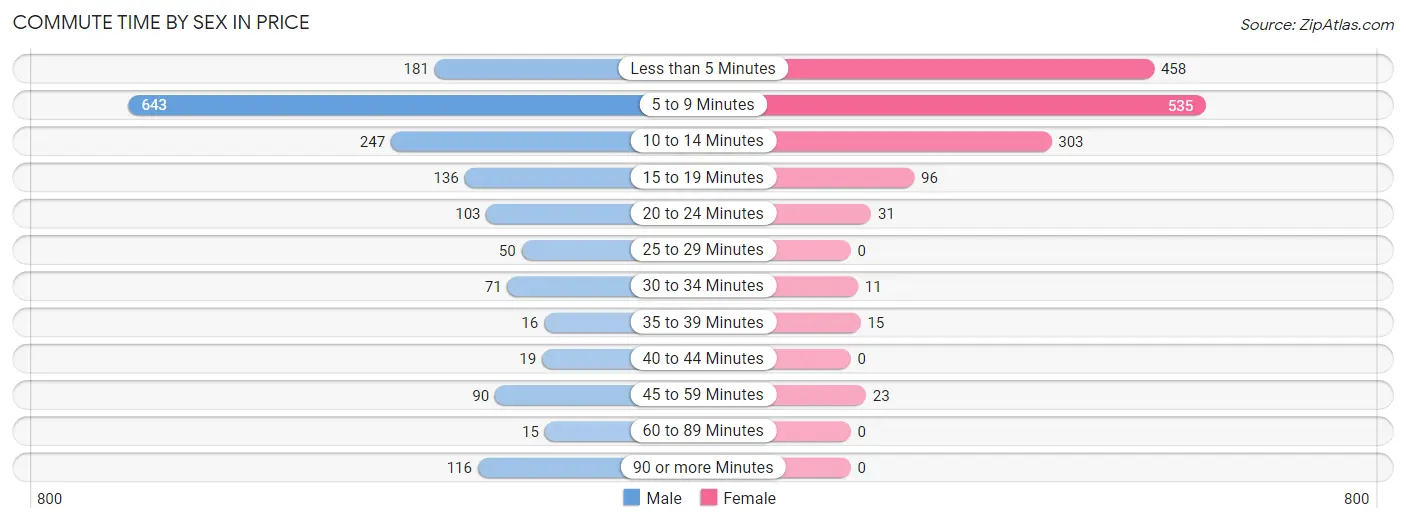
| Commute Time | Male | Female |
| Less than 5 Minutes | 181 (10.7%) | 458 (31.1%) |
| 5 to 9 Minutes | 643 (38.1%) | 535 (36.3%) |
| 10 to 14 Minutes | 247 (14.6%) | 303 (20.6%) |
| 15 to 19 Minutes | 136 (8.1%) | 96 (6.5%) |
| 20 to 24 Minutes | 103 (6.1%) | 31 (2.1%) |
| 25 to 29 Minutes | 50 (3.0%) | 0 (0.0%) |
| 30 to 34 Minutes | 71 (4.2%) | 11 (0.7%) |
| 35 to 39 Minutes | 16 (0.9%) | 15 (1.0%) |
| 40 to 44 Minutes | 19 (1.1%) | 0 (0.0%) |
| 45 to 59 Minutes | 90 (5.3%) | 23 (1.6%) |
| 60 to 89 Minutes | 15 (0.9%) | 0 (0.0%) |
| 90 or more Minutes | 116 (6.9%) | 0 (0.0%) |
Time of Departure to Work by Sex in Price
The most frequent times of departure to work in Price are 6:00 AM to 6:29 AM (276, 16.4%) for males and 7:30 AM to 7:59 AM (351, 23.8%) for females.
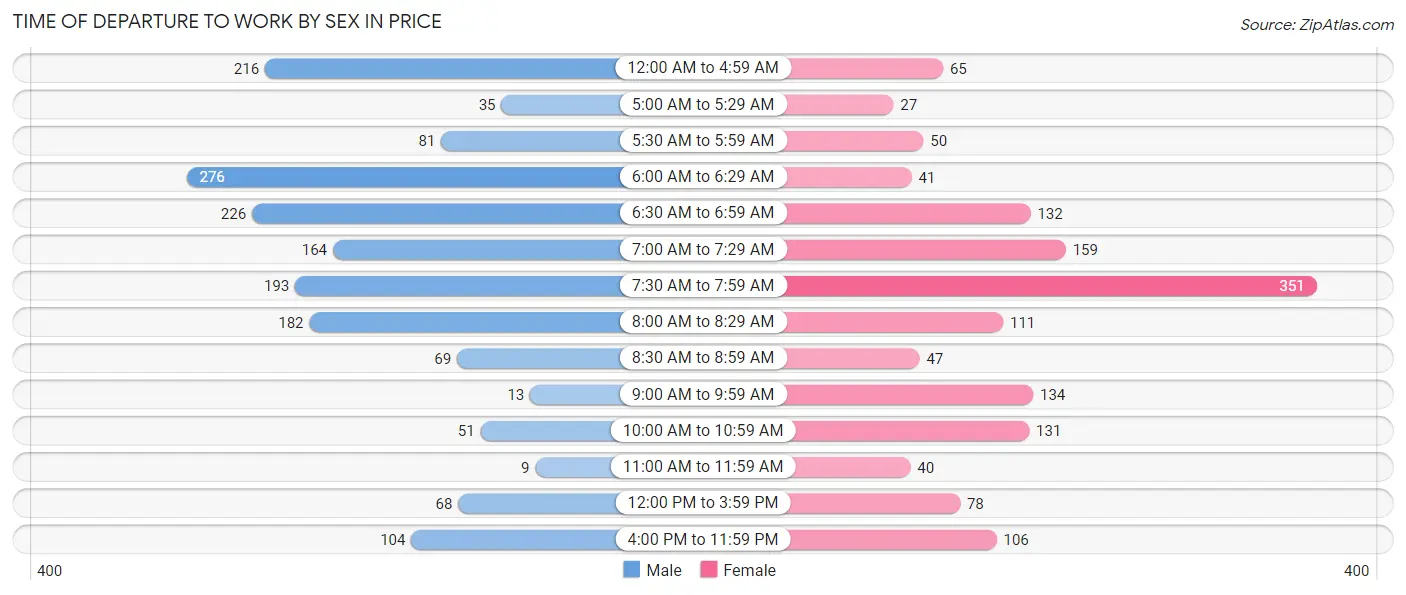
| Time of Departure | Male | Female |
| 12:00 AM to 4:59 AM | 216 (12.8%) | 65 (4.4%) |
| 5:00 AM to 5:29 AM | 35 (2.1%) | 27 (1.8%) |
| 5:30 AM to 5:59 AM | 81 (4.8%) | 50 (3.4%) |
| 6:00 AM to 6:29 AM | 276 (16.4%) | 41 (2.8%) |
| 6:30 AM to 6:59 AM | 226 (13.4%) | 132 (9.0%) |
| 7:00 AM to 7:29 AM | 164 (9.7%) | 159 (10.8%) |
| 7:30 AM to 7:59 AM | 193 (11.4%) | 351 (23.8%) |
| 8:00 AM to 8:29 AM | 182 (10.8%) | 111 (7.5%) |
| 8:30 AM to 8:59 AM | 69 (4.1%) | 47 (3.2%) |
| 9:00 AM to 9:59 AM | 13 (0.8%) | 134 (9.1%) |
| 10:00 AM to 10:59 AM | 51 (3.0%) | 131 (8.9%) |
| 11:00 AM to 11:59 AM | 9 (0.5%) | 40 (2.7%) |
| 12:00 PM to 3:59 PM | 68 (4.0%) | 78 (5.3%) |
| 4:00 PM to 11:59 PM | 104 (6.2%) | 106 (7.2%) |
| Total | 1,687 (100.0%) | 1,472 (100.0%) |
Housing Occupancy in Price
Occupancy by Ownership in Price
Of the total 3,242 dwellings in Price, owner-occupied units account for 1,949 (60.1%), while renter-occupied units make up 1,293 (39.9%).
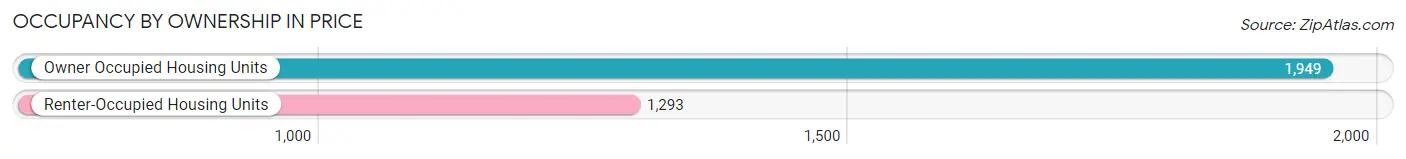
| Occupancy | # Housing Units | % Housing Units |
| Owner Occupied Housing Units | 1,949 | 60.1% |
| Renter-Occupied Housing Units | 1,293 | 39.9% |
| Total Occupied Housing Units | 3,242 | 100.0% |
Occupancy by Household Size in Price
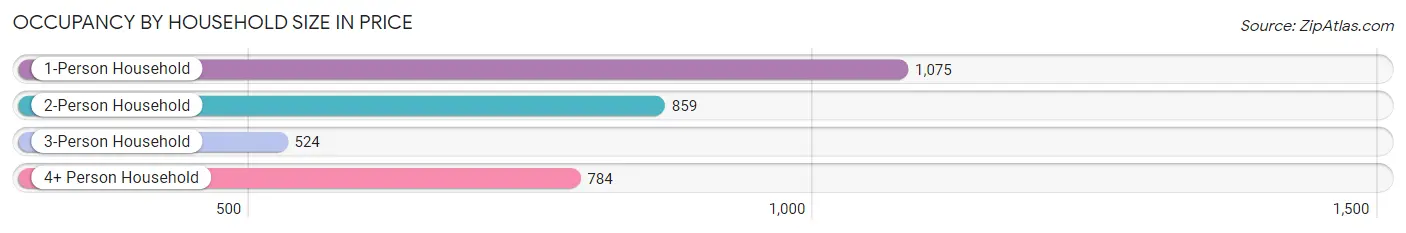
| Household Size | # Housing Units | % Housing Units |
| 1-Person Household | 1,075 | 33.2% |
| 2-Person Household | 859 | 26.5% |
| 3-Person Household | 524 | 16.2% |
| 4+ Person Household | 784 | 24.2% |
| Total Housing Units | 3,242 | 100.0% |
Occupancy by Ownership by Household Size in Price
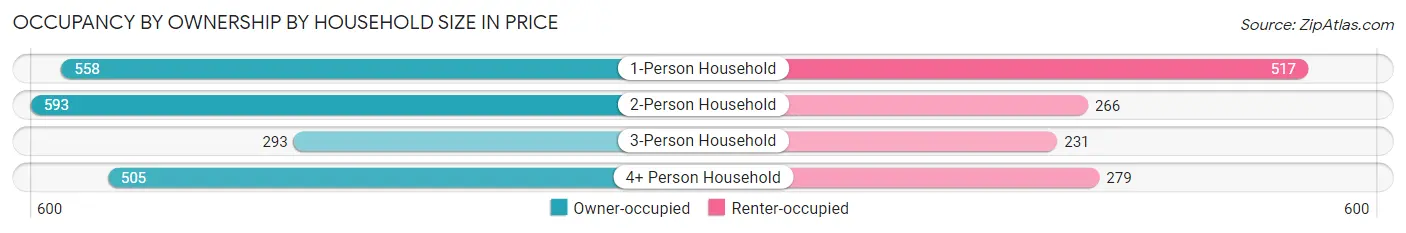
| Household Size | Owner-occupied | Renter-occupied |
| 1-Person Household | 558 (51.9%) | 517 (48.1%) |
| 2-Person Household | 593 (69.0%) | 266 (31.0%) |
| 3-Person Household | 293 (55.9%) | 231 (44.1%) |
| 4+ Person Household | 505 (64.4%) | 279 (35.6%) |
| Total Housing Units | 1,949 (60.1%) | 1,293 (39.9%) |
Occupancy by Educational Attainment in Price
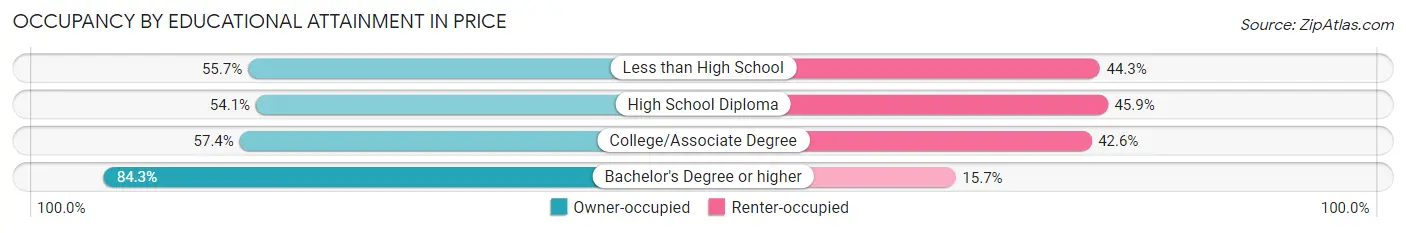
| Household Size | Owner-occupied | Renter-occupied |
| Less than High School | 117 (55.7%) | 93 (44.3%) |
| High School Diploma | 490 (54.1%) | 415 (45.9%) |
| College/Associate Degree | 961 (57.4%) | 714 (42.6%) |
| Bachelor's Degree or higher | 381 (84.3%) | 71 (15.7%) |
Occupancy by Age of Householder in Price
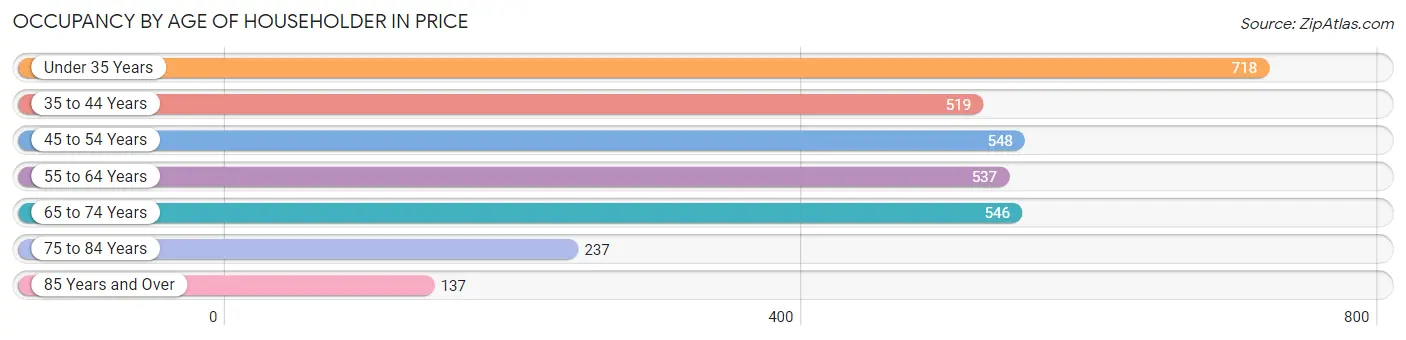
| Age Bracket | # Households | % Households |
| Under 35 Years | 718 | 22.2% |
| 35 to 44 Years | 519 | 16.0% |
| 45 to 54 Years | 548 | 16.9% |
| 55 to 64 Years | 537 | 16.6% |
| 65 to 74 Years | 546 | 16.8% |
| 75 to 84 Years | 237 | 7.3% |
| 85 Years and Over | 137 | 4.2% |
| Total | 3,242 | 100.0% |
Housing Finances in Price
Median Income by Occupancy in Price
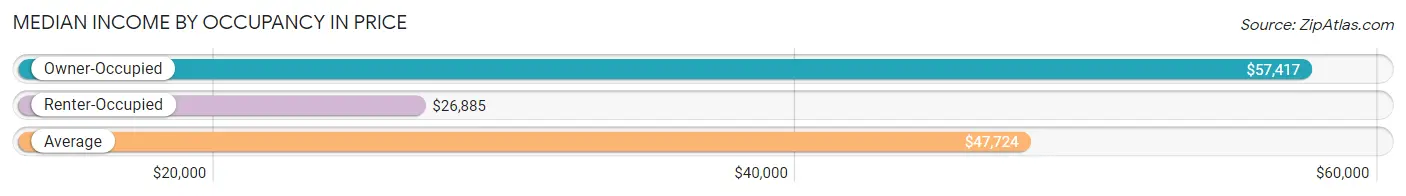
| Occupancy Type | # Households | Median Income |
| Owner-Occupied | 1,949 (60.1%) | $57,417 |
| Renter-Occupied | 1,293 (39.9%) | $26,885 |
| Average | 3,242 (100.0%) | $47,724 |
Occupancy by Householder Income Bracket in Price
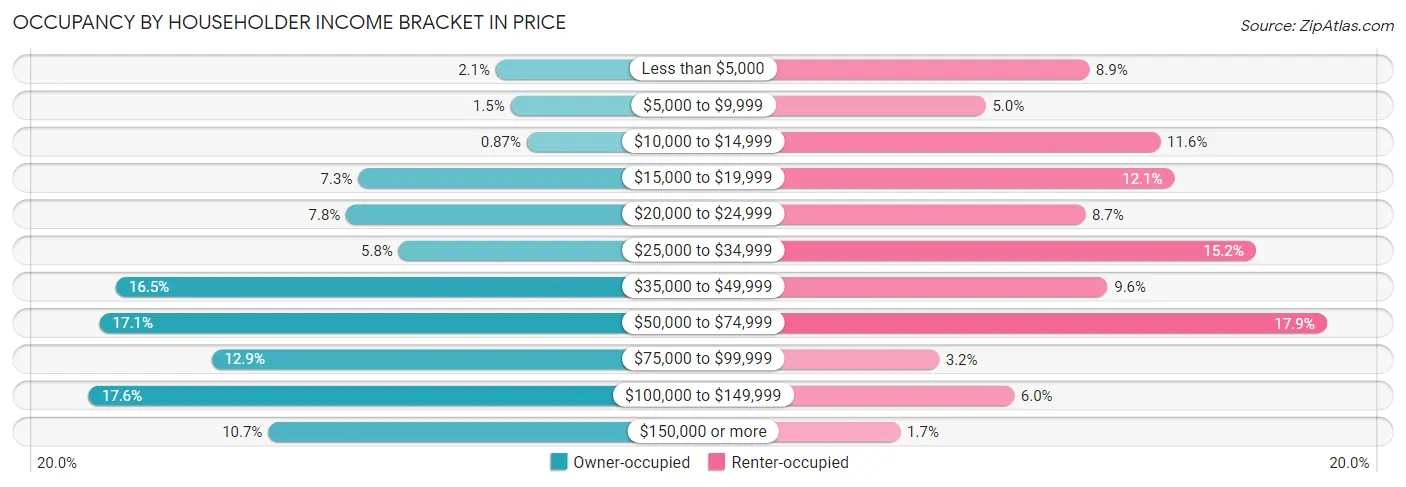
| Income Bracket | Owner-occupied | Renter-occupied |
| Less than $5,000 | 40 (2.1%) | 115 (8.9%) |
| $5,000 to $9,999 | 29 (1.5%) | 64 (5.0%) |
| $10,000 to $14,999 | 17 (0.9%) | 150 (11.6%) |
| $15,000 to $19,999 | 142 (7.3%) | 157 (12.1%) |
| $20,000 to $24,999 | 151 (7.7%) | 113 (8.7%) |
| $25,000 to $34,999 | 112 (5.8%) | 197 (15.2%) |
| $35,000 to $49,999 | 322 (16.5%) | 124 (9.6%) |
| $50,000 to $74,999 | 334 (17.1%) | 232 (17.9%) |
| $75,000 to $99,999 | 251 (12.9%) | 41 (3.2%) |
| $100,000 to $149,999 | 342 (17.5%) | 78 (6.0%) |
| $150,000 or more | 209 (10.7%) | 22 (1.7%) |
| Total | 1,949 (100.0%) | 1,293 (100.0%) |
Monthly Housing Cost Tiers in Price
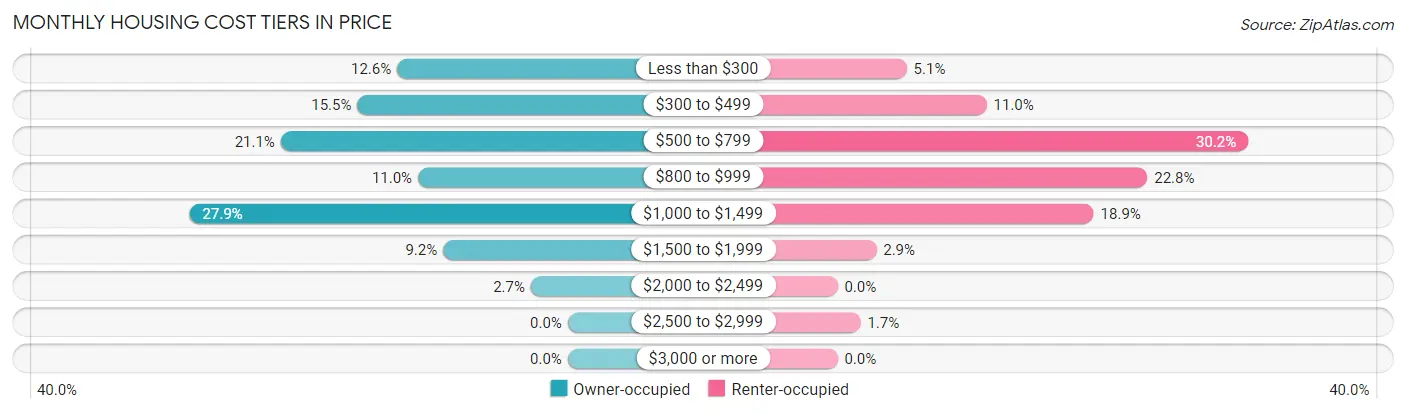
| Monthly Cost | Owner-occupied | Renter-occupied |
| Less than $300 | 245 (12.6%) | 66 (5.1%) |
| $300 to $499 | 302 (15.5%) | 142 (11.0%) |
| $500 to $799 | 412 (21.1%) | 391 (30.2%) |
| $800 to $999 | 215 (11.0%) | 295 (22.8%) |
| $1,000 to $1,499 | 543 (27.9%) | 244 (18.9%) |
| $1,500 to $1,999 | 179 (9.2%) | 37 (2.9%) |
| $2,000 to $2,499 | 53 (2.7%) | 0 (0.0%) |
| $2,500 to $2,999 | 0 (0.0%) | 22 (1.7%) |
| $3,000 or more | 0 (0.0%) | 0 (0.0%) |
| Total | 1,949 (100.0%) | 1,293 (100.0%) |
Physical Housing Characteristics in Price
Housing Structures in Price
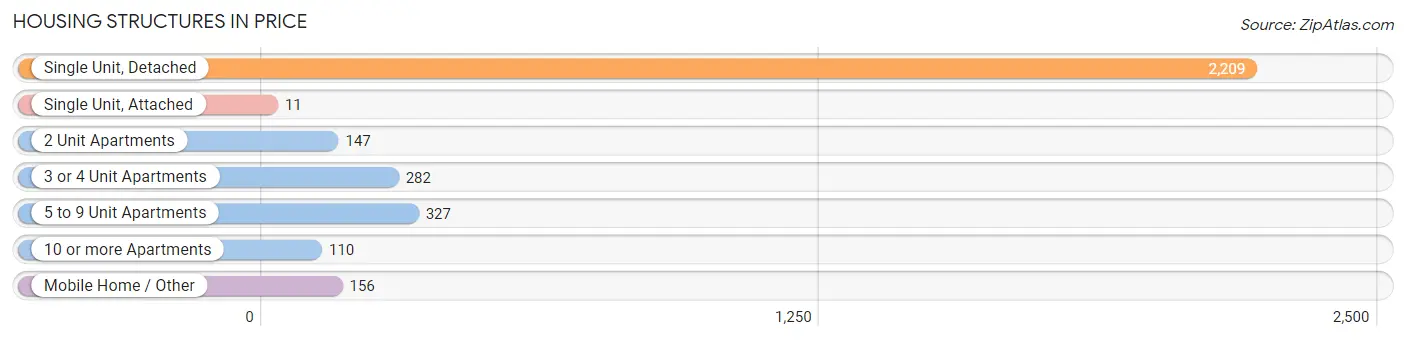
| Structure Type | # Housing Units | % Housing Units |
| Single Unit, Detached | 2,209 | 68.1% |
| Single Unit, Attached | 11 | 0.3% |
| 2 Unit Apartments | 147 | 4.5% |
| 3 or 4 Unit Apartments | 282 | 8.7% |
| 5 to 9 Unit Apartments | 327 | 10.1% |
| 10 or more Apartments | 110 | 3.4% |
| Mobile Home / Other | 156 | 4.8% |
| Total | 3,242 | 100.0% |
Housing Structures by Occupancy in Price
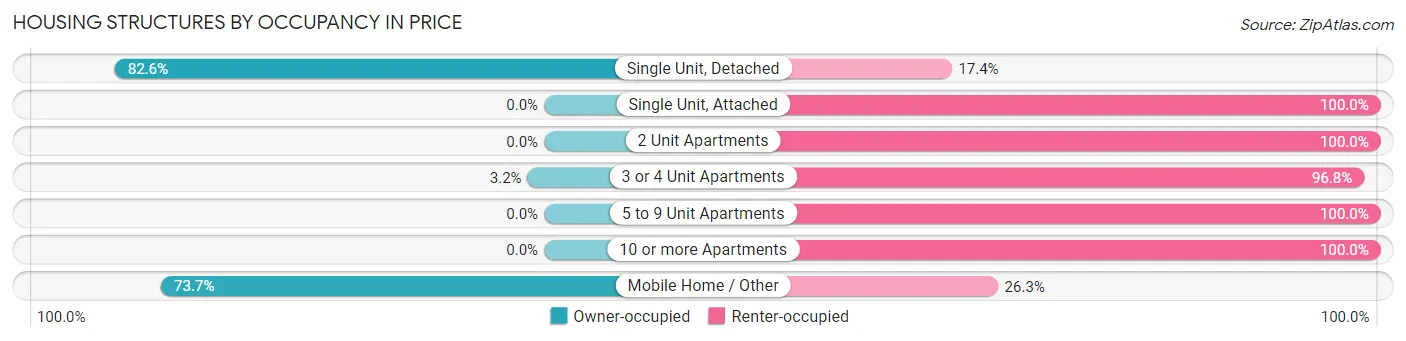
| Structure Type | Owner-occupied | Renter-occupied |
| Single Unit, Detached | 1,825 (82.6%) | 384 (17.4%) |
| Single Unit, Attached | 0 (0.0%) | 11 (100.0%) |
| 2 Unit Apartments | 0 (0.0%) | 147 (100.0%) |
| 3 or 4 Unit Apartments | 9 (3.2%) | 273 (96.8%) |
| 5 to 9 Unit Apartments | 0 (0.0%) | 327 (100.0%) |
| 10 or more Apartments | 0 (0.0%) | 110 (100.0%) |
| Mobile Home / Other | 115 (73.7%) | 41 (26.3%) |
| Total | 1,949 (60.1%) | 1,293 (39.9%) |
Housing Structures by Number of Rooms in Price
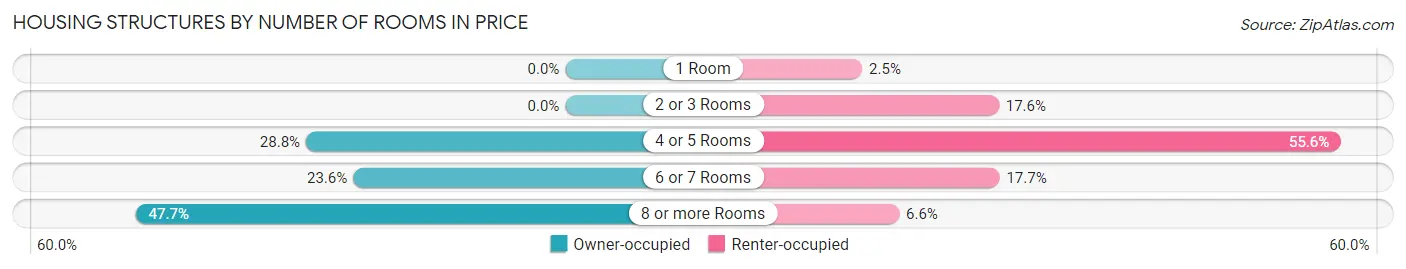
| Number of Rooms | Owner-occupied | Renter-occupied |
| 1 Room | 0 (0.0%) | 32 (2.5%) |
| 2 or 3 Rooms | 0 (0.0%) | 228 (17.6%) |
| 4 or 5 Rooms | 561 (28.8%) | 719 (55.6%) |
| 6 or 7 Rooms | 459 (23.5%) | 229 (17.7%) |
| 8 or more Rooms | 929 (47.7%) | 85 (6.6%) |
| Total | 1,949 (100.0%) | 1,293 (100.0%) |
Housing Structure by Heating Type in Price
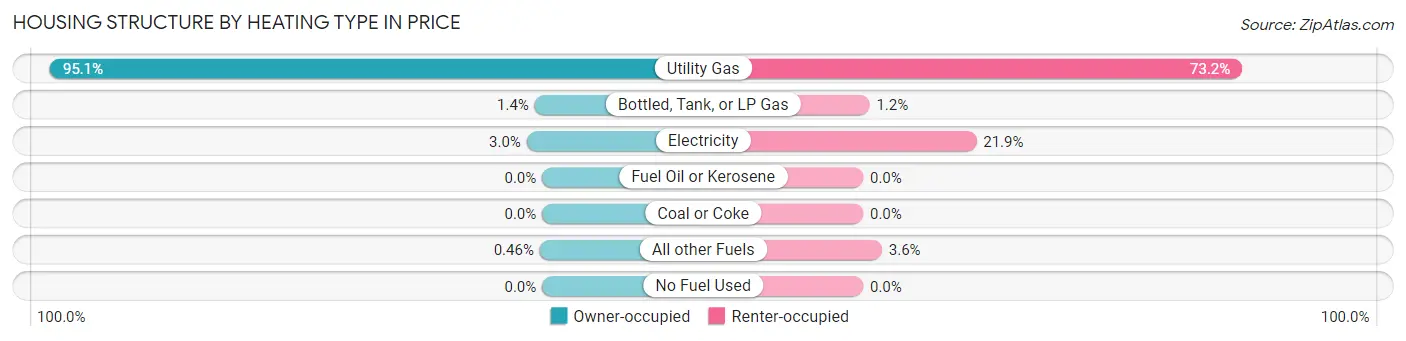
| Heating Type | Owner-occupied | Renter-occupied |
| Utility Gas | 1,854 (95.1%) | 947 (73.2%) |
| Bottled, Tank, or LP Gas | 28 (1.4%) | 16 (1.2%) |
| Electricity | 58 (3.0%) | 283 (21.9%) |
| Fuel Oil or Kerosene | 0 (0.0%) | 0 (0.0%) |
| Coal or Coke | 0 (0.0%) | 0 (0.0%) |
| All other Fuels | 9 (0.5%) | 47 (3.6%) |
| No Fuel Used | 0 (0.0%) | 0 (0.0%) |
| Total | 1,949 (100.0%) | 1,293 (100.0%) |
Household Vehicle Usage in Price
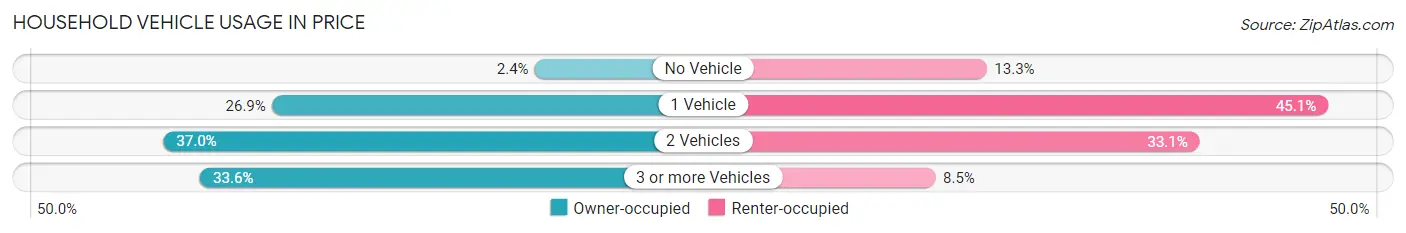
| Vehicles per Household | Owner-occupied | Renter-occupied |
| No Vehicle | 47 (2.4%) | 172 (13.3%) |
| 1 Vehicle | 525 (26.9%) | 583 (45.1%) |
| 2 Vehicles | 722 (37.0%) | 428 (33.1%) |
| 3 or more Vehicles | 655 (33.6%) | 110 (8.5%) |
| Total | 1,949 (100.0%) | 1,293 (100.0%) |
Real Estate & Mortgages in Price
Real Estate and Mortgage Overview in Price
| Characteristic | Without Mortgage | With Mortgage |
| Housing Units | 837 | 1,112 |
| Median Property Value | $148,400 | $185,100 |
| Median Household Income | $49,191 | $132 |
| Monthly Housing Costs | $415 | $0 |
| Real Estate Taxes | $1,256 | $44 |
Property Value by Mortgage Status in Price
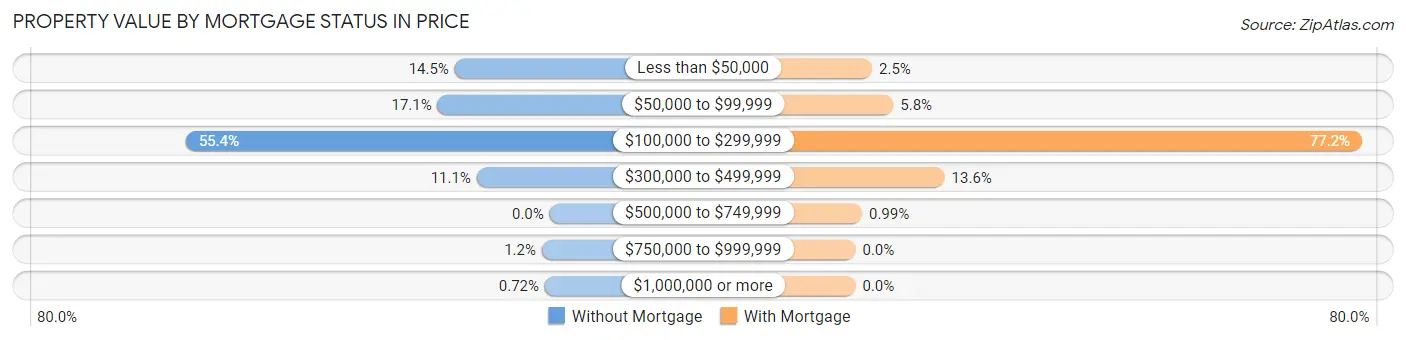
| Property Value | Without Mortgage | With Mortgage |
| Less than $50,000 | 121 (14.5%) | 28 (2.5%) |
| $50,000 to $99,999 | 143 (17.1%) | 64 (5.8%) |
| $100,000 to $299,999 | 464 (55.4%) | 858 (77.2%) |
| $300,000 to $499,999 | 93 (11.1%) | 151 (13.6%) |
| $500,000 to $749,999 | 0 (0.0%) | 11 (1.0%) |
| $750,000 to $999,999 | 10 (1.2%) | 0 (0.0%) |
| $1,000,000 or more | 6 (0.7%) | 0 (0.0%) |
| Total | 837 (100.0%) | 1,112 (100.0%) |
Household Income by Mortgage Status in Price
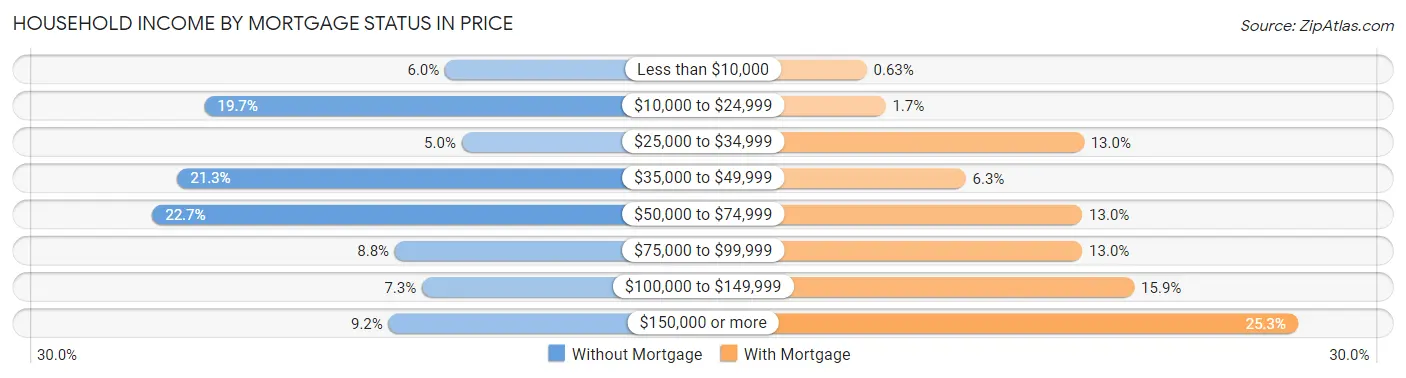
| Household Income | Without Mortgage | With Mortgage |
| Less than $10,000 | 50 (6.0%) | 7 (0.6%) |
| $10,000 to $24,999 | 165 (19.7%) | 19 (1.7%) |
| $25,000 to $34,999 | 42 (5.0%) | 145 (13.0%) |
| $35,000 to $49,999 | 178 (21.3%) | 70 (6.3%) |
| $50,000 to $74,999 | 190 (22.7%) | 144 (13.0%) |
| $75,000 to $99,999 | 74 (8.8%) | 144 (13.0%) |
| $100,000 to $149,999 | 61 (7.3%) | 177 (15.9%) |
| $150,000 or more | 77 (9.2%) | 281 (25.3%) |
| Total | 837 (100.0%) | 1,112 (100.0%) |
Property Value to Household Income Ratio in Price
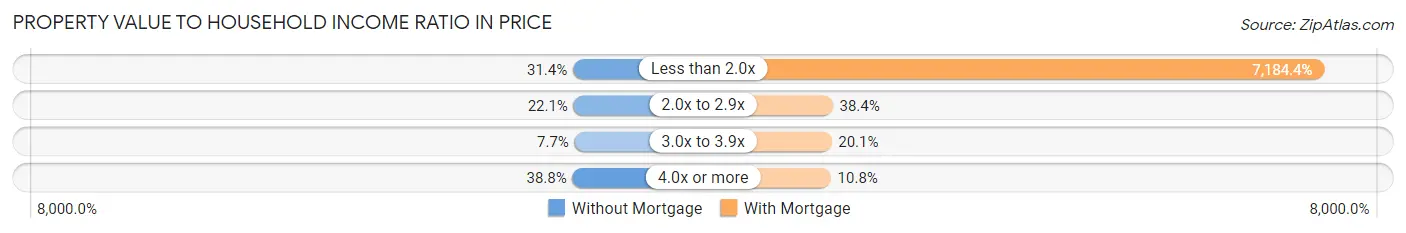
| Value-to-Income Ratio | Without Mortgage | With Mortgage |
| Less than 2.0x | 263 (31.4%) | 79,891 (7,184.4%) |
| 2.0x to 2.9x | 185 (22.1%) | 427 (38.4%) |
| 3.0x to 3.9x | 64 (7.6%) | 223 (20.1%) |
| 4.0x or more | 325 (38.8%) | 120 (10.8%) |
| Total | 837 (100.0%) | 1,112 (100.0%) |
Real Estate Taxes by Mortgage Status in Price
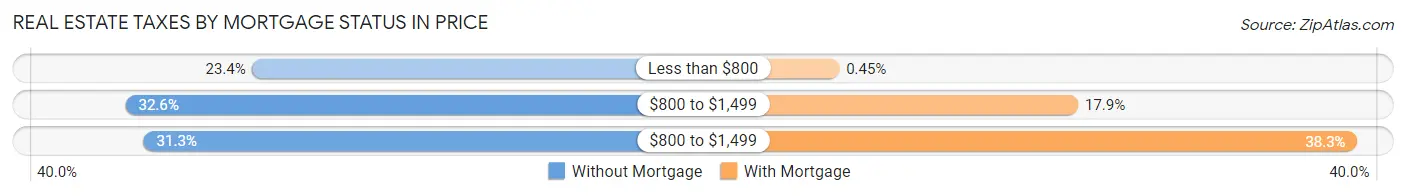
| Property Taxes | Without Mortgage | With Mortgage |
| Less than $800 | 196 (23.4%) | 5 (0.4%) |
| $800 to $1,499 | 273 (32.6%) | 199 (17.9%) |
| $800 to $1,499 | 262 (31.3%) | 426 (38.3%) |
| Total | 837 (100.0%) | 1,112 (100.0%) |
Health & Disability in Price
Health Insurance Coverage by Age in Price
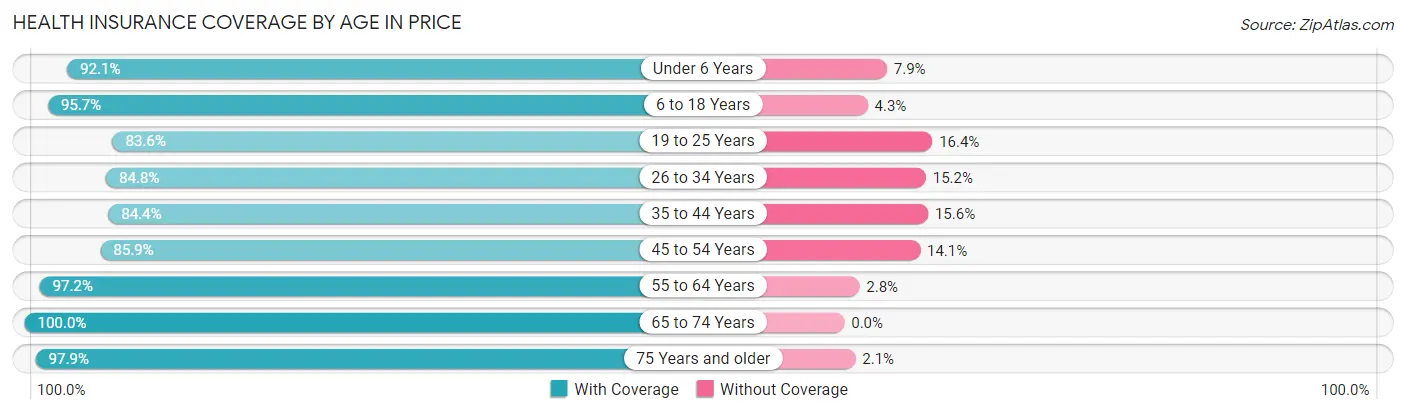
| Age Bracket | With Coverage | Without Coverage |
| Under 6 Years | 708 (92.1%) | 61 (7.9%) |
| 6 to 18 Years | 1,344 (95.7%) | 61 (4.3%) |
| 19 to 25 Years | 714 (83.6%) | 140 (16.4%) |
| 26 to 34 Years | 770 (84.8%) | 138 (15.2%) |
| 35 to 44 Years | 811 (84.4%) | 150 (15.6%) |
| 45 to 54 Years | 766 (85.9%) | 126 (14.1%) |
| 55 to 64 Years | 899 (97.2%) | 26 (2.8%) |
| 65 to 74 Years | 793 (100.0%) | 0 (0.0%) |
| 75 Years and older | 475 (97.9%) | 10 (2.1%) |
| Total | 7,280 (91.1%) | 712 (8.9%) |
Health Insurance Coverage by Citizenship Status in Price
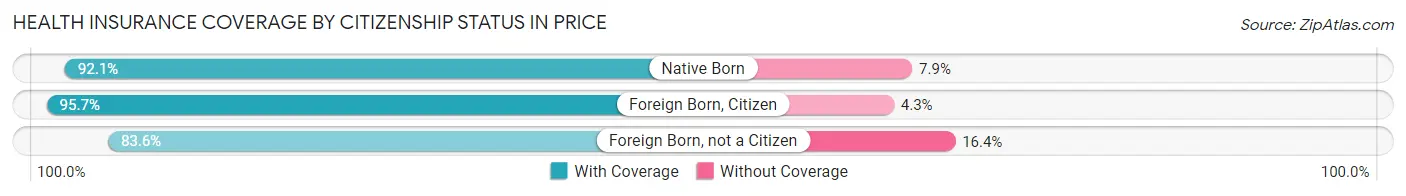
| Citizenship Status | With Coverage | Without Coverage |
| Native Born | 708 (92.1%) | 61 (7.9%) |
| Foreign Born, Citizen | 1,344 (95.7%) | 61 (4.3%) |
| Foreign Born, not a Citizen | 714 (83.6%) | 140 (16.4%) |
Health Insurance Coverage by Household Income in Price
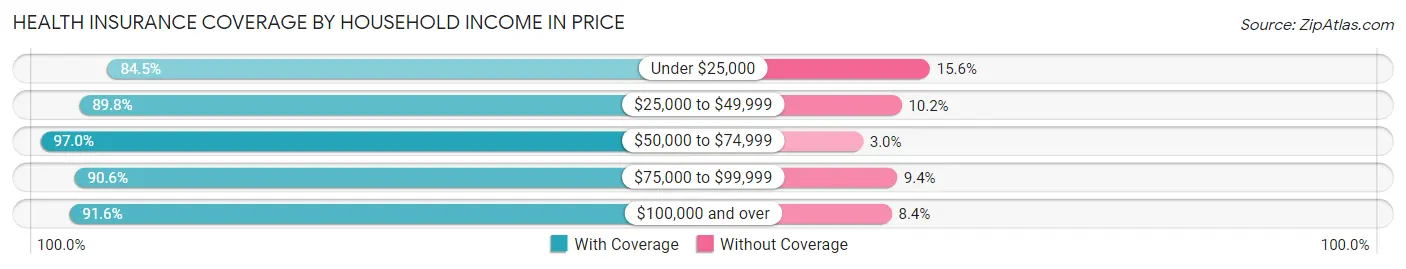
| Household Income | With Coverage | Without Coverage |
| Under $25,000 | 1,282 (84.5%) | 236 (15.5%) |
| $25,000 to $49,999 | 1,385 (89.8%) | 158 (10.2%) |
| $50,000 to $74,999 | 1,520 (97.0%) | 47 (3.0%) |
| $75,000 to $99,999 | 899 (90.6%) | 93 (9.4%) |
| $100,000 and over | 1,945 (91.6%) | 178 (8.4%) |
Public vs Private Health Insurance Coverage by Age in Price
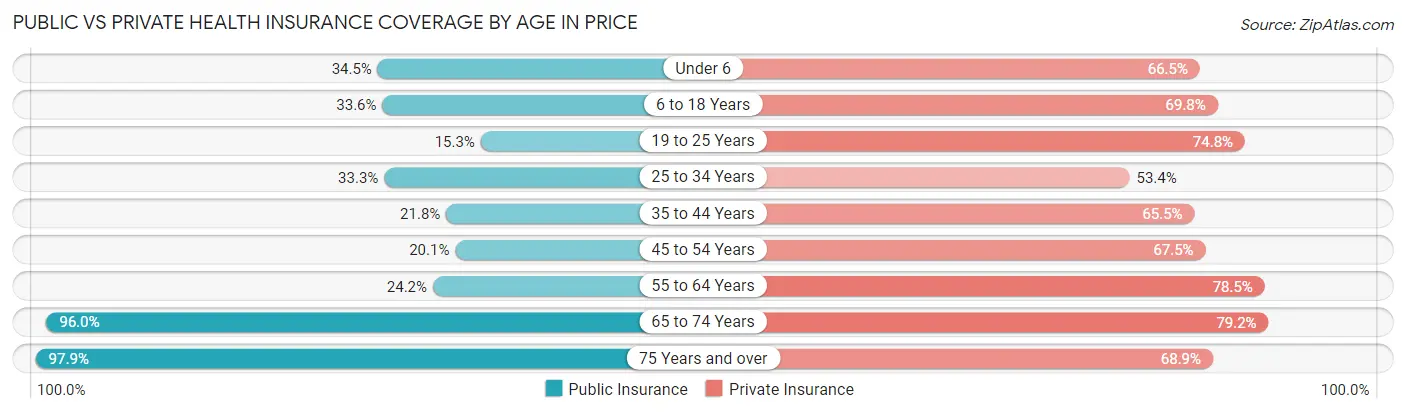
| Age Bracket | Public Insurance | Private Insurance |
| Under 6 | 265 (34.5%) | 511 (66.4%) |
| 6 to 18 Years | 472 (33.6%) | 980 (69.8%) |
| 19 to 25 Years | 131 (15.3%) | 639 (74.8%) |
| 25 to 34 Years | 302 (33.3%) | 485 (53.4%) |
| 35 to 44 Years | 209 (21.7%) | 629 (65.4%) |
| 45 to 54 Years | 179 (20.1%) | 602 (67.5%) |
| 55 to 64 Years | 224 (24.2%) | 726 (78.5%) |
| 65 to 74 Years | 761 (96.0%) | 628 (79.2%) |
| 75 Years and over | 475 (97.9%) | 334 (68.9%) |
| Total | 3,018 (37.8%) | 5,534 (69.2%) |
Disability Status by Sex by Age in Price
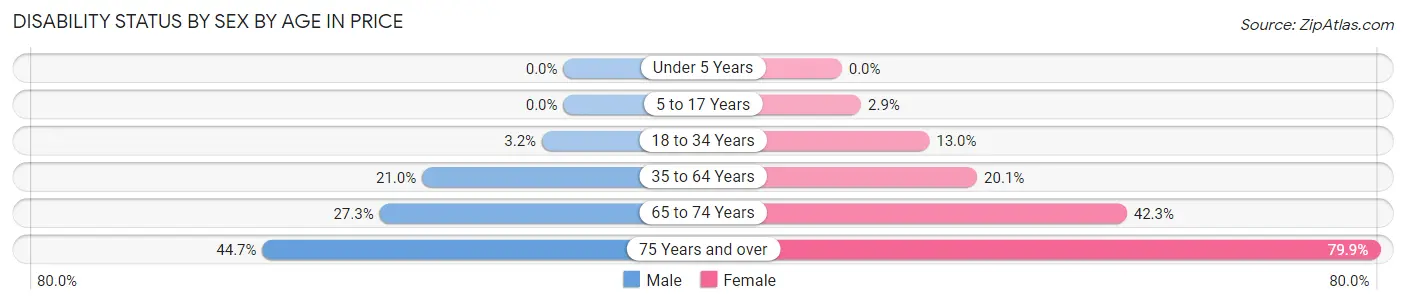
| Age Bracket | Male | Female |
| Under 5 Years | 0 (0.0%) | 0 (0.0%) |
| 5 to 17 Years | 0 (0.0%) | 20 (2.9%) |
| 18 to 34 Years | 27 (3.2%) | 129 (13.0%) |
| 35 to 64 Years | 299 (21.0%) | 272 (20.1%) |
| 65 to 74 Years | 92 (27.3%) | 193 (42.3%) |
| 75 Years and over | 101 (44.7%) | 207 (79.9%) |
Disability Class by Sex by Age in Price
Disability Class: Hearing Difficulty
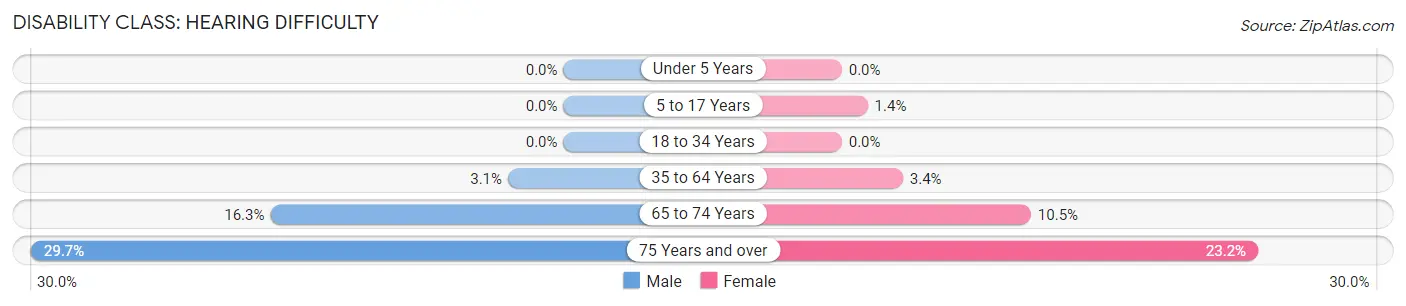
| Age Bracket | Male | Female |
| Under 5 Years | 0 (0.0%) | 0 (0.0%) |
| 5 to 17 Years | 0 (0.0%) | 10 (1.4%) |
| 18 to 34 Years | 0 (0.0%) | 0 (0.0%) |
| 35 to 64 Years | 44 (3.1%) | 46 (3.4%) |
| 65 to 74 Years | 55 (16.3%) | 48 (10.5%) |
| 75 Years and over | 67 (29.6%) | 60 (23.2%) |
Disability Class: Vision Difficulty
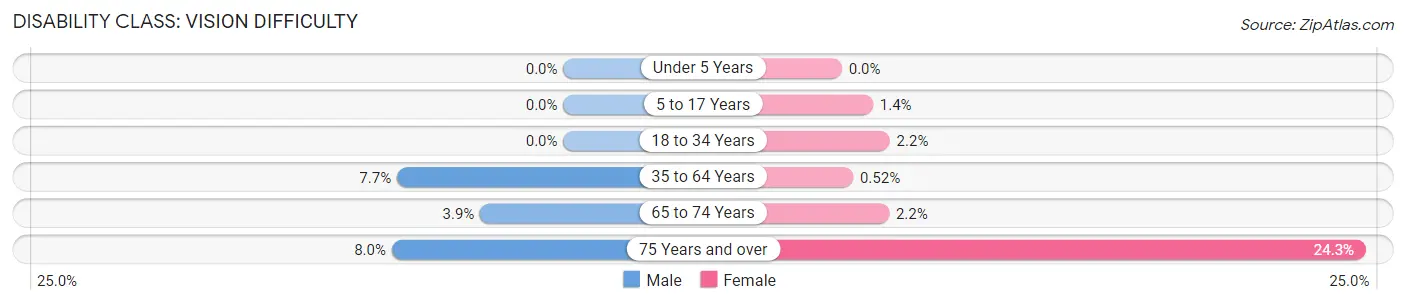
| Age Bracket | Male | Female |
| Under 5 Years | 0 (0.0%) | 0 (0.0%) |
| 5 to 17 Years | 0 (0.0%) | 10 (1.4%) |
| 18 to 34 Years | 0 (0.0%) | 22 (2.2%) |
| 35 to 64 Years | 110 (7.7%) | 7 (0.5%) |
| 65 to 74 Years | 13 (3.9%) | 10 (2.2%) |
| 75 Years and over | 18 (8.0%) | 63 (24.3%) |
Disability Class: Cognitive Difficulty
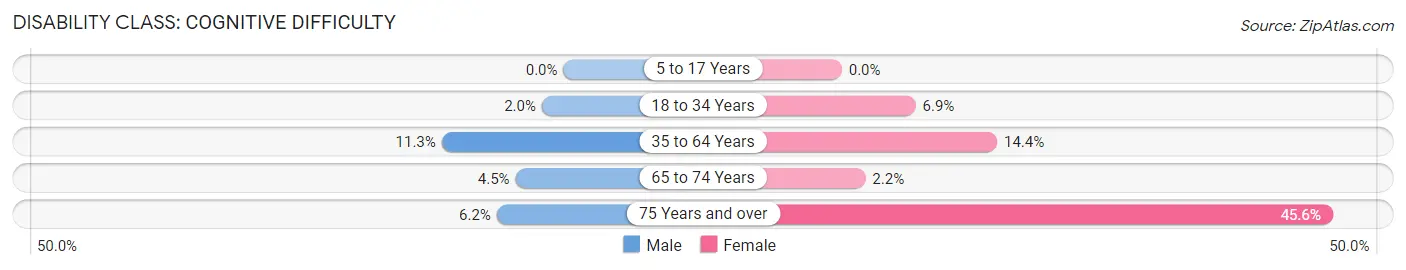
| Age Bracket | Male | Female |
| 5 to 17 Years | 0 (0.0%) | 0 (0.0%) |
| 18 to 34 Years | 17 (2.0%) | 68 (6.9%) |
| 35 to 64 Years | 161 (11.3%) | 195 (14.4%) |
| 65 to 74 Years | 15 (4.4%) | 10 (2.2%) |
| 75 Years and over | 14 (6.2%) | 118 (45.6%) |
Disability Class: Ambulatory Difficulty
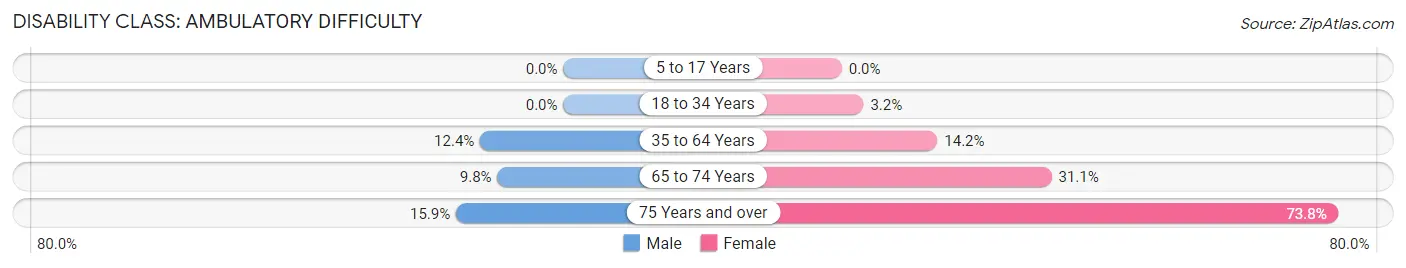
| Age Bracket | Male | Female |
| 5 to 17 Years | 0 (0.0%) | 0 (0.0%) |
| 18 to 34 Years | 0 (0.0%) | 32 (3.2%) |
| 35 to 64 Years | 176 (12.3%) | 192 (14.2%) |
| 65 to 74 Years | 33 (9.8%) | 142 (31.1%) |
| 75 Years and over | 36 (15.9%) | 191 (73.8%) |
Disability Class: Self-Care Difficulty
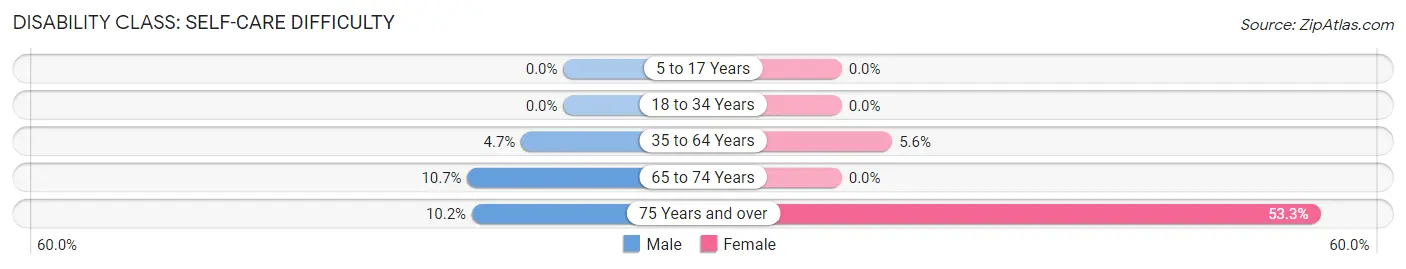
| Age Bracket | Male | Female |
| 5 to 17 Years | 0 (0.0%) | 0 (0.0%) |
| 18 to 34 Years | 0 (0.0%) | 0 (0.0%) |
| 35 to 64 Years | 67 (4.7%) | 76 (5.6%) |
| 65 to 74 Years | 36 (10.7%) | 0 (0.0%) |
| 75 Years and over | 23 (10.2%) | 138 (53.3%) |
Technology Access in Price
Computing Device Access in Price
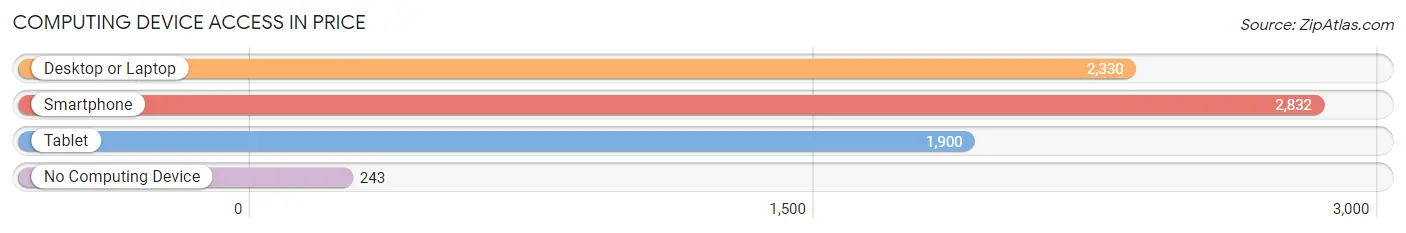
| Device Type | # Households | % Households |
| Desktop or Laptop | 2,330 | 71.9% |
| Smartphone | 2,832 | 87.4% |
| Tablet | 1,900 | 58.6% |
| No Computing Device | 243 | 7.5% |
| Total | 3,242 | 100.0% |
Internet Access in Price
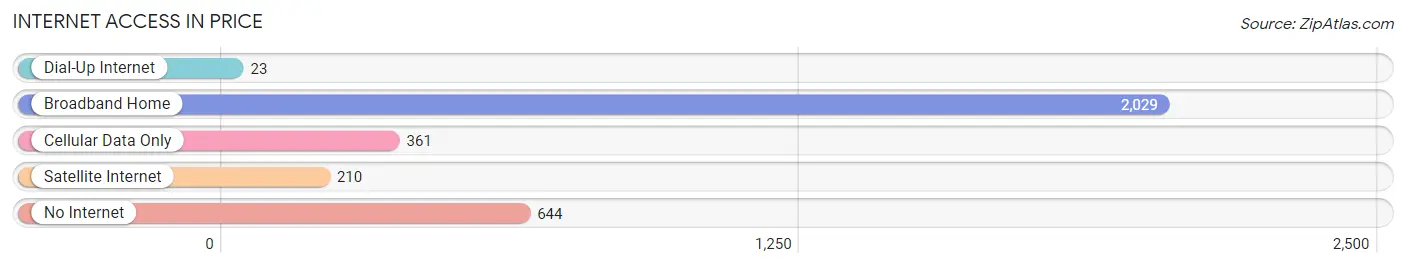
| Internet Type | # Households | % Households |
| Dial-Up Internet | 23 | 0.7% |
| Broadband Home | 2,029 | 62.6% |
| Cellular Data Only | 361 | 11.1% |
| Satellite Internet | 210 | 6.5% |
| No Internet | 644 | 19.9% |
| Total | 3,242 | 100.0% |
Price Summary
Price is a city located in the northeastern part of Utah, United States. It is the county seat of Carbon County and is located in the Wasatch Plateau. As of the 2010 census, the population of Price was 8,402. The city is known for its coal mining and railroad history, and is the home of the College of Eastern Utah.
Geography
Price is located at the junction of US Highway 6 and US Highway 191. It is situated in the Wasatch Plateau, at an elevation of 5,906 feet (1,800 m). The city is located in the eastern part of Carbon County, and is surrounded by the Manti-La Sal National Forest. The Price River flows through the city, and the San Rafael Swell is located to the south.
Climate
Price has a semi-arid climate, with cold winters and hot summers. The average annual temperature is 45.2°F (7.3°C). The average annual precipitation is 13.7 inches (35 cm).
Demographics
As of the 2010 census, there were 8,402 people, 2,945 households, and 1,945 families residing in the city. The population density was 1,717.3 people per square mile (662.2/km2). The racial makeup of the city was 90.2% White, 0.3% African American, 1.2% Native American, 0.7% Asian, 0.1% Pacific Islander, 5.3% from other races, and 2.3% from two or more races. Hispanic or Latino of any race were 11.2% of the population.
Economy
Price is the economic center of Carbon County. The city is home to several industries, including coal mining, oil and gas production, and manufacturing. The city is also home to the College of Eastern Utah, which provides educational and economic opportunities to the region.
History
Price was founded in 1894 as a coal mining town. The city was named after William Price, a local coal mine operator. The city quickly grew, and by 1900, it had a population of 1,000. The city was incorporated in 1901.
In the early 20th century, Price was a major railroad hub, with the Denver and Rio Grande Western Railroad and the Utah Railway both running through the city. The city was also home to several coal mines, which provided employment for many of the city's residents.
In the 1950s, the city began to diversify its economy, with the opening of several manufacturing plants. The city also became home to the College of Eastern Utah in 1937.
Today, Price is a vibrant city with a diverse economy. The city is home to several industries, including coal mining, oil and gas production, and manufacturing. The city is also home to the College of Eastern Utah, which provides educational and economic opportunities to the region.
Common Questions
What is Per Capita Income in Price?
Per Capita income in Price is $23,727.
What is the Median Family Income in Price?
Median Family Income in Price is $58,750.
What is the Median Household income in Price?
Median Household Income in Price is $47,724.
What is Income or Wage Gap in Price?
Income or Wage Gap in Price is 62.0%.
Women in Price earn 38.0 cents for every dollar earned by a man.
What is Inequality or Gini Index in Price?
Inequality or Gini Index in Price is 0.44.
What is the Total Population of Price?
Total Population of Price is 8,174.
What is the Total Male Population of Price?
Total Male Population of Price is 4,078.
What is the Total Female Population of Price?
Total Female Population of Price is 4,096.
What is the Ratio of Males per 100 Females in Price?
There are 99.56 Males per 100 Females in Price.
What is the Ratio of Females per 100 Males in Price?
There are 100.44 Females per 100 Males in Price.
What is the Median Population Age in Price?
Median Population Age in Price is 36.1 Years.
What is the Average Family Size in Price
Average Family Size in Price is 3.1 People.
What is the Average Household Size in Price
Average Household Size in Price is 2.4 People.
How Large is the Labor Force in Price?
There are 3,746 People in the Labor Forcein in Price.
What is the Percentage of People in the Labor Force in Price?
58.8% of People are in the Labor Force in Price.
What is the Unemployment Rate in Price?
Unemployment Rate in Price is 8.2%.