Gunnison, UT Map & Demographics
Gunnison Map
Gunnison Overview
$15,257
PER CAPITA INCOME
$87,778
AVG FAMILY INCOME
$64,514
AVG HOUSEHOLD INCOME
24.2%
WAGE / INCOME GAP [ % ]
75.8¢/ $1
WAGE / INCOME GAP [ $ ]
0.38
INEQUALITY / GINI INDEX
3,516
TOTAL POPULATION
2,513
MALE POPULATION
1,003
FEMALE POPULATION
250.55
MALES / 100 FEMALES
39.91
FEMALES / 100 MALES
36.0
MEDIAN AGE
3.6
AVG FAMILY SIZE
3.1
AVG HOUSEHOLD SIZE
884
LABOR FORCE [ PEOPLE ]
29.7%
PERCENT IN LABOR FORCE
3.4%
UNEMPLOYMENT RATE
Gunnison Zip Codes
Gunnison Area Codes
Income in Gunnison
Income Overview in Gunnison
Per Capita Income in Gunnison is $15,257, while median incomes of families and households are $87,778 and $64,514 respectively.
| Characteristic | Number | Measure |
| Per Capita Income | 3,516 | $15,257 |
| Median Family Income | 446 | $87,778 |
| Mean Family Income | 446 | $84,170 |
| Median Household Income | 591 | $64,514 |
| Mean Household Income | 591 | $77,032 |
| Income Deficit | 446 | $0 |
| Wage / Income Gap (%) | 3,516 | 24.16% |
| Wage / Income Gap ($) | 3,516 | 75.84¢ per $1 |
| Gini / Inequality Index | 3,516 | 0.38 |
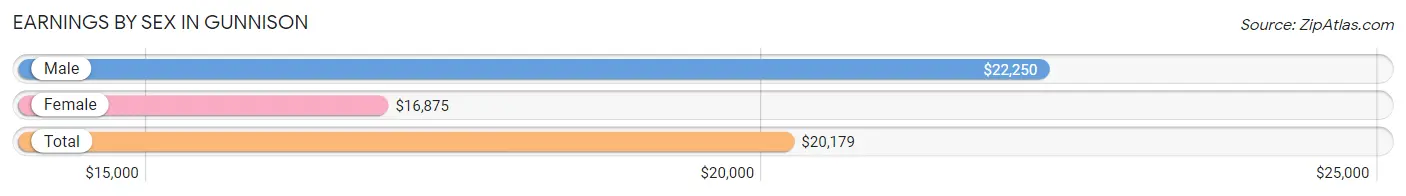
Earnings by Sex in Gunnison
Average Earnings in Gunnison are $20,179, $22,250 for men and $16,875 for women, a difference of 24.2%.
| Sex | Number | Average Earnings |
| Male | 849 (64.4%) | $22,250 |
| Female | 470 (35.6%) | $16,875 |
| Total | 1,319 (100.0%) | $20,179 |
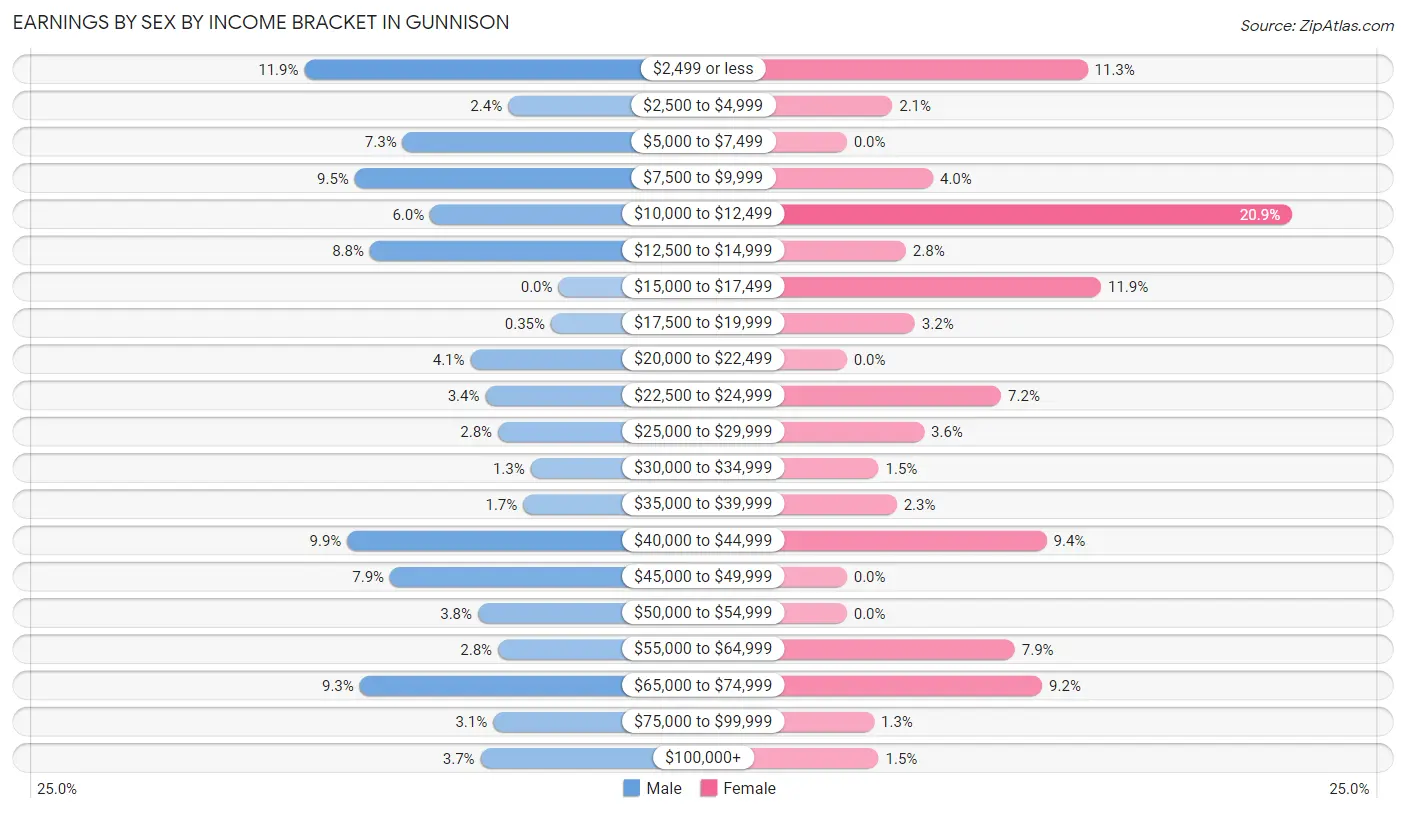
Earnings by Sex by Income Bracket in Gunnison
The most common earnings brackets in Gunnison are $2,499 or less for men (101 | 11.9%) and $10,000 to $12,499 for women (98 | 20.8%).
| Income | Male | Female |
| $2,499 or less | 101 (11.9%) | 53 (11.3%) |
| $2,500 to $4,999 | 20 (2.4%) | 10 (2.1%) |
| $5,000 to $7,499 | 62 (7.3%) | 0 (0.0%) |
| $7,500 to $9,999 | 81 (9.5%) | 19 (4.0%) |
| $10,000 to $12,499 | 51 (6.0%) | 98 (20.8%) |
| $12,500 to $14,999 | 75 (8.8%) | 13 (2.8%) |
| $15,000 to $17,499 | 0 (0.0%) | 56 (11.9%) |
| $17,500 to $19,999 | 3 (0.4%) | 15 (3.2%) |
| $20,000 to $22,499 | 35 (4.1%) | 0 (0.0%) |
| $22,500 to $24,999 | 29 (3.4%) | 34 (7.2%) |
| $25,000 to $29,999 | 24 (2.8%) | 17 (3.6%) |
| $30,000 to $34,999 | 11 (1.3%) | 7 (1.5%) |
| $35,000 to $39,999 | 14 (1.7%) | 11 (2.3%) |
| $40,000 to $44,999 | 84 (9.9%) | 44 (9.4%) |
| $45,000 to $49,999 | 67 (7.9%) | 0 (0.0%) |
| $50,000 to $54,999 | 32 (3.8%) | 0 (0.0%) |
| $55,000 to $64,999 | 24 (2.8%) | 37 (7.9%) |
| $65,000 to $74,999 | 79 (9.3%) | 43 (9.1%) |
| $75,000 to $99,999 | 26 (3.1%) | 6 (1.3%) |
| $100,000+ | 31 (3.6%) | 7 (1.5%) |
| Total | 849 (100.0%) | 470 (100.0%) |
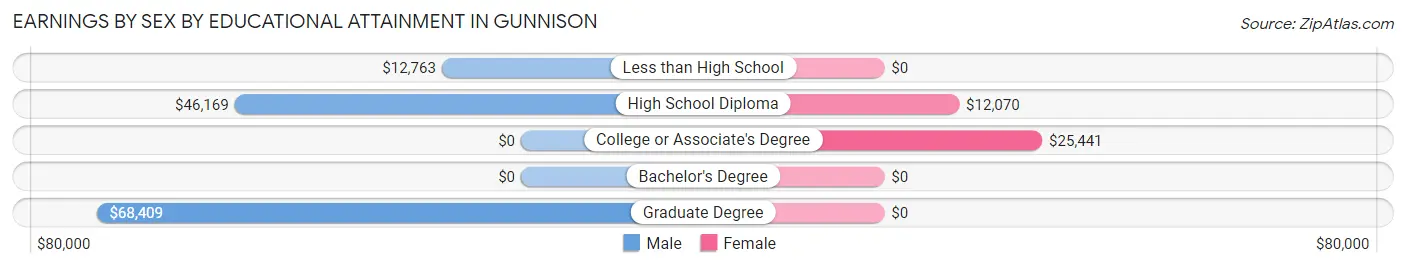
Earnings by Sex by Educational Attainment in Gunnison
| Educational Attainment | Male Income | Female Income |
| Less than High School | $12,763 | $0 |
| High School Diploma | $46,169 | $12,070 |
| College or Associate's Degree | - | - |
| Bachelor's Degree | - | - |
| Graduate Degree | $68,409 | $0 |
| Total | - | - |
Family Income in Gunnison
Family Income Brackets in Gunnison
According to the Gunnison family income data, there are 110 families falling into the $100,000 to $149,999 income range, which is the most common income bracket and makes up 24.7% of all families.
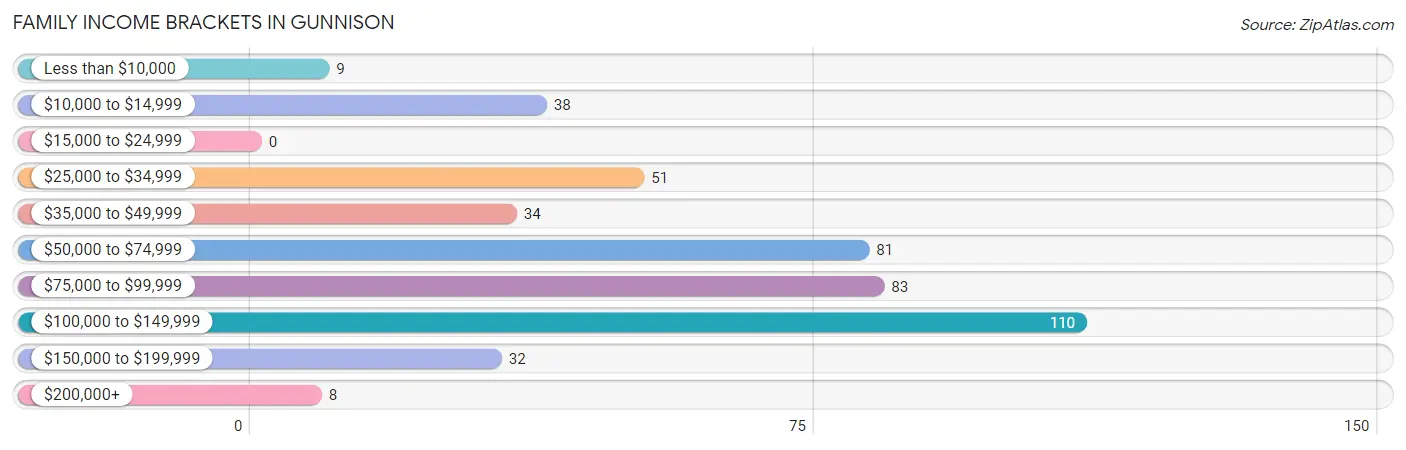
| Income Bracket | # Families | % Families |
| Less than $10,000 | 9 | 2.0% |
| $10,000 to $14,999 | 38 | 8.5% |
| $15,000 to $24,999 | 0 | 0.0% |
| $25,000 to $34,999 | 51 | 11.4% |
| $35,000 to $49,999 | 34 | 7.6% |
| $50,000 to $74,999 | 81 | 18.2% |
| $75,000 to $99,999 | 83 | 18.6% |
| $100,000 to $149,999 | 110 | 24.7% |
| $150,000 to $199,999 | 32 | 7.2% |
| $200,000+ | 8 | 1.8% |
Family Income by Famaliy Size in Gunnison
2-person families (102 | 22.9%) account for the highest median family income in Gunnison with $135,870 per family, while 2-person families (102 | 22.9%) have the highest median income of $67,935 per family member.
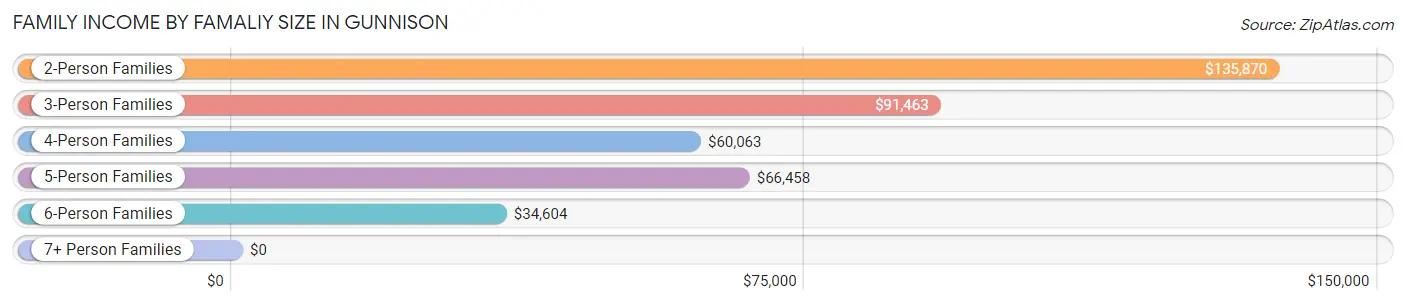
| Income Bracket | # Families | Median Income |
| 2-Person Families | 102 (22.9%) | $135,870 |
| 3-Person Families | 130 (29.1%) | $91,463 |
| 4-Person Families | 101 (22.7%) | $60,063 |
| 5-Person Families | 28 (6.3%) | $66,458 |
| 6-Person Families | 75 (16.8%) | $34,604 |
| 7+ Person Families | 10 (2.2%) | $0 |
| Total | 446 (100.0%) | $87,778 |
Family Income by Number of Earners in Gunnison
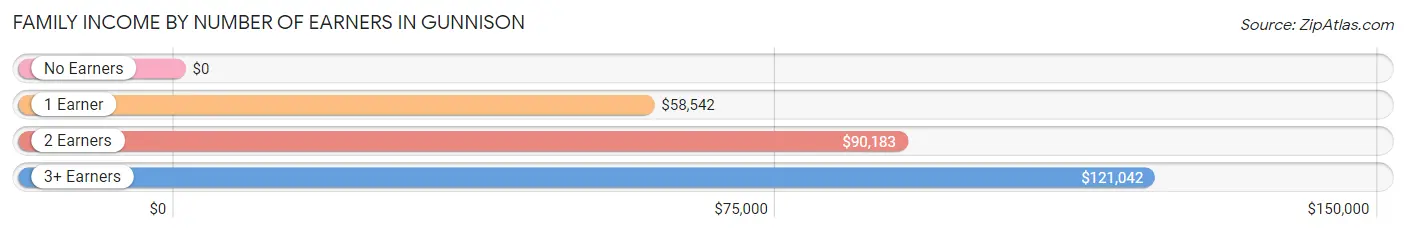
| Number of Earners | # Families | Median Income |
| No Earners | 36 (8.1%) | $0 |
| 1 Earner | 107 (24.0%) | $58,542 |
| 2 Earners | 230 (51.6%) | $90,183 |
| 3+ Earners | 73 (16.4%) | $121,042 |
| Total | 446 (100.0%) | $87,778 |
Household Income in Gunnison
Household Income Brackets in Gunnison
With 132 households falling in the category, the $100,000 to $149,999 income range is the most frequent in Gunnison, accounting for 22.3% of all households. In contrast, only 8 households (1.3%) fall into the less than $10,000 income bracket, making it the least populous group.
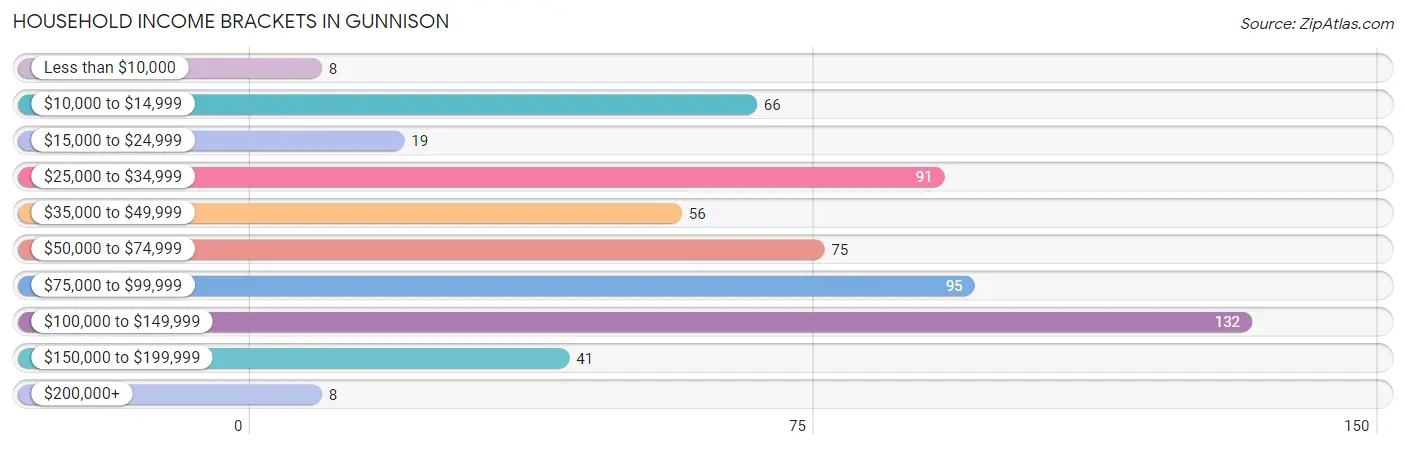
| Income Bracket | # Households | % Households |
| Less than $10,000 | 8 | 1.4% |
| $10,000 to $14,999 | 66 | 11.2% |
| $15,000 to $24,999 | 19 | 3.2% |
| $25,000 to $34,999 | 91 | 15.4% |
| $35,000 to $49,999 | 56 | 9.5% |
| $50,000 to $74,999 | 75 | 12.7% |
| $75,000 to $99,999 | 95 | 16.1% |
| $100,000 to $149,999 | 132 | 22.3% |
| $150,000 to $199,999 | 41 | 6.9% |
| $200,000+ | 8 | 1.4% |
Household Income by Householder Age in Gunnison
The median household income in Gunnison is $64,514, with the highest median household income of $91,536 found in the 45 to 64 years age bracket for the primary householder. A total of 227 households (38.4%) fall into this category. Meanwhile, the 15 to 24 years age bracket for the primary householder has the lowest median household income of $0, with 15 households (2.5%) in this group.
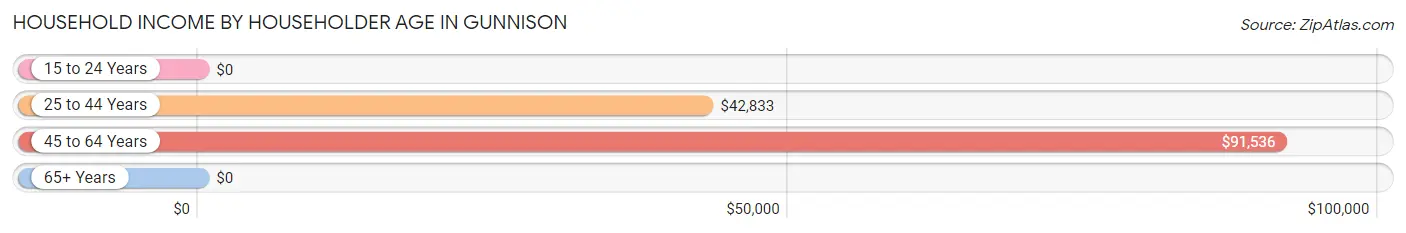
| Income Bracket | # Households | Median Income |
| 15 to 24 Years | 15 (2.5%) | $0 |
| 25 to 44 Years | 198 (33.5%) | $42,833 |
| 45 to 64 Years | 227 (38.4%) | $91,536 |
| 65+ Years | 151 (25.6%) | $0 |
| Total | 591 (100.0%) | $64,514 |
Poverty in Gunnison
Income Below Poverty by Sex and Age in Gunnison
With 15.9% poverty level for males and 26.2% for females among the residents of Gunnison, 75 year old and over males and under 5 year old females are the most vulnerable to poverty, with 15 males (93.8%) and 29 females (61.7%) in their respective age groups living below the poverty level.
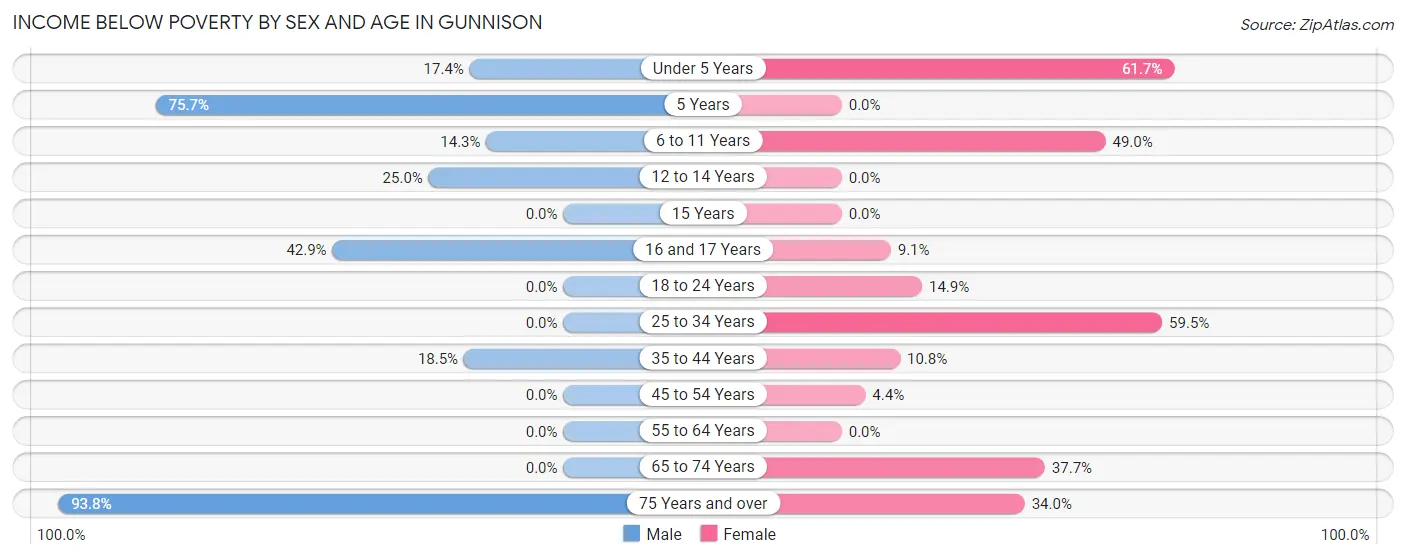
| Age Bracket | Male | Female |
| Under 5 Years | 8 (17.4%) | 29 (61.7%) |
| 5 Years | 56 (75.7%) | 0 (0.0%) |
| 6 to 11 Years | 17 (14.3%) | 70 (48.9%) |
| 12 to 14 Years | 7 (25.0%) | 0 (0.0%) |
| 15 Years | 0 (0.0%) | 0 (0.0%) |
| 16 and 17 Years | 6 (42.9%) | 6 (9.1%) |
| 18 to 24 Years | 0 (0.0%) | 14 (14.9%) |
| 25 to 34 Years | 0 (0.0%) | 88 (59.5%) |
| 35 to 44 Years | 19 (18.4%) | 8 (10.8%) |
| 45 to 54 Years | 0 (0.0%) | 7 (4.4%) |
| 55 to 64 Years | 0 (0.0%) | 0 (0.0%) |
| 65 to 74 Years | 0 (0.0%) | 23 (37.7%) |
| 75 Years and over | 15 (93.8%) | 18 (34.0%) |
| Total | 128 (15.9%) | 263 (26.2%) |
Income Above Poverty by Sex and Age in Gunnison
According to the poverty statistics in Gunnison, males aged 18 to 24 years and females aged 5 years are the age groups that are most secure financially, with 100.0% of males and 100.0% of females in these age groups living above the poverty line.
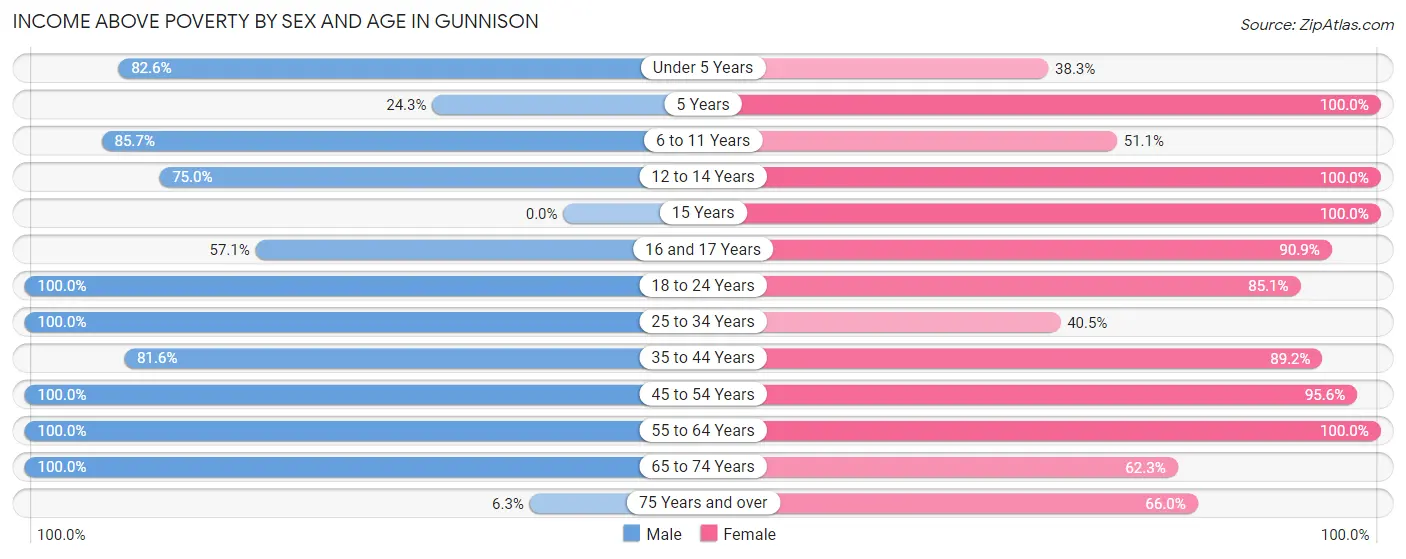
| Age Bracket | Male | Female |
| Under 5 Years | 38 (82.6%) | 18 (38.3%) |
| 5 Years | 18 (24.3%) | 19 (100.0%) |
| 6 to 11 Years | 102 (85.7%) | 73 (51.0%) |
| 12 to 14 Years | 21 (75.0%) | 27 (100.0%) |
| 15 Years | 0 (0.0%) | 36 (100.0%) |
| 16 and 17 Years | 8 (57.1%) | 60 (90.9%) |
| 18 to 24 Years | 62 (100.0%) | 80 (85.1%) |
| 25 to 34 Years | 92 (100.0%) | 60 (40.5%) |
| 35 to 44 Years | 84 (81.6%) | 66 (89.2%) |
| 45 to 54 Years | 118 (100.0%) | 153 (95.6%) |
| 55 to 64 Years | 63 (100.0%) | 75 (100.0%) |
| 65 to 74 Years | 68 (100.0%) | 38 (62.3%) |
| 75 Years and over | 1 (6.2%) | 35 (66.0%) |
| Total | 675 (84.1%) | 740 (73.8%) |
Income Below Poverty Among Married-Couple Families in Gunnison
The poverty statistics for married-couple families in Gunnison show that 18.8% or 69 of the total 367 families live below the poverty line. Families with 3 or 4 children have the highest poverty rate of 58.7%, comprising of 44 families. On the other hand, families with 5 or more children have the lowest poverty rate of 0.0%, which includes 0 families.
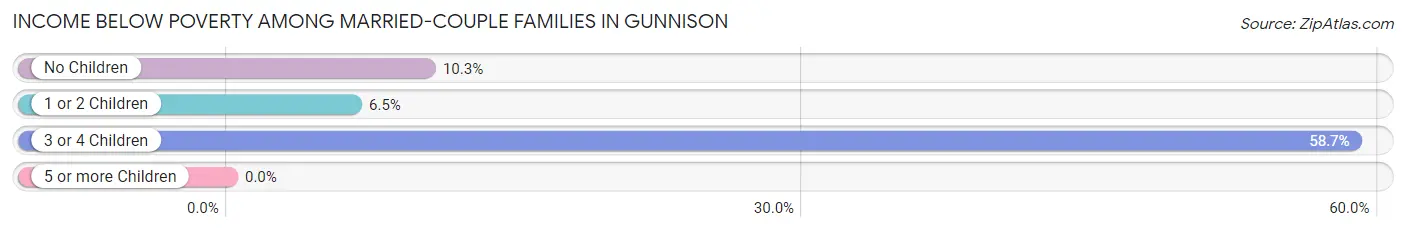
| Children | Above Poverty | Below Poverty |
| No Children | 156 (89.7%) | 18 (10.3%) |
| 1 or 2 Children | 101 (93.5%) | 7 (6.5%) |
| 3 or 4 Children | 31 (41.3%) | 44 (58.7%) |
| 5 or more Children | 10 (100.0%) | 0 (0.0%) |
| Total | 298 (81.2%) | 69 (18.8%) |
Income Below Poverty Among Single-Parent Households in Gunnison
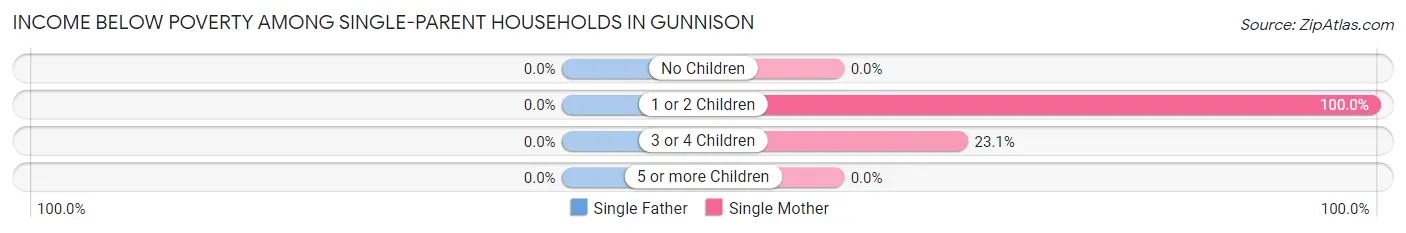
| Children | Single Father | Single Mother |
| No Children | 0 (0.0%) | 0 (0.0%) |
| 1 or 2 Children | 0 (0.0%) | 20 (100.0%) |
| 3 or 4 Children | 0 (0.0%) | 9 (23.1%) |
| 5 or more Children | 0 (0.0%) | 0 (0.0%) |
| Total | 0 (0.0%) | 29 (49.1%) |
Income Below Poverty Among Married-Couple vs Single-Parent Households in Gunnison
The poverty data for Gunnison shows that 69 of the married-couple family households (18.8%) and 29 of the single-parent households (36.7%) are living below the poverty level. Within the married-couple family households, those with 3 or 4 children have the highest poverty rate, with 44 households (58.7%) falling below the poverty line. Among the single-parent households, those with 1 or 2 children have the highest poverty rate, with 20 household (100.0%) living below poverty.
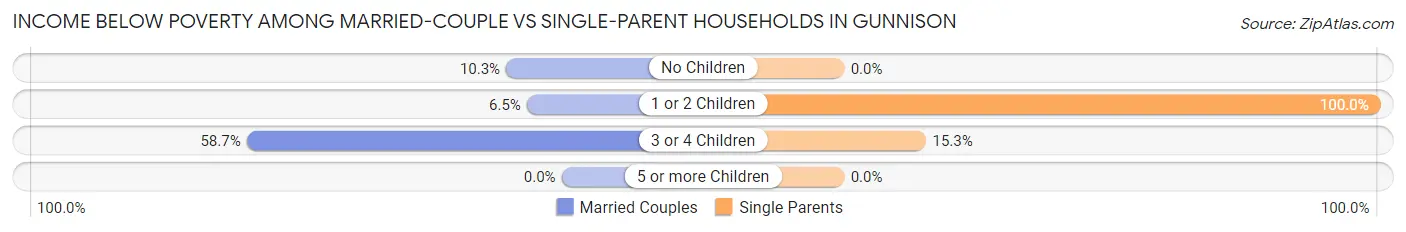
| Children | Married-Couple Families | Single-Parent Households |
| No Children | 18 (10.3%) | 0 (0.0%) |
| 1 or 2 Children | 7 (6.5%) | 20 (100.0%) |
| 3 or 4 Children | 44 (58.7%) | 9 (15.2%) |
| 5 or more Children | 0 (0.0%) | 0 (0.0%) |
| Total | 69 (18.8%) | 29 (36.7%) |
Race in Gunnison
The most populous races in Gunnison are White / Caucasian (2,481 | 70.6%), Hispanic or Latino (749 | 21.3%), and Some other Race (587 | 16.7%).
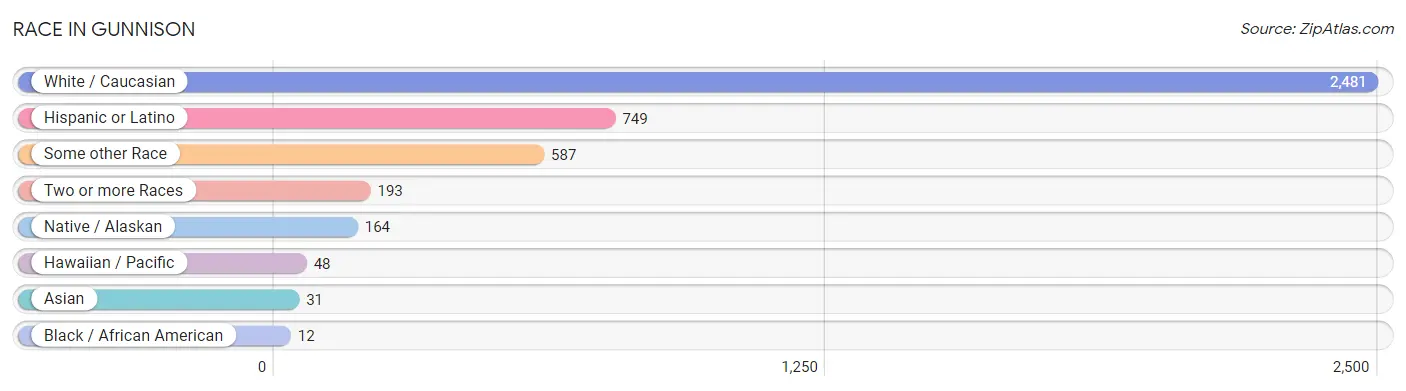
| Race | # Population | % Population |
| Asian | 31 | 0.9% |
| Black / African American | 12 | 0.3% |
| Hawaiian / Pacific | 48 | 1.4% |
| Hispanic or Latino | 749 | 21.3% |
| Native / Alaskan | 164 | 4.7% |
| White / Caucasian | 2,481 | 70.6% |
| Two or more Races | 193 | 5.5% |
| Some other Race | 587 | 16.7% |
| Total | 3,516 | 100.0% |
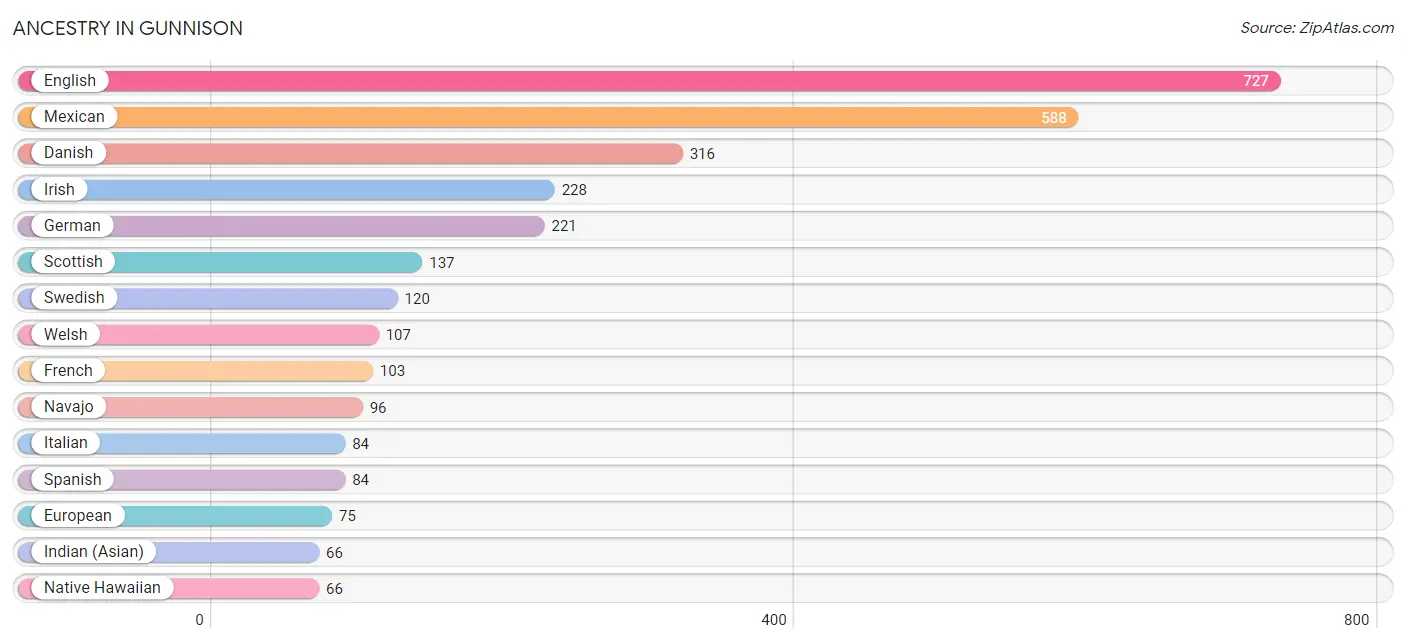
Ancestry in Gunnison
The most populous ancestries reported in Gunnison are English (727 | 20.7%), Mexican (588 | 16.7%), Danish (316 | 9.0%), Irish (228 | 6.5%), and German (221 | 6.3%), together accounting for 59.2% of all Gunnison residents.
| Ancestry | # Population | % Population |
| African | 12 | 0.3% |
| American | 8 | 0.2% |
| Argentinean | 12 | 0.3% |
| Australian | 5 | 0.1% |
| Austrian | 6 | 0.2% |
| Brazilian | 9 | 0.3% |
| British | 26 | 0.7% |
| Canadian | 4 | 0.1% |
| Central American | 12 | 0.3% |
| Danish | 316 | 9.0% |
| Dutch | 58 | 1.7% |
| English | 727 | 20.7% |
| European | 75 | 2.1% |
| Finnish | 7 | 0.2% |
| French | 103 | 2.9% |
| German | 221 | 6.3% |
| Greek | 36 | 1.0% |
| Indian (Asian) | 66 | 1.9% |
| Irish | 228 | 6.5% |
| Italian | 84 | 2.4% |
| Malaysian | 10 | 0.3% |
| Mexican | 588 | 16.7% |
| Native Hawaiian | 66 | 1.9% |
| Navajo | 96 | 2.7% |
| Norwegian | 30 | 0.9% |
| Paiute | 57 | 1.6% |
| Pakistani | 17 | 0.5% |
| Peruvian | 16 | 0.5% |
| Portuguese | 5 | 0.1% |
| Puerto Rican | 3 | 0.1% |
| Russian | 18 | 0.5% |
| Salvadoran | 12 | 0.3% |
| Samoan | 27 | 0.8% |
| Scandinavian | 7 | 0.2% |
| Scottish | 137 | 3.9% |
| South American | 28 | 0.8% |
| Spaniard | 34 | 1.0% |
| Spanish | 84 | 2.4% |
| Sri Lankan | 8 | 0.2% |
| Subsaharan African | 12 | 0.3% |
| Swedish | 120 | 3.4% |
| Tongan | 8 | 0.2% |
| Ukrainian | 3 | 0.1% |
| Ute | 11 | 0.3% |
| Welsh | 107 | 3.0% | View All 45 Rows |
Immigrants in Gunnison
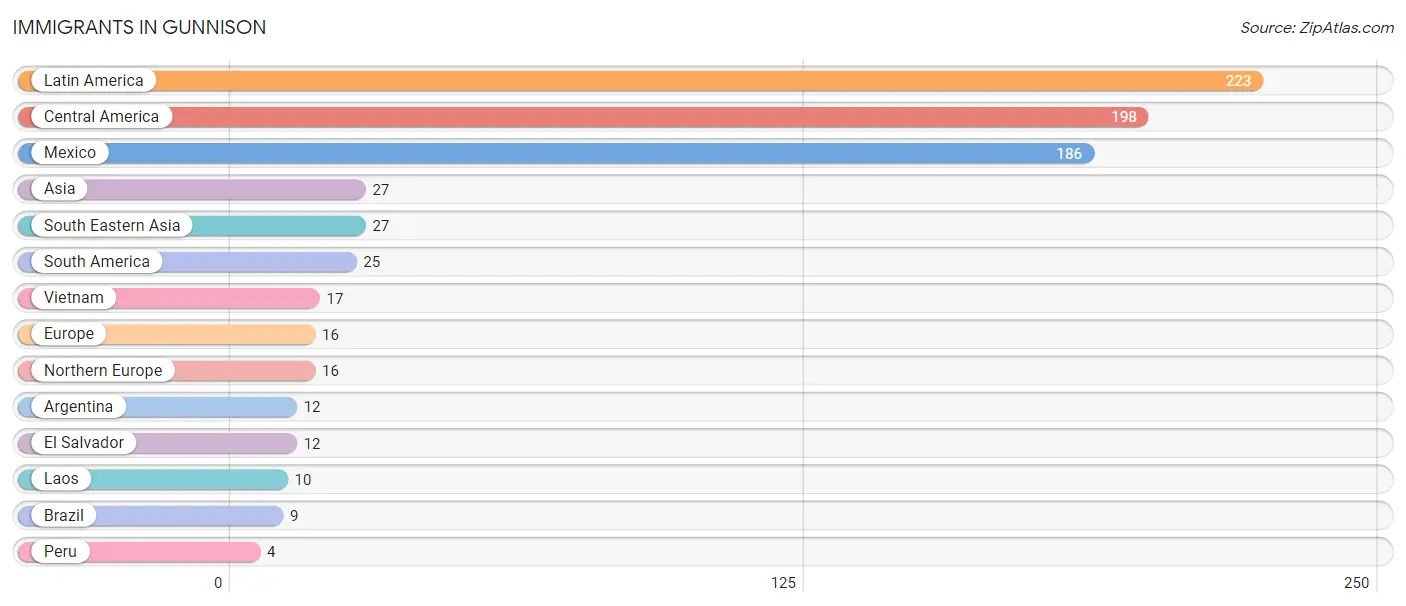
The most numerous immigrant groups reported in Gunnison came from Latin America (223 | 6.3%), Central America (198 | 5.6%), Mexico (186 | 5.3%), Asia (27 | 0.8%), and South Eastern Asia (27 | 0.8%), together accounting for 18.8% of all Gunnison residents.
| Immigration Origin | # Population | % Population |
| Argentina | 12 | 0.3% |
| Asia | 27 | 0.8% |
| Brazil | 9 | 0.3% |
| Central America | 198 | 5.6% |
| El Salvador | 12 | 0.3% |
| Europe | 16 | 0.5% |
| Laos | 10 | 0.3% |
| Latin America | 223 | 6.3% |
| Mexico | 186 | 5.3% |
| Northern Europe | 16 | 0.5% |
| Peru | 4 | 0.1% |
| South America | 25 | 0.7% |
| South Eastern Asia | 27 | 0.8% |
| Vietnam | 17 | 0.5% | View All 14 Rows |
Sex and Age in Gunnison
Sex and Age in Gunnison
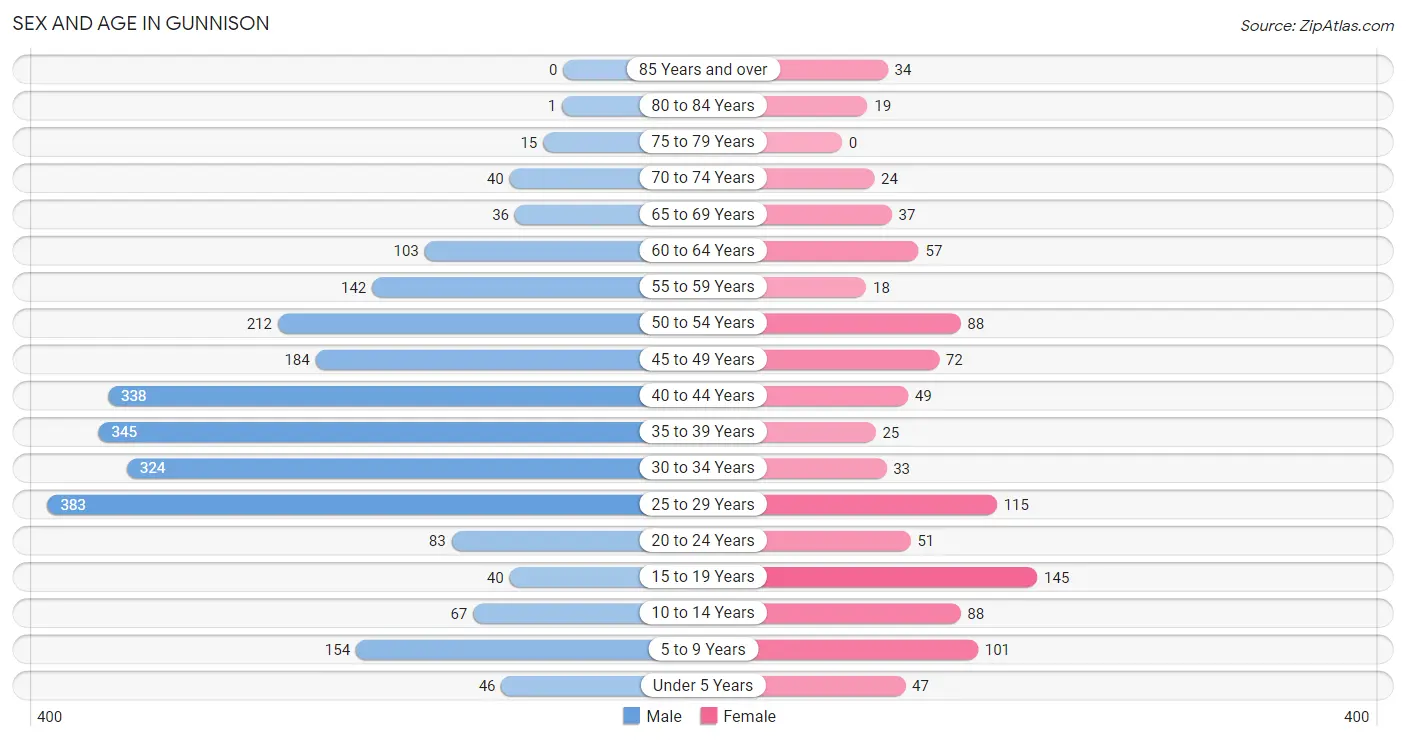
The most populous age groups in Gunnison are 25 to 29 Years (383 | 15.2%) for men and 15 to 19 Years (145 | 14.5%) for women.
| Age Bracket | Male | Female |
| Under 5 Years | 46 (1.8%) | 47 (4.7%) |
| 5 to 9 Years | 154 (6.1%) | 101 (10.1%) |
| 10 to 14 Years | 67 (2.7%) | 88 (8.8%) |
| 15 to 19 Years | 40 (1.6%) | 145 (14.5%) |
| 20 to 24 Years | 83 (3.3%) | 51 (5.1%) |
| 25 to 29 Years | 383 (15.2%) | 115 (11.5%) |
| 30 to 34 Years | 324 (12.9%) | 33 (3.3%) |
| 35 to 39 Years | 345 (13.7%) | 25 (2.5%) |
| 40 to 44 Years | 338 (13.5%) | 49 (4.9%) |
| 45 to 49 Years | 184 (7.3%) | 72 (7.2%) |
| 50 to 54 Years | 212 (8.4%) | 88 (8.8%) |
| 55 to 59 Years | 142 (5.7%) | 18 (1.8%) |
| 60 to 64 Years | 103 (4.1%) | 57 (5.7%) |
| 65 to 69 Years | 36 (1.4%) | 37 (3.7%) |
| 70 to 74 Years | 40 (1.6%) | 24 (2.4%) |
| 75 to 79 Years | 15 (0.6%) | 0 (0.0%) |
| 80 to 84 Years | 1 (0.0%) | 19 (1.9%) |
| 85 Years and over | 0 (0.0%) | 34 (3.4%) |
| Total | 2,513 (100.0%) | 1,003 (100.0%) |
Families and Households in Gunnison
Median Family Size in Gunnison
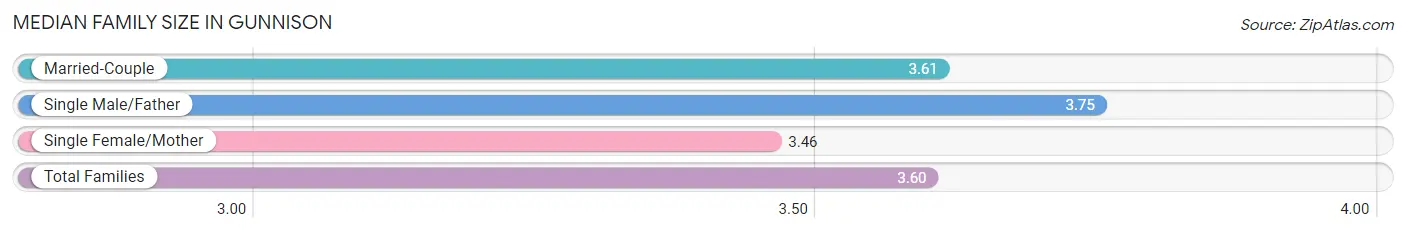
The median family size in Gunnison is 3.60 persons per family, with single male/father families (20 | 4.5%) accounting for the largest median family size of 3.75 persons per family. On the other hand, single female/mother families (59 | 13.2%) represent the smallest median family size with 3.46 persons per family.
| Family Type | # Families | Family Size |
| Married-Couple | 367 (82.3%) | 3.61 |
| Single Male/Father | 20 (4.5%) | 3.75 |
| Single Female/Mother | 59 (13.2%) | 3.46 |
| Total Families | 446 (100.0%) | 3.60 |
Median Household Size in Gunnison
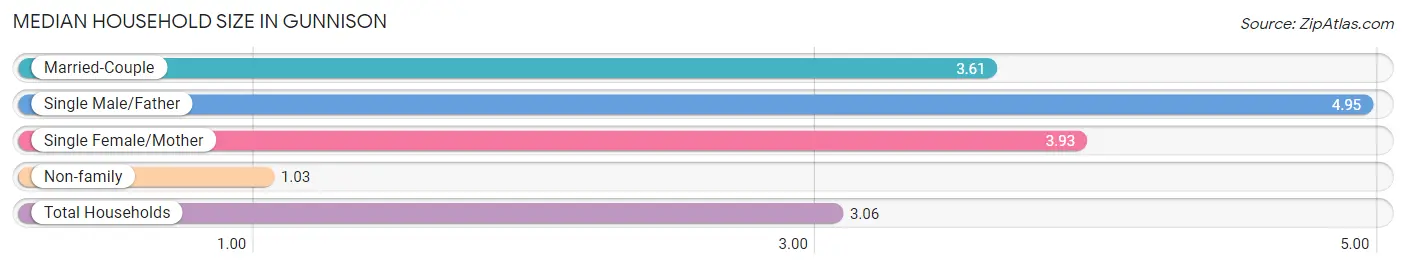
The median household size in Gunnison is 3.06 persons per household, with single male/father households (20 | 3.4%) accounting for the largest median household size of 4.95 persons per household. non-family households (145 | 24.5%) represent the smallest median household size with 1.03 persons per household.
| Household Type | # Households | Household Size |
| Married-Couple | 367 (62.1%) | 3.61 |
| Single Male/Father | 20 (3.4%) | 4.95 |
| Single Female/Mother | 59 (10.0%) | 3.93 |
| Non-family | 145 (24.5%) | 1.03 |
| Total Households | 591 (100.0%) | 3.06 |
Household Size by Marriage Status in Gunnison
Out of a total of 591 households in Gunnison, 446 (75.5%) are family households, while 145 (24.5%) are nonfamily households. The most numerous type of family households are 3-person households, comprising 130, and the most common type of nonfamily households are 1-person households, comprising 137.
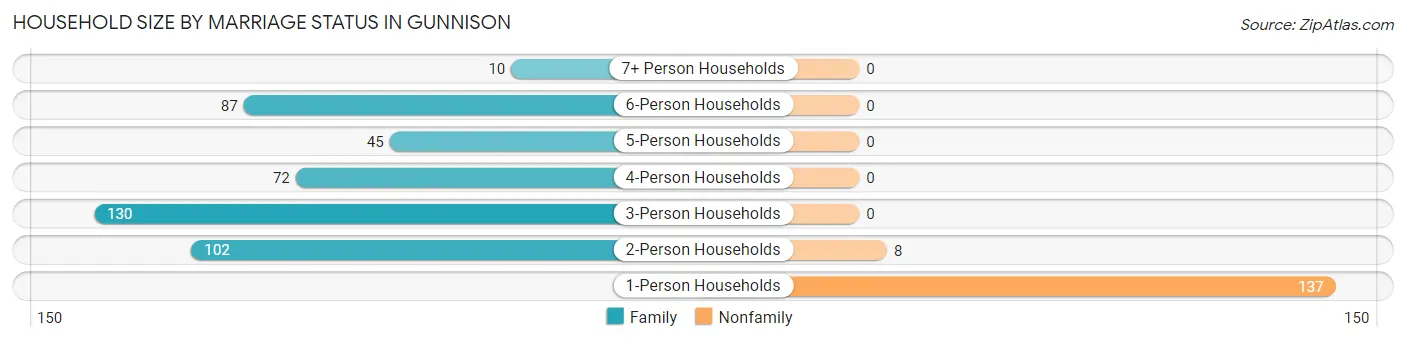
| Household Size | Family Households | Nonfamily Households |
| 1-Person Households | - | 137 (23.2%) |
| 2-Person Households | 102 (17.3%) | 8 (1.3%) |
| 3-Person Households | 130 (22.0%) | 0 (0.0%) |
| 4-Person Households | 72 (12.2%) | 0 (0.0%) |
| 5-Person Households | 45 (7.6%) | 0 (0.0%) |
| 6-Person Households | 87 (14.7%) | 0 (0.0%) |
| 7+ Person Households | 10 (1.7%) | 0 (0.0%) |
| Total | 446 (75.5%) | 145 (24.5%) |
Female Fertility in Gunnison
Fertility by Age in Gunnison
Average fertility rate in Gunnison is 63.0 births per 1,000 women. Women in the age bracket of 20 to 34 years have the highest fertility rate with 161.0 births per 1,000 women. Women in the age bracket of 20 to 34 years acount for 100.0% of all women with births.
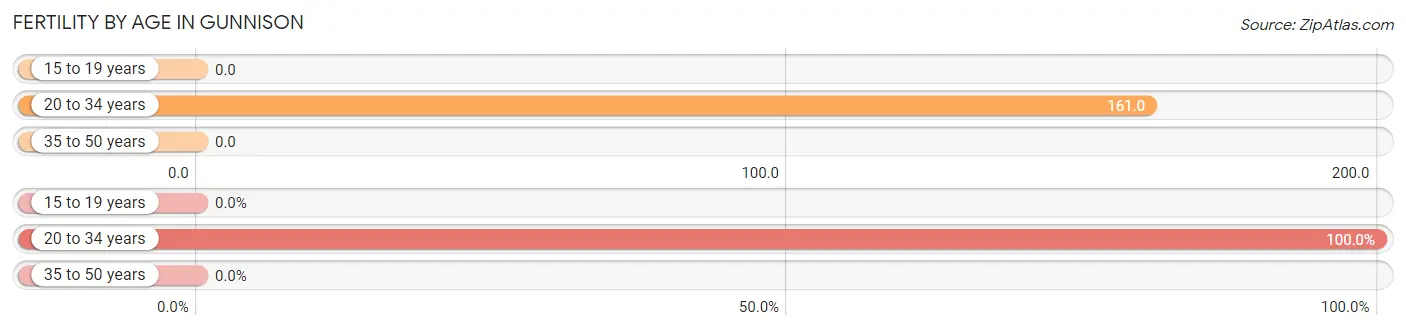
| Age Bracket | Women with Births | Births / 1,000 Women |
| 15 to 19 years | 0 (0.0%) | 0.0 |
| 20 to 34 years | 32 (100.0%) | 161.0 |
| 35 to 50 years | 0 (0.0%) | 0.0 |
| Total | 32 (100.0%) | 63.0 |
Fertility by Age by Marriage Status in Gunnison
43.8% of women with births (32) in Gunnison are married. The highest percentage of unmarried women with births falls into 20 to 34 years age bracket with 56.2% of them unmarried at the time of birth, while the lowest percentage of unmarried women with births belong to 20 to 34 years age bracket with 56.2% of them unmarried.
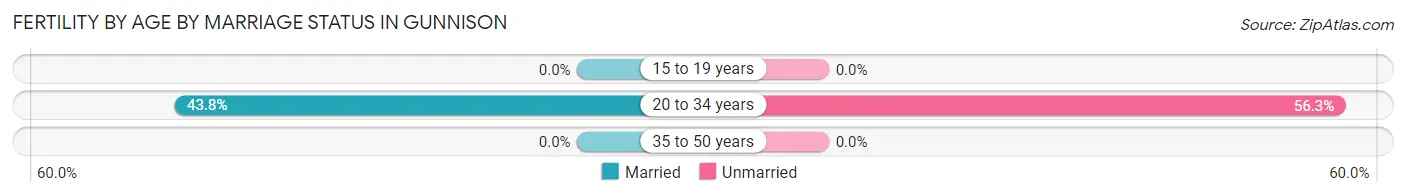
| Age Bracket | Married | Unmarried |
| 15 to 19 years | 0 (0.0%) | 0 (0.0%) |
| 20 to 34 years | 14 (43.8%) | 18 (56.2%) |
| 35 to 50 years | 0 (0.0%) | 0 (0.0%) |
| Total | 14 (43.8%) | 18 (56.2%) |
Fertility by Education in Gunnison
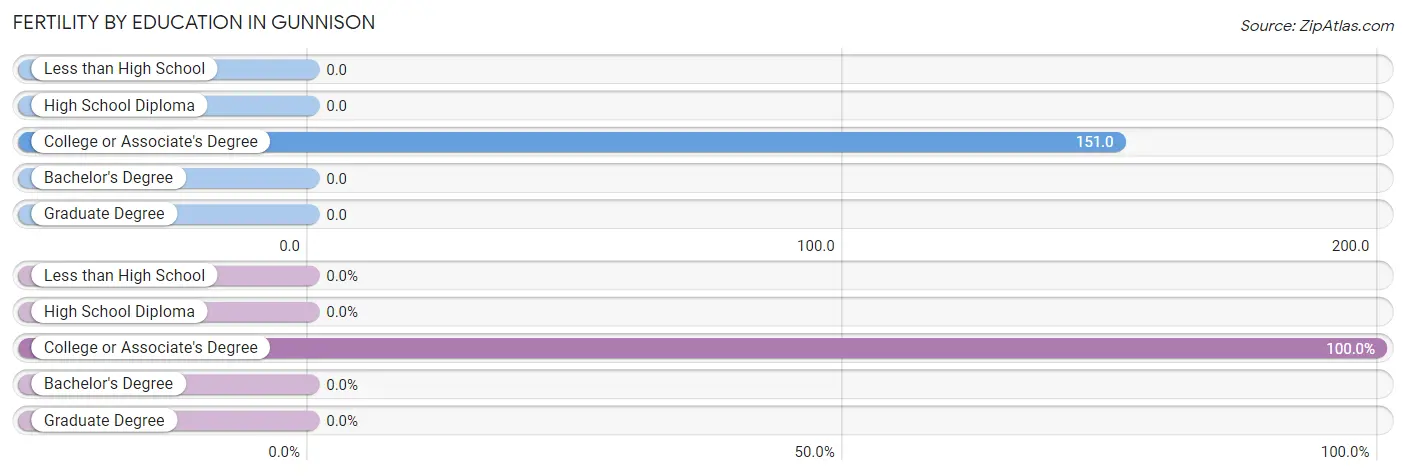
| Educational Attainment | Women with Births | Births / 1,000 Women |
| Less than High School | 0 (0.0%) | 0.0 |
| High School Diploma | 0 (0.0%) | 0.0 |
| College or Associate's Degree | 32 (100.0%) | 151.0 |
| Bachelor's Degree | 0 (0.0%) | 0.0 |
| Graduate Degree | 0 (0.0%) | 0.0 |
| Total | 32 (100.0%) | 63.0 |
Fertility by Education by Marriage Status in Gunnison
56.2% of women with births in Gunnison are unmarried. Women with the educational attainment of college or associate's degree are most likely to be married with 43.8% of them married at childbirth, while women with the educational attainment of college or associate's degree are least likely to be married with 56.2% of them unmarried at childbirth.
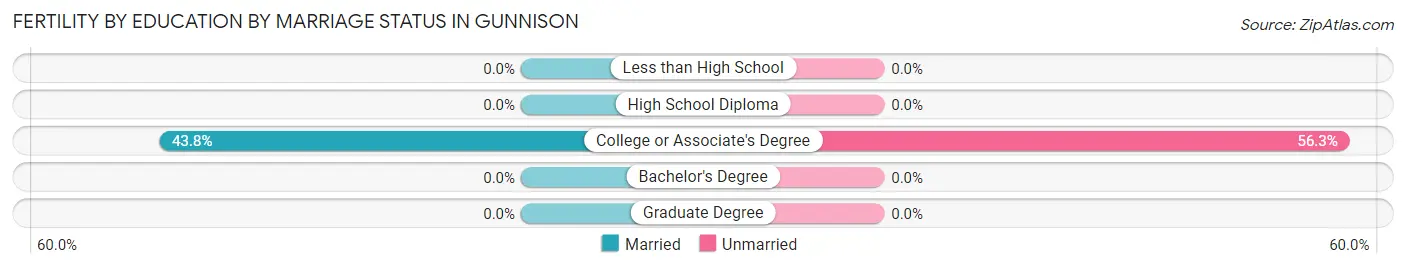
| Educational Attainment | Married | Unmarried |
| Less than High School | 0 (0.0%) | 0 (0.0%) |
| High School Diploma | 0 (0.0%) | 0 (0.0%) |
| College or Associate's Degree | 14 (43.8%) | 18 (56.2%) |
| Bachelor's Degree | 0 (0.0%) | 0 (0.0%) |
| Graduate Degree | 0 (0.0%) | 0 (0.0%) |
| Total | 14 (43.8%) | 18 (56.2%) |
Employment Characteristics in Gunnison
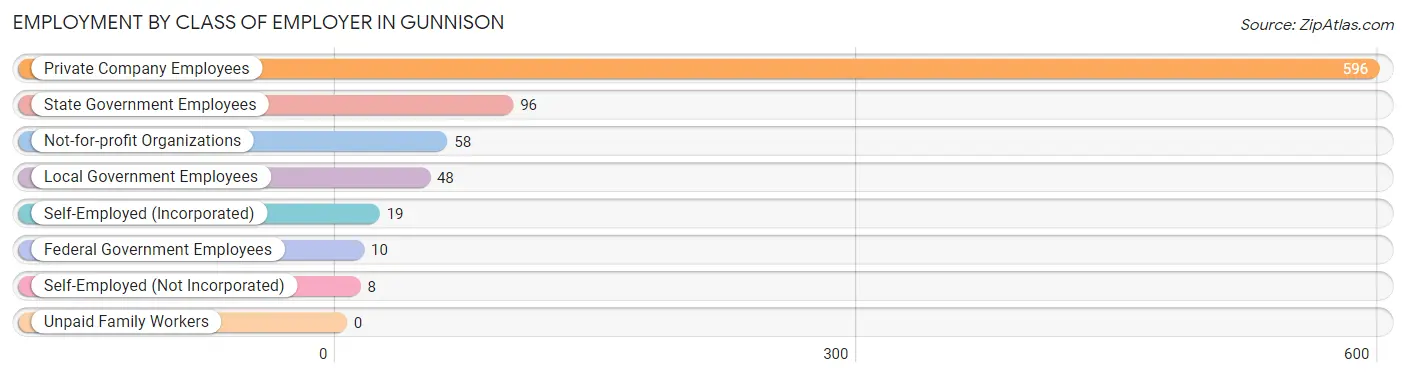
Employment by Class of Employer in Gunnison
Among the 835 employed individuals in Gunnison, private company employees (596 | 71.4%), state government employees (96 | 11.5%), and not-for-profit organizations (58 | 7.0%) make up the most common classes of employment.
| Employer Class | # Employees | % Employees |
| Private Company Employees | 596 | 71.4% |
| Self-Employed (Incorporated) | 19 | 2.3% |
| Self-Employed (Not Incorporated) | 8 | 1.0% |
| Not-for-profit Organizations | 58 | 7.0% |
| Local Government Employees | 48 | 5.8% |
| State Government Employees | 96 | 11.5% |
| Federal Government Employees | 10 | 1.2% |
| Unpaid Family Workers | 0 | 0.0% |
| Total | 835 | 100.0% |
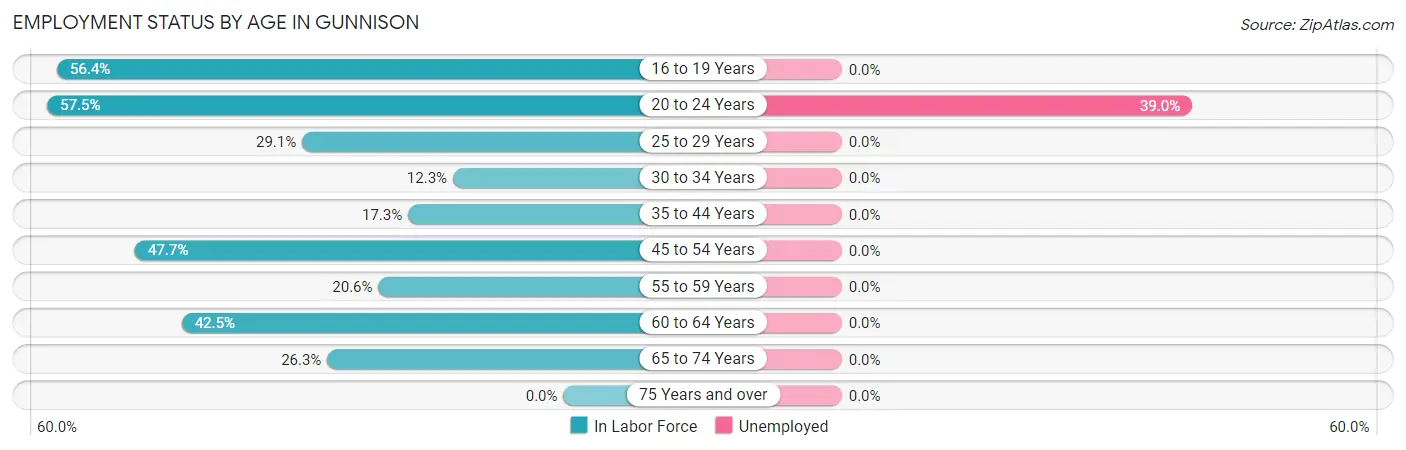
Employment Status by Age in Gunnison
According to the labor force statistics for Gunnison, out of the total population over 16 years of age (2,977), 29.7% or 884 individuals are in the labor force, with 3.4% or 30 of them unemployed. The age group with the highest labor force participation rate is 20 to 24 years, with 57.5% or 77 individuals in the labor force. Within the labor force, the 20 to 24 years age range has the highest percentage of unemployed individuals, with 39.0% or 30 of them being unemployed.
| Age Bracket | In Labor Force | Unemployed |
| 16 to 19 Years | 84 (56.4%) | 0 (0.0%) |
| 20 to 24 Years | 77 (57.5%) | 30 (39.0%) |
| 25 to 29 Years | 145 (29.1%) | 0 (0.0%) |
| 30 to 34 Years | 44 (12.3%) | 0 (0.0%) |
| 35 to 44 Years | 131 (17.3%) | 0 (0.0%) |
| 45 to 54 Years | 265 (47.7%) | 0 (0.0%) |
| 55 to 59 Years | 33 (20.6%) | 0 (0.0%) |
| 60 to 64 Years | 68 (42.5%) | 0 (0.0%) |
| 65 to 74 Years | 36 (26.3%) | 0 (0.0%) |
| 75 Years and over | 0 (0.0%) | 0 (0.0%) |
| Total | 884 (29.7%) | 30 (3.4%) |
Employment Status by Educational Attainment in Gunnison
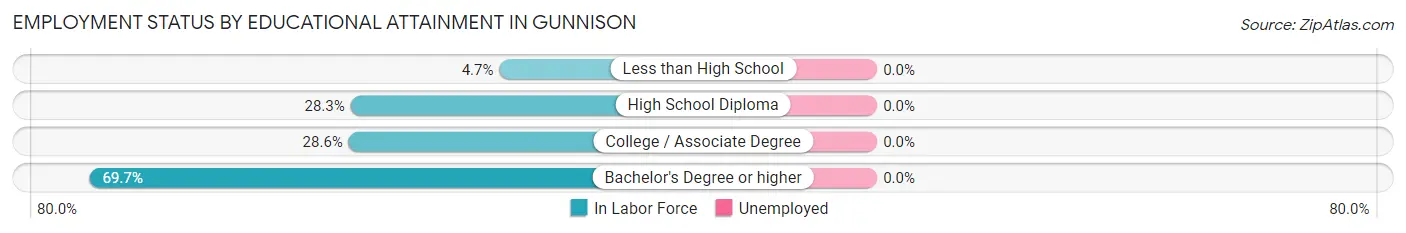
| Educational Attainment | In Labor Force | Unemployed |
| Less than High School | 16 (4.7%) | 0 (0.0%) |
| High School Diploma | 288 (28.3%) | 0 (0.0%) |
| College / Associate Degree | 283 (28.6%) | 0 (0.0%) |
| Bachelor's Degree or higher | 99 (69.7%) | 0 (0.0%) |
| Total | 687 (27.6%) | 0 (0.0%) |
Employment Occupations by Sex in Gunnison
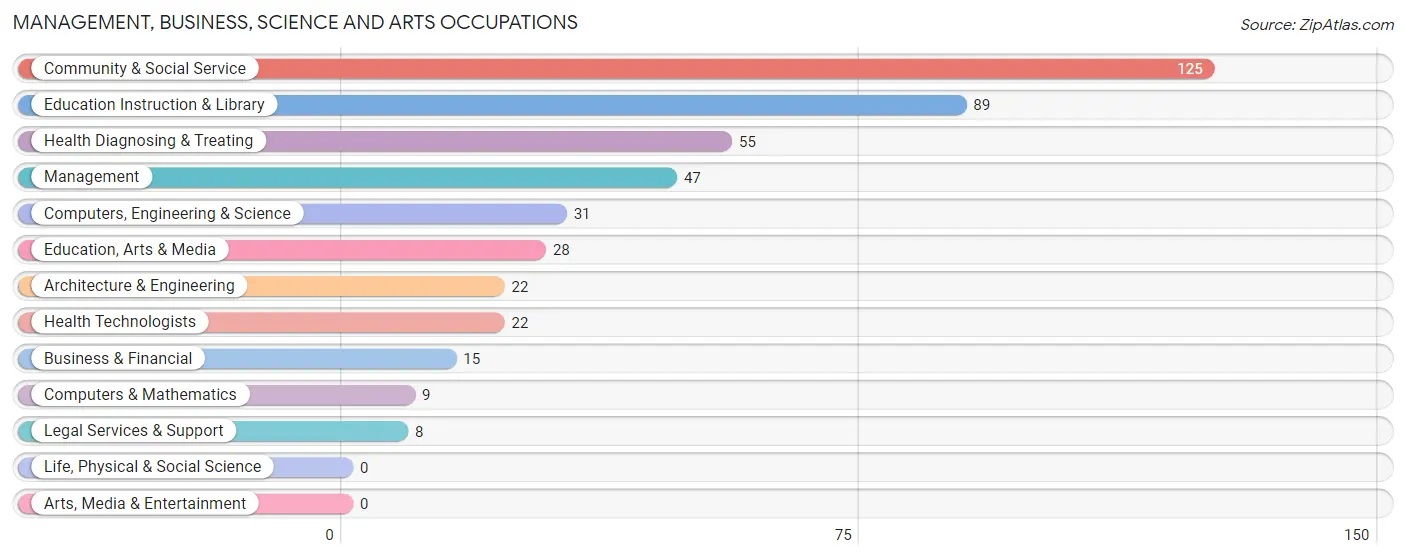
Management, Business, Science and Arts Occupations
The most common Management, Business, Science and Arts occupations in Gunnison are Community & Social Service (125 | 14.6%), Education Instruction & Library (89 | 10.4%), Health Diagnosing & Treating (55 | 6.5%), Management (47 | 5.5%), and Computers, Engineering & Science (31 | 3.6%).
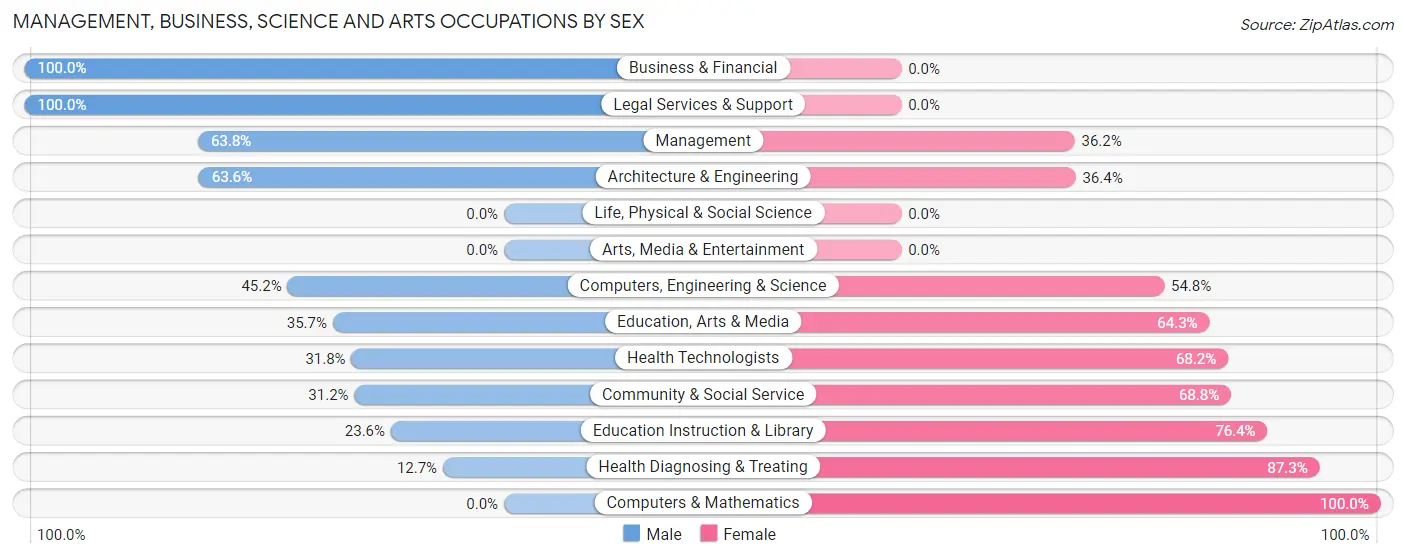
Management, Business, Science and Arts Occupations by Sex
Within the Management, Business, Science and Arts occupations in Gunnison, the most male-oriented occupations are Business & Financial (100.0%), Legal Services & Support (100.0%), and Management (63.8%), while the most female-oriented occupations are Computers & Mathematics (100.0%), Health Diagnosing & Treating (87.3%), and Education Instruction & Library (76.4%).
| Occupation | Male | Female |
| Management | 30 (63.8%) | 17 (36.2%) |
| Business & Financial | 15 (100.0%) | 0 (0.0%) |
| Computers, Engineering & Science | 14 (45.2%) | 17 (54.8%) |
| Computers & Mathematics | 0 (0.0%) | 9 (100.0%) |
| Architecture & Engineering | 14 (63.6%) | 8 (36.4%) |
| Life, Physical & Social Science | 0 (0.0%) | 0 (0.0%) |
| Community & Social Service | 39 (31.2%) | 86 (68.8%) |
| Education, Arts & Media | 10 (35.7%) | 18 (64.3%) |
| Legal Services & Support | 8 (100.0%) | 0 (0.0%) |
| Education Instruction & Library | 21 (23.6%) | 68 (76.4%) |
| Arts, Media & Entertainment | 0 (0.0%) | 0 (0.0%) |
| Health Diagnosing & Treating | 7 (12.7%) | 48 (87.3%) |
| Health Technologists | 7 (31.8%) | 15 (68.2%) |
| Total (Category) | 105 (38.5%) | 168 (61.5%) |
| Total (Overall) | 402 (47.1%) | 451 (52.9%) |
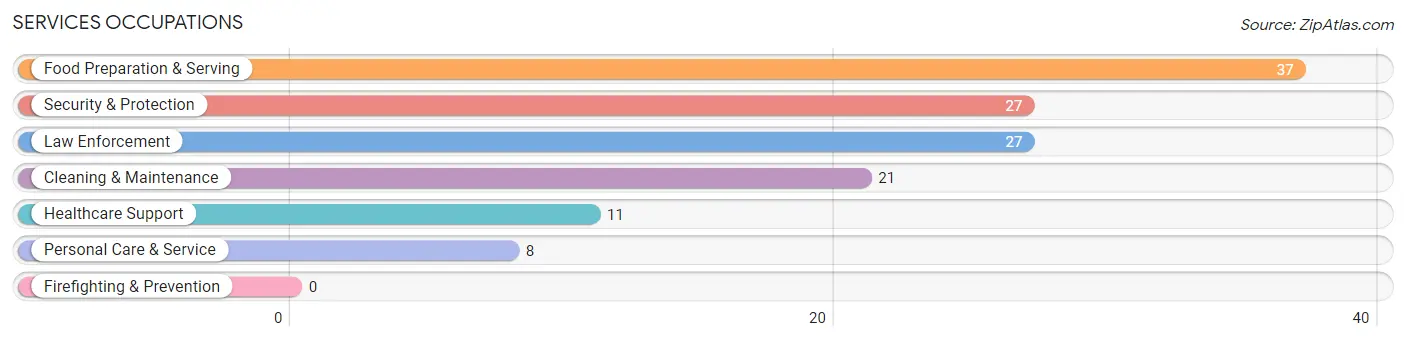
Services Occupations
The most common Services occupations in Gunnison are Food Preparation & Serving (37 | 4.3%), Security & Protection (27 | 3.2%), Law Enforcement (27 | 3.2%), Cleaning & Maintenance (21 | 2.5%), and Healthcare Support (11 | 1.3%).
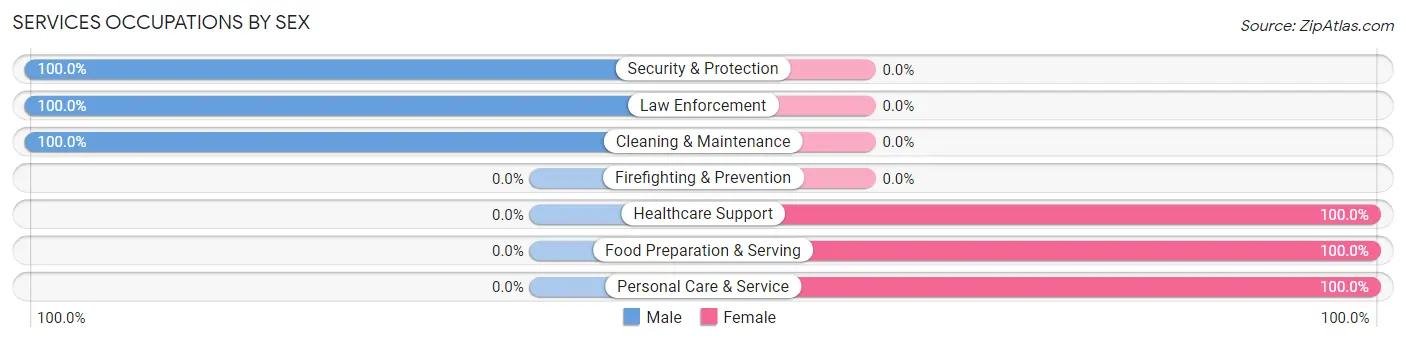
Services Occupations by Sex
Within the Services occupations in Gunnison, the most male-oriented occupations are Security & Protection (100.0%), Law Enforcement (100.0%), and Cleaning & Maintenance (100.0%), while the most female-oriented occupations are Healthcare Support (100.0%), Food Preparation & Serving (100.0%), and Personal Care & Service (100.0%).
| Occupation | Male | Female |
| Healthcare Support | 0 (0.0%) | 11 (100.0%) |
| Security & Protection | 27 (100.0%) | 0 (0.0%) |
| Firefighting & Prevention | 0 (0.0%) | 0 (0.0%) |
| Law Enforcement | 27 (100.0%) | 0 (0.0%) |
| Food Preparation & Serving | 0 (0.0%) | 37 (100.0%) |
| Cleaning & Maintenance | 21 (100.0%) | 0 (0.0%) |
| Personal Care & Service | 0 (0.0%) | 8 (100.0%) |
| Total (Category) | 48 (46.2%) | 56 (53.8%) |
| Total (Overall) | 402 (47.1%) | 451 (52.9%) |
Sales and Office Occupations
The most common Sales and Office occupations in Gunnison are Office & Administration (131 | 15.4%), and Sales & Related (116 | 13.6%).
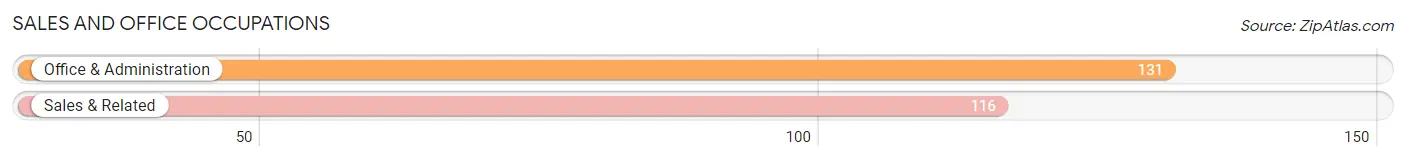
Sales and Office Occupations by Sex
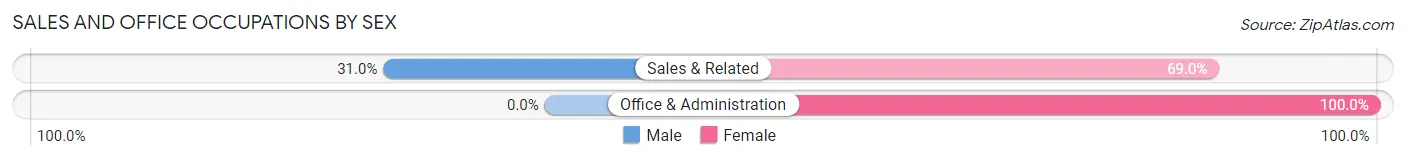
| Occupation | Male | Female |
| Sales & Related | 36 (31.0%) | 80 (69.0%) |
| Office & Administration | 0 (0.0%) | 131 (100.0%) |
| Total (Category) | 36 (14.6%) | 211 (85.4%) |
| Total (Overall) | 402 (47.1%) | 451 (52.9%) |
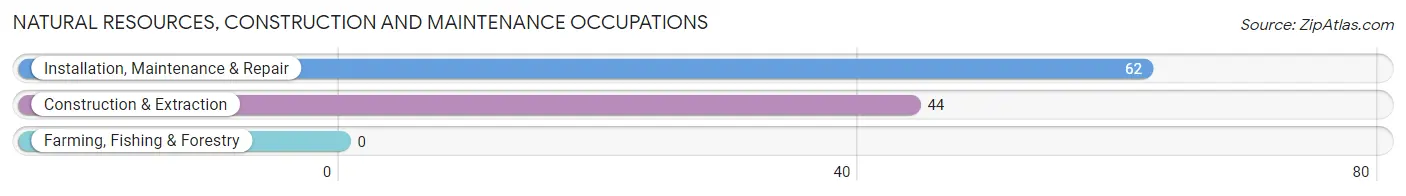
Natural Resources, Construction and Maintenance Occupations
The most common Natural Resources, Construction and Maintenance occupations in Gunnison are Installation, Maintenance & Repair (62 | 7.3%), and Construction & Extraction (44 | 5.2%).
Natural Resources, Construction and Maintenance Occupations by Sex
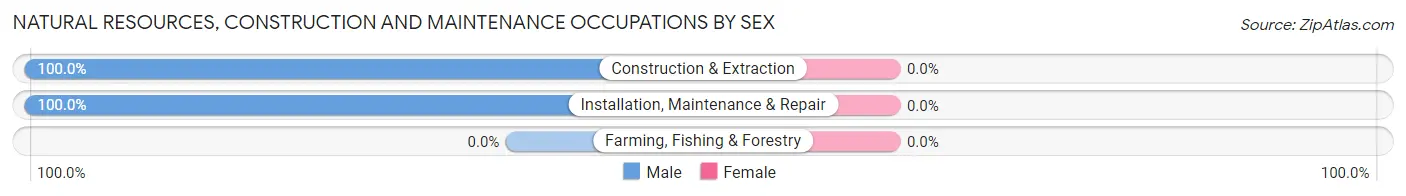
| Occupation | Male | Female |
| Farming, Fishing & Forestry | 0 (0.0%) | 0 (0.0%) |
| Construction & Extraction | 44 (100.0%) | 0 (0.0%) |
| Installation, Maintenance & Repair | 62 (100.0%) | 0 (0.0%) |
| Total (Category) | 106 (100.0%) | 0 (0.0%) |
| Total (Overall) | 402 (47.1%) | 451 (52.9%) |
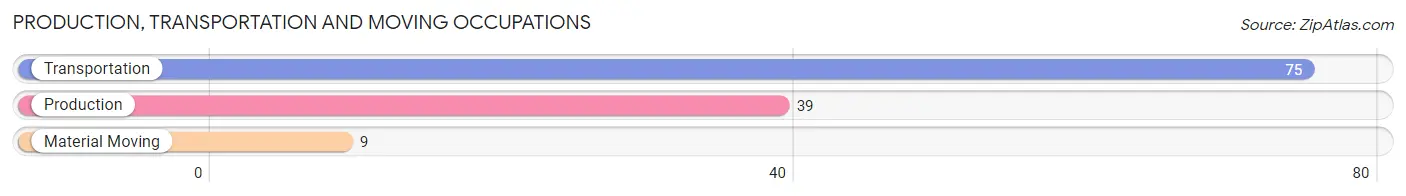
Production, Transportation and Moving Occupations
The most common Production, Transportation and Moving occupations in Gunnison are Transportation (75 | 8.8%), Production (39 | 4.6%), and Material Moving (9 | 1.1%).
Production, Transportation and Moving Occupations by Sex
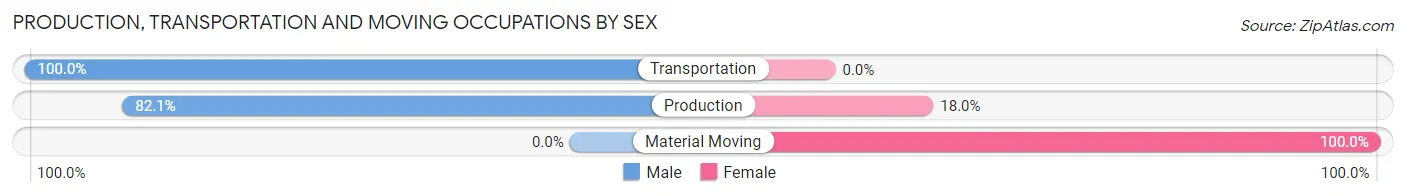
| Occupation | Male | Female |
| Production | 32 (82.1%) | 7 (17.9%) |
| Transportation | 75 (100.0%) | 0 (0.0%) |
| Material Moving | 0 (0.0%) | 9 (100.0%) |
| Total (Category) | 107 (87.0%) | 16 (13.0%) |
| Total (Overall) | 402 (47.1%) | 451 (52.9%) |
Employment Industries by Sex in Gunnison
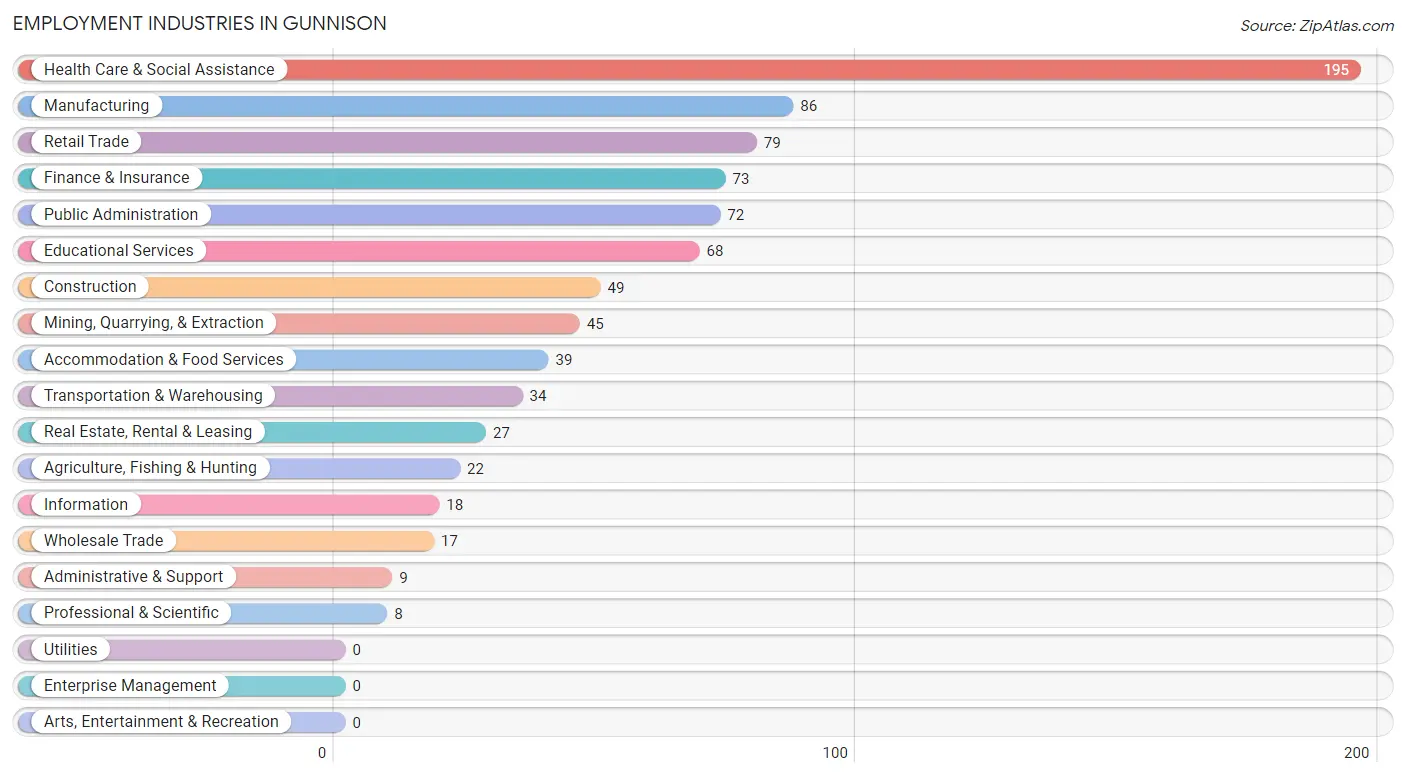
Employment Industries in Gunnison
The major employment industries in Gunnison include Health Care & Social Assistance (195 | 22.9%), Manufacturing (86 | 10.1%), Retail Trade (79 | 9.3%), Finance & Insurance (73 | 8.6%), and Public Administration (72 | 8.4%).
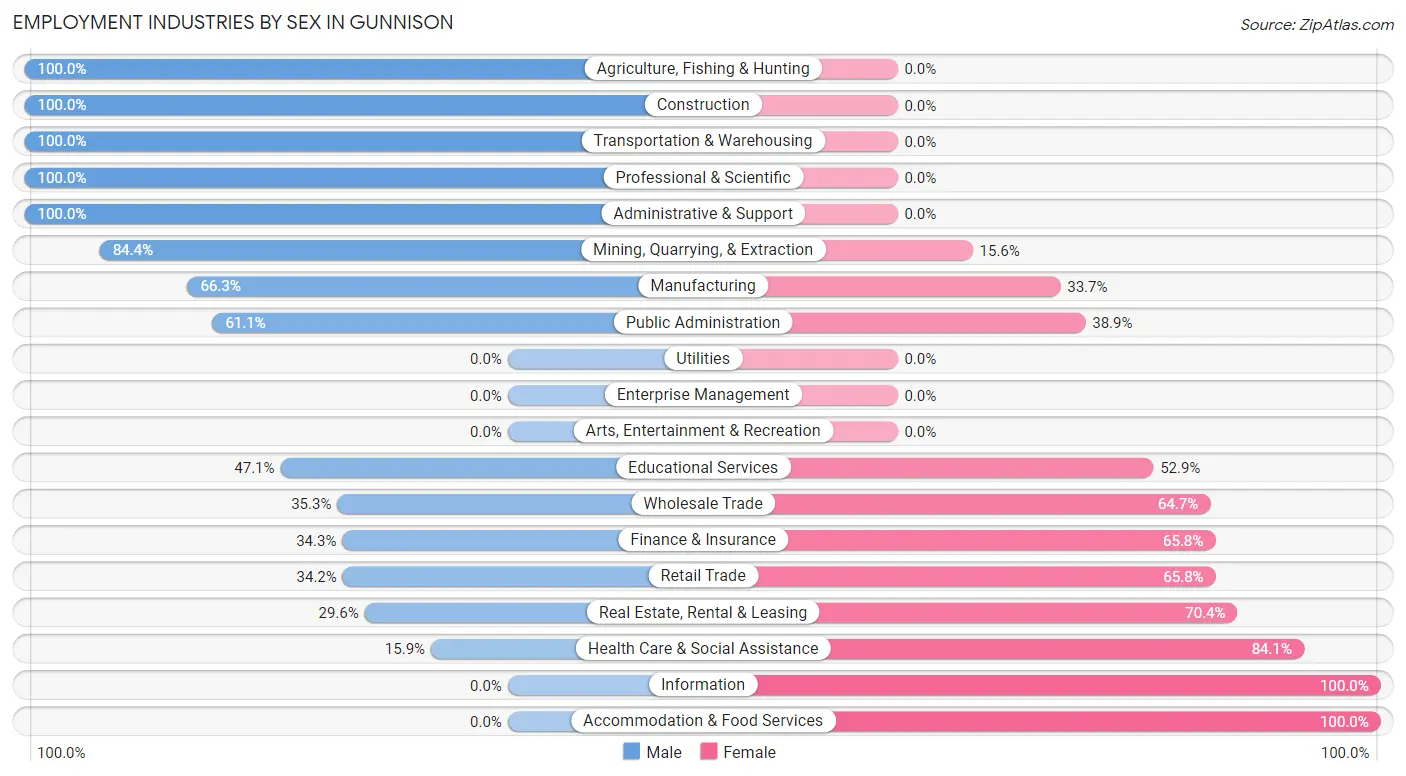
Employment Industries by Sex in Gunnison
The Gunnison industries that see more men than women are Agriculture, Fishing & Hunting (100.0%), Construction (100.0%), and Transportation & Warehousing (100.0%), whereas the industries that tend to have a higher number of women are Information (100.0%), Accommodation & Food Services (100.0%), and Health Care & Social Assistance (84.1%).
| Industry | Male | Female |
| Agriculture, Fishing & Hunting | 22 (100.0%) | 0 (0.0%) |
| Mining, Quarrying, & Extraction | 38 (84.4%) | 7 (15.6%) |
| Construction | 49 (100.0%) | 0 (0.0%) |
| Manufacturing | 57 (66.3%) | 29 (33.7%) |
| Wholesale Trade | 6 (35.3%) | 11 (64.7%) |
| Retail Trade | 27 (34.2%) | 52 (65.8%) |
| Transportation & Warehousing | 34 (100.0%) | 0 (0.0%) |
| Utilities | 0 (0.0%) | 0 (0.0%) |
| Information | 0 (0.0%) | 18 (100.0%) |
| Finance & Insurance | 25 (34.3%) | 48 (65.7%) |
| Real Estate, Rental & Leasing | 8 (29.6%) | 19 (70.4%) |
| Professional & Scientific | 8 (100.0%) | 0 (0.0%) |
| Enterprise Management | 0 (0.0%) | 0 (0.0%) |
| Administrative & Support | 9 (100.0%) | 0 (0.0%) |
| Educational Services | 32 (47.1%) | 36 (52.9%) |
| Health Care & Social Assistance | 31 (15.9%) | 164 (84.1%) |
| Arts, Entertainment & Recreation | 0 (0.0%) | 0 (0.0%) |
| Accommodation & Food Services | 0 (0.0%) | 39 (100.0%) |
| Public Administration | 44 (61.1%) | 28 (38.9%) |
| Total | 402 (47.1%) | 451 (52.9%) |
Education in Gunnison
School Enrollment in Gunnison
The most common levels of schooling among the 844 students in Gunnison are college / undergraduate (261 | 30.9%), high school (176 | 20.8%), and middle school (148 | 17.5%).
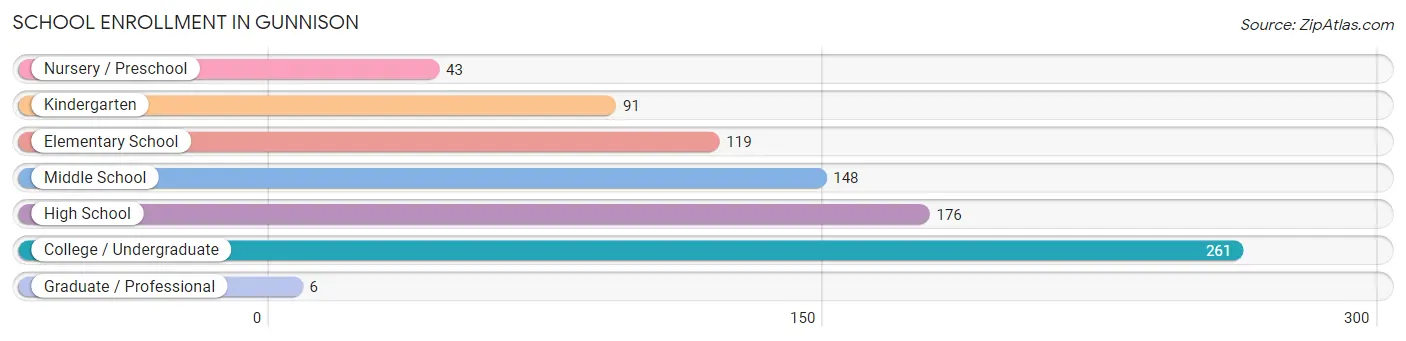
| School Level | # Students | % Students |
| Nursery / Preschool | 43 | 5.1% |
| Kindergarten | 91 | 10.8% |
| Elementary School | 119 | 14.1% |
| Middle School | 148 | 17.5% |
| High School | 176 | 20.8% |
| College / Undergraduate | 261 | 30.9% |
| Graduate / Professional | 6 | 0.7% |
| Total | 844 | 100.0% |
School Enrollment by Age by Funding Source in Gunnison
Out of a total of 844 students who are enrolled in schools in Gunnison, 13 (1.5%) attend a private institution, while the remaining 831 (98.5%) are enrolled in public schools. The age group of 35 years and over has the highest likelihood of being enrolled in private schools, with 13 (13.4% in the age bracket) enrolled. Conversely, the age group of 5 to 9 year old has the lowest likelihood of being enrolled in a private school, with 246 (100.0% in the age bracket) attending a public institution.
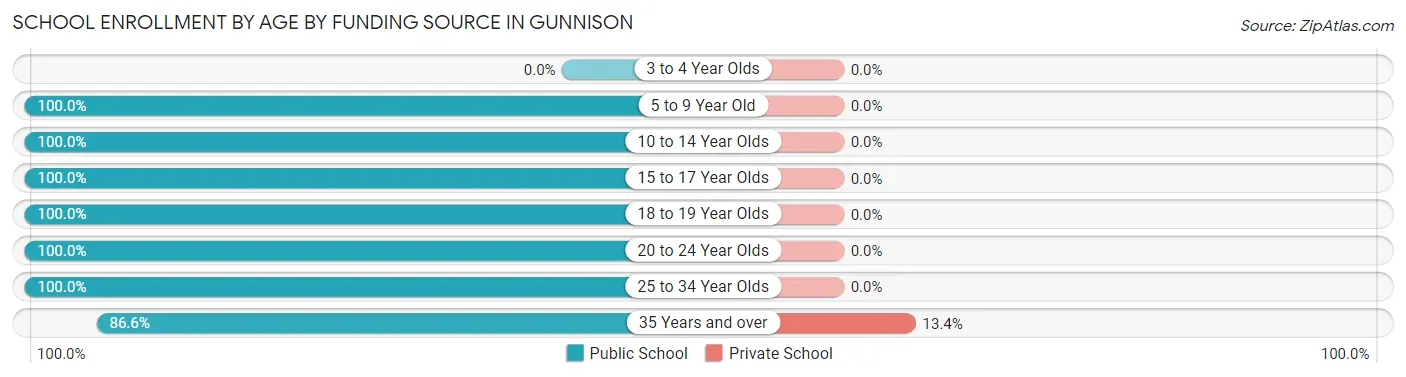
| Age Bracket | Public School | Private School |
| 3 to 4 Year Olds | 0 (0.0%) | 0 (0.0%) |
| 5 to 9 Year Old | 246 (100.0%) | 0 (0.0%) |
| 10 to 14 Year Olds | 155 (100.0%) | 0 (0.0%) |
| 15 to 17 Year Olds | 116 (100.0%) | 0 (0.0%) |
| 18 to 19 Year Olds | 57 (100.0%) | 0 (0.0%) |
| 20 to 24 Year Olds | 53 (100.0%) | 0 (0.0%) |
| 25 to 34 Year Olds | 120 (100.0%) | 0 (0.0%) |
| 35 Years and over | 84 (86.6%) | 13 (13.4%) |
| Total | 831 (98.5%) | 13 (1.5%) |
Educational Attainment by Field of Study in Gunnison
Business (53 | 26.4%), education (53 | 26.4%), bio, nature & agricultural (34 | 16.9%), social sciences (15 | 7.5%), and engineering (14 | 7.0%) are the most common fields of study among 201 individuals in Gunnison who have obtained a bachelor's degree or higher.
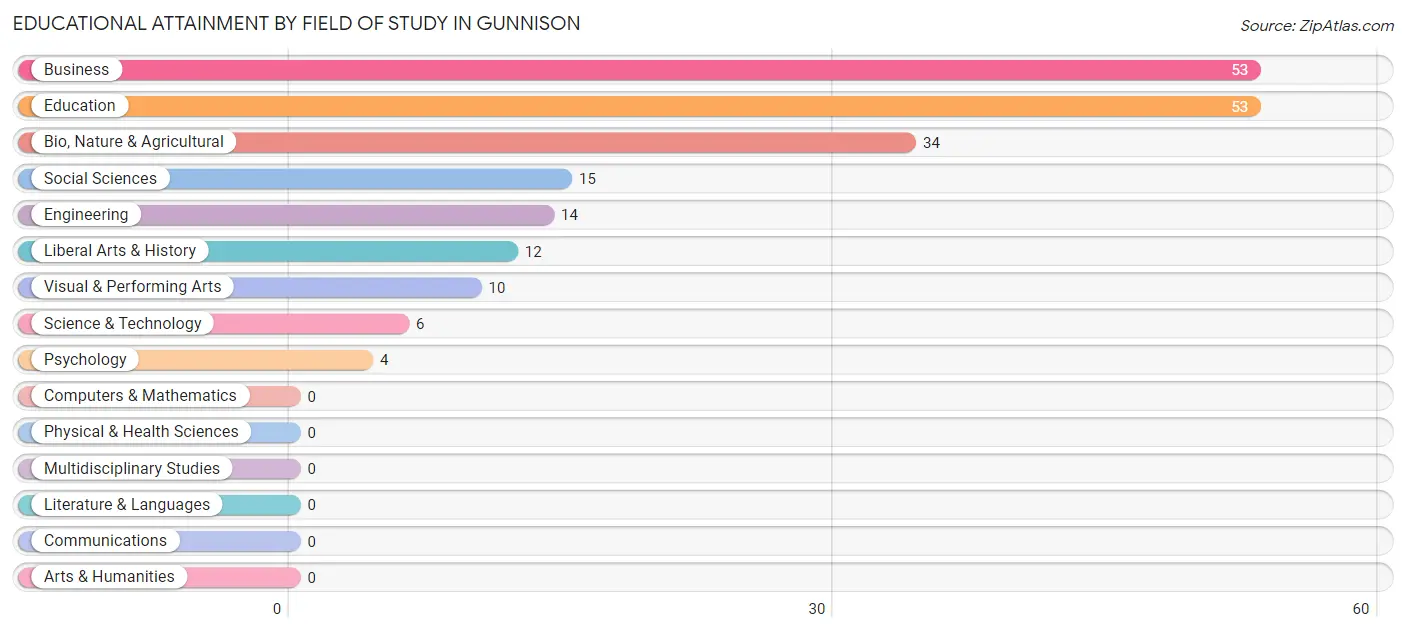
| Field of Study | # Graduates | % Graduates |
| Computers & Mathematics | 0 | 0.0% |
| Bio, Nature & Agricultural | 34 | 16.9% |
| Physical & Health Sciences | 0 | 0.0% |
| Psychology | 4 | 2.0% |
| Social Sciences | 15 | 7.5% |
| Engineering | 14 | 7.0% |
| Multidisciplinary Studies | 0 | 0.0% |
| Science & Technology | 6 | 3.0% |
| Business | 53 | 26.4% |
| Education | 53 | 26.4% |
| Literature & Languages | 0 | 0.0% |
| Liberal Arts & History | 12 | 6.0% |
| Visual & Performing Arts | 10 | 5.0% |
| Communications | 0 | 0.0% |
| Arts & Humanities | 0 | 0.0% |
| Total | 201 | 100.0% |
Transportation & Commute in Gunnison
Vehicle Availability by Sex in Gunnison
The most prevalent vehicle ownership categories in Gunnison are males with 2 vehicles (128, accounting for 32.4%) and females with 2 vehicles (130, making up 29.1%).
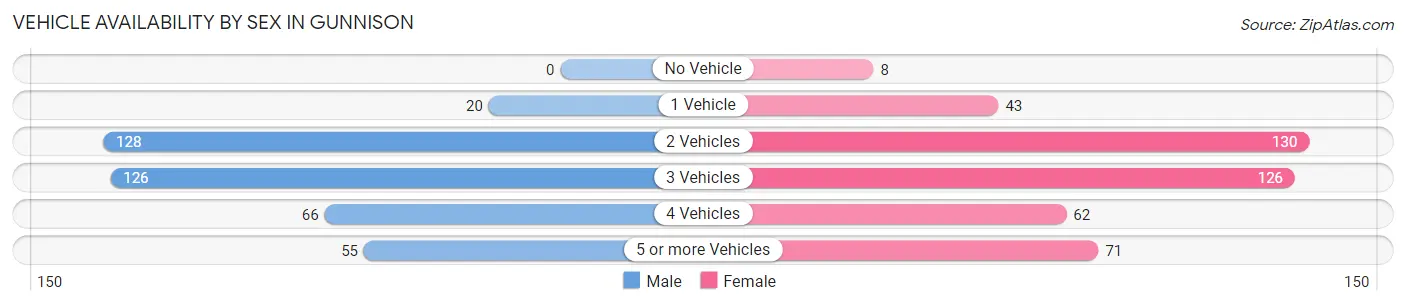
| Vehicles Available | Male | Female |
| No Vehicle | 0 (0.0%) | 8 (1.8%) |
| 1 Vehicle | 20 (5.1%) | 43 (9.8%) |
| 2 Vehicles | 128 (32.4%) | 130 (29.5%) |
| 3 Vehicles | 126 (31.9%) | 126 (28.6%) |
| 4 Vehicles | 66 (16.7%) | 62 (14.1%) |
| 5 or more Vehicles | 55 (13.9%) | 71 (16.1%) |
| Total | 395 (100.0%) | 440 (100.0%) |
Commute Time in Gunnison
The most frequently occuring commute durations in Gunnison are less than 5 minutes (276 commuters, 34.0%), 5 to 9 minutes (182 commuters, 22.4%), and 15 to 19 minutes (103 commuters, 12.7%).
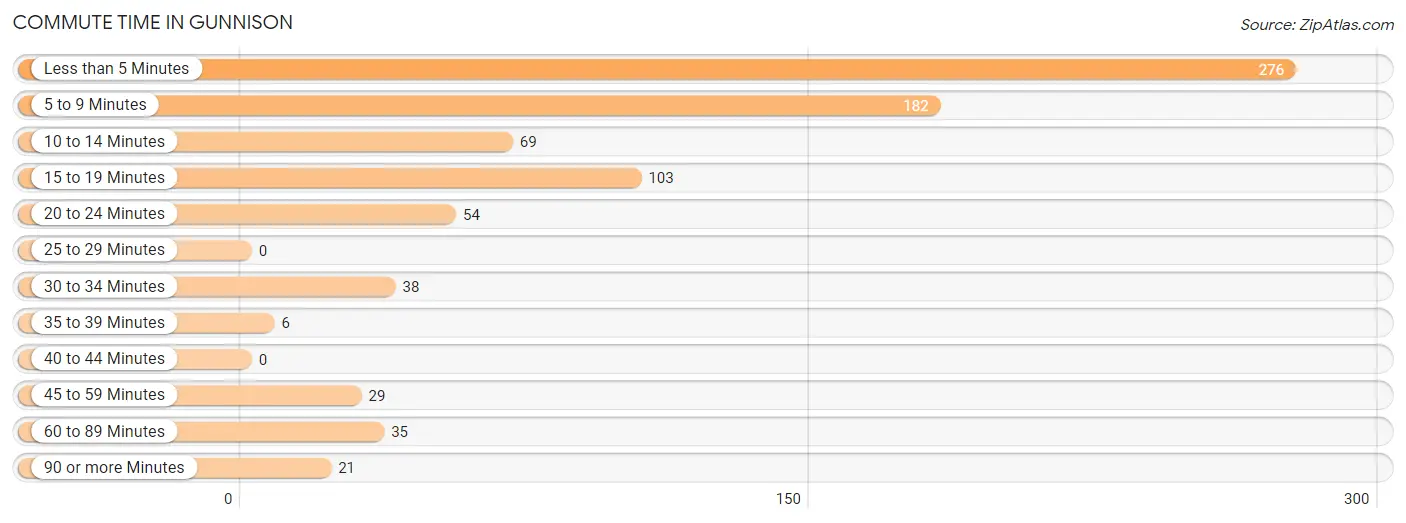
| Commute Time | # Commuters | % Commuters |
| Less than 5 Minutes | 276 | 34.0% |
| 5 to 9 Minutes | 182 | 22.4% |
| 10 to 14 Minutes | 69 | 8.5% |
| 15 to 19 Minutes | 103 | 12.7% |
| 20 to 24 Minutes | 54 | 6.6% |
| 25 to 29 Minutes | 0 | 0.0% |
| 30 to 34 Minutes | 38 | 4.7% |
| 35 to 39 Minutes | 6 | 0.7% |
| 40 to 44 Minutes | 0 | 0.0% |
| 45 to 59 Minutes | 29 | 3.6% |
| 60 to 89 Minutes | 35 | 4.3% |
| 90 or more Minutes | 21 | 2.6% |
Commute Time by Sex in Gunnison
The most common commute times in Gunnison are less than 5 minutes (127 commuters, 33.3%) for males and less than 5 minutes (149 commuters, 34.6%) for females.
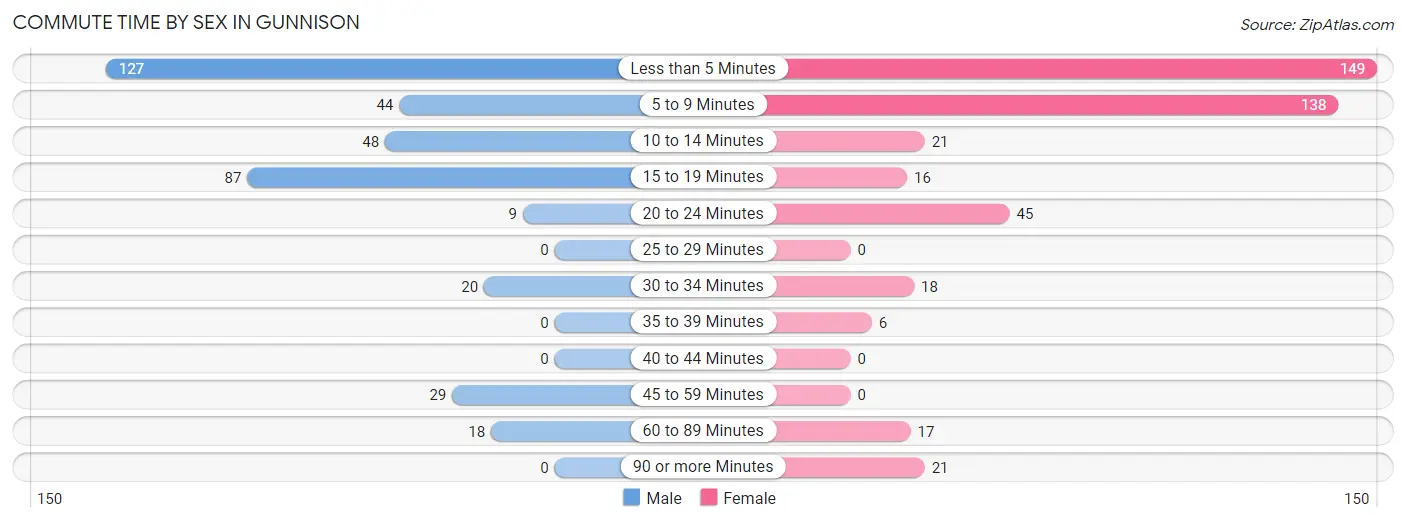
| Commute Time | Male | Female |
| Less than 5 Minutes | 127 (33.3%) | 149 (34.6%) |
| 5 to 9 Minutes | 44 (11.5%) | 138 (32.0%) |
| 10 to 14 Minutes | 48 (12.6%) | 21 (4.9%) |
| 15 to 19 Minutes | 87 (22.8%) | 16 (3.7%) |
| 20 to 24 Minutes | 9 (2.4%) | 45 (10.4%) |
| 25 to 29 Minutes | 0 (0.0%) | 0 (0.0%) |
| 30 to 34 Minutes | 20 (5.2%) | 18 (4.2%) |
| 35 to 39 Minutes | 0 (0.0%) | 6 (1.4%) |
| 40 to 44 Minutes | 0 (0.0%) | 0 (0.0%) |
| 45 to 59 Minutes | 29 (7.6%) | 0 (0.0%) |
| 60 to 89 Minutes | 18 (4.7%) | 17 (3.9%) |
| 90 or more Minutes | 0 (0.0%) | 21 (4.9%) |
Time of Departure to Work by Sex in Gunnison
The most frequent times of departure to work in Gunnison are 7:00 AM to 7:29 AM (75, 19.6%) for males and 4:00 PM to 11:59 PM (54, 12.5%) for females.
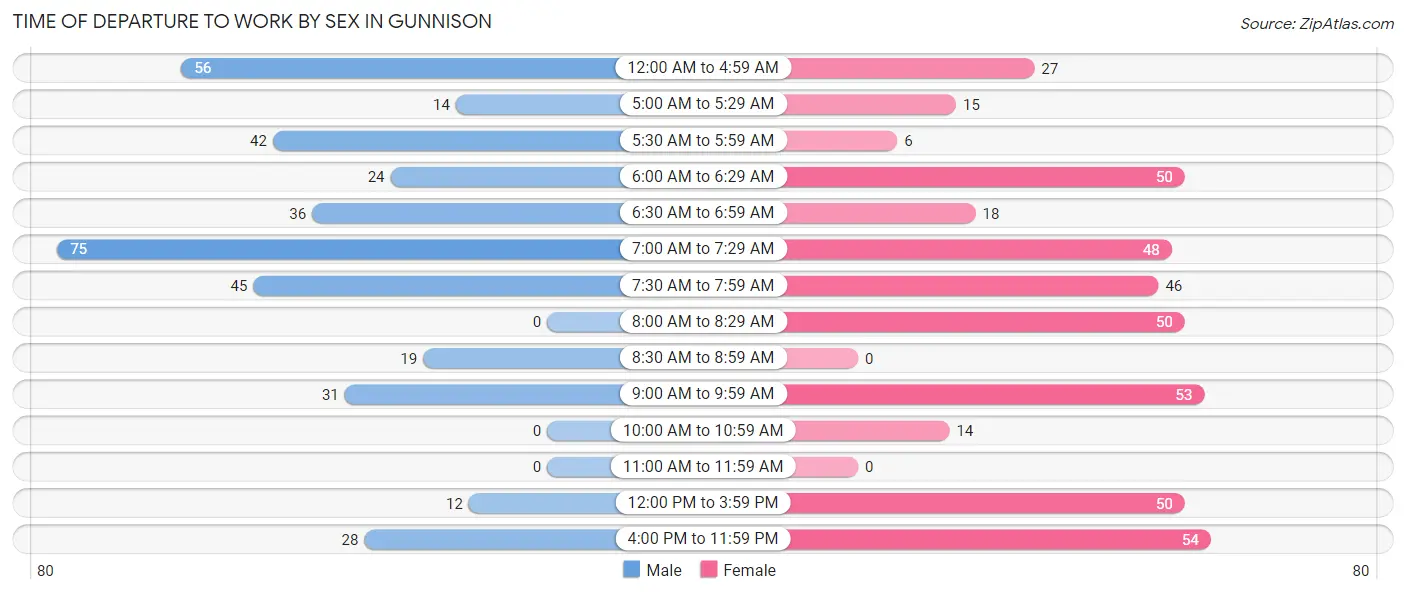
| Time of Departure | Male | Female |
| 12:00 AM to 4:59 AM | 56 (14.7%) | 27 (6.3%) |
| 5:00 AM to 5:29 AM | 14 (3.7%) | 15 (3.5%) |
| 5:30 AM to 5:59 AM | 42 (11.0%) | 6 (1.4%) |
| 6:00 AM to 6:29 AM | 24 (6.3%) | 50 (11.6%) |
| 6:30 AM to 6:59 AM | 36 (9.4%) | 18 (4.2%) |
| 7:00 AM to 7:29 AM | 75 (19.6%) | 48 (11.1%) |
| 7:30 AM to 7:59 AM | 45 (11.8%) | 46 (10.7%) |
| 8:00 AM to 8:29 AM | 0 (0.0%) | 50 (11.6%) |
| 8:30 AM to 8:59 AM | 19 (5.0%) | 0 (0.0%) |
| 9:00 AM to 9:59 AM | 31 (8.1%) | 53 (12.3%) |
| 10:00 AM to 10:59 AM | 0 (0.0%) | 14 (3.3%) |
| 11:00 AM to 11:59 AM | 0 (0.0%) | 0 (0.0%) |
| 12:00 PM to 3:59 PM | 12 (3.1%) | 50 (11.6%) |
| 4:00 PM to 11:59 PM | 28 (7.3%) | 54 (12.5%) |
| Total | 382 (100.0%) | 431 (100.0%) |
Housing Occupancy in Gunnison
Occupancy by Ownership in Gunnison
Of the total 591 dwellings in Gunnison, owner-occupied units account for 451 (76.3%), while renter-occupied units make up 140 (23.7%).
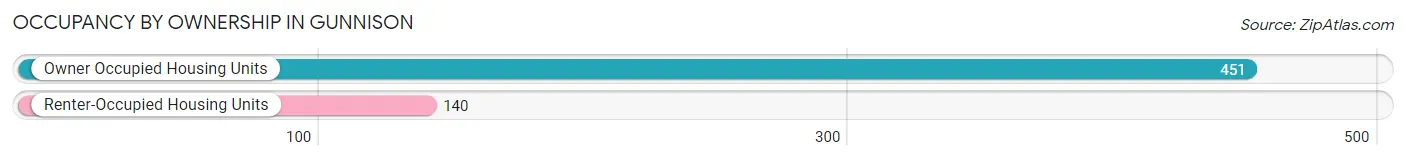
| Occupancy | # Housing Units | % Housing Units |
| Owner Occupied Housing Units | 451 | 76.3% |
| Renter-Occupied Housing Units | 140 | 23.7% |
| Total Occupied Housing Units | 591 | 100.0% |
Occupancy by Household Size in Gunnison
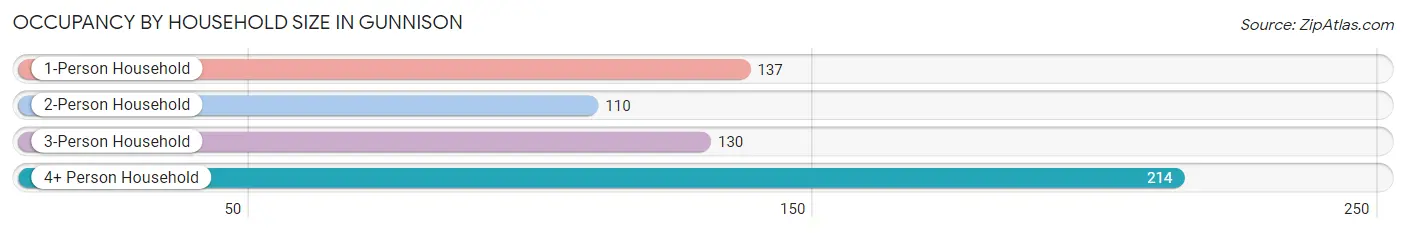
| Household Size | # Housing Units | % Housing Units |
| 1-Person Household | 137 | 23.2% |
| 2-Person Household | 110 | 18.6% |
| 3-Person Household | 130 | 22.0% |
| 4+ Person Household | 214 | 36.2% |
| Total Housing Units | 591 | 100.0% |
Occupancy by Ownership by Household Size in Gunnison
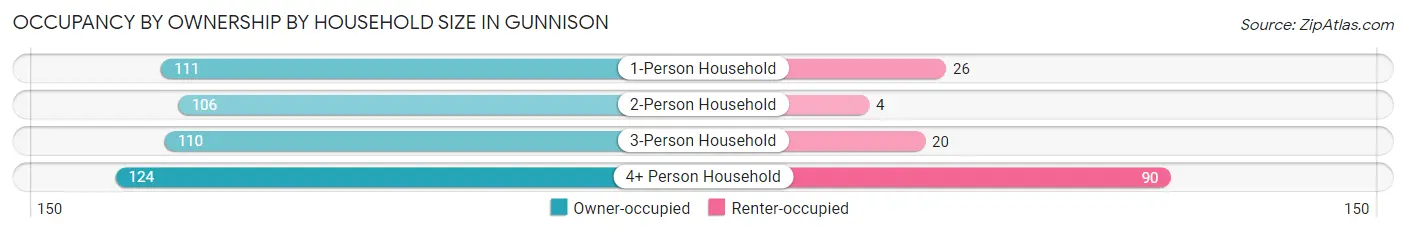
| Household Size | Owner-occupied | Renter-occupied |
| 1-Person Household | 111 (81.0%) | 26 (19.0%) |
| 2-Person Household | 106 (96.4%) | 4 (3.6%) |
| 3-Person Household | 110 (84.6%) | 20 (15.4%) |
| 4+ Person Household | 124 (57.9%) | 90 (42.1%) |
| Total Housing Units | 451 (76.3%) | 140 (23.7%) |
Occupancy by Educational Attainment in Gunnison
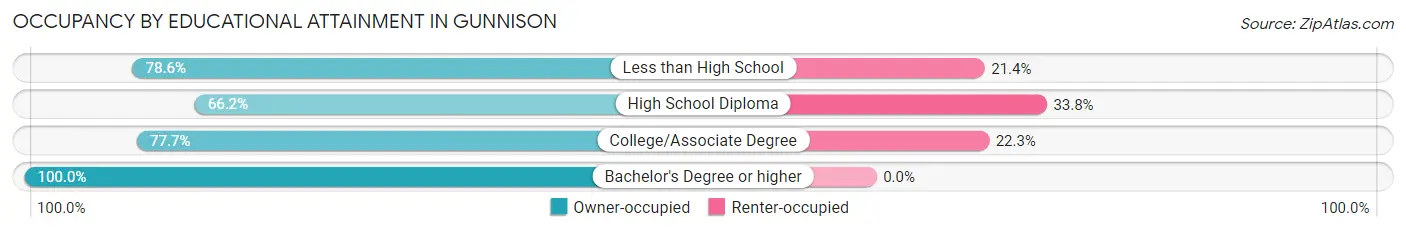
| Household Size | Owner-occupied | Renter-occupied |
| Less than High School | 11 (78.6%) | 3 (21.4%) |
| High School Diploma | 155 (66.2%) | 79 (33.8%) |
| College/Associate Degree | 202 (77.7%) | 58 (22.3%) |
| Bachelor's Degree or higher | 83 (100.0%) | 0 (0.0%) |
Occupancy by Age of Householder in Gunnison
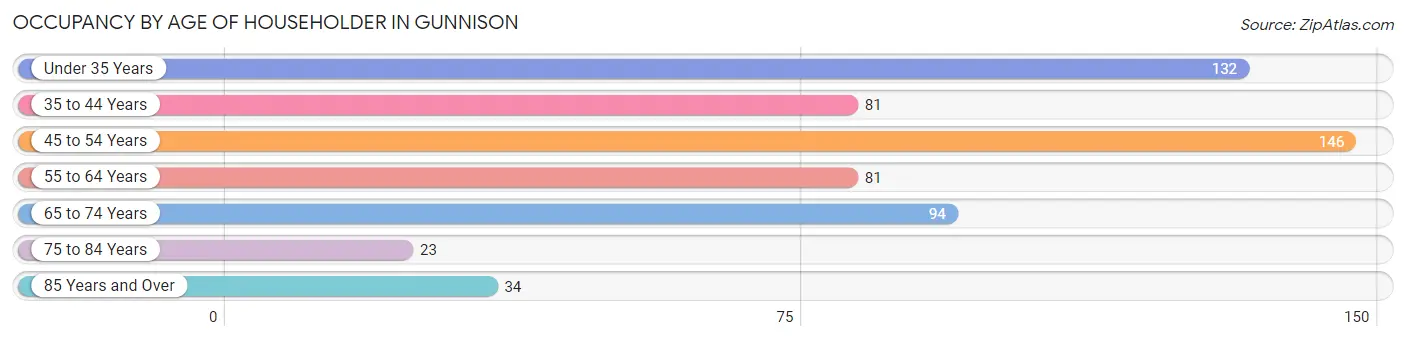
| Age Bracket | # Households | % Households |
| Under 35 Years | 132 | 22.3% |
| 35 to 44 Years | 81 | 13.7% |
| 45 to 54 Years | 146 | 24.7% |
| 55 to 64 Years | 81 | 13.7% |
| 65 to 74 Years | 94 | 15.9% |
| 75 to 84 Years | 23 | 3.9% |
| 85 Years and Over | 34 | 5.8% |
| Total | 591 | 100.0% |
Housing Finances in Gunnison
Median Income by Occupancy in Gunnison
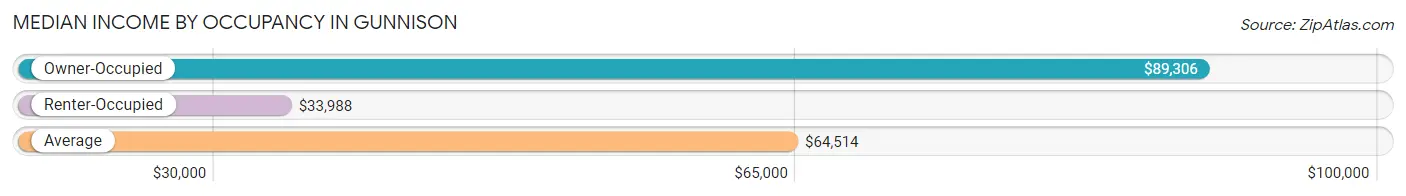
| Occupancy Type | # Households | Median Income |
| Owner-Occupied | 451 (76.3%) | $89,306 |
| Renter-Occupied | 140 (23.7%) | $33,988 |
| Average | 591 (100.0%) | $64,514 |
Occupancy by Householder Income Bracket in Gunnison
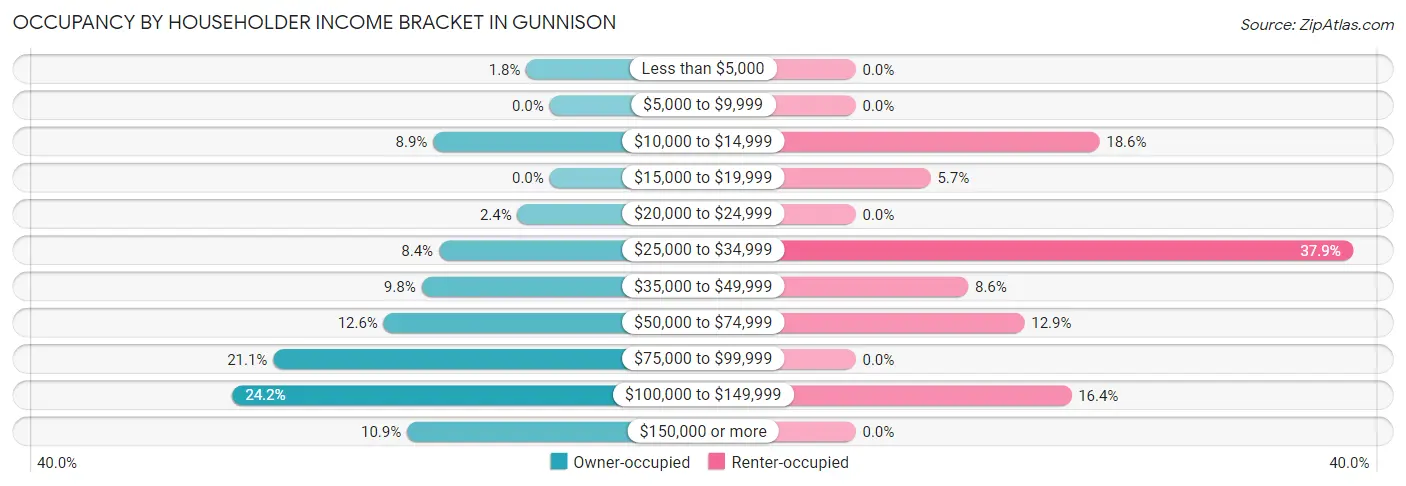
| Income Bracket | Owner-occupied | Renter-occupied |
| Less than $5,000 | 8 (1.8%) | 0 (0.0%) |
| $5,000 to $9,999 | 0 (0.0%) | 0 (0.0%) |
| $10,000 to $14,999 | 40 (8.9%) | 26 (18.6%) |
| $15,000 to $19,999 | 0 (0.0%) | 8 (5.7%) |
| $20,000 to $24,999 | 11 (2.4%) | 0 (0.0%) |
| $25,000 to $34,999 | 38 (8.4%) | 53 (37.9%) |
| $35,000 to $49,999 | 44 (9.8%) | 12 (8.6%) |
| $50,000 to $74,999 | 57 (12.6%) | 18 (12.9%) |
| $75,000 to $99,999 | 95 (21.1%) | 0 (0.0%) |
| $100,000 to $149,999 | 109 (24.2%) | 23 (16.4%) |
| $150,000 or more | 49 (10.9%) | 0 (0.0%) |
| Total | 451 (100.0%) | 140 (100.0%) |
Monthly Housing Cost Tiers in Gunnison
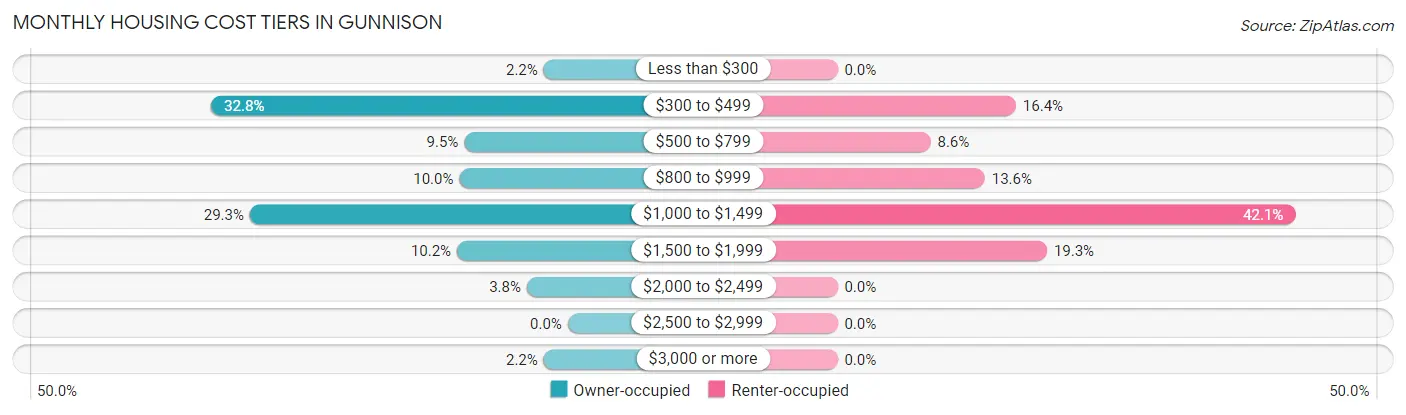
| Monthly Cost | Owner-occupied | Renter-occupied |
| Less than $300 | 10 (2.2%) | 0 (0.0%) |
| $300 to $499 | 148 (32.8%) | 23 (16.4%) |
| $500 to $799 | 43 (9.5%) | 12 (8.6%) |
| $800 to $999 | 45 (10.0%) | 19 (13.6%) |
| $1,000 to $1,499 | 132 (29.3%) | 59 (42.1%) |
| $1,500 to $1,999 | 46 (10.2%) | 27 (19.3%) |
| $2,000 to $2,499 | 17 (3.8%) | 0 (0.0%) |
| $2,500 to $2,999 | 0 (0.0%) | 0 (0.0%) |
| $3,000 or more | 10 (2.2%) | 0 (0.0%) |
| Total | 451 (100.0%) | 140 (100.0%) |
Physical Housing Characteristics in Gunnison
Housing Structures in Gunnison
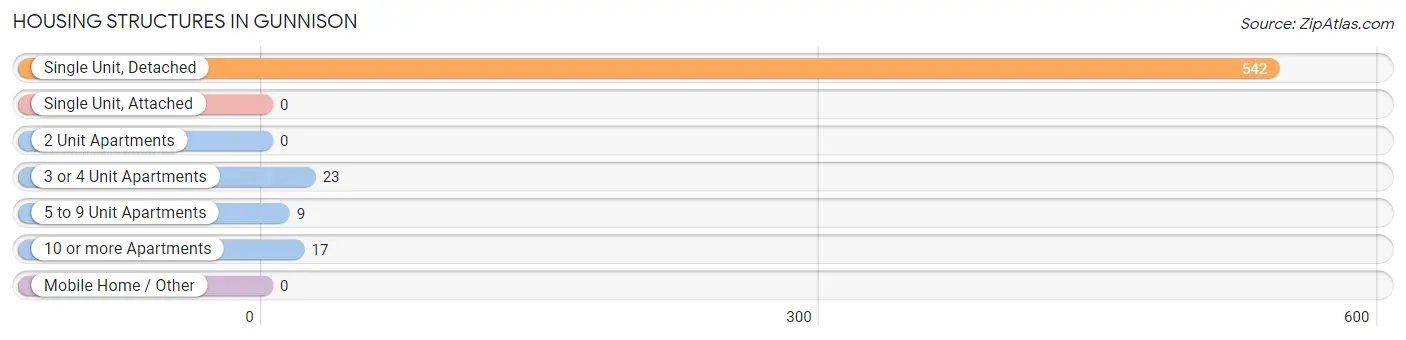
| Structure Type | # Housing Units | % Housing Units |
| Single Unit, Detached | 542 | 91.7% |
| Single Unit, Attached | 0 | 0.0% |
| 2 Unit Apartments | 0 | 0.0% |
| 3 or 4 Unit Apartments | 23 | 3.9% |
| 5 to 9 Unit Apartments | 9 | 1.5% |
| 10 or more Apartments | 17 | 2.9% |
| Mobile Home / Other | 0 | 0.0% |
| Total | 591 | 100.0% |
Housing Structures by Occupancy in Gunnison
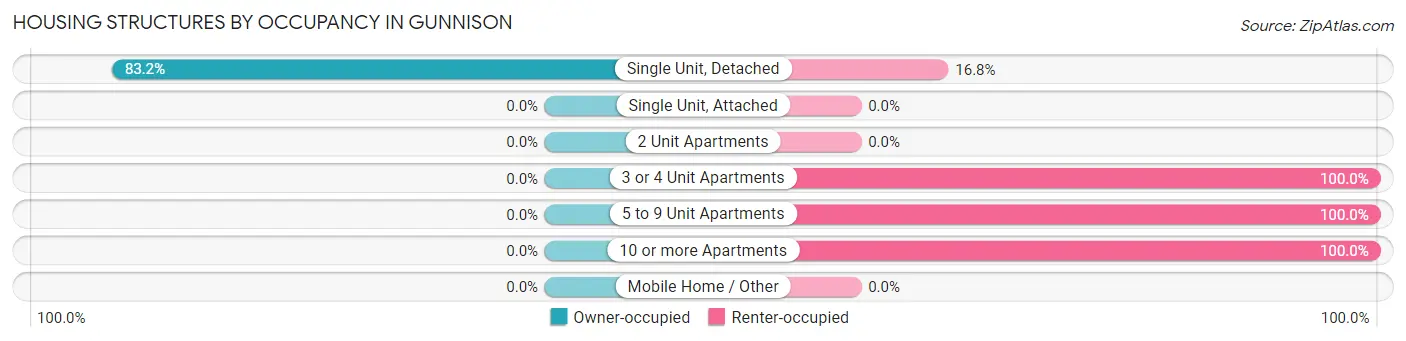
| Structure Type | Owner-occupied | Renter-occupied |
| Single Unit, Detached | 451 (83.2%) | 91 (16.8%) |
| Single Unit, Attached | 0 (0.0%) | 0 (0.0%) |
| 2 Unit Apartments | 0 (0.0%) | 0 (0.0%) |
| 3 or 4 Unit Apartments | 0 (0.0%) | 23 (100.0%) |
| 5 to 9 Unit Apartments | 0 (0.0%) | 9 (100.0%) |
| 10 or more Apartments | 0 (0.0%) | 17 (100.0%) |
| Mobile Home / Other | 0 (0.0%) | 0 (0.0%) |
| Total | 451 (76.3%) | 140 (23.7%) |
Housing Structures by Number of Rooms in Gunnison
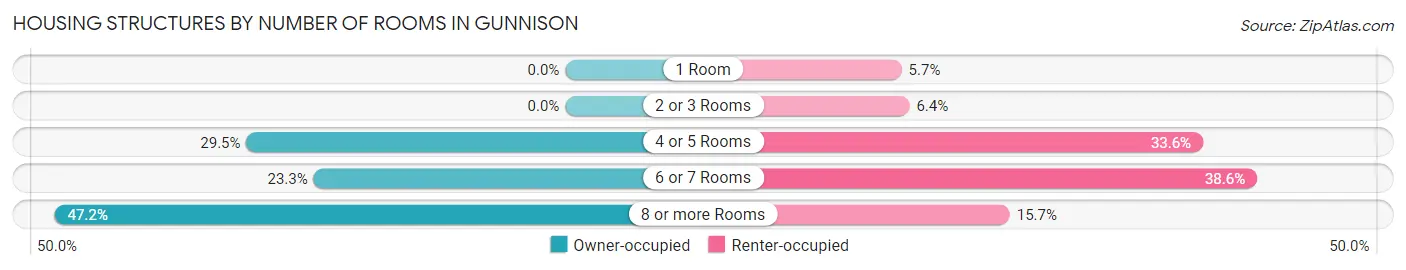
| Number of Rooms | Owner-occupied | Renter-occupied |
| 1 Room | 0 (0.0%) | 8 (5.7%) |
| 2 or 3 Rooms | 0 (0.0%) | 9 (6.4%) |
| 4 or 5 Rooms | 133 (29.5%) | 47 (33.6%) |
| 6 or 7 Rooms | 105 (23.3%) | 54 (38.6%) |
| 8 or more Rooms | 213 (47.2%) | 22 (15.7%) |
| Total | 451 (100.0%) | 140 (100.0%) |
Housing Structure by Heating Type in Gunnison
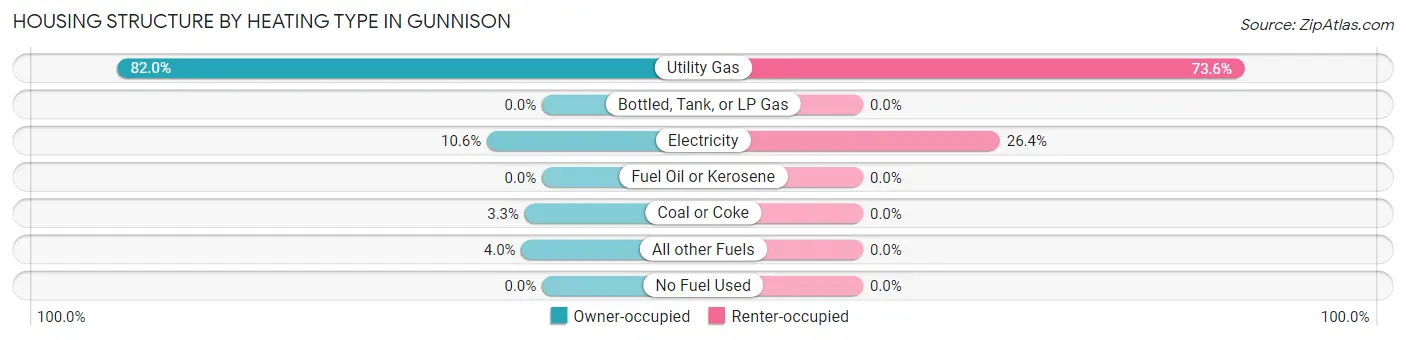
| Heating Type | Owner-occupied | Renter-occupied |
| Utility Gas | 370 (82.0%) | 103 (73.6%) |
| Bottled, Tank, or LP Gas | 0 (0.0%) | 0 (0.0%) |
| Electricity | 48 (10.6%) | 37 (26.4%) |
| Fuel Oil or Kerosene | 0 (0.0%) | 0 (0.0%) |
| Coal or Coke | 15 (3.3%) | 0 (0.0%) |
| All other Fuels | 18 (4.0%) | 0 (0.0%) |
| No Fuel Used | 0 (0.0%) | 0 (0.0%) |
| Total | 451 (100.0%) | 140 (100.0%) |
Household Vehicle Usage in Gunnison
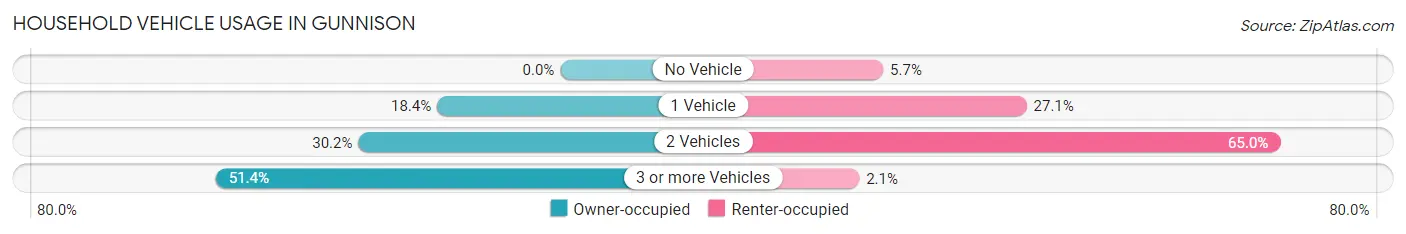
| Vehicles per Household | Owner-occupied | Renter-occupied |
| No Vehicle | 0 (0.0%) | 8 (5.7%) |
| 1 Vehicle | 83 (18.4%) | 38 (27.1%) |
| 2 Vehicles | 136 (30.2%) | 91 (65.0%) |
| 3 or more Vehicles | 232 (51.4%) | 3 (2.1%) |
| Total | 451 (100.0%) | 140 (100.0%) |
Real Estate & Mortgages in Gunnison
Real Estate and Mortgage Overview in Gunnison
| Characteristic | Without Mortgage | With Mortgage |
| Housing Units | 141 | 310 |
| Median Property Value | $243,400 | $238,600 |
| Median Household Income | - | - |
| Monthly Housing Costs | $455 | $10 |
| Real Estate Taxes | $1,350 | $12 |
Property Value by Mortgage Status in Gunnison
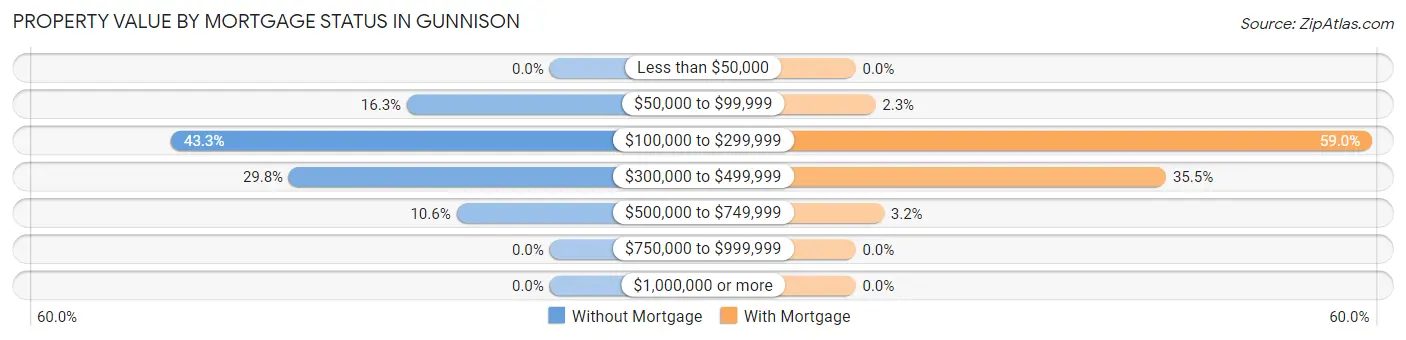
| Property Value | Without Mortgage | With Mortgage |
| Less than $50,000 | 0 (0.0%) | 0 (0.0%) |
| $50,000 to $99,999 | 23 (16.3%) | 7 (2.3%) |
| $100,000 to $299,999 | 61 (43.3%) | 183 (59.0%) |
| $300,000 to $499,999 | 42 (29.8%) | 110 (35.5%) |
| $500,000 to $749,999 | 15 (10.6%) | 10 (3.2%) |
| $750,000 to $999,999 | 0 (0.0%) | 0 (0.0%) |
| $1,000,000 or more | 0 (0.0%) | 0 (0.0%) |
| Total | 141 (100.0%) | 310 (100.0%) |
Household Income by Mortgage Status in Gunnison
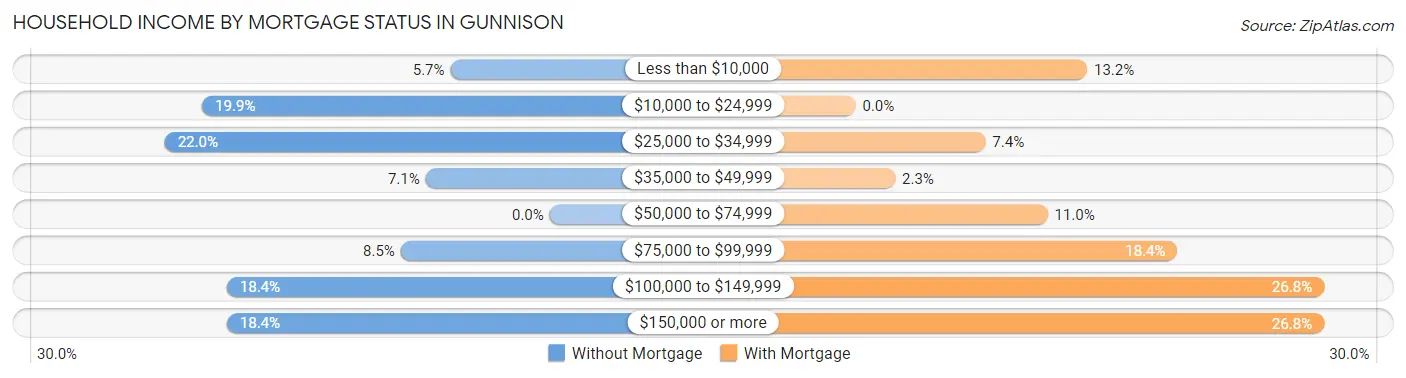
| Household Income | Without Mortgage | With Mortgage |
| Less than $10,000 | 8 (5.7%) | 41 (13.2%) |
| $10,000 to $24,999 | 28 (19.9%) | 0 (0.0%) |
| $25,000 to $34,999 | 31 (22.0%) | 23 (7.4%) |
| $35,000 to $49,999 | 10 (7.1%) | 7 (2.3%) |
| $50,000 to $74,999 | 0 (0.0%) | 34 (11.0%) |
| $75,000 to $99,999 | 12 (8.5%) | 57 (18.4%) |
| $100,000 to $149,999 | 26 (18.4%) | 83 (26.8%) |
| $150,000 or more | 26 (18.4%) | 83 (26.8%) |
| Total | 141 (100.0%) | 310 (100.0%) |
Property Value to Household Income Ratio in Gunnison
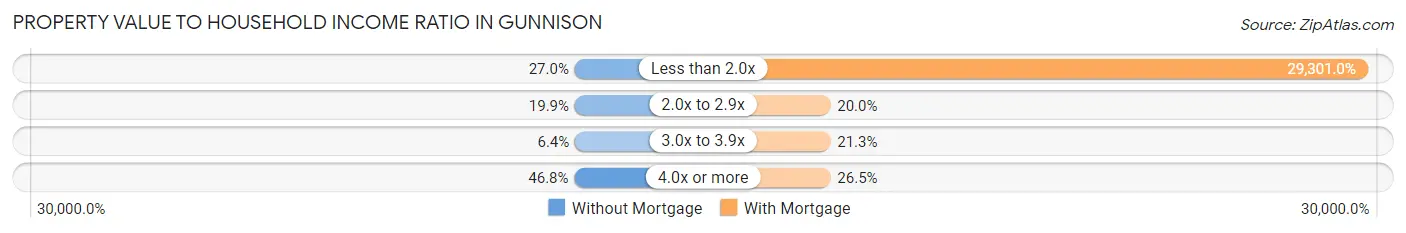
| Value-to-Income Ratio | Without Mortgage | With Mortgage |
| Less than 2.0x | 38 (27.0%) | 90,833 (29,301.0%) |
| 2.0x to 2.9x | 28 (19.9%) | 62 (20.0%) |
| 3.0x to 3.9x | 9 (6.4%) | 66 (21.3%) |
| 4.0x or more | 66 (46.8%) | 82 (26.5%) |
| Total | 141 (100.0%) | 310 (100.0%) |
Real Estate Taxes by Mortgage Status in Gunnison
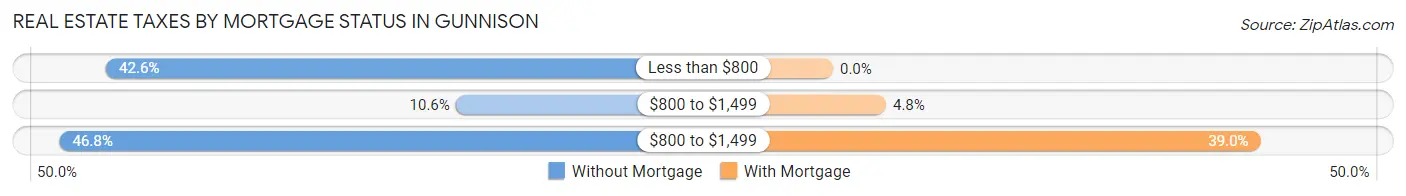
| Property Taxes | Without Mortgage | With Mortgage |
| Less than $800 | 60 (42.5%) | 0 (0.0%) |
| $800 to $1,499 | 15 (10.6%) | 15 (4.8%) |
| $800 to $1,499 | 66 (46.8%) | 121 (39.0%) |
| Total | 141 (100.0%) | 310 (100.0%) |
Health & Disability in Gunnison
Health Insurance Coverage by Age in Gunnison
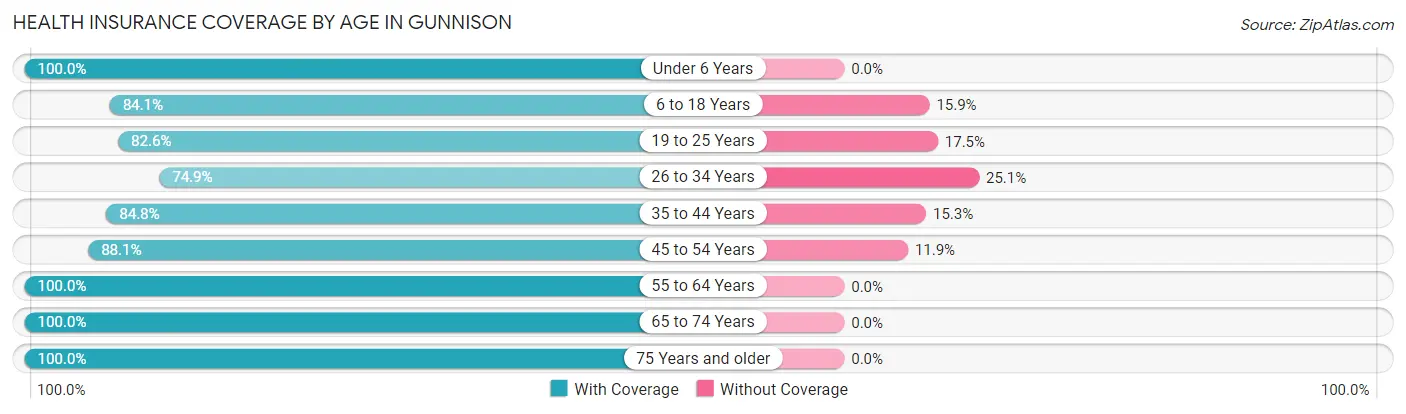
| Age Bracket | With Coverage | Without Coverage |
| Under 6 Years | 186 (100.0%) | 0 (0.0%) |
| 6 to 18 Years | 408 (84.1%) | 77 (15.9%) |
| 19 to 25 Years | 123 (82.6%) | 26 (17.4%) |
| 26 to 34 Years | 146 (74.9%) | 49 (25.1%) |
| 35 to 44 Years | 150 (84.8%) | 27 (15.2%) |
| 45 to 54 Years | 245 (88.1%) | 33 (11.9%) |
| 55 to 64 Years | 138 (100.0%) | 0 (0.0%) |
| 65 to 74 Years | 129 (100.0%) | 0 (0.0%) |
| 75 Years and older | 69 (100.0%) | 0 (0.0%) |
| Total | 1,594 (88.3%) | 212 (11.7%) |
Health Insurance Coverage by Citizenship Status in Gunnison
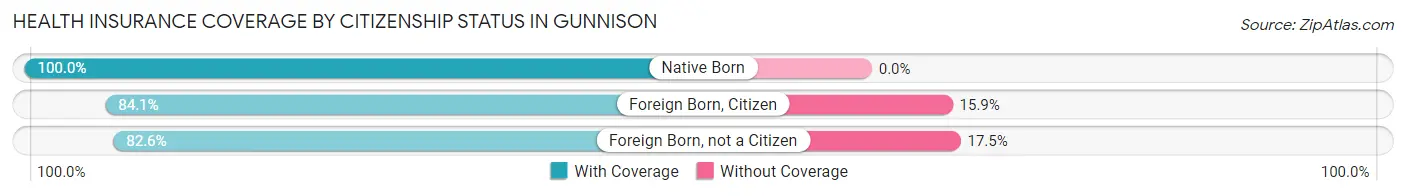
| Citizenship Status | With Coverage | Without Coverage |
| Native Born | 186 (100.0%) | 0 (0.0%) |
| Foreign Born, Citizen | 408 (84.1%) | 77 (15.9%) |
| Foreign Born, not a Citizen | 123 (82.6%) | 26 (17.4%) |
Health Insurance Coverage by Household Income in Gunnison
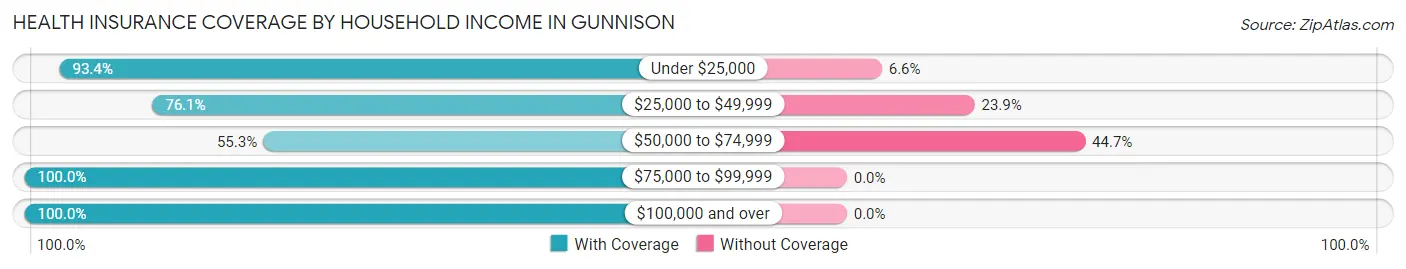
| Household Income | With Coverage | Without Coverage |
| Under $25,000 | 114 (93.4%) | 8 (6.6%) |
| $25,000 to $49,999 | 356 (76.1%) | 112 (23.9%) |
| $50,000 to $74,999 | 114 (55.3%) | 92 (44.7%) |
| $75,000 to $99,999 | 309 (100.0%) | 0 (0.0%) |
| $100,000 and over | 701 (100.0%) | 0 (0.0%) |
Public vs Private Health Insurance Coverage by Age in Gunnison
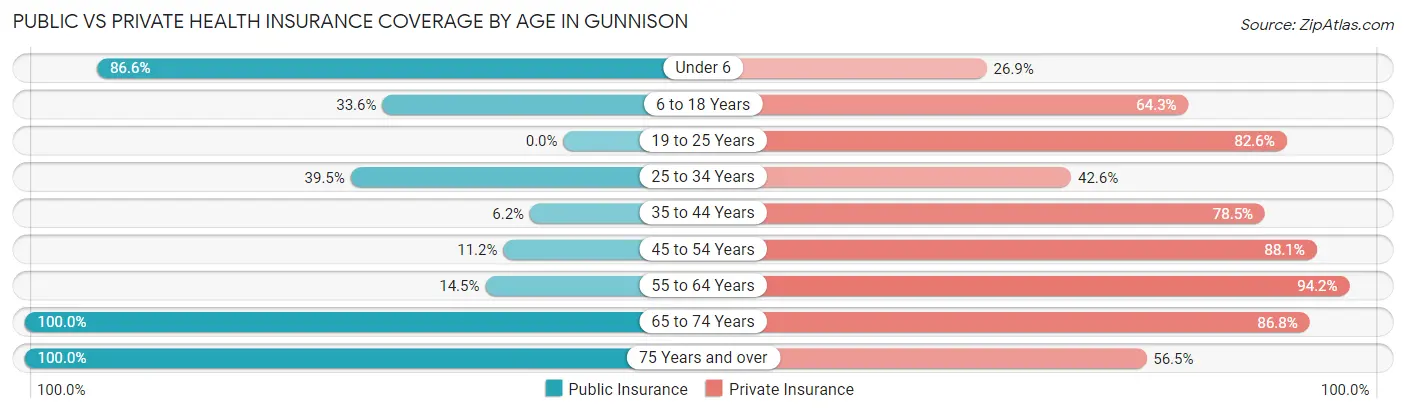
| Age Bracket | Public Insurance | Private Insurance |
| Under 6 | 161 (86.6%) | 50 (26.9%) |
| 6 to 18 Years | 163 (33.6%) | 312 (64.3%) |
| 19 to 25 Years | 0 (0.0%) | 123 (82.6%) |
| 25 to 34 Years | 77 (39.5%) | 83 (42.6%) |
| 35 to 44 Years | 11 (6.2%) | 139 (78.5%) |
| 45 to 54 Years | 31 (11.2%) | 245 (88.1%) |
| 55 to 64 Years | 20 (14.5%) | 130 (94.2%) |
| 65 to 74 Years | 129 (100.0%) | 112 (86.8%) |
| 75 Years and over | 69 (100.0%) | 39 (56.5%) |
| Total | 661 (36.6%) | 1,233 (68.3%) |
Disability Status by Sex by Age in Gunnison
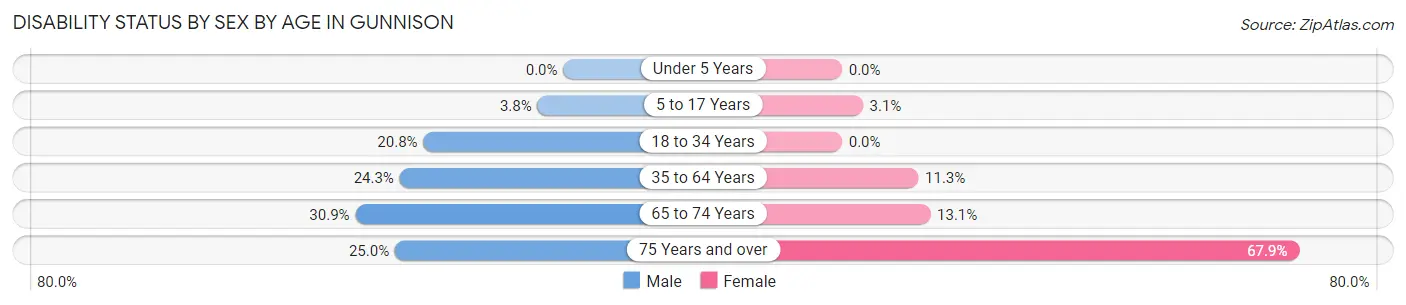
| Age Bracket | Male | Female |
| Under 5 Years | 0 (0.0%) | 0 (0.0%) |
| 5 to 17 Years | 9 (3.8%) | 9 (3.1%) |
| 18 to 34 Years | 32 (20.8%) | 0 (0.0%) |
| 35 to 64 Years | 69 (24.3%) | 35 (11.3%) |
| 65 to 74 Years | 21 (30.9%) | 8 (13.1%) |
| 75 Years and over | 4 (25.0%) | 36 (67.9%) |
Disability Class by Sex by Age in Gunnison
Disability Class: Hearing Difficulty
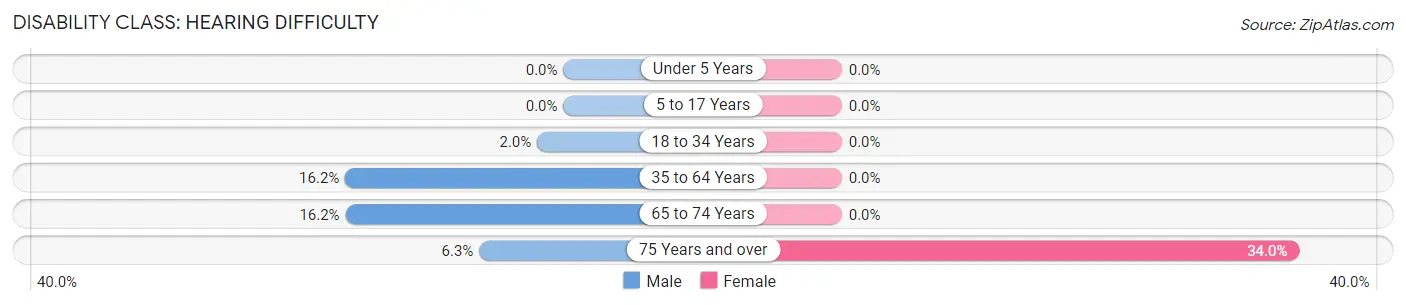
| Age Bracket | Male | Female |
| Under 5 Years | 0 (0.0%) | 0 (0.0%) |
| 5 to 17 Years | 0 (0.0%) | 0 (0.0%) |
| 18 to 34 Years | 3 (1.9%) | 0 (0.0%) |
| 35 to 64 Years | 46 (16.2%) | 0 (0.0%) |
| 65 to 74 Years | 11 (16.2%) | 0 (0.0%) |
| 75 Years and over | 1 (6.2%) | 18 (34.0%) |
Disability Class: Vision Difficulty
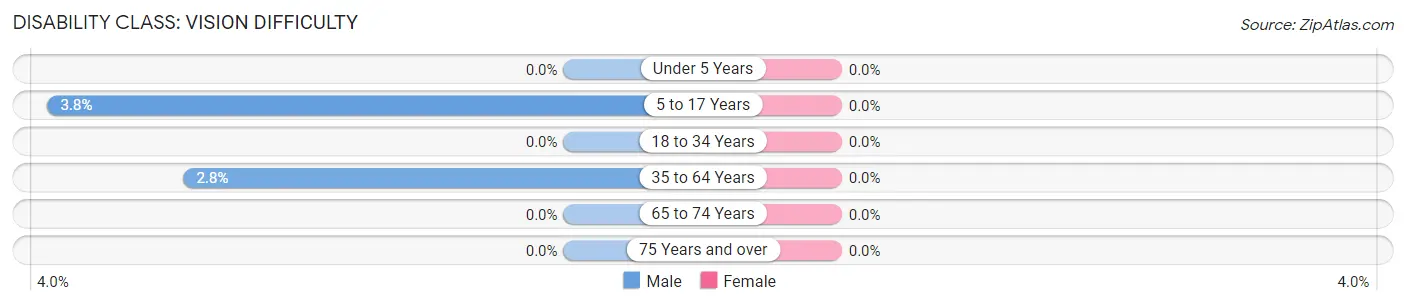
| Age Bracket | Male | Female |
| Under 5 Years | 0 (0.0%) | 0 (0.0%) |
| 5 to 17 Years | 9 (3.8%) | 0 (0.0%) |
| 18 to 34 Years | 0 (0.0%) | 0 (0.0%) |
| 35 to 64 Years | 8 (2.8%) | 0 (0.0%) |
| 65 to 74 Years | 0 (0.0%) | 0 (0.0%) |
| 75 Years and over | 0 (0.0%) | 0 (0.0%) |
Disability Class: Cognitive Difficulty
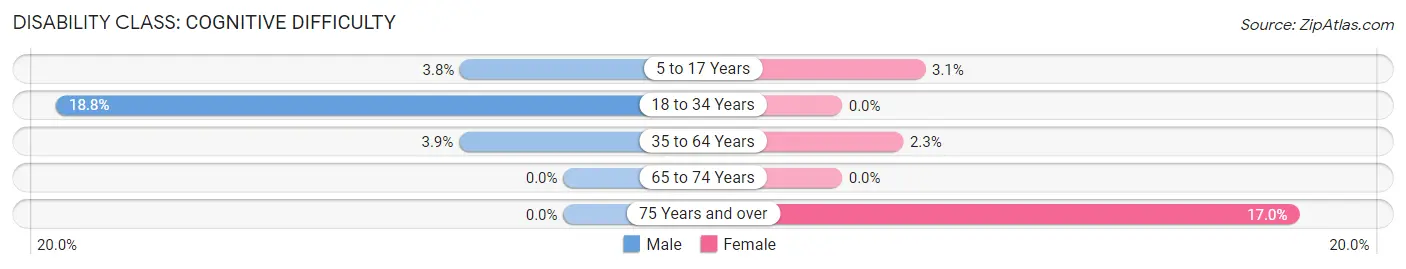
| Age Bracket | Male | Female |
| 5 to 17 Years | 9 (3.8%) | 9 (3.1%) |
| 18 to 34 Years | 29 (18.8%) | 0 (0.0%) |
| 35 to 64 Years | 11 (3.9%) | 7 (2.3%) |
| 65 to 74 Years | 0 (0.0%) | 0 (0.0%) |
| 75 Years and over | 0 (0.0%) | 9 (17.0%) |
Disability Class: Ambulatory Difficulty
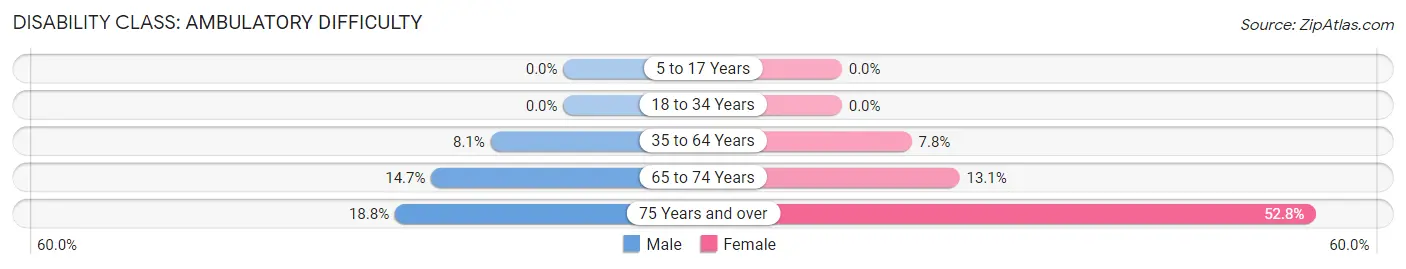
| Age Bracket | Male | Female |
| 5 to 17 Years | 0 (0.0%) | 0 (0.0%) |
| 18 to 34 Years | 0 (0.0%) | 0 (0.0%) |
| 35 to 64 Years | 23 (8.1%) | 24 (7.8%) |
| 65 to 74 Years | 10 (14.7%) | 8 (13.1%) |
| 75 Years and over | 3 (18.8%) | 28 (52.8%) |
Disability Class: Self-Care Difficulty
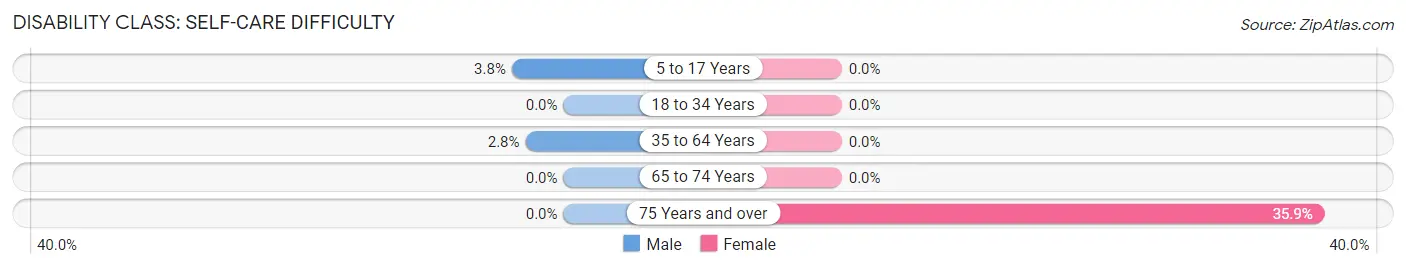
| Age Bracket | Male | Female |
| 5 to 17 Years | 9 (3.8%) | 0 (0.0%) |
| 18 to 34 Years | 0 (0.0%) | 0 (0.0%) |
| 35 to 64 Years | 8 (2.8%) | 0 (0.0%) |
| 65 to 74 Years | 0 (0.0%) | 0 (0.0%) |
| 75 Years and over | 0 (0.0%) | 19 (35.8%) |
Technology Access in Gunnison
Computing Device Access in Gunnison
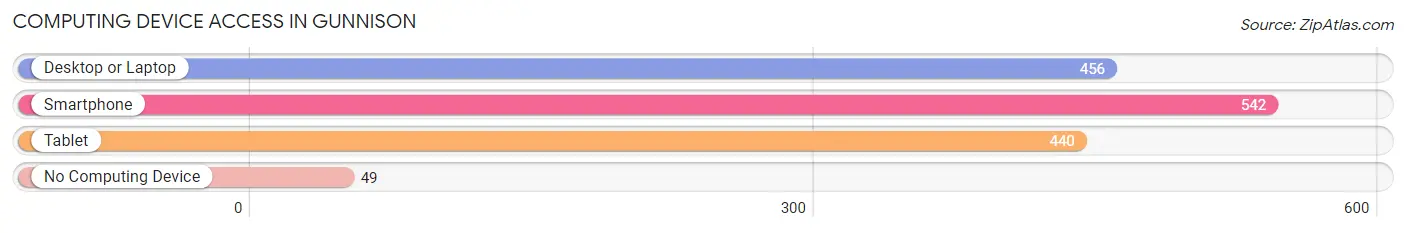
| Device Type | # Households | % Households |
| Desktop or Laptop | 456 | 77.2% |
| Smartphone | 542 | 91.7% |
| Tablet | 440 | 74.5% |
| No Computing Device | 49 | 8.3% |
| Total | 591 | 100.0% |
Internet Access in Gunnison
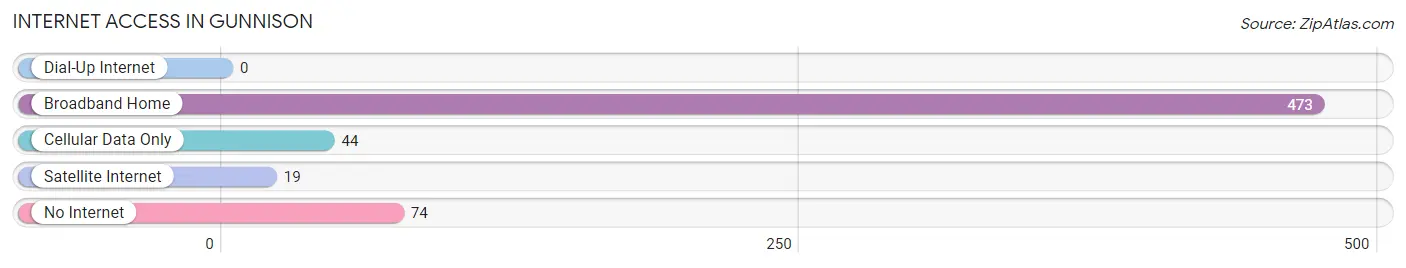
| Internet Type | # Households | % Households |
| Dial-Up Internet | 0 | 0.0% |
| Broadband Home | 473 | 80.0% |
| Cellular Data Only | 44 | 7.4% |
| Satellite Internet | 19 | 3.2% |
| No Internet | 74 | 12.5% |
| Total | 591 | 100.0% |
Gunnison Summary
Gunnison is a small city located in Sanpete County, Utah, United States. It is situated in the central part of the state, about halfway between Salt Lake City and Provo. The city is located in a valley surrounded by mountains, and is known for its scenic beauty and outdoor recreation opportunities.
History
Gunnison was first settled in 1859 by a group of Mormon pioneers led by John Gunnison. The settlers were attracted to the area by its fertile soil and abundant water supply. The town was named after John Gunnison, who was killed by Native Americans in 1853 while leading an expedition through the area.
The town grew slowly over the next few decades, and by the early 1900s had become a thriving agricultural community. In the 1920s, the town began to experience a period of growth and development, as the nearby coal mines began to produce more coal. This led to an influx of new residents and businesses, and the town began to expand.
In the 1950s, the town experienced a period of decline, as the coal mines began to close and the population began to decline. However, in the late 1970s, the town began to experience a resurgence, as new businesses and industries began to move into the area. Today, Gunnison is a thriving community with a population of around 2,500 people.
Geography
Gunnison is located in the central part of Utah, about halfway between Salt Lake City and Provo. The city is situated in a valley surrounded by mountains, and is known for its scenic beauty and outdoor recreation opportunities. The city is located at an elevation of 5,400 feet, and has a total area of 1.3 square miles.
The climate in Gunnison is semi-arid, with hot summers and cold winters. The average annual temperature is around 50 degrees Fahrenheit, and the average annual precipitation is around 12 inches.
Economy
Gunnison’s economy is largely based on agriculture and tourism. The city is home to several farms and ranches, and produces a variety of crops, including hay, wheat, corn, and alfalfa. The city is also home to several tourist attractions, including the Gunnison Pioneer Museum, the Sanpete County Historical Society, and the Sanpete County Fairgrounds.
In addition, the city is home to several manufacturing and industrial businesses, including a furniture factory, a plastics factory, and a metal fabrication plant. The city is also home to several retail stores, restaurants, and other businesses.
Demographics
As of the 2010 census, the population of Gunnison was 2,521. The racial makeup of the city was 95.3% White, 0.3% African American, 0.3% Native American, 0.3% Asian, 0.1% Pacific Islander, 1.2% from other races, and 2.5% from two or more races. Hispanic or Latino of any race were 4.2% of the population.
The median income for a household in the city was $41,250, and the median income for a family was $45,000. The per capita income for the city was $17,845. About 11.2% of families and 13.2% of the population were below the poverty line, including 16.2% of those under age 18 and 8.2% of those age 65 or over.
Common Questions
What is Per Capita Income in Gunnison?
Per Capita income in Gunnison is $15,257.
What is the Median Family Income in Gunnison?
Median Family Income in Gunnison is $87,778.
What is the Median Household income in Gunnison?
Median Household Income in Gunnison is $64,514.
What is Income or Wage Gap in Gunnison?
Income or Wage Gap in Gunnison is 24.2%.
Women in Gunnison earn 75.8 cents for every dollar earned by a man.
What is Inequality or Gini Index in Gunnison?
Inequality or Gini Index in Gunnison is 0.38.
What is the Total Population of Gunnison?
Total Population of Gunnison is 3,516.
What is the Total Male Population of Gunnison?
Total Male Population of Gunnison is 2,513.
What is the Total Female Population of Gunnison?
Total Female Population of Gunnison is 1,003.
What is the Ratio of Males per 100 Females in Gunnison?
There are 250.55 Males per 100 Females in Gunnison.
What is the Ratio of Females per 100 Males in Gunnison?
There are 39.91 Females per 100 Males in Gunnison.
What is the Median Population Age in Gunnison?
Median Population Age in Gunnison is 36.0 Years.
What is the Average Family Size in Gunnison
Average Family Size in Gunnison is 3.6 People.
What is the Average Household Size in Gunnison
Average Household Size in Gunnison is 3.1 People.
How Large is the Labor Force in Gunnison?
There are 884 People in the Labor Forcein in Gunnison.
What is the Percentage of People in the Labor Force in Gunnison?
29.7% of People are in the Labor Force in Gunnison.
What is the Unemployment Rate in Gunnison?
Unemployment Rate in Gunnison is 3.4%.