Wendover, UT Map & Demographics
Wendover Map
Wendover Overview
$20,419
PER CAPITA INCOME
$42,070
AVG FAMILY INCOME
$41,989
AVG HOUSEHOLD INCOME
12.7%
WAGE / INCOME GAP [ % ]
87.3¢/ $1
WAGE / INCOME GAP [ $ ]
$10,820
FAMILY INCOME DEFICIT
0.42
INEQUALITY / GINI INDEX
1,163
TOTAL POPULATION
622
MALE POPULATION
541
FEMALE POPULATION
114.97
MALES / 100 FEMALES
86.98
FEMALES / 100 MALES
28.7
MEDIAN AGE
3.5
AVG FAMILY SIZE
3.0
AVG HOUSEHOLD SIZE
589
LABOR FORCE [ PEOPLE ]
70.9%
PERCENT IN LABOR FORCE
3.4%
UNEMPLOYMENT RATE
Wendover Zip Codes
Wendover Area Codes
Income in Wendover
Income Overview in Wendover
Per Capita Income in Wendover is $20,419, while median incomes of families and households are $42,070 and $41,989 respectively.
| Characteristic | Number | Measure |
| Per Capita Income | 1,163 | $20,419 |
| Median Family Income | 289 | $42,070 |
| Mean Family Income | 289 | $58,300 |
| Median Household Income | 385 | $41,989 |
| Mean Household Income | 385 | $58,219 |
| Income Deficit | 289 | $10,820 |
| Wage / Income Gap (%) | 1,163 | 12.72% |
| Wage / Income Gap ($) | 1,163 | 87.28¢ per $1 |
| Gini / Inequality Index | 1,163 | 0.42 |
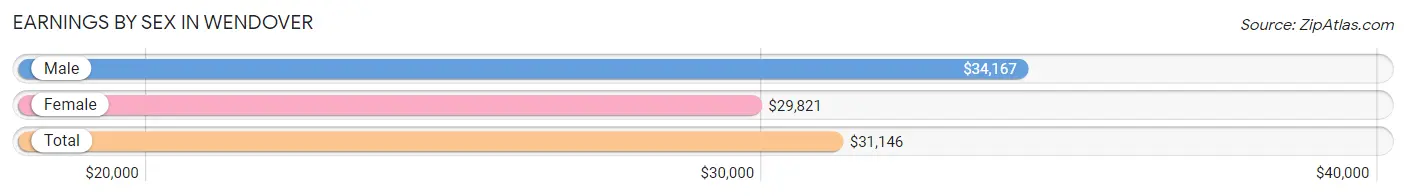
Earnings by Sex in Wendover
Average Earnings in Wendover are $31,146, $34,167 for men and $29,821 for women, a difference of 12.7%.
| Sex | Number | Average Earnings |
| Male | 370 (60.8%) | $34,167 |
| Female | 239 (39.2%) | $29,821 |
| Total | 609 (100.0%) | $31,146 |
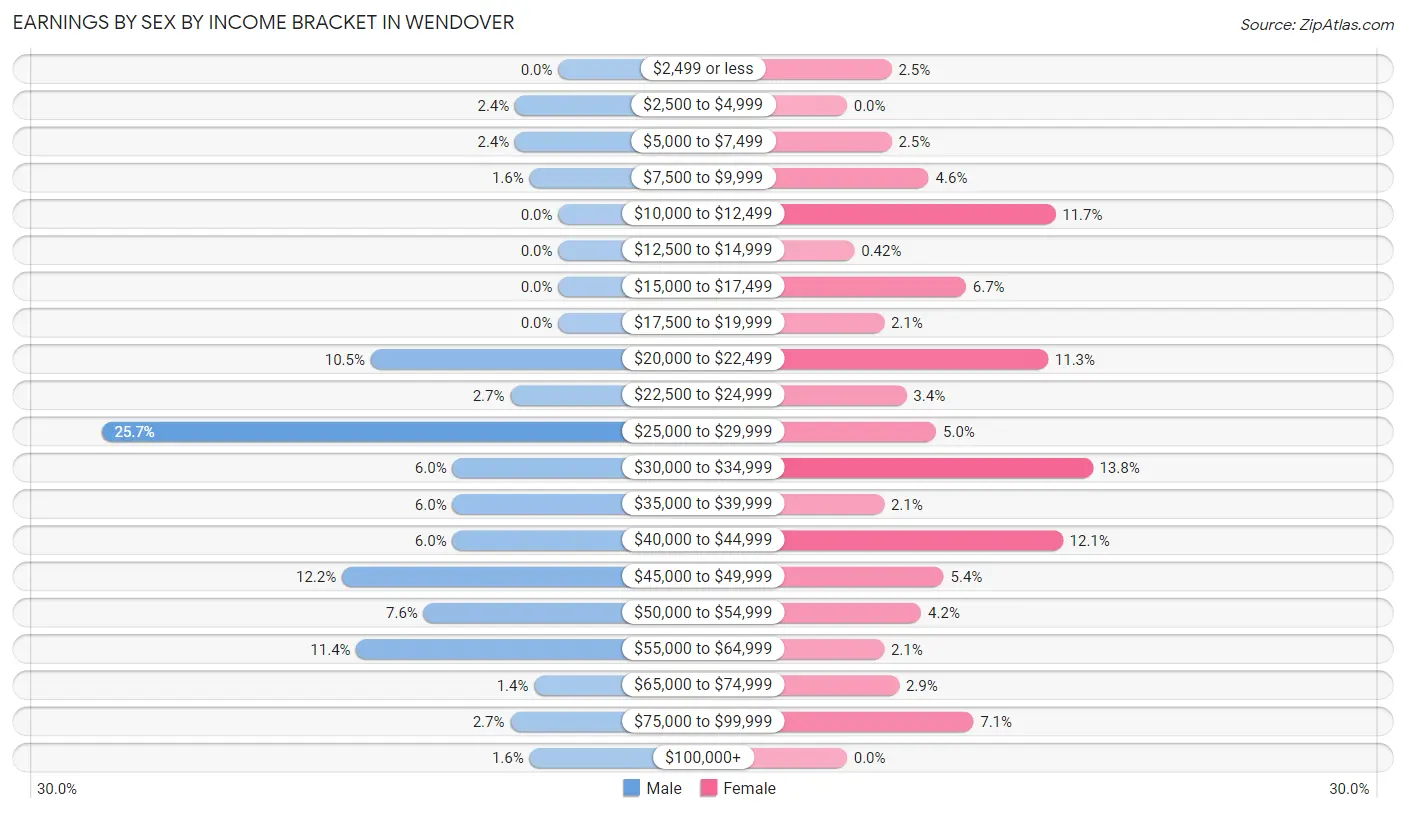
Earnings by Sex by Income Bracket in Wendover
The most common earnings brackets in Wendover are $25,000 to $29,999 for men (95 | 25.7%) and $30,000 to $34,999 for women (33 | 13.8%).
| Income | Male | Female |
| $2,499 or less | 0 (0.0%) | 6 (2.5%) |
| $2,500 to $4,999 | 9 (2.4%) | 0 (0.0%) |
| $5,000 to $7,499 | 9 (2.4%) | 6 (2.5%) |
| $7,500 to $9,999 | 6 (1.6%) | 11 (4.6%) |
| $10,000 to $12,499 | 0 (0.0%) | 28 (11.7%) |
| $12,500 to $14,999 | 0 (0.0%) | 1 (0.4%) |
| $15,000 to $17,499 | 0 (0.0%) | 16 (6.7%) |
| $17,500 to $19,999 | 0 (0.0%) | 5 (2.1%) |
| $20,000 to $22,499 | 39 (10.5%) | 27 (11.3%) |
| $22,500 to $24,999 | 10 (2.7%) | 8 (3.4%) |
| $25,000 to $29,999 | 95 (25.7%) | 12 (5.0%) |
| $30,000 to $34,999 | 22 (5.9%) | 33 (13.8%) |
| $35,000 to $39,999 | 22 (5.9%) | 5 (2.1%) |
| $40,000 to $44,999 | 22 (5.9%) | 29 (12.1%) |
| $45,000 to $49,999 | 45 (12.2%) | 13 (5.4%) |
| $50,000 to $54,999 | 28 (7.6%) | 10 (4.2%) |
| $55,000 to $64,999 | 42 (11.4%) | 5 (2.1%) |
| $65,000 to $74,999 | 5 (1.3%) | 7 (2.9%) |
| $75,000 to $99,999 | 10 (2.7%) | 17 (7.1%) |
| $100,000+ | 6 (1.6%) | 0 (0.0%) |
| Total | 370 (100.0%) | 239 (100.0%) |
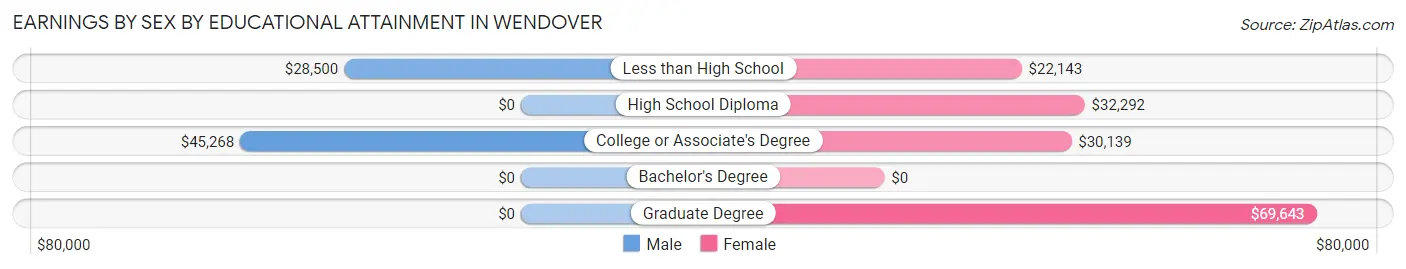
Earnings by Sex by Educational Attainment in Wendover
Average earnings in Wendover are $34,417 for men and $31,726 for women, a difference of 7.8%. Men with an educational attainment of college or associate's degree enjoy the highest average annual earnings of $45,268, while those with less than high school education earn the least with $28,500. Women with an educational attainment of graduate degree earn the most with the average annual earnings of $69,643, while those with less than high school education have the smallest earnings of $22,143.
| Educational Attainment | Male Income | Female Income |
| Less than High School | $28,500 | $22,143 |
| High School Diploma | - | - |
| College or Associate's Degree | $45,268 | $30,139 |
| Bachelor's Degree | - | - |
| Graduate Degree | - | - |
| Total | $34,417 | $31,726 |
Family Income in Wendover
Family Income Brackets in Wendover
According to the Wendover family income data, there are 60 families falling into the $25,000 to $34,999 income range, which is the most common income bracket and makes up 20.8% of all families.
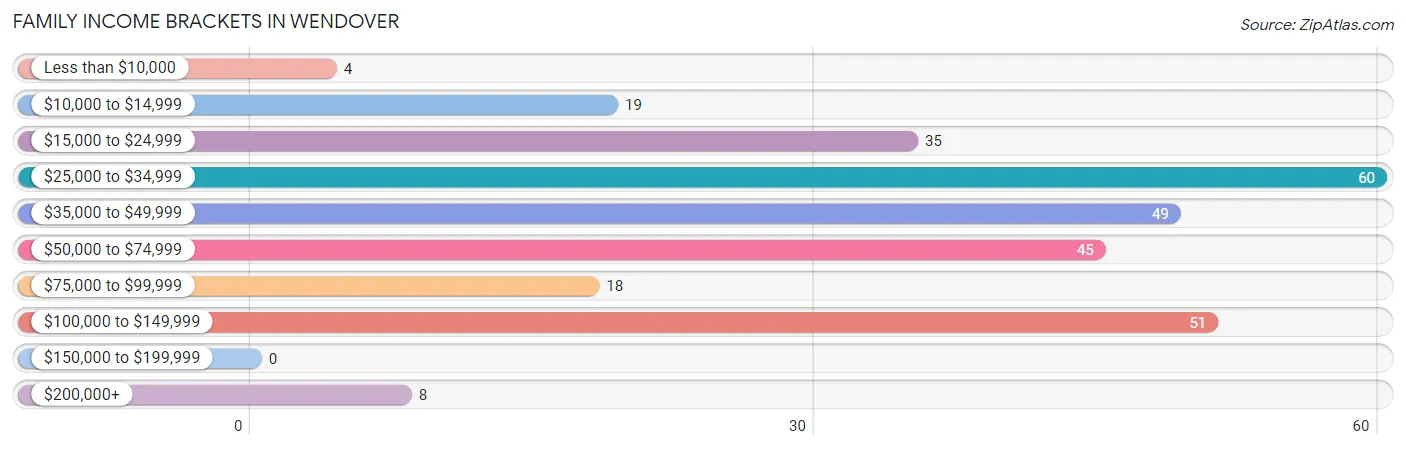
| Income Bracket | # Families | % Families |
| Less than $10,000 | 4 | 1.4% |
| $10,000 to $14,999 | 19 | 6.6% |
| $15,000 to $24,999 | 35 | 12.1% |
| $25,000 to $34,999 | 60 | 20.8% |
| $35,000 to $49,999 | 49 | 17.0% |
| $50,000 to $74,999 | 45 | 15.6% |
| $75,000 to $99,999 | 18 | 6.2% |
| $100,000 to $149,999 | 51 | 17.6% |
| $150,000 to $199,999 | 0 | 0.0% |
| $200,000+ | 8 | 2.8% |
Family Income by Famaliy Size in Wendover
2-person families (58 | 20.1%) account for the highest median family income in Wendover with $51,538 per family, while 2-person families (58 | 20.1%) have the highest median income of $25,769 per family member.
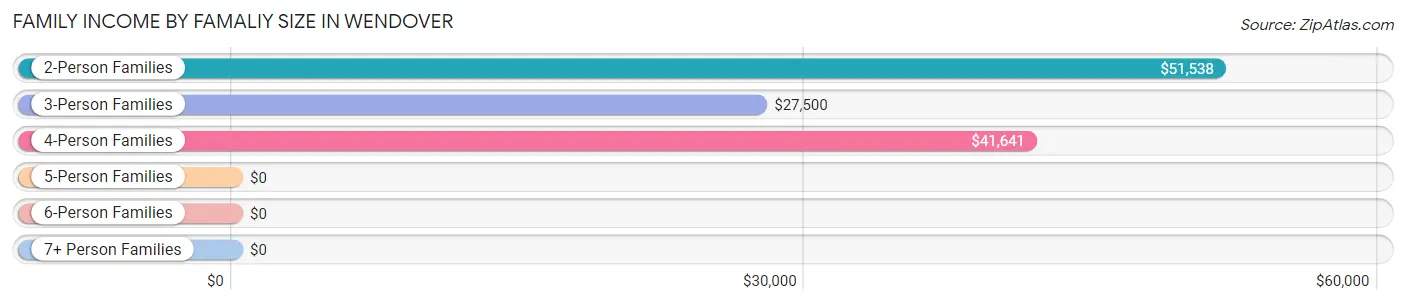
| Income Bracket | # Families | Median Income |
| 2-Person Families | 58 (20.1%) | $51,538 |
| 3-Person Families | 126 (43.6%) | $27,500 |
| 4-Person Families | 43 (14.9%) | $41,641 |
| 5-Person Families | 53 (18.3%) | $0 |
| 6-Person Families | 0 (0.0%) | $0 |
| 7+ Person Families | 9 (3.1%) | $0 |
| Total | 289 (100.0%) | $42,070 |
Family Income by Number of Earners in Wendover
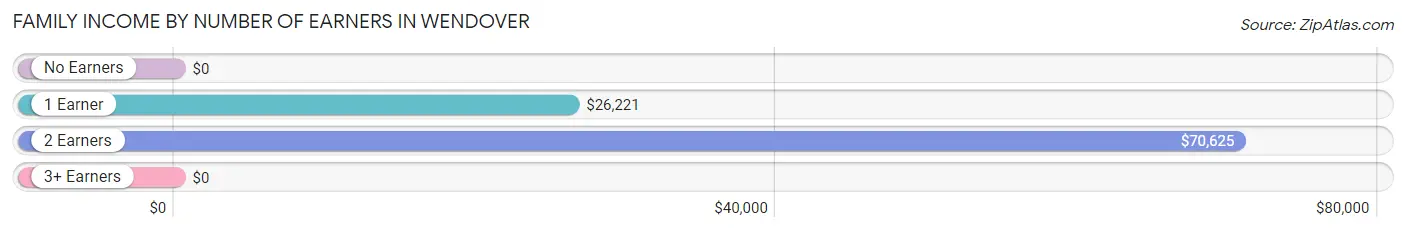
| Number of Earners | # Families | Median Income |
| No Earners | 9 (3.1%) | $0 |
| 1 Earner | 136 (47.1%) | $26,221 |
| 2 Earners | 126 (43.6%) | $70,625 |
| 3+ Earners | 18 (6.2%) | $0 |
| Total | 289 (100.0%) | $42,070 |
Household Income in Wendover
Household Income Brackets in Wendover
With 114 households falling in the category, the $35,000 to $49,999 income range is the most frequent in Wendover, accounting for 29.6% of all households.
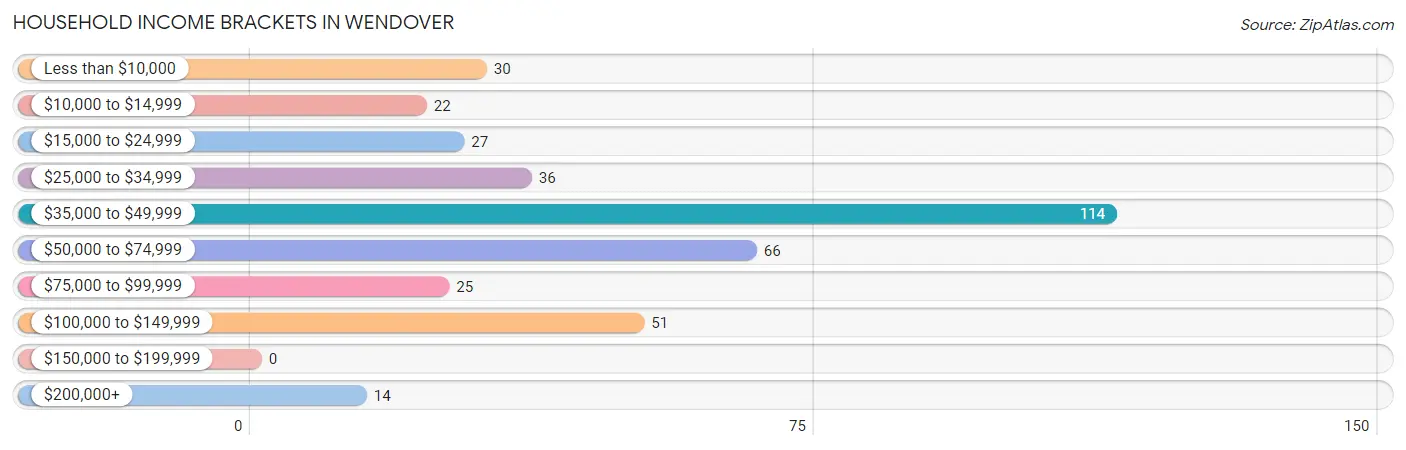
| Income Bracket | # Households | % Households |
| Less than $10,000 | 30 | 7.8% |
| $10,000 to $14,999 | 22 | 5.7% |
| $15,000 to $24,999 | 27 | 7.0% |
| $25,000 to $34,999 | 36 | 9.4% |
| $35,000 to $49,999 | 114 | 29.6% |
| $50,000 to $74,999 | 66 | 17.1% |
| $75,000 to $99,999 | 25 | 6.5% |
| $100,000 to $149,999 | 51 | 13.2% |
| $150,000 to $199,999 | 0 | 0.0% |
| $200,000+ | 14 | 3.6% |
Household Income by Householder Age in Wendover
The median household income in Wendover is $41,989, with the highest median household income of $51,591 found in the 45 to 64 years age bracket for the primary householder. A total of 114 households (29.6%) fall into this category. Meanwhile, the 65+ years age bracket for the primary householder has the lowest median household income of $0, with 41 households (10.6%) in this group.
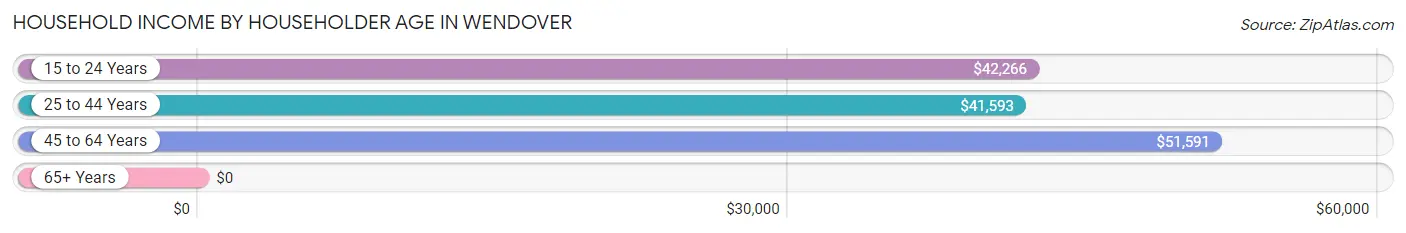
| Income Bracket | # Households | Median Income |
| 15 to 24 Years | 41 (10.6%) | $42,266 |
| 25 to 44 Years | 189 (49.1%) | $41,593 |
| 45 to 64 Years | 114 (29.6%) | $51,591 |
| 65+ Years | 41 (10.6%) | $0 |
| Total | 385 (100.0%) | $41,989 |
Poverty in Wendover
Income Below Poverty by Sex and Age in Wendover
With 21.7% poverty level for males and 23.3% for females among the residents of Wendover, 65 to 74 year old males and 75 year old and over females are the most vulnerable to poverty, with 11 males (57.9%) and 14 females (100.0%) in their respective age groups living below the poverty level.
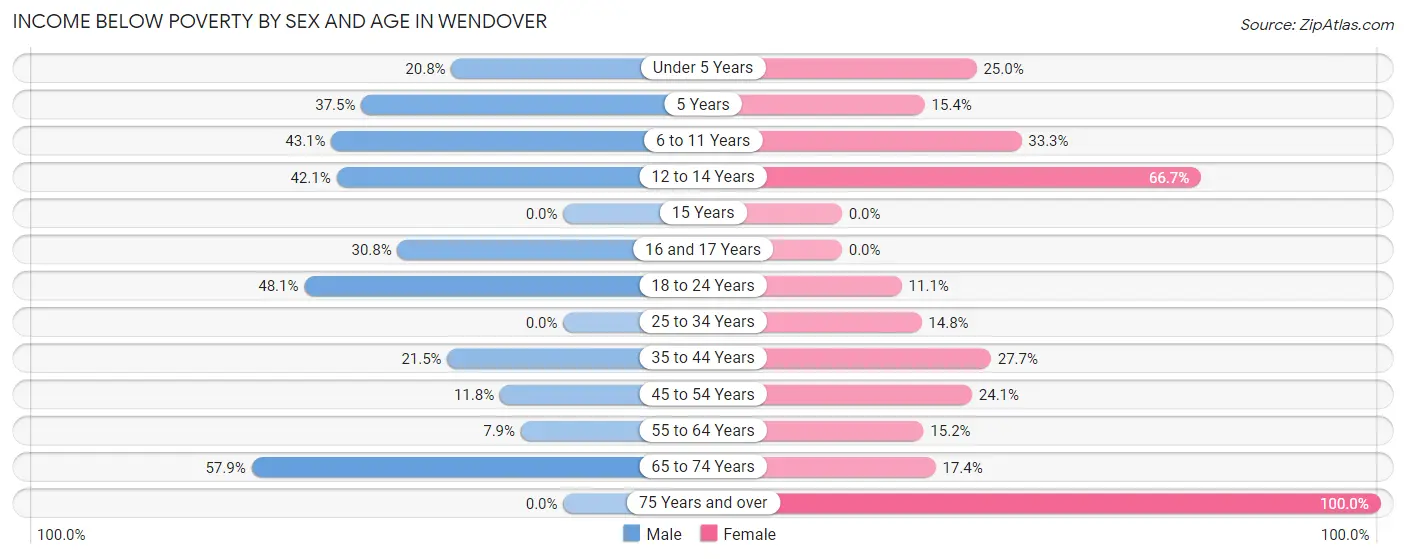
| Age Bracket | Male | Female |
| Under 5 Years | 16 (20.8%) | 5 (25.0%) |
| 5 Years | 6 (37.5%) | 2 (15.4%) |
| 6 to 11 Years | 31 (43.1%) | 32 (33.3%) |
| 12 to 14 Years | 8 (42.1%) | 10 (66.7%) |
| 15 Years | 0 (0.0%) | 0 (0.0%) |
| 16 and 17 Years | 4 (30.8%) | 0 (0.0%) |
| 18 to 24 Years | 25 (48.1%) | 10 (11.1%) |
| 25 to 34 Years | 0 (0.0%) | 17 (14.8%) |
| 35 to 44 Years | 20 (21.5%) | 13 (27.7%) |
| 45 to 54 Years | 8 (11.8%) | 14 (24.1%) |
| 55 to 64 Years | 6 (7.9%) | 5 (15.1%) |
| 65 to 74 Years | 11 (57.9%) | 4 (17.4%) |
| 75 Years and over | 0 (0.0%) | 14 (100.0%) |
| Total | 135 (21.7%) | 126 (23.3%) |
Income Above Poverty by Sex and Age in Wendover
According to the poverty statistics in Wendover, males aged 15 years and females aged 16 and 17 years are the age groups that are most secure financially, with 100.0% of males and 100.0% of females in these age groups living above the poverty line.
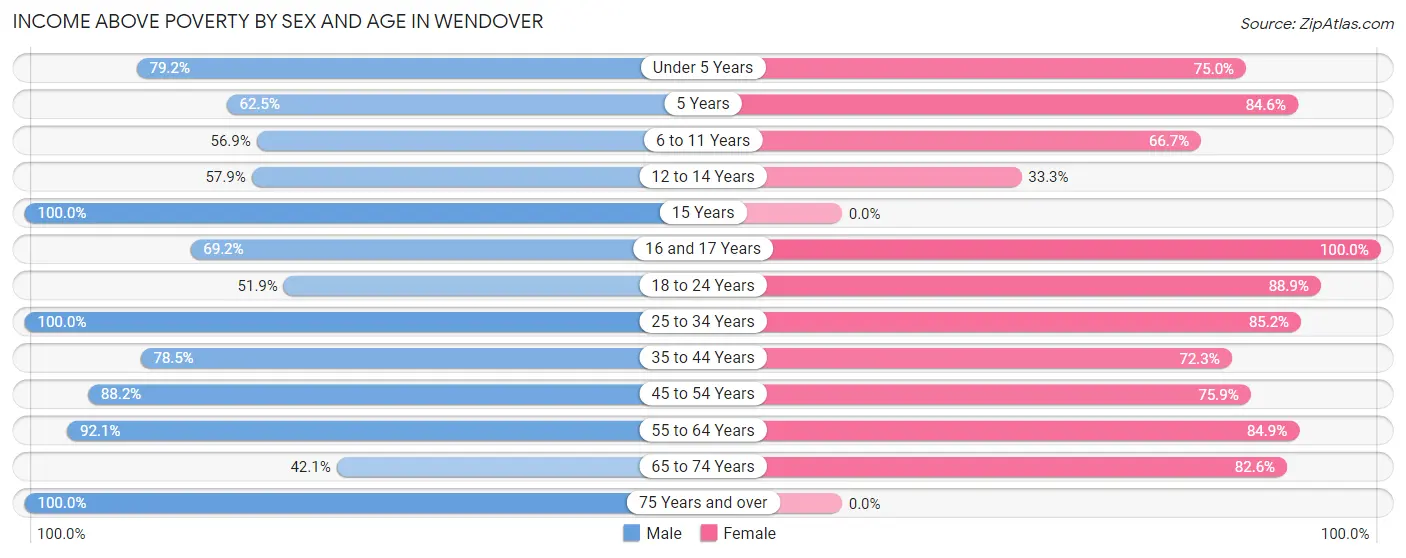
| Age Bracket | Male | Female |
| Under 5 Years | 61 (79.2%) | 15 (75.0%) |
| 5 Years | 10 (62.5%) | 11 (84.6%) |
| 6 to 11 Years | 41 (56.9%) | 64 (66.7%) |
| 12 to 14 Years | 11 (57.9%) | 5 (33.3%) |
| 15 Years | 4 (100.0%) | 0 (0.0%) |
| 16 and 17 Years | 9 (69.2%) | 17 (100.0%) |
| 18 to 24 Years | 27 (51.9%) | 80 (88.9%) |
| 25 to 34 Years | 106 (100.0%) | 98 (85.2%) |
| 35 to 44 Years | 73 (78.5%) | 34 (72.3%) |
| 45 to 54 Years | 60 (88.2%) | 44 (75.9%) |
| 55 to 64 Years | 70 (92.1%) | 28 (84.9%) |
| 65 to 74 Years | 8 (42.1%) | 19 (82.6%) |
| 75 Years and over | 7 (100.0%) | 0 (0.0%) |
| Total | 487 (78.3%) | 415 (76.7%) |
Income Below Poverty Among Married-Couple Families in Wendover
The poverty statistics for married-couple families in Wendover show that 8.4% or 12 of the total 143 families live below the poverty line. Families with 3 or 4 children have the highest poverty rate of 22.6%, comprising of 7 families. On the other hand, families with no children have the lowest poverty rate of 0.0%, which includes 0 families.
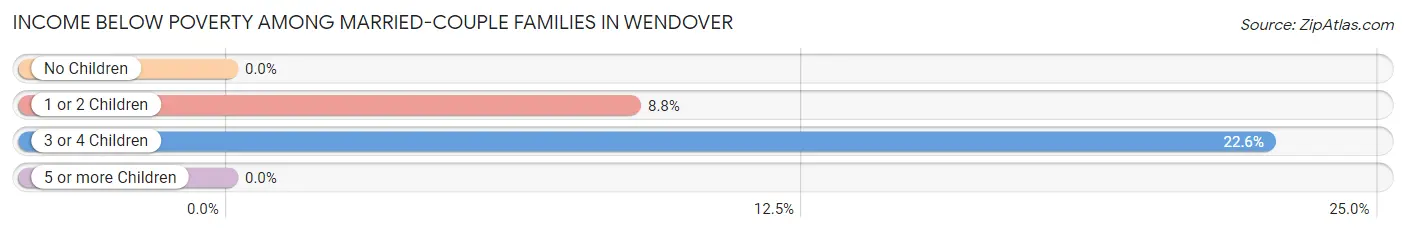
| Children | Above Poverty | Below Poverty |
| No Children | 50 (100.0%) | 0 (0.0%) |
| 1 or 2 Children | 52 (91.2%) | 5 (8.8%) |
| 3 or 4 Children | 24 (77.4%) | 7 (22.6%) |
| 5 or more Children | 5 (100.0%) | 0 (0.0%) |
| Total | 131 (91.6%) | 12 (8.4%) |
Income Below Poverty Among Single-Parent Households in Wendover
According to the poverty data in Wendover, 25.6% or 22 single-father households and 50.0% or 30 single-mother households are living below the poverty line. Among single-father households, those with 3 or 4 children have the highest poverty rate, with 17 households (100.0%) experiencing poverty. Likewise, among single-mother households, those with 1 or 2 children have the highest poverty rate, with 30 households (93.8%) falling below the poverty line.
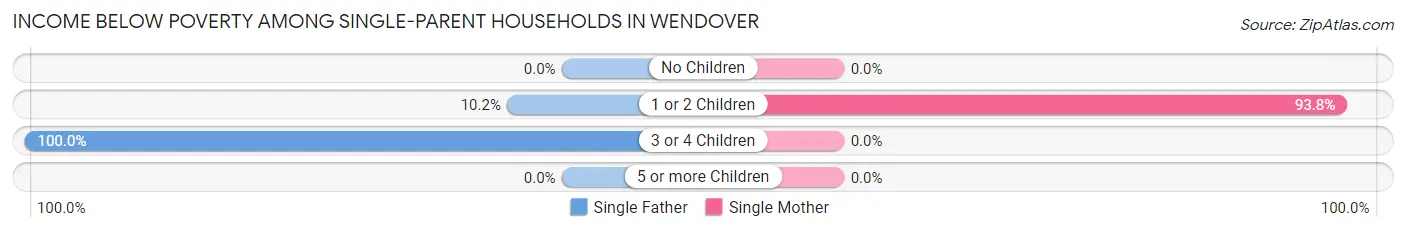
| Children | Single Father | Single Mother |
| No Children | 0 (0.0%) | 0 (0.0%) |
| 1 or 2 Children | 5 (10.2%) | 30 (93.8%) |
| 3 or 4 Children | 17 (100.0%) | 0 (0.0%) |
| 5 or more Children | 0 (0.0%) | 0 (0.0%) |
| Total | 22 (25.6%) | 30 (50.0%) |
Income Below Poverty Among Married-Couple vs Single-Parent Households in Wendover
The poverty data for Wendover shows that 12 of the married-couple family households (8.4%) and 52 of the single-parent households (35.6%) are living below the poverty level. Within the married-couple family households, those with 3 or 4 children have the highest poverty rate, with 7 households (22.6%) falling below the poverty line. Among the single-parent households, those with 3 or 4 children have the highest poverty rate, with 17 household (100.0%) living below poverty.
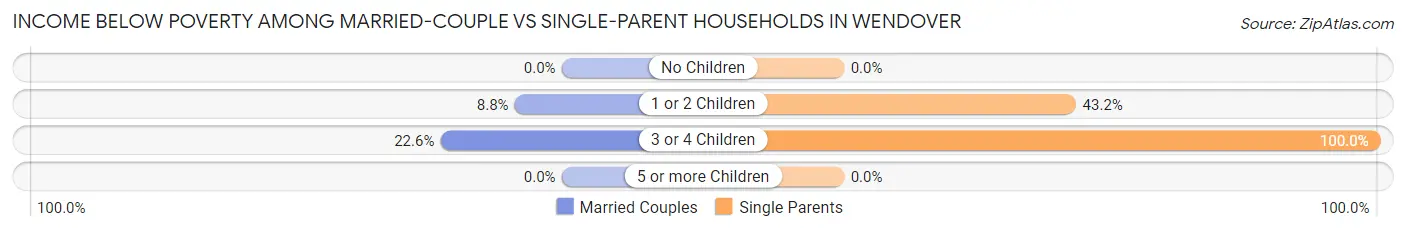
| Children | Married-Couple Families | Single-Parent Households |
| No Children | 0 (0.0%) | 0 (0.0%) |
| 1 or 2 Children | 5 (8.8%) | 35 (43.2%) |
| 3 or 4 Children | 7 (22.6%) | 17 (100.0%) |
| 5 or more Children | 0 (0.0%) | 0 (0.0%) |
| Total | 12 (8.4%) | 52 (35.6%) |
Race in Wendover
The most populous races in Wendover are White / Caucasian (836 | 71.9%), Hispanic or Latino (747 | 64.2%), and Two or more Races (252 | 21.7%).
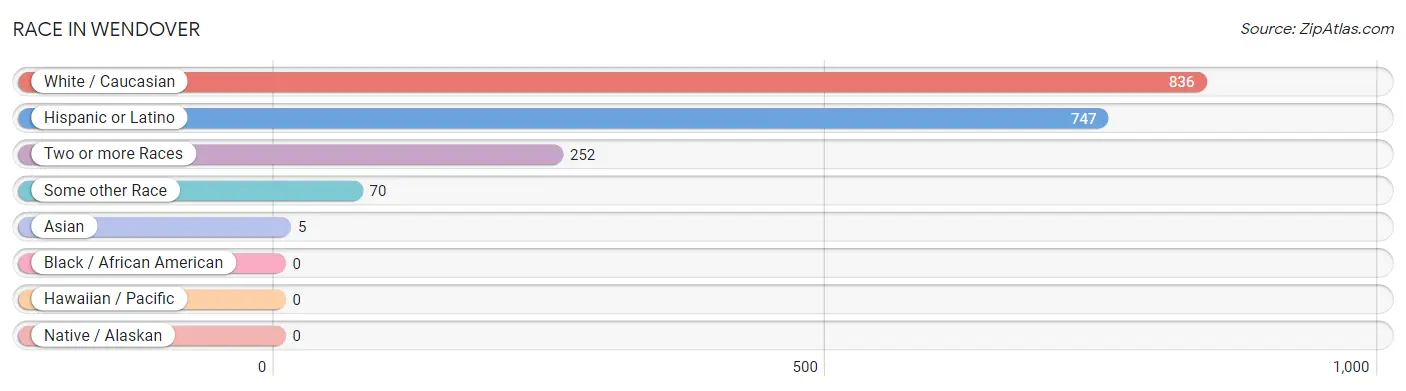
| Race | # Population | % Population |
| Asian | 5 | 0.4% |
| Black / African American | 0 | 0.0% |
| Hawaiian / Pacific | 0 | 0.0% |
| Hispanic or Latino | 747 | 64.2% |
| Native / Alaskan | 0 | 0.0% |
| White / Caucasian | 836 | 71.9% |
| Two or more Races | 252 | 21.7% |
| Some other Race | 70 | 6.0% |
| Total | 1,163 | 100.0% |
Ancestry in Wendover
The most populous ancestries reported in Wendover are Mexican (715 | 61.5%), English (115 | 9.9%), Spaniard (27 | 2.3%), American (23 | 2.0%), and French (20 | 1.7%), together accounting for 77.4% of all Wendover residents.
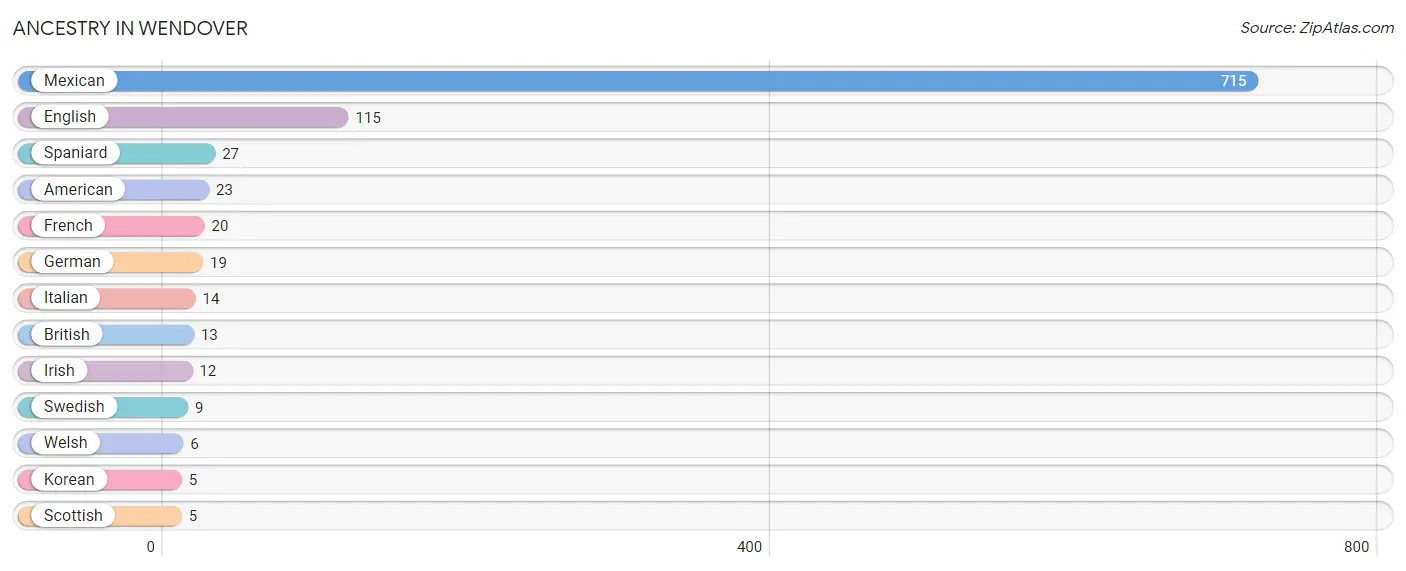
| Ancestry | # Population | % Population |
| American | 23 | 2.0% |
| British | 13 | 1.1% |
| English | 115 | 9.9% |
| French | 20 | 1.7% |
| German | 19 | 1.6% |
| Irish | 12 | 1.0% |
| Italian | 14 | 1.2% |
| Korean | 5 | 0.4% |
| Mexican | 715 | 61.5% |
| Scottish | 5 | 0.4% |
| Spaniard | 27 | 2.3% |
| Swedish | 9 | 0.8% |
| Welsh | 6 | 0.5% | View All 13 Rows |
Immigrants in Wendover
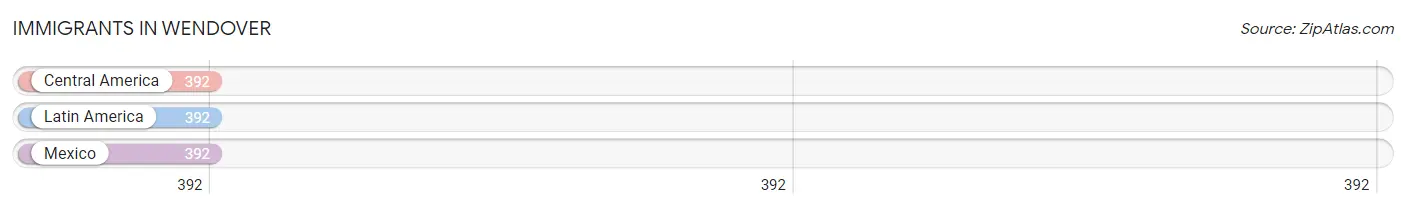
The most numerous immigrant groups reported in Wendover came from Central America (392 | 33.7%), Latin America (392 | 33.7%), and Mexico (392 | 33.7%), together accounting for 101.1% of all Wendover residents.
| Immigration Origin | # Population | % Population |
| Central America | 392 | 33.7% |
| Latin America | 392 | 33.7% |
| Mexico | 392 | 33.7% | View All 3 Rows |
Sex and Age in Wendover
Sex and Age in Wendover
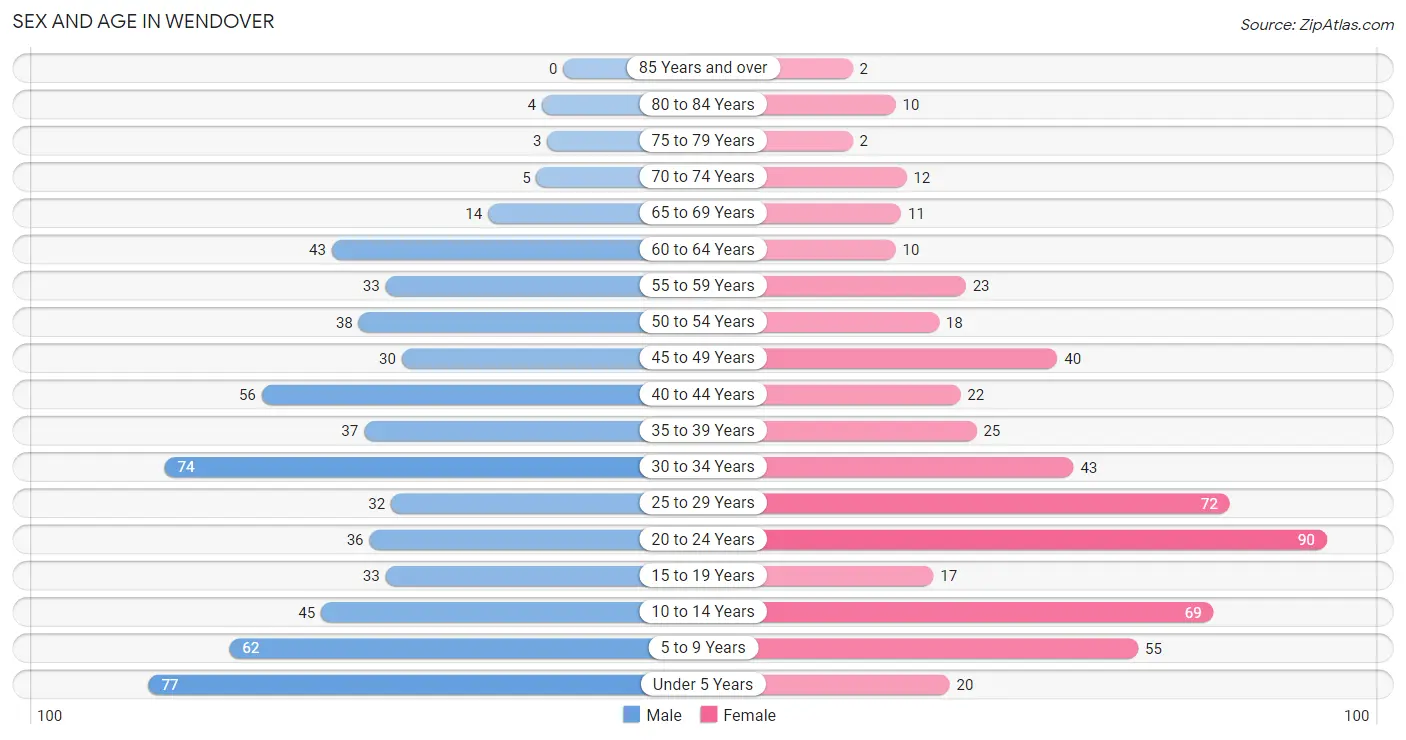
The most populous age groups in Wendover are Under 5 Years (77 | 12.4%) for men and 20 to 24 Years (90 | 16.6%) for women.
| Age Bracket | Male | Female |
| Under 5 Years | 77 (12.4%) | 20 (3.7%) |
| 5 to 9 Years | 62 (10.0%) | 55 (10.2%) |
| 10 to 14 Years | 45 (7.2%) | 69 (12.8%) |
| 15 to 19 Years | 33 (5.3%) | 17 (3.1%) |
| 20 to 24 Years | 36 (5.8%) | 90 (16.6%) |
| 25 to 29 Years | 32 (5.1%) | 72 (13.3%) |
| 30 to 34 Years | 74 (11.9%) | 43 (8.0%) |
| 35 to 39 Years | 37 (5.9%) | 25 (4.6%) |
| 40 to 44 Years | 56 (9.0%) | 22 (4.1%) |
| 45 to 49 Years | 30 (4.8%) | 40 (7.4%) |
| 50 to 54 Years | 38 (6.1%) | 18 (3.3%) |
| 55 to 59 Years | 33 (5.3%) | 23 (4.3%) |
| 60 to 64 Years | 43 (6.9%) | 10 (1.8%) |
| 65 to 69 Years | 14 (2.2%) | 11 (2.0%) |
| 70 to 74 Years | 5 (0.8%) | 12 (2.2%) |
| 75 to 79 Years | 3 (0.5%) | 2 (0.4%) |
| 80 to 84 Years | 4 (0.6%) | 10 (1.8%) |
| 85 Years and over | 0 (0.0%) | 2 (0.4%) |
| Total | 622 (100.0%) | 541 (100.0%) |
Families and Households in Wendover
Median Family Size in Wendover
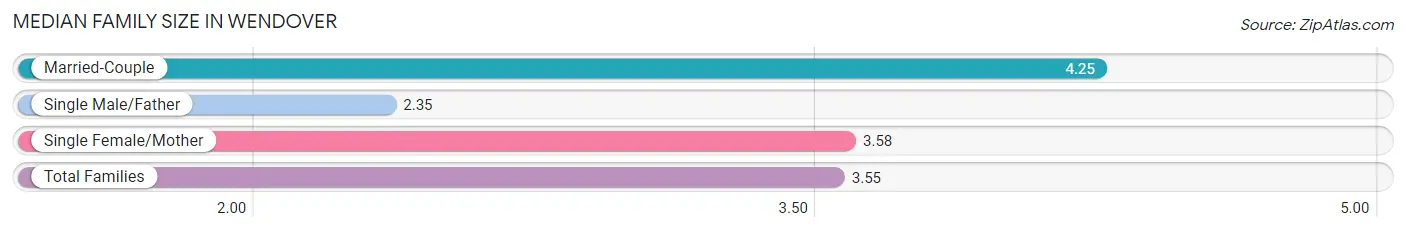
The median family size in Wendover is 3.55 persons per family, with married-couple families (143 | 49.5%) accounting for the largest median family size of 4.25 persons per family. On the other hand, single male/father families (86 | 29.8%) represent the smallest median family size with 2.35 persons per family.
| Family Type | # Families | Family Size |
| Married-Couple | 143 (49.5%) | 4.25 |
| Single Male/Father | 86 (29.8%) | 2.35 |
| Single Female/Mother | 60 (20.8%) | 3.58 |
| Total Families | 289 (100.0%) | 3.55 |
Median Household Size in Wendover
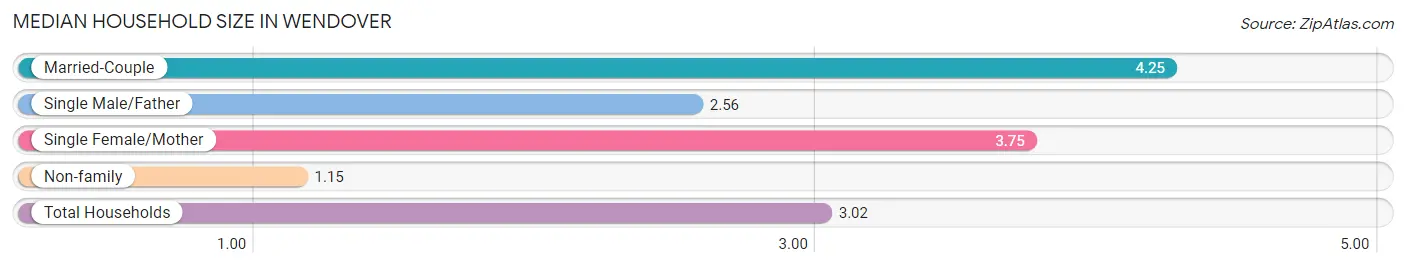
The median household size in Wendover is 3.02 persons per household, with married-couple households (143 | 37.1%) accounting for the largest median household size of 4.25 persons per household. non-family households (96 | 24.9%) represent the smallest median household size with 1.15 persons per household.
| Household Type | # Households | Household Size |
| Married-Couple | 143 (37.1%) | 4.25 |
| Single Male/Father | 86 (22.3%) | 2.56 |
| Single Female/Mother | 60 (15.6%) | 3.75 |
| Non-family | 96 (24.9%) | 1.15 |
| Total Households | 385 (100.0%) | 3.02 |
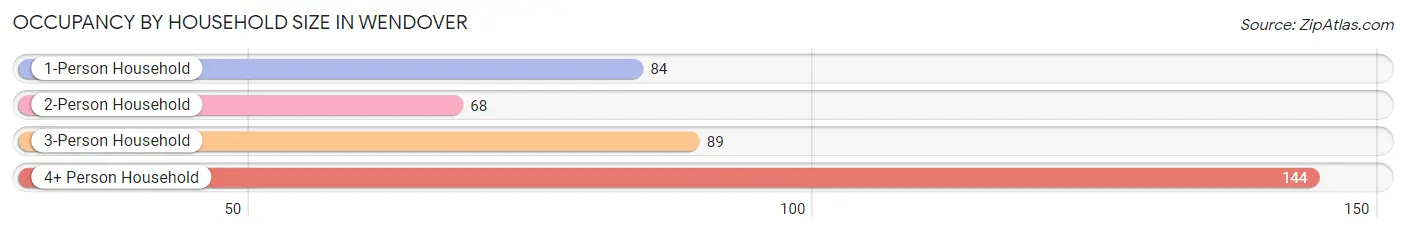
Household Size by Marriage Status in Wendover
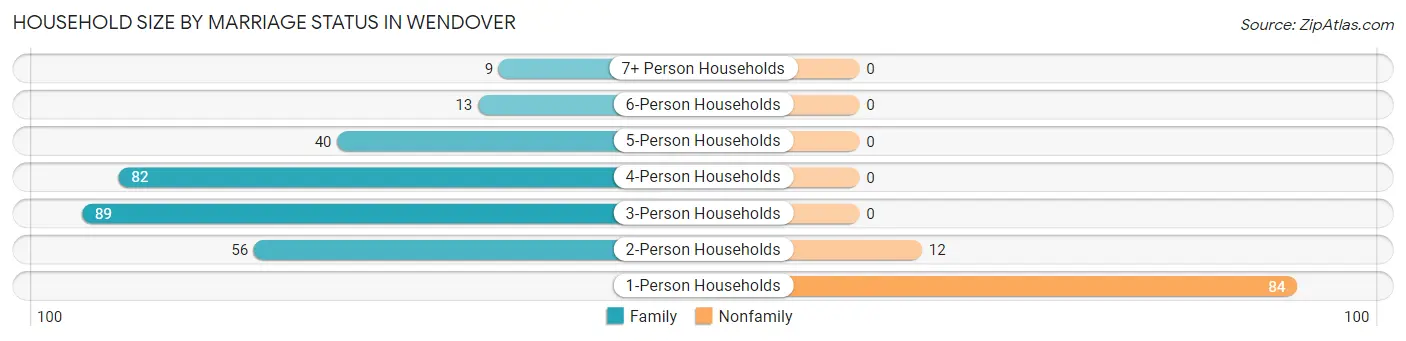
Out of a total of 385 households in Wendover, 289 (75.1%) are family households, while 96 (24.9%) are nonfamily households. The most numerous type of family households are 3-person households, comprising 89, and the most common type of nonfamily households are 1-person households, comprising 84.
| Household Size | Family Households | Nonfamily Households |
| 1-Person Households | - | 84 (21.8%) |
| 2-Person Households | 56 (14.5%) | 12 (3.1%) |
| 3-Person Households | 89 (23.1%) | 0 (0.0%) |
| 4-Person Households | 82 (21.3%) | 0 (0.0%) |
| 5-Person Households | 40 (10.4%) | 0 (0.0%) |
| 6-Person Households | 13 (3.4%) | 0 (0.0%) |
| 7+ Person Households | 9 (2.3%) | 0 (0.0%) |
| Total | 289 (75.1%) | 96 (24.9%) |
Female Fertility in Wendover
Fertility by Age in Wendover
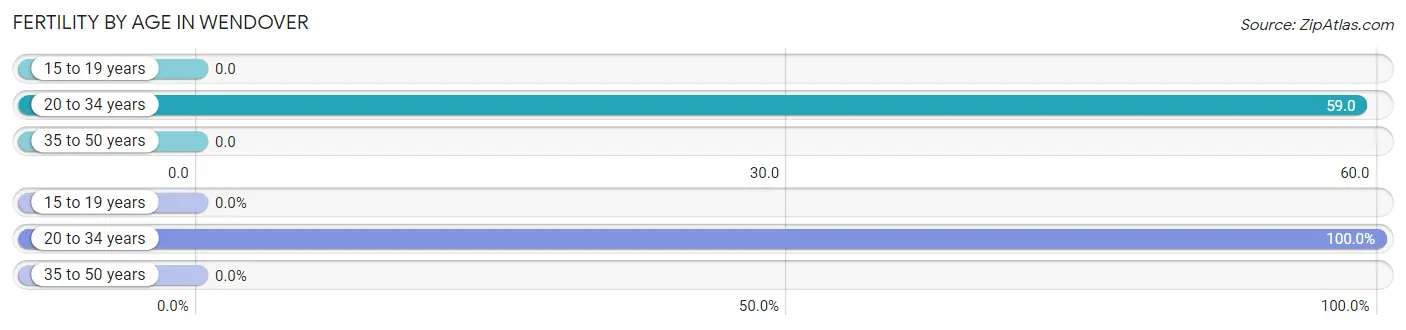
Average fertility rate in Wendover is 39.0 births per 1,000 women. Women in the age bracket of 20 to 34 years have the highest fertility rate with 59.0 births per 1,000 women. Women in the age bracket of 20 to 34 years acount for 100.0% of all women with births.
| Age Bracket | Women with Births | Births / 1,000 Women |
| 15 to 19 years | 0 (0.0%) | 0.0 |
| 20 to 34 years | 12 (100.0%) | 59.0 |
| 35 to 50 years | 0 (0.0%) | 0.0 |
| Total | 12 (100.0%) | 39.0 |
Fertility by Age by Marriage Status in Wendover
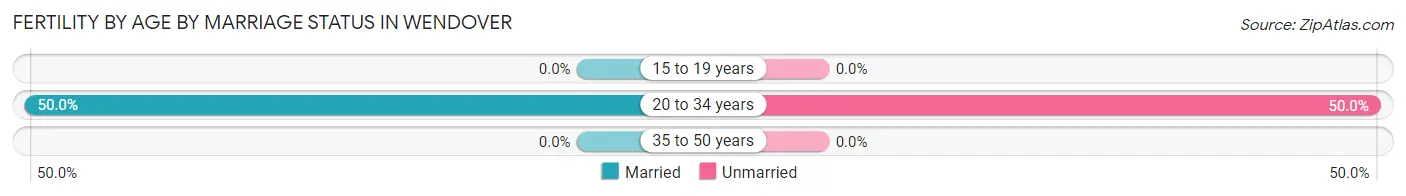
50.0% of women with births (12) in Wendover are married. The highest percentage of unmarried women with births falls into 20 to 34 years age bracket with 50.0% of them unmarried at the time of birth, while the lowest percentage of unmarried women with births belong to 20 to 34 years age bracket with 50.0% of them unmarried.
| Age Bracket | Married | Unmarried |
| 15 to 19 years | 0 (0.0%) | 0 (0.0%) |
| 20 to 34 years | 6 (50.0%) | 6 (50.0%) |
| 35 to 50 years | 0 (0.0%) | 0 (0.0%) |
| Total | 6 (50.0%) | 6 (50.0%) |
Fertility by Education in Wendover
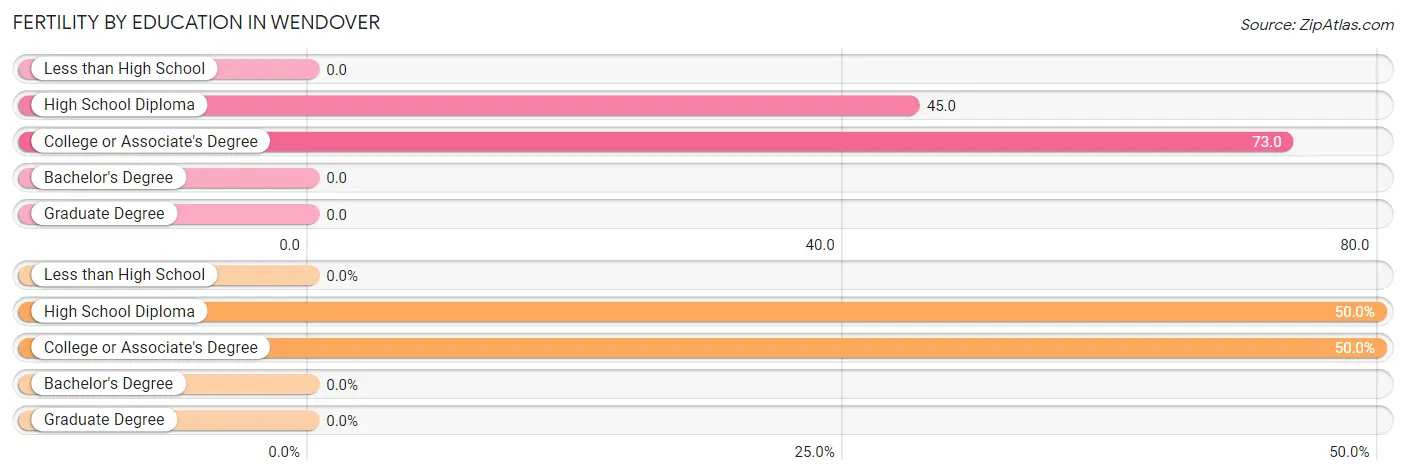
| Educational Attainment | Women with Births | Births / 1,000 Women |
| Less than High School | 0 (0.0%) | 0.0 |
| High School Diploma | 6 (50.0%) | 45.0 |
| College or Associate's Degree | 6 (50.0%) | 73.0 |
| Bachelor's Degree | 0 (0.0%) | 0.0 |
| Graduate Degree | 0 (0.0%) | 0.0 |
| Total | 12 (100.0%) | 39.0 |
Fertility by Education by Marriage Status in Wendover
50.0% of women with births in Wendover are unmarried. Women with the educational attainment of college or associate's degree are most likely to be married with 100.0% of them married at childbirth, while women with the educational attainment of high school diploma are least likely to be married with 100.0% of them unmarried at childbirth.
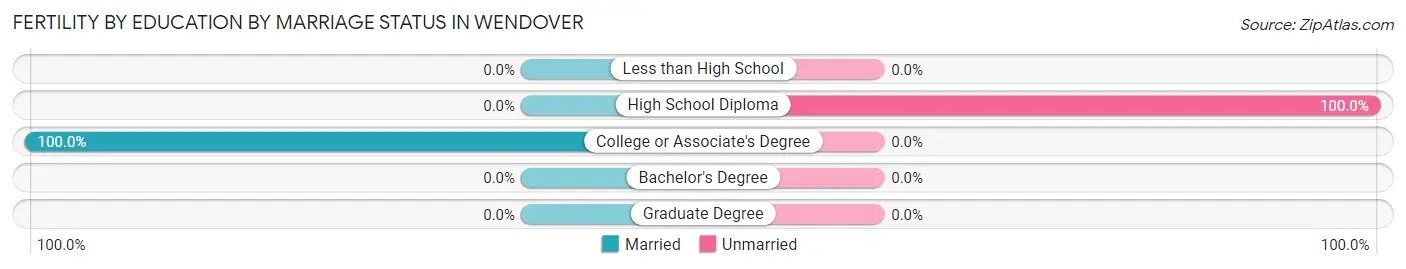
| Educational Attainment | Married | Unmarried |
| Less than High School | 0 (0.0%) | 0 (0.0%) |
| High School Diploma | 0 (0.0%) | 6 (100.0%) |
| College or Associate's Degree | 6 (100.0%) | 0 (0.0%) |
| Bachelor's Degree | 0 (0.0%) | 0 (0.0%) |
| Graduate Degree | 0 (0.0%) | 0 (0.0%) |
| Total | 6 (50.0%) | 6 (50.0%) |
Employment Characteristics in Wendover
Employment by Class of Employer in Wendover
Among the 569 employed individuals in Wendover, private company employees (421 | 74.0%), state government employees (62 | 10.9%), and local government employees (43 | 7.6%) make up the most common classes of employment.
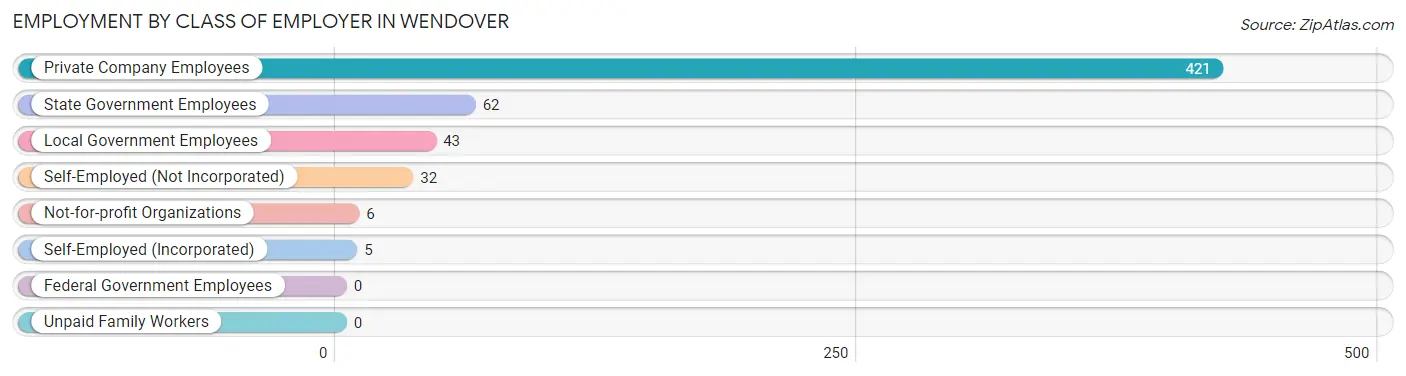
| Employer Class | # Employees | % Employees |
| Private Company Employees | 421 | 74.0% |
| Self-Employed (Incorporated) | 5 | 0.9% |
| Self-Employed (Not Incorporated) | 32 | 5.6% |
| Not-for-profit Organizations | 6 | 1.1% |
| Local Government Employees | 43 | 7.6% |
| State Government Employees | 62 | 10.9% |
| Federal Government Employees | 0 | 0.0% |
| Unpaid Family Workers | 0 | 0.0% |
| Total | 569 | 100.0% |
Employment Status by Age in Wendover
According to the labor force statistics for Wendover, out of the total population over 16 years of age (831), 70.9% or 589 individuals are in the labor force, with 3.4% or 20 of them unemployed. The age group with the highest labor force participation rate is 25 to 29 years, with 94.2% or 98 individuals in the labor force. Within the labor force, the 25 to 29 years age range has the highest percentage of unemployed individuals, with 16.3% or 16 of them being unemployed.
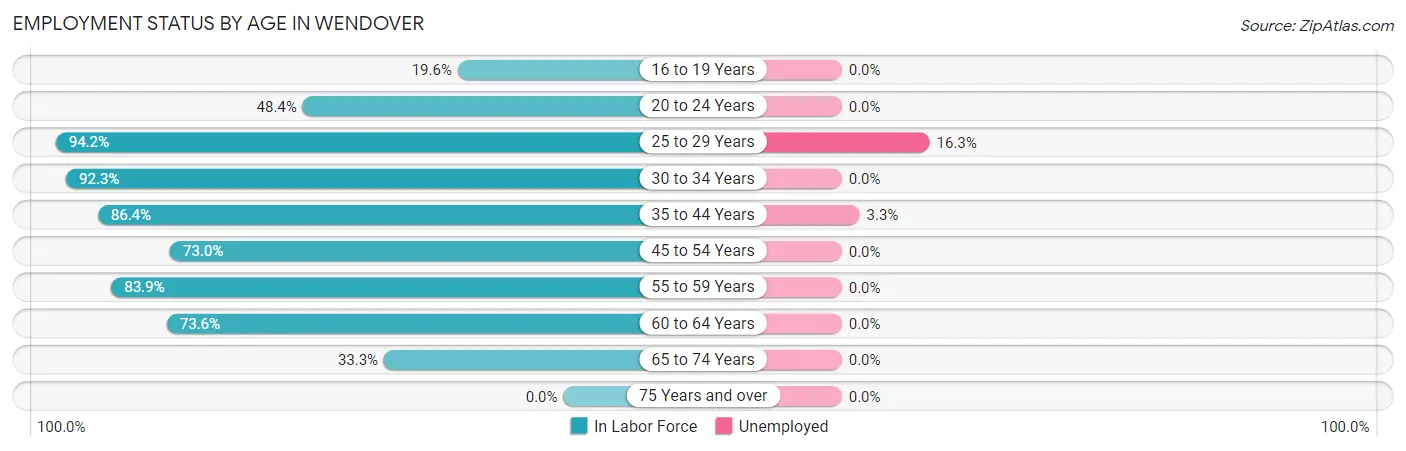
| Age Bracket | In Labor Force | Unemployed |
| 16 to 19 Years | 9 (19.6%) | 0 (0.0%) |
| 20 to 24 Years | 61 (48.4%) | 0 (0.0%) |
| 25 to 29 Years | 98 (94.2%) | 16 (16.3%) |
| 30 to 34 Years | 108 (92.3%) | 0 (0.0%) |
| 35 to 44 Years | 121 (86.4%) | 4 (3.3%) |
| 45 to 54 Years | 92 (73.0%) | 0 (0.0%) |
| 55 to 59 Years | 47 (83.9%) | 0 (0.0%) |
| 60 to 64 Years | 39 (73.6%) | 0 (0.0%) |
| 65 to 74 Years | 14 (33.3%) | 0 (0.0%) |
| 75 Years and over | 0 (0.0%) | 0 (0.0%) |
| Total | 589 (70.9%) | 20 (3.4%) |
Employment Status by Educational Attainment in Wendover
According to labor force statistics for Wendover, 84.7% of individuals (505) out of the total population between 25 and 64 years of age (596) are in the labor force, with 4.0% or 20 of them being unemployed. The group with the highest labor force participation rate are those with the educational attainment of high school diploma, with 97.4% or 186 individuals in the labor force. Within the labor force, individuals with less than high school education have the highest percentage of unemployment, with 7.2% or 9 of them being unemployed.
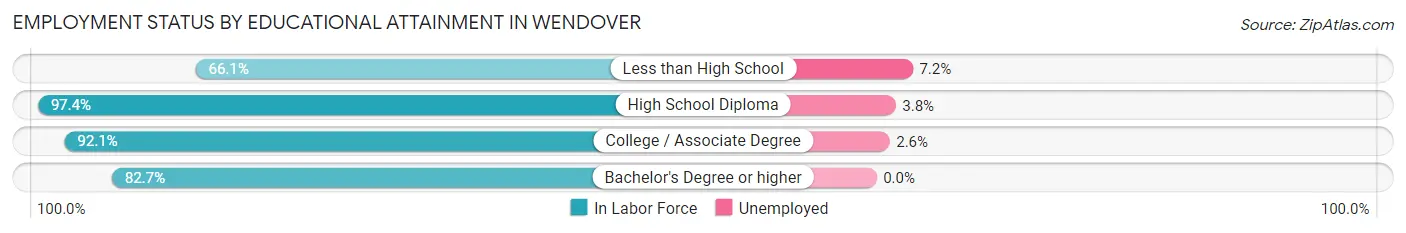
| Educational Attainment | In Labor Force | Unemployed |
| Less than High School | 125 (66.1%) | 14 (7.2%) |
| High School Diploma | 186 (97.4%) | 7 (3.8%) |
| College / Associate Degree | 151 (92.1%) | 4 (2.6%) |
| Bachelor's Degree or higher | 43 (82.7%) | 0 (0.0%) |
| Total | 505 (84.7%) | 24 (4.0%) |
Employment Occupations by Sex in Wendover
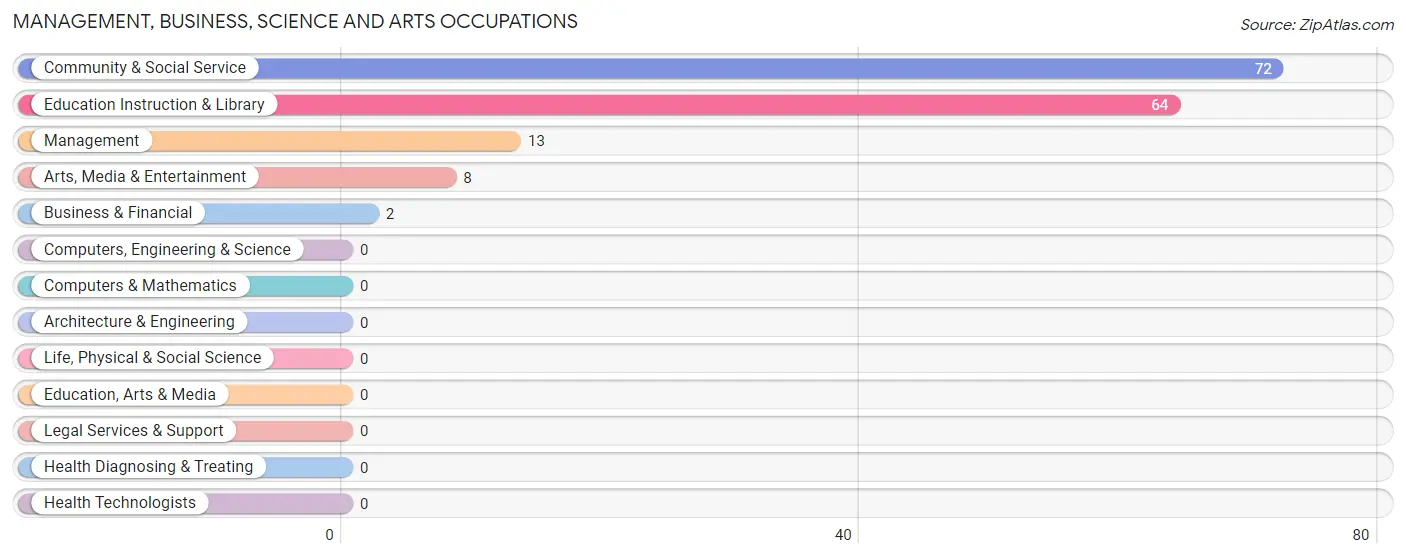
Management, Business, Science and Arts Occupations
The most common Management, Business, Science and Arts occupations in Wendover are Community & Social Service (72 | 12.7%), Education Instruction & Library (64 | 11.3%), Management (13 | 2.3%), Arts, Media & Entertainment (8 | 1.4%), and Business & Financial (2 | 0.4%).
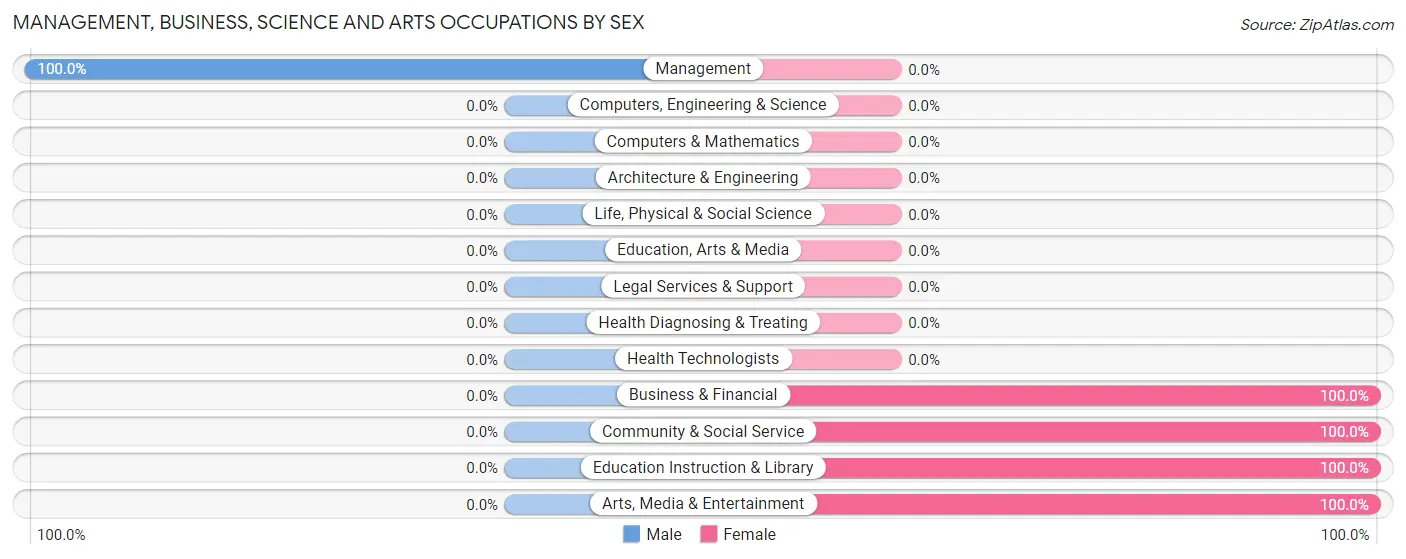
Management, Business, Science and Arts Occupations by Sex
| Occupation | Male | Female |
| Management | 13 (100.0%) | 0 (0.0%) |
| Business & Financial | 0 (0.0%) | 2 (100.0%) |
| Computers, Engineering & Science | 0 (0.0%) | 0 (0.0%) |
| Computers & Mathematics | 0 (0.0%) | 0 (0.0%) |
| Architecture & Engineering | 0 (0.0%) | 0 (0.0%) |
| Life, Physical & Social Science | 0 (0.0%) | 0 (0.0%) |
| Community & Social Service | 0 (0.0%) | 72 (100.0%) |
| Education, Arts & Media | 0 (0.0%) | 0 (0.0%) |
| Legal Services & Support | 0 (0.0%) | 0 (0.0%) |
| Education Instruction & Library | 0 (0.0%) | 64 (100.0%) |
| Arts, Media & Entertainment | 0 (0.0%) | 8 (100.0%) |
| Health Diagnosing & Treating | 0 (0.0%) | 0 (0.0%) |
| Health Technologists | 0 (0.0%) | 0 (0.0%) |
| Total (Category) | 13 (14.9%) | 74 (85.1%) |
| Total (Overall) | 355 (62.4%) | 214 (37.6%) |
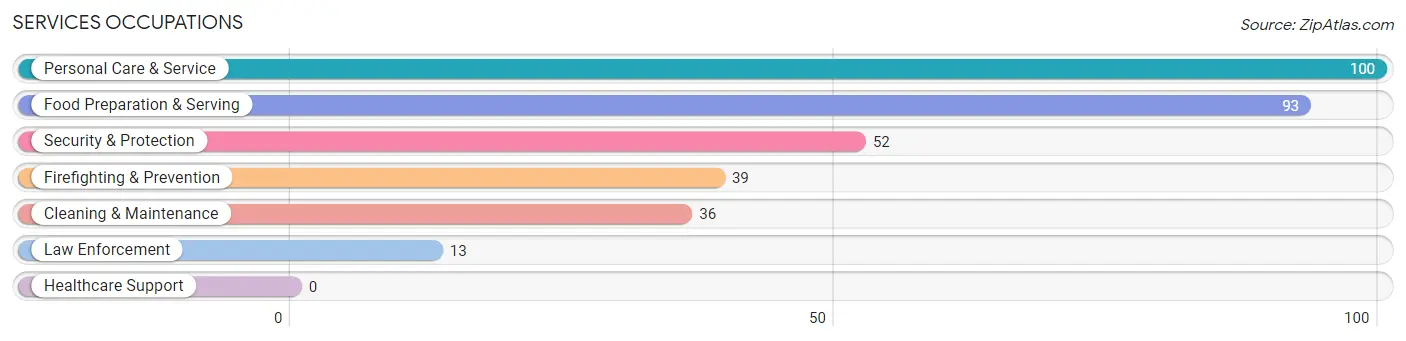
Services Occupations
The most common Services occupations in Wendover are Personal Care & Service (100 | 17.6%), Food Preparation & Serving (93 | 16.3%), Security & Protection (52 | 9.1%), Firefighting & Prevention (39 | 6.9%), and Cleaning & Maintenance (36 | 6.3%).
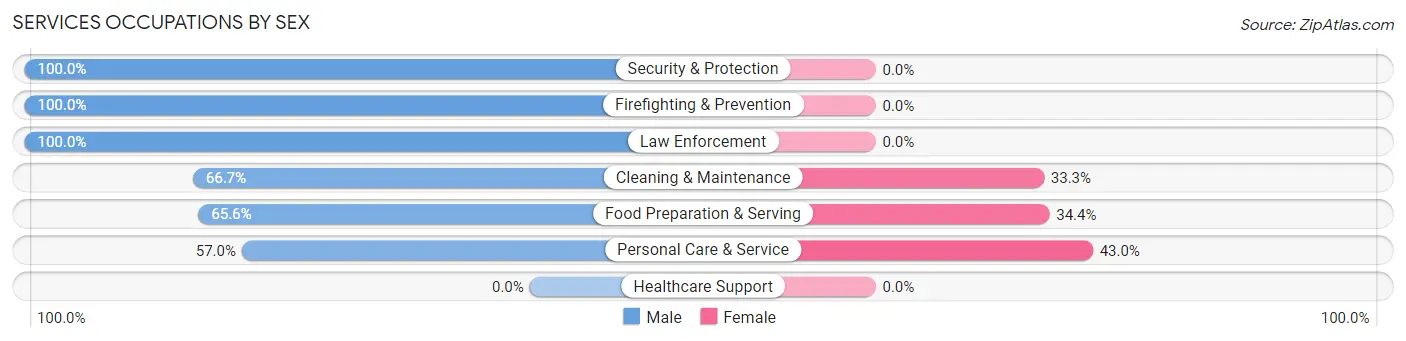
Services Occupations by Sex
Within the Services occupations in Wendover, the most male-oriented occupations are Security & Protection (100.0%), Firefighting & Prevention (100.0%), and Law Enforcement (100.0%), while the most female-oriented occupations are Personal Care & Service (43.0%), Food Preparation & Serving (34.4%), and Cleaning & Maintenance (33.3%).
| Occupation | Male | Female |
| Healthcare Support | 0 (0.0%) | 0 (0.0%) |
| Security & Protection | 52 (100.0%) | 0 (0.0%) |
| Firefighting & Prevention | 39 (100.0%) | 0 (0.0%) |
| Law Enforcement | 13 (100.0%) | 0 (0.0%) |
| Food Preparation & Serving | 61 (65.6%) | 32 (34.4%) |
| Cleaning & Maintenance | 24 (66.7%) | 12 (33.3%) |
| Personal Care & Service | 57 (57.0%) | 43 (43.0%) |
| Total (Category) | 194 (69.0%) | 87 (31.0%) |
| Total (Overall) | 355 (62.4%) | 214 (37.6%) |
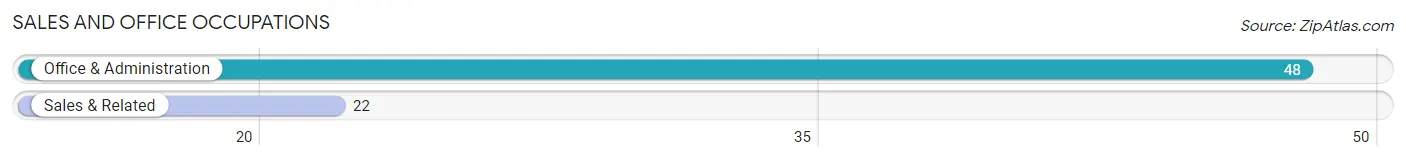
Sales and Office Occupations
The most common Sales and Office occupations in Wendover are Office & Administration (48 | 8.4%), and Sales & Related (22 | 3.9%).
Sales and Office Occupations by Sex
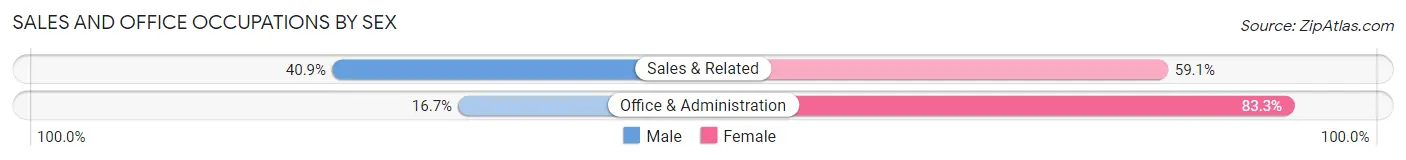
| Occupation | Male | Female |
| Sales & Related | 9 (40.9%) | 13 (59.1%) |
| Office & Administration | 8 (16.7%) | 40 (83.3%) |
| Total (Category) | 17 (24.3%) | 53 (75.7%) |
| Total (Overall) | 355 (62.4%) | 214 (37.6%) |
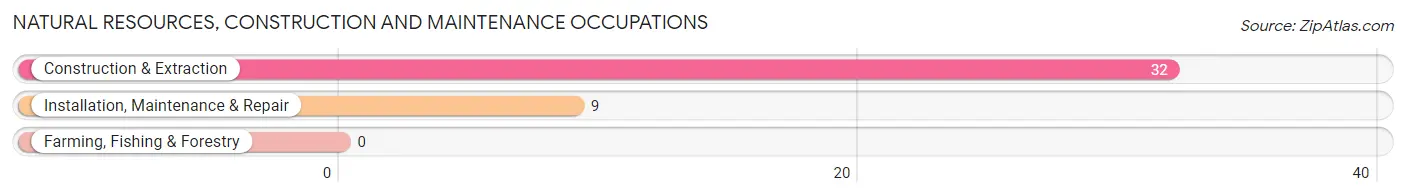
Natural Resources, Construction and Maintenance Occupations
The most common Natural Resources, Construction and Maintenance occupations in Wendover are Construction & Extraction (32 | 5.6%), and Installation, Maintenance & Repair (9 | 1.6%).
Natural Resources, Construction and Maintenance Occupations by Sex
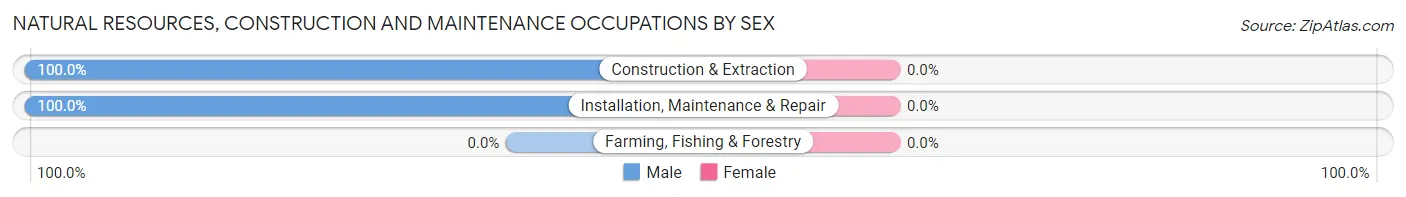
| Occupation | Male | Female |
| Farming, Fishing & Forestry | 0 (0.0%) | 0 (0.0%) |
| Construction & Extraction | 32 (100.0%) | 0 (0.0%) |
| Installation, Maintenance & Repair | 9 (100.0%) | 0 (0.0%) |
| Total (Category) | 41 (100.0%) | 0 (0.0%) |
| Total (Overall) | 355 (62.4%) | 214 (37.6%) |
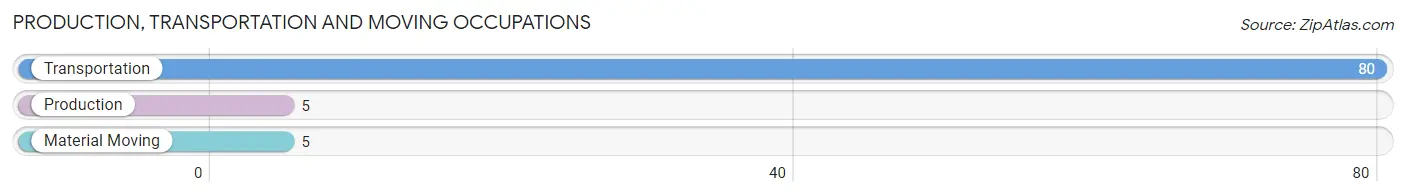
Production, Transportation and Moving Occupations
The most common Production, Transportation and Moving occupations in Wendover are Transportation (80 | 14.1%), Production (5 | 0.9%), and Material Moving (5 | 0.9%).
Production, Transportation and Moving Occupations by Sex
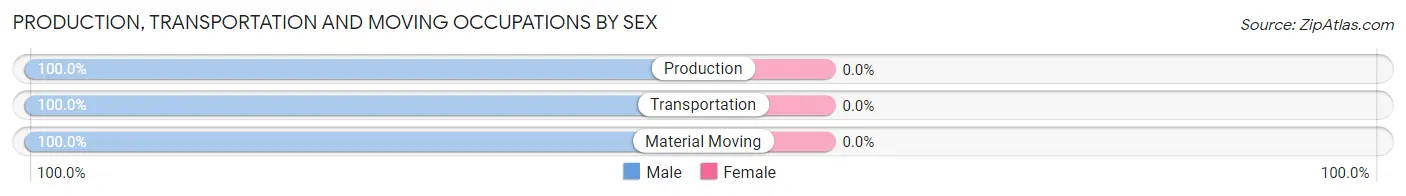
| Occupation | Male | Female |
| Production | 5 (100.0%) | 0 (0.0%) |
| Transportation | 80 (100.0%) | 0 (0.0%) |
| Material Moving | 5 (100.0%) | 0 (0.0%) |
| Total (Category) | 90 (100.0%) | 0 (0.0%) |
| Total (Overall) | 355 (62.4%) | 214 (37.6%) |
Employment Industries by Sex in Wendover
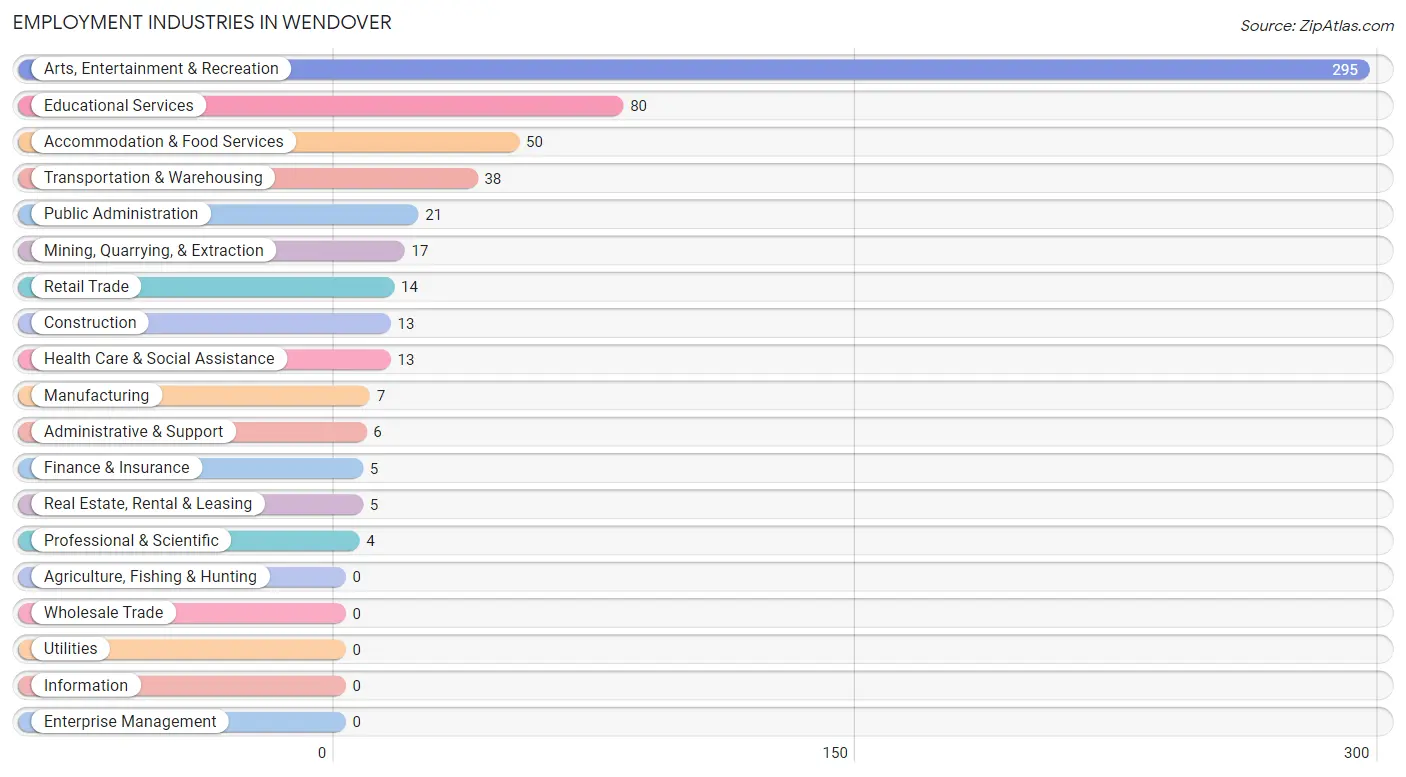
Employment Industries in Wendover
The major employment industries in Wendover include Arts, Entertainment & Recreation (295 | 51.8%), Educational Services (80 | 14.1%), Accommodation & Food Services (50 | 8.8%), Transportation & Warehousing (38 | 6.7%), and Public Administration (21 | 3.7%).
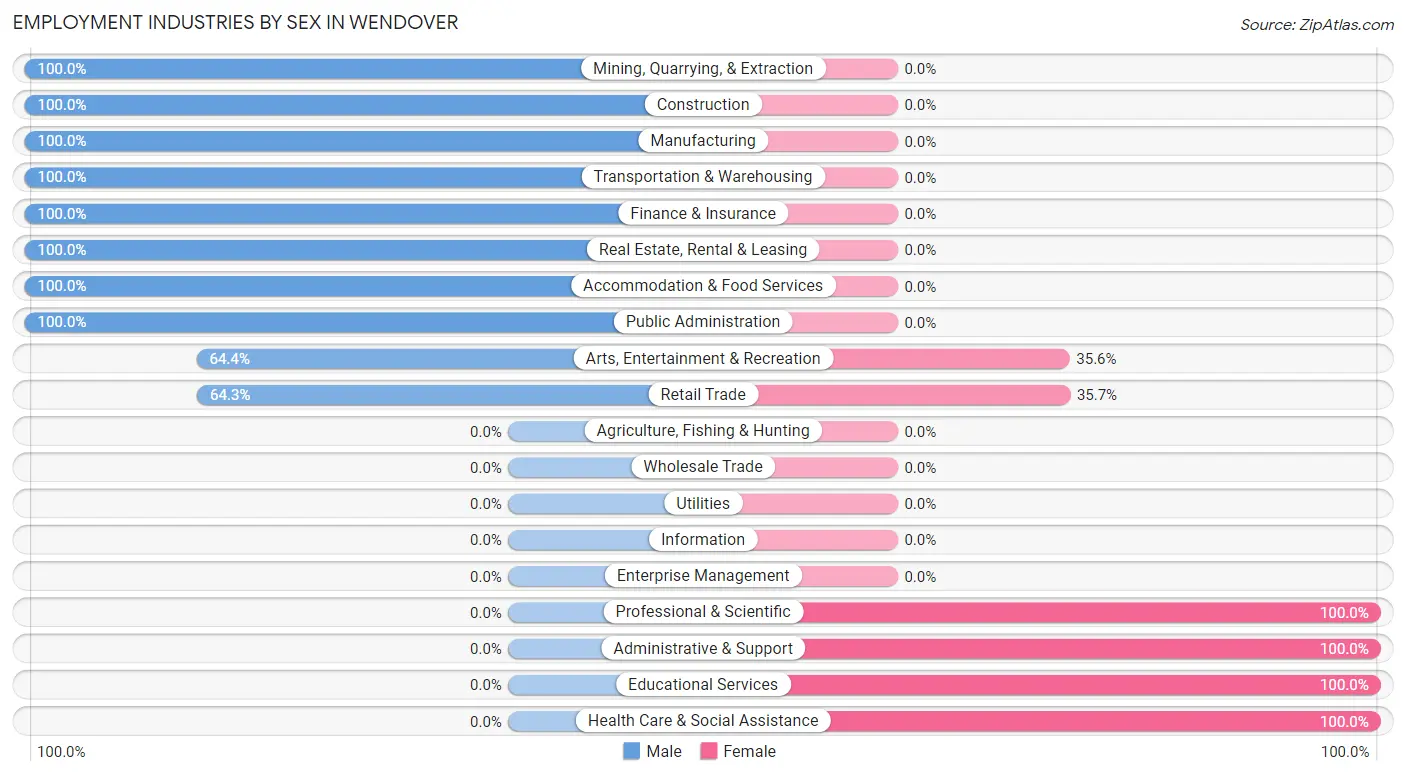
Employment Industries by Sex in Wendover
The Wendover industries that see more men than women are Mining, Quarrying, & Extraction (100.0%), Construction (100.0%), and Manufacturing (100.0%), whereas the industries that tend to have a higher number of women are Professional & Scientific (100.0%), Administrative & Support (100.0%), and Educational Services (100.0%).
| Industry | Male | Female |
| Agriculture, Fishing & Hunting | 0 (0.0%) | 0 (0.0%) |
| Mining, Quarrying, & Extraction | 17 (100.0%) | 0 (0.0%) |
| Construction | 13 (100.0%) | 0 (0.0%) |
| Manufacturing | 7 (100.0%) | 0 (0.0%) |
| Wholesale Trade | 0 (0.0%) | 0 (0.0%) |
| Retail Trade | 9 (64.3%) | 5 (35.7%) |
| Transportation & Warehousing | 38 (100.0%) | 0 (0.0%) |
| Utilities | 0 (0.0%) | 0 (0.0%) |
| Information | 0 (0.0%) | 0 (0.0%) |
| Finance & Insurance | 5 (100.0%) | 0 (0.0%) |
| Real Estate, Rental & Leasing | 5 (100.0%) | 0 (0.0%) |
| Professional & Scientific | 0 (0.0%) | 4 (100.0%) |
| Enterprise Management | 0 (0.0%) | 0 (0.0%) |
| Administrative & Support | 0 (0.0%) | 6 (100.0%) |
| Educational Services | 0 (0.0%) | 80 (100.0%) |
| Health Care & Social Assistance | 0 (0.0%) | 13 (100.0%) |
| Arts, Entertainment & Recreation | 190 (64.4%) | 105 (35.6%) |
| Accommodation & Food Services | 50 (100.0%) | 0 (0.0%) |
| Public Administration | 21 (100.0%) | 0 (0.0%) |
| Total | 355 (62.4%) | 214 (37.6%) |
Education in Wendover
School Enrollment in Wendover
The most common levels of schooling among the 350 students in Wendover are elementary school (105 | 30.0%), nursery / preschool (68 | 19.4%), and college / undergraduate (52 | 14.9%).
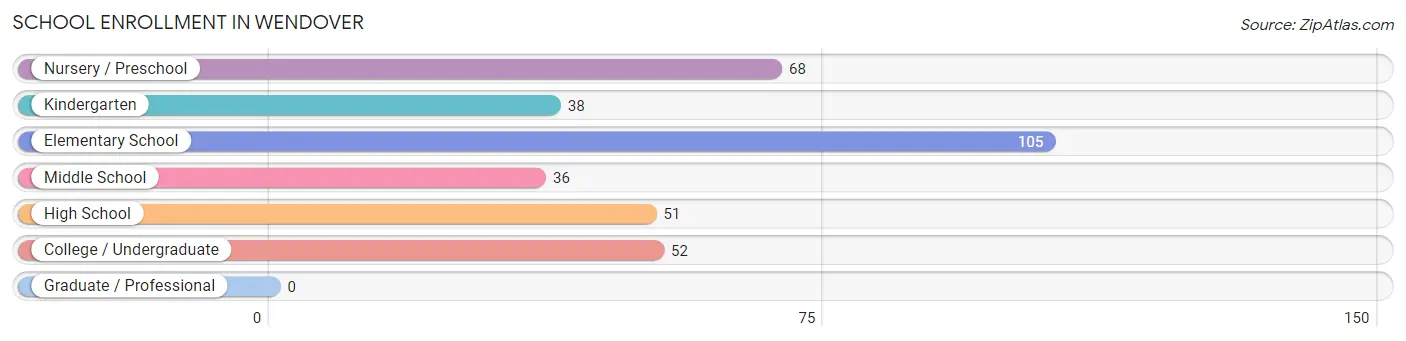
| School Level | # Students | % Students |
| Nursery / Preschool | 68 | 19.4% |
| Kindergarten | 38 | 10.9% |
| Elementary School | 105 | 30.0% |
| Middle School | 36 | 10.3% |
| High School | 51 | 14.6% |
| College / Undergraduate | 52 | 14.9% |
| Graduate / Professional | 0 | 0.0% |
| Total | 350 | 100.0% |
School Enrollment by Age by Funding Source in Wendover
Out of a total of 350 students who are enrolled in schools in Wendover, 7 (2.0%) attend a private institution, while the remaining 343 (98.0%) are enrolled in public schools. The age group of 5 to 9 year old has the highest likelihood of being enrolled in private schools, with 7 (6.2% in the age bracket) enrolled. Conversely, the age group of 3 to 4 year olds has the lowest likelihood of being enrolled in a private school, with 49 (100.0% in the age bracket) attending a public institution.
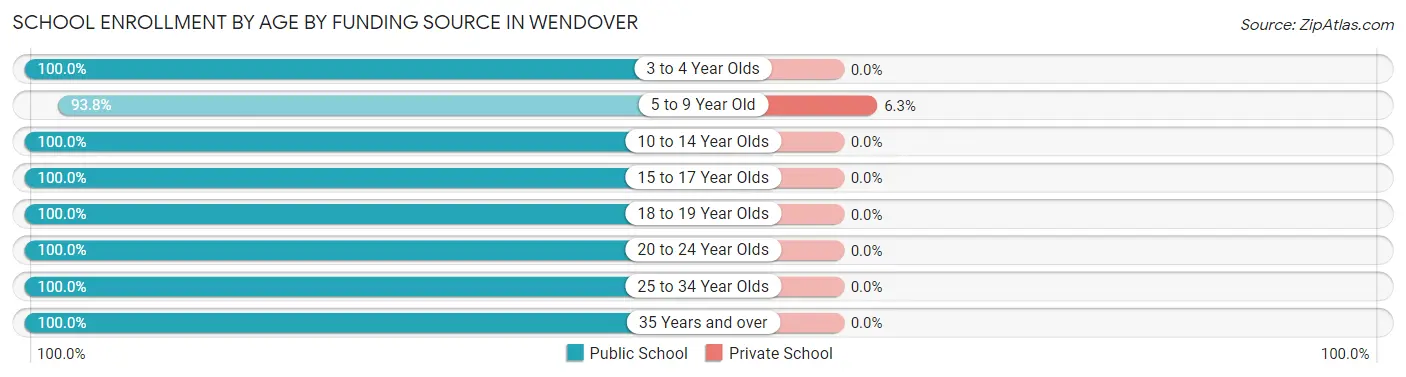
| Age Bracket | Public School | Private School |
| 3 to 4 Year Olds | 49 (100.0%) | 0 (0.0%) |
| 5 to 9 Year Old | 105 (93.8%) | 7 (6.2%) |
| 10 to 14 Year Olds | 98 (100.0%) | 0 (0.0%) |
| 15 to 17 Year Olds | 34 (100.0%) | 0 (0.0%) |
| 18 to 19 Year Olds | 5 (100.0%) | 0 (0.0%) |
| 20 to 24 Year Olds | 29 (100.0%) | 0 (0.0%) |
| 25 to 34 Year Olds | 17 (100.0%) | 0 (0.0%) |
| 35 Years and over | 6 (100.0%) | 0 (0.0%) |
| Total | 343 (98.0%) | 7 (2.0%) |
Educational Attainment by Field of Study in Wendover
Education (32 | 55.2%), business (11 | 19.0%), computers & mathematics (6 | 10.3%), visual & performing arts (6 | 10.3%), and communications (3 | 5.2%) are the most common fields of study among 58 individuals in Wendover who have obtained a bachelor's degree or higher.
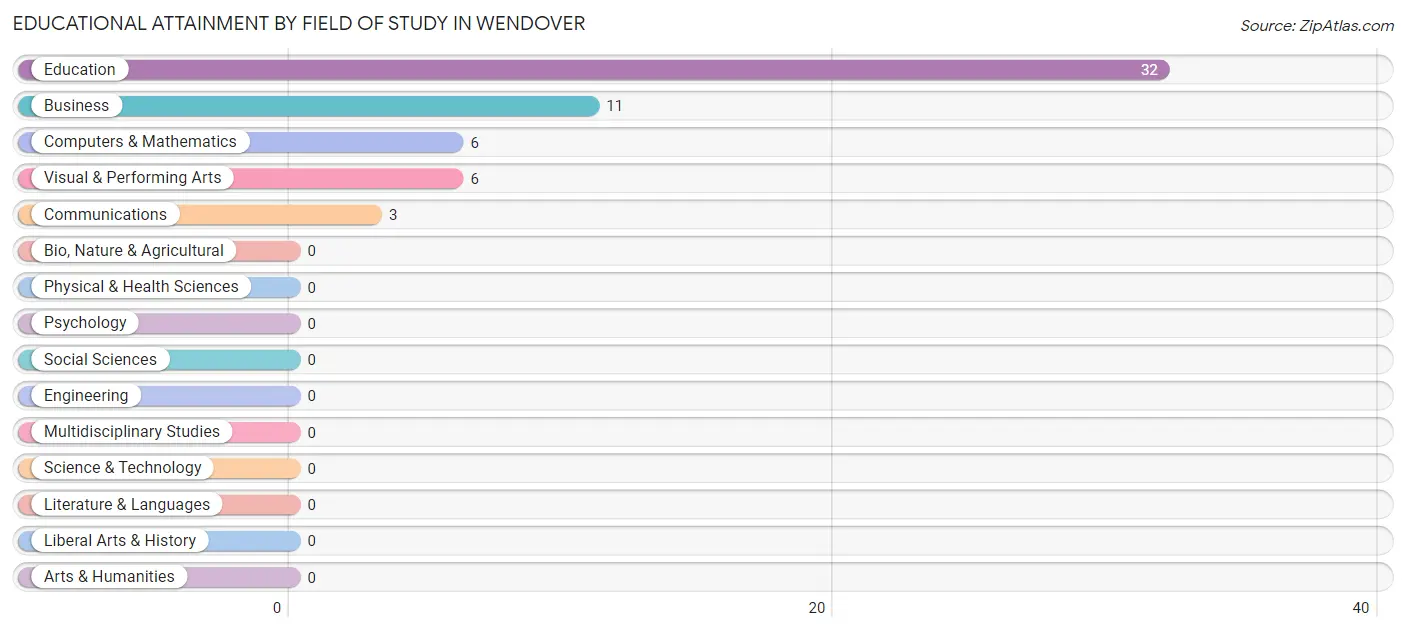
| Field of Study | # Graduates | % Graduates |
| Computers & Mathematics | 6 | 10.3% |
| Bio, Nature & Agricultural | 0 | 0.0% |
| Physical & Health Sciences | 0 | 0.0% |
| Psychology | 0 | 0.0% |
| Social Sciences | 0 | 0.0% |
| Engineering | 0 | 0.0% |
| Multidisciplinary Studies | 0 | 0.0% |
| Science & Technology | 0 | 0.0% |
| Business | 11 | 19.0% |
| Education | 32 | 55.2% |
| Literature & Languages | 0 | 0.0% |
| Liberal Arts & History | 0 | 0.0% |
| Visual & Performing Arts | 6 | 10.3% |
| Communications | 3 | 5.2% |
| Arts & Humanities | 0 | 0.0% |
| Total | 58 | 100.0% |
Transportation & Commute in Wendover
Vehicle Availability by Sex in Wendover
The most prevalent vehicle ownership categories in Wendover are males with 2 vehicles (167, accounting for 47.0%) and females with 2 vehicles (83, making up 78.0%).
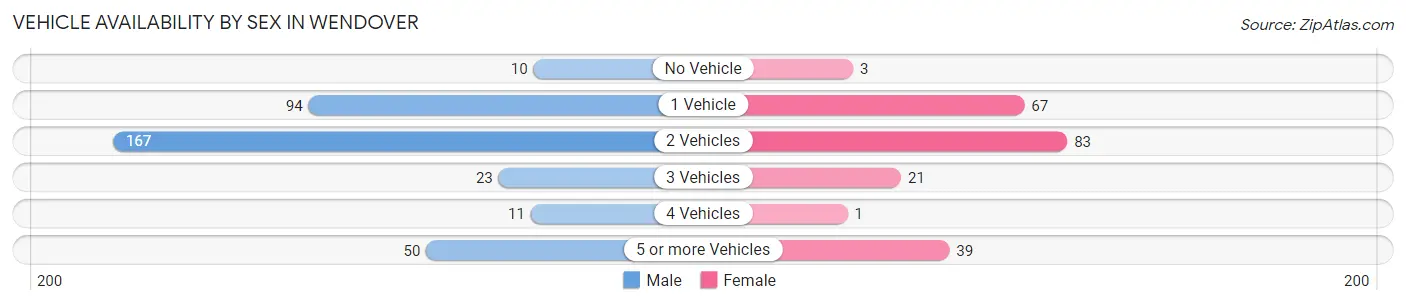
| Vehicles Available | Male | Female |
| No Vehicle | 10 (2.8%) | 3 (1.4%) |
| 1 Vehicle | 94 (26.5%) | 67 (31.3%) |
| 2 Vehicles | 167 (47.0%) | 83 (38.8%) |
| 3 Vehicles | 23 (6.5%) | 21 (9.8%) |
| 4 Vehicles | 11 (3.1%) | 1 (0.5%) |
| 5 or more Vehicles | 50 (14.1%) | 39 (18.2%) |
| Total | 355 (100.0%) | 214 (100.0%) |
Commute Time in Wendover
The most frequently occuring commute durations in Wendover are 5 to 9 minutes (349 commuters, 64.6%), 10 to 14 minutes (62 commuters, 11.5%), and 15 to 19 minutes (44 commuters, 8.2%).
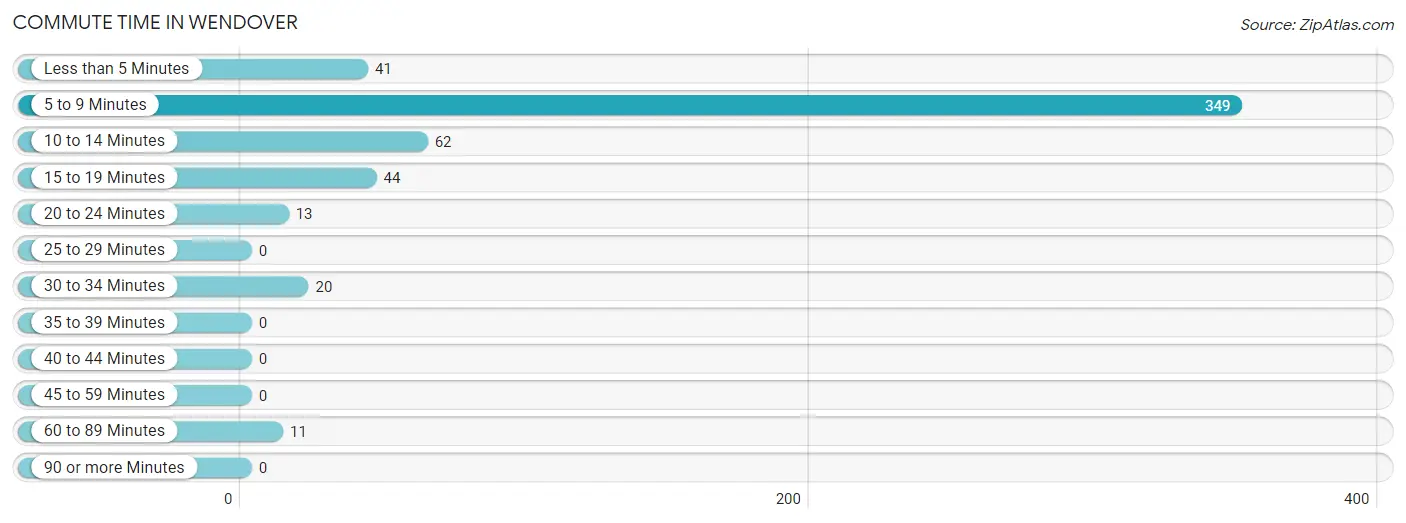
| Commute Time | # Commuters | % Commuters |
| Less than 5 Minutes | 41 | 7.6% |
| 5 to 9 Minutes | 349 | 64.6% |
| 10 to 14 Minutes | 62 | 11.5% |
| 15 to 19 Minutes | 44 | 8.2% |
| 20 to 24 Minutes | 13 | 2.4% |
| 25 to 29 Minutes | 0 | 0.0% |
| 30 to 34 Minutes | 20 | 3.7% |
| 35 to 39 Minutes | 0 | 0.0% |
| 40 to 44 Minutes | 0 | 0.0% |
| 45 to 59 Minutes | 0 | 0.0% |
| 60 to 89 Minutes | 11 | 2.0% |
| 90 or more Minutes | 0 | 0.0% |
Commute Time by Sex in Wendover
The most common commute times in Wendover are 5 to 9 minutes (233 commuters, 68.9%) for males and 5 to 9 minutes (116 commuters, 57.4%) for females.
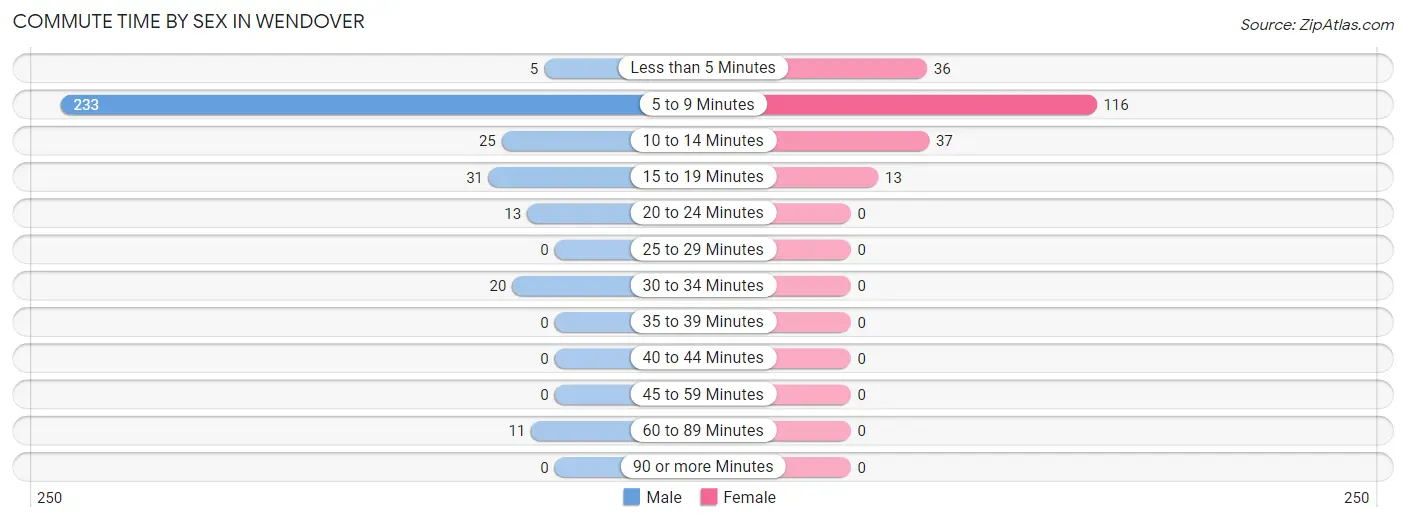
| Commute Time | Male | Female |
| Less than 5 Minutes | 5 (1.5%) | 36 (17.8%) |
| 5 to 9 Minutes | 233 (68.9%) | 116 (57.4%) |
| 10 to 14 Minutes | 25 (7.4%) | 37 (18.3%) |
| 15 to 19 Minutes | 31 (9.2%) | 13 (6.4%) |
| 20 to 24 Minutes | 13 (3.8%) | 0 (0.0%) |
| 25 to 29 Minutes | 0 (0.0%) | 0 (0.0%) |
| 30 to 34 Minutes | 20 (5.9%) | 0 (0.0%) |
| 35 to 39 Minutes | 0 (0.0%) | 0 (0.0%) |
| 40 to 44 Minutes | 0 (0.0%) | 0 (0.0%) |
| 45 to 59 Minutes | 0 (0.0%) | 0 (0.0%) |
| 60 to 89 Minutes | 11 (3.3%) | 0 (0.0%) |
| 90 or more Minutes | 0 (0.0%) | 0 (0.0%) |
Time of Departure to Work by Sex in Wendover
The most frequent times of departure to work in Wendover are 12:00 PM to 3:59 PM (92, 27.2%) for males and 7:30 AM to 7:59 AM (46, 22.8%) for females.
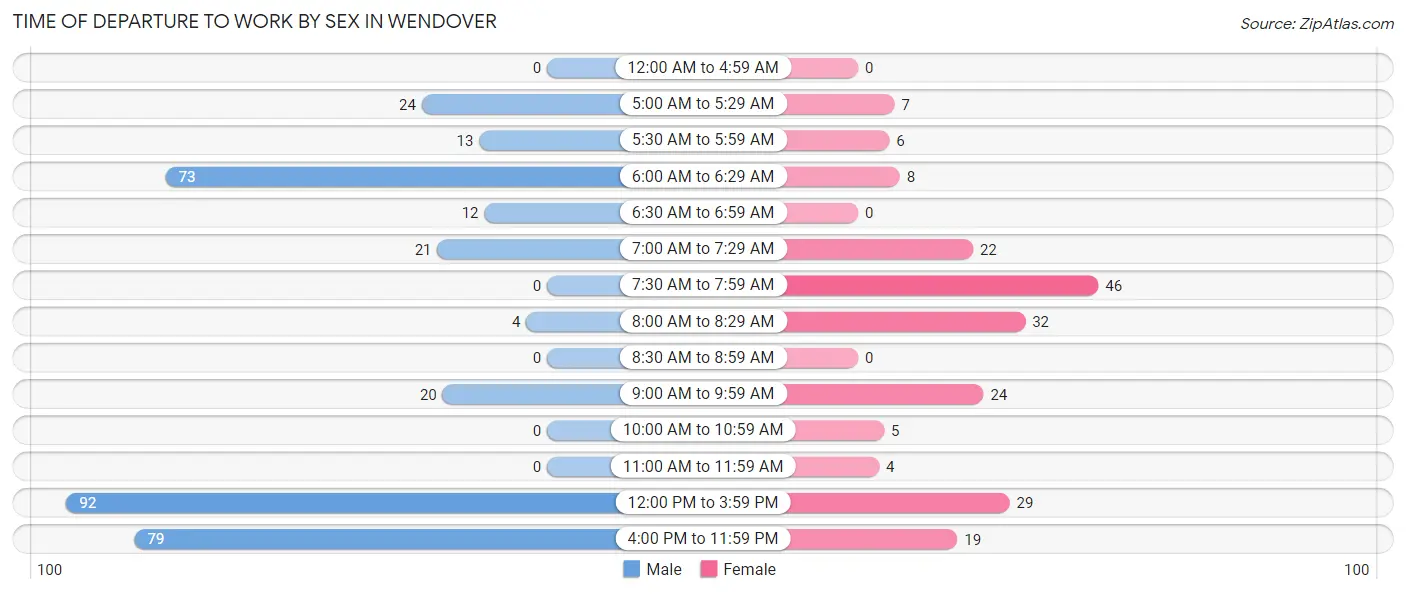
| Time of Departure | Male | Female |
| 12:00 AM to 4:59 AM | 0 (0.0%) | 0 (0.0%) |
| 5:00 AM to 5:29 AM | 24 (7.1%) | 7 (3.5%) |
| 5:30 AM to 5:59 AM | 13 (3.8%) | 6 (3.0%) |
| 6:00 AM to 6:29 AM | 73 (21.6%) | 8 (4.0%) |
| 6:30 AM to 6:59 AM | 12 (3.5%) | 0 (0.0%) |
| 7:00 AM to 7:29 AM | 21 (6.2%) | 22 (10.9%) |
| 7:30 AM to 7:59 AM | 0 (0.0%) | 46 (22.8%) |
| 8:00 AM to 8:29 AM | 4 (1.2%) | 32 (15.8%) |
| 8:30 AM to 8:59 AM | 0 (0.0%) | 0 (0.0%) |
| 9:00 AM to 9:59 AM | 20 (5.9%) | 24 (11.9%) |
| 10:00 AM to 10:59 AM | 0 (0.0%) | 5 (2.5%) |
| 11:00 AM to 11:59 AM | 0 (0.0%) | 4 (2.0%) |
| 12:00 PM to 3:59 PM | 92 (27.2%) | 29 (14.4%) |
| 4:00 PM to 11:59 PM | 79 (23.4%) | 19 (9.4%) |
| Total | 338 (100.0%) | 202 (100.0%) |
Housing Occupancy in Wendover
Occupancy by Ownership in Wendover
Of the total 385 dwellings in Wendover, owner-occupied units account for 99 (25.7%), while renter-occupied units make up 286 (74.3%).
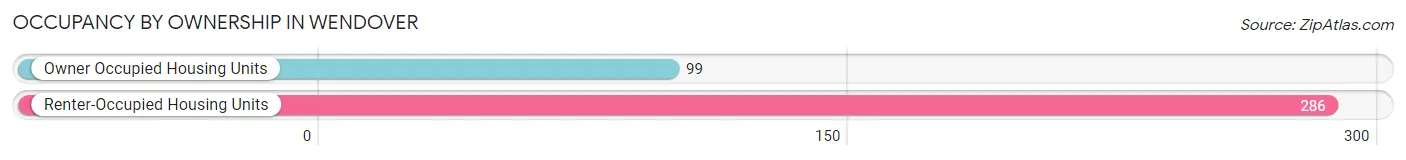
| Occupancy | # Housing Units | % Housing Units |
| Owner Occupied Housing Units | 99 | 25.7% |
| Renter-Occupied Housing Units | 286 | 74.3% |
| Total Occupied Housing Units | 385 | 100.0% |
Occupancy by Household Size in Wendover
| Household Size | # Housing Units | % Housing Units |
| 1-Person Household | 84 | 21.8% |
| 2-Person Household | 68 | 17.7% |
| 3-Person Household | 89 | 23.1% |
| 4+ Person Household | 144 | 37.4% |
| Total Housing Units | 385 | 100.0% |
Occupancy by Ownership by Household Size in Wendover
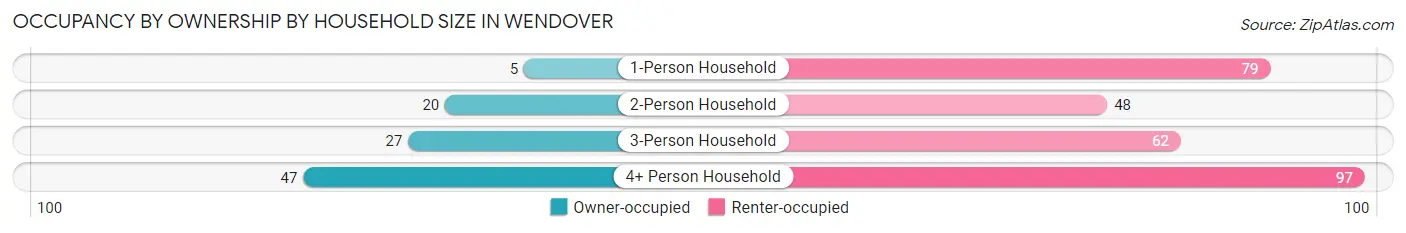
| Household Size | Owner-occupied | Renter-occupied |
| 1-Person Household | 5 (5.9%) | 79 (94.1%) |
| 2-Person Household | 20 (29.4%) | 48 (70.6%) |
| 3-Person Household | 27 (30.3%) | 62 (69.7%) |
| 4+ Person Household | 47 (32.6%) | 97 (67.4%) |
| Total Housing Units | 99 (25.7%) | 286 (74.3%) |
Occupancy by Educational Attainment in Wendover
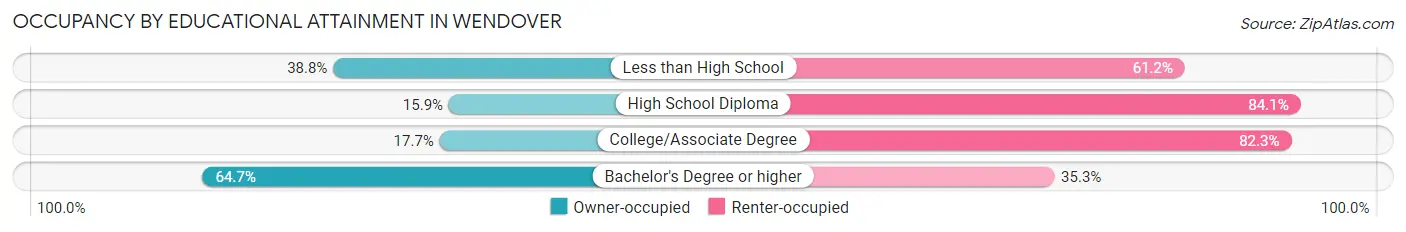
| Household Size | Owner-occupied | Renter-occupied |
| Less than High School | 33 (38.8%) | 52 (61.2%) |
| High School Diploma | 27 (15.9%) | 143 (84.1%) |
| College/Associate Degree | 17 (17.7%) | 79 (82.3%) |
| Bachelor's Degree or higher | 22 (64.7%) | 12 (35.3%) |
Occupancy by Age of Householder in Wendover
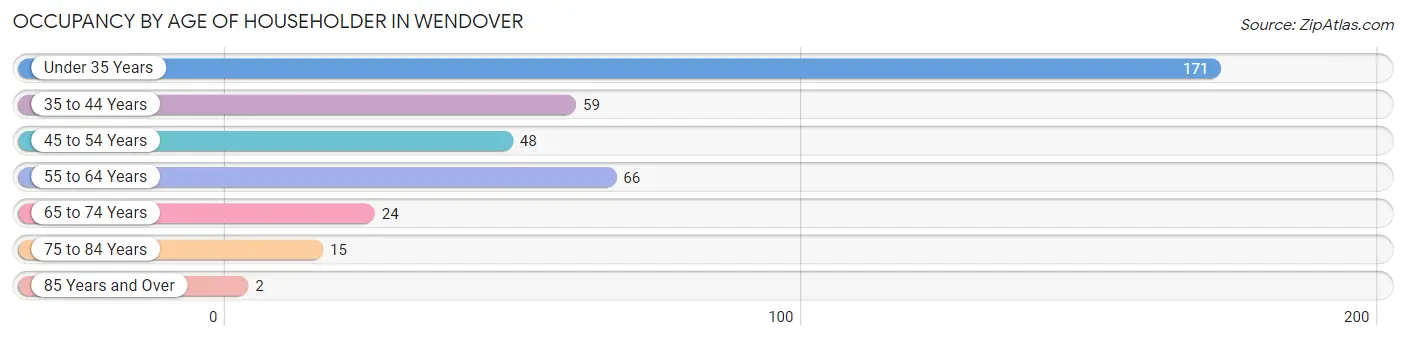
| Age Bracket | # Households | % Households |
| Under 35 Years | 171 | 44.4% |
| 35 to 44 Years | 59 | 15.3% |
| 45 to 54 Years | 48 | 12.5% |
| 55 to 64 Years | 66 | 17.1% |
| 65 to 74 Years | 24 | 6.2% |
| 75 to 84 Years | 15 | 3.9% |
| 85 Years and Over | 2 | 0.5% |
| Total | 385 | 100.0% |
Housing Finances in Wendover
Median Income by Occupancy in Wendover
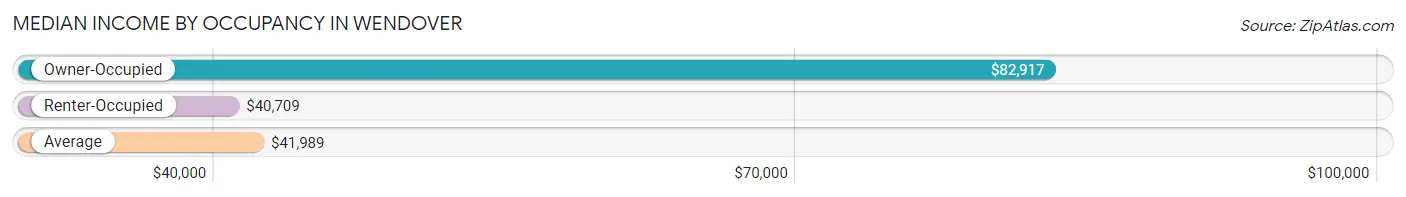
| Occupancy Type | # Households | Median Income |
| Owner-Occupied | 99 (25.7%) | $82,917 |
| Renter-Occupied | 286 (74.3%) | $40,709 |
| Average | 385 (100.0%) | $41,989 |
Occupancy by Householder Income Bracket in Wendover
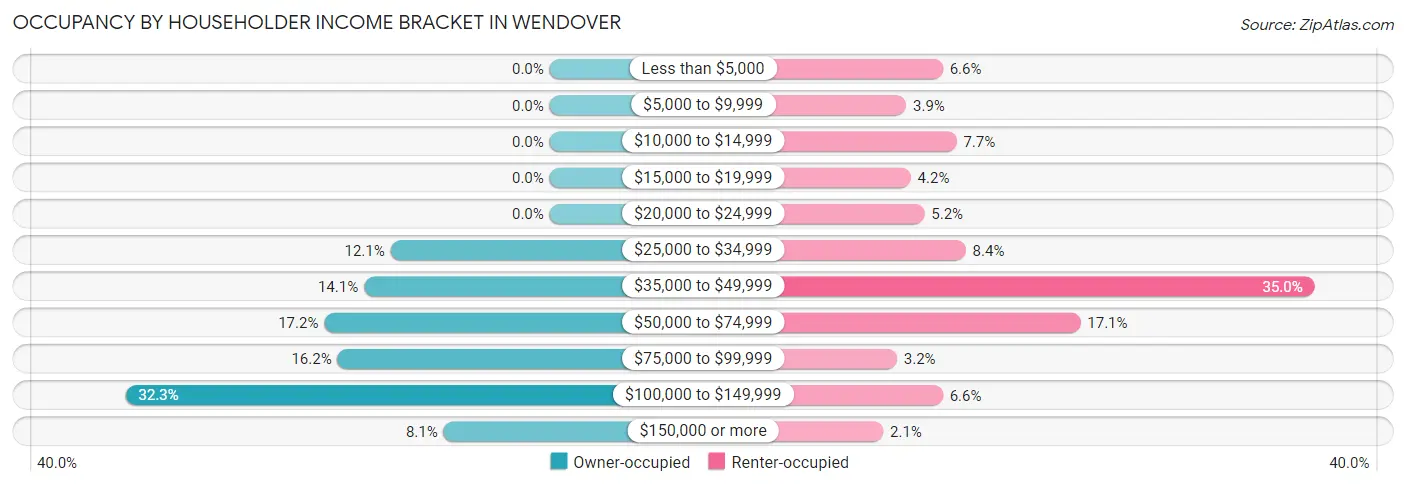
| Income Bracket | Owner-occupied | Renter-occupied |
| Less than $5,000 | 0 (0.0%) | 19 (6.6%) |
| $5,000 to $9,999 | 0 (0.0%) | 11 (3.8%) |
| $10,000 to $14,999 | 0 (0.0%) | 22 (7.7%) |
| $15,000 to $19,999 | 0 (0.0%) | 12 (4.2%) |
| $20,000 to $24,999 | 0 (0.0%) | 15 (5.2%) |
| $25,000 to $34,999 | 12 (12.1%) | 24 (8.4%) |
| $35,000 to $49,999 | 14 (14.1%) | 100 (35.0%) |
| $50,000 to $74,999 | 17 (17.2%) | 49 (17.1%) |
| $75,000 to $99,999 | 16 (16.2%) | 9 (3.2%) |
| $100,000 to $149,999 | 32 (32.3%) | 19 (6.6%) |
| $150,000 or more | 8 (8.1%) | 6 (2.1%) |
| Total | 99 (100.0%) | 286 (100.0%) |
Monthly Housing Cost Tiers in Wendover
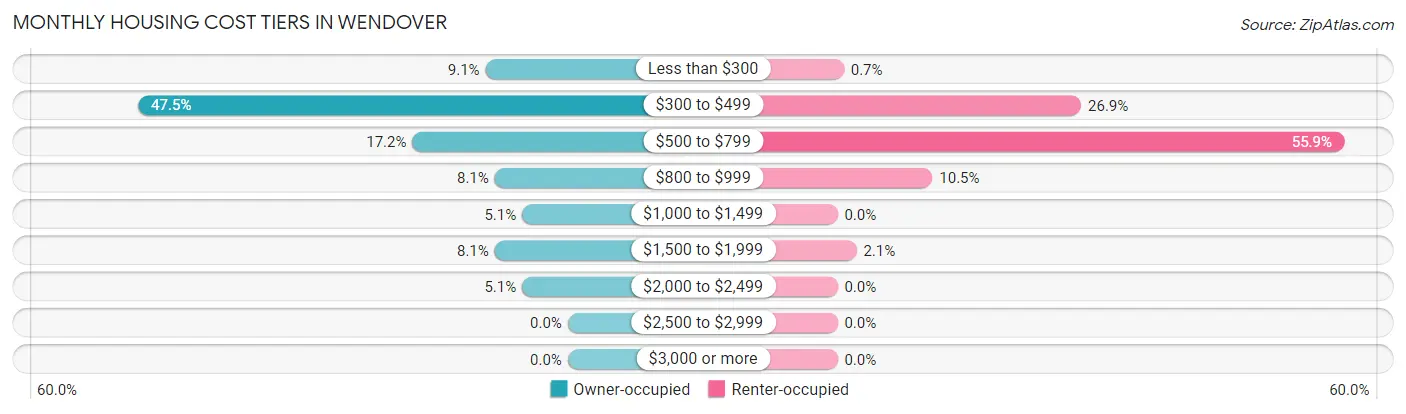
| Monthly Cost | Owner-occupied | Renter-occupied |
| Less than $300 | 9 (9.1%) | 2 (0.7%) |
| $300 to $499 | 47 (47.5%) | 77 (26.9%) |
| $500 to $799 | 17 (17.2%) | 160 (55.9%) |
| $800 to $999 | 8 (8.1%) | 30 (10.5%) |
| $1,000 to $1,499 | 5 (5.1%) | 0 (0.0%) |
| $1,500 to $1,999 | 8 (8.1%) | 6 (2.1%) |
| $2,000 to $2,499 | 5 (5.1%) | 0 (0.0%) |
| $2,500 to $2,999 | 0 (0.0%) | 0 (0.0%) |
| $3,000 or more | 0 (0.0%) | 0 (0.0%) |
| Total | 99 (100.0%) | 286 (100.0%) |
Physical Housing Characteristics in Wendover
Housing Structures in Wendover
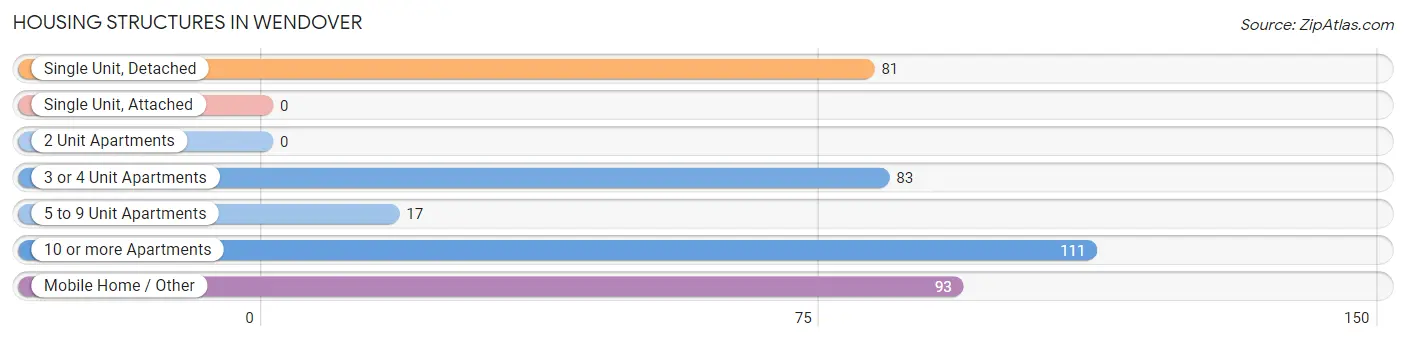
| Structure Type | # Housing Units | % Housing Units |
| Single Unit, Detached | 81 | 21.0% |
| Single Unit, Attached | 0 | 0.0% |
| 2 Unit Apartments | 0 | 0.0% |
| 3 or 4 Unit Apartments | 83 | 21.6% |
| 5 to 9 Unit Apartments | 17 | 4.4% |
| 10 or more Apartments | 111 | 28.8% |
| Mobile Home / Other | 93 | 24.2% |
| Total | 385 | 100.0% |
Housing Structures by Occupancy in Wendover
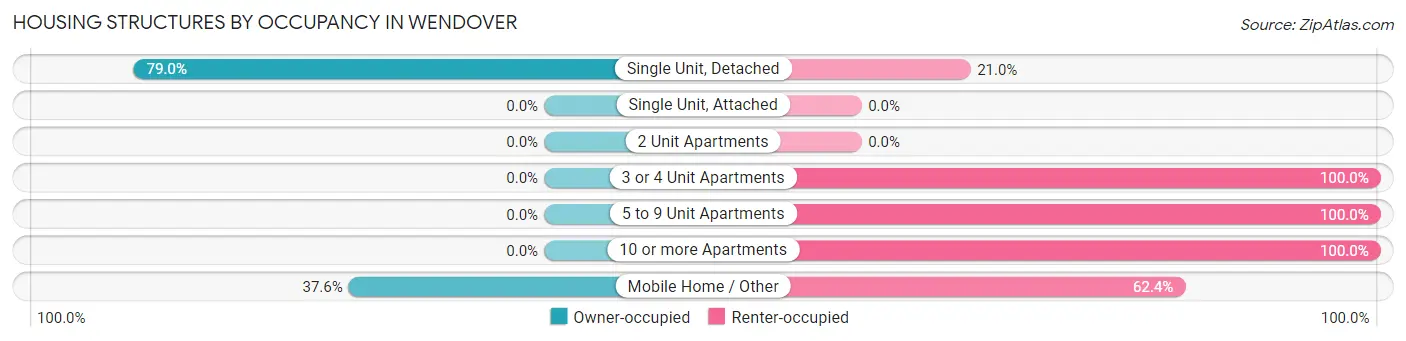
| Structure Type | Owner-occupied | Renter-occupied |
| Single Unit, Detached | 64 (79.0%) | 17 (21.0%) |
| Single Unit, Attached | 0 (0.0%) | 0 (0.0%) |
| 2 Unit Apartments | 0 (0.0%) | 0 (0.0%) |
| 3 or 4 Unit Apartments | 0 (0.0%) | 83 (100.0%) |
| 5 to 9 Unit Apartments | 0 (0.0%) | 17 (100.0%) |
| 10 or more Apartments | 0 (0.0%) | 111 (100.0%) |
| Mobile Home / Other | 35 (37.6%) | 58 (62.4%) |
| Total | 99 (25.7%) | 286 (74.3%) |
Housing Structures by Number of Rooms in Wendover
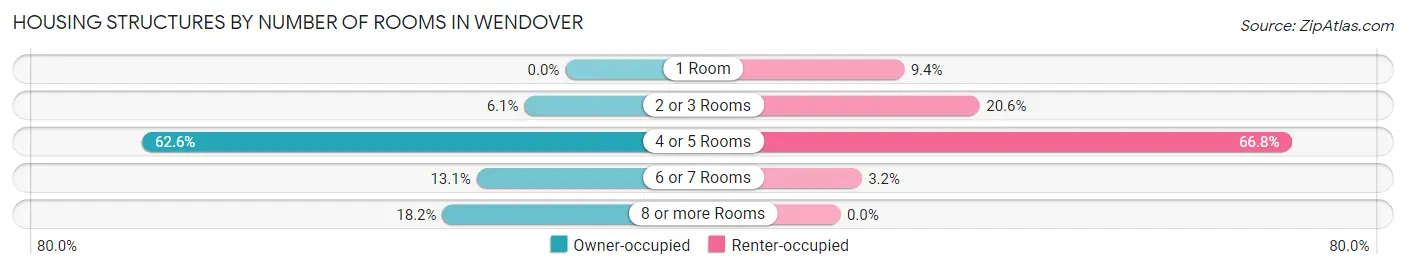
| Number of Rooms | Owner-occupied | Renter-occupied |
| 1 Room | 0 (0.0%) | 27 (9.4%) |
| 2 or 3 Rooms | 6 (6.1%) | 59 (20.6%) |
| 4 or 5 Rooms | 62 (62.6%) | 191 (66.8%) |
| 6 or 7 Rooms | 13 (13.1%) | 9 (3.2%) |
| 8 or more Rooms | 18 (18.2%) | 0 (0.0%) |
| Total | 99 (100.0%) | 286 (100.0%) |
Housing Structure by Heating Type in Wendover
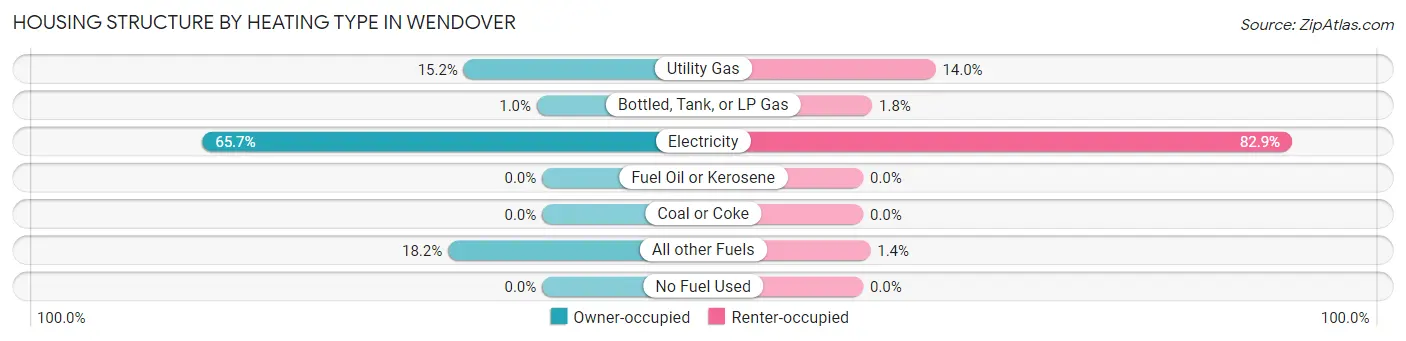
| Heating Type | Owner-occupied | Renter-occupied |
| Utility Gas | 15 (15.1%) | 40 (14.0%) |
| Bottled, Tank, or LP Gas | 1 (1.0%) | 5 (1.8%) |
| Electricity | 65 (65.7%) | 237 (82.9%) |
| Fuel Oil or Kerosene | 0 (0.0%) | 0 (0.0%) |
| Coal or Coke | 0 (0.0%) | 0 (0.0%) |
| All other Fuels | 18 (18.2%) | 4 (1.4%) |
| No Fuel Used | 0 (0.0%) | 0 (0.0%) |
| Total | 99 (100.0%) | 286 (100.0%) |
Household Vehicle Usage in Wendover
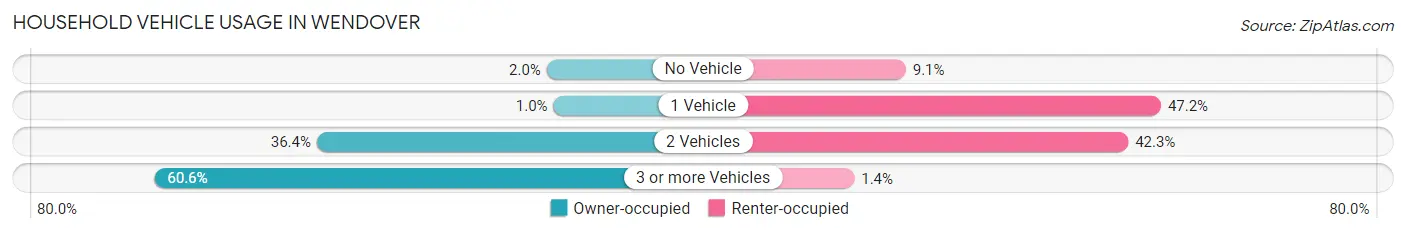
| Vehicles per Household | Owner-occupied | Renter-occupied |
| No Vehicle | 2 (2.0%) | 26 (9.1%) |
| 1 Vehicle | 1 (1.0%) | 135 (47.2%) |
| 2 Vehicles | 36 (36.4%) | 121 (42.3%) |
| 3 or more Vehicles | 60 (60.6%) | 4 (1.4%) |
| Total | 99 (100.0%) | 286 (100.0%) |
Real Estate & Mortgages in Wendover
Real Estate and Mortgage Overview in Wendover
| Characteristic | Without Mortgage | With Mortgage |
| Housing Units | 84 | 15 |
| Median Property Value | $202,500 | $164,600 |
| Median Household Income | $87,500 | $0 |
| Monthly Housing Costs | $396 | $0 |
| Real Estate Taxes | $944 | $0 |
Property Value by Mortgage Status in Wendover
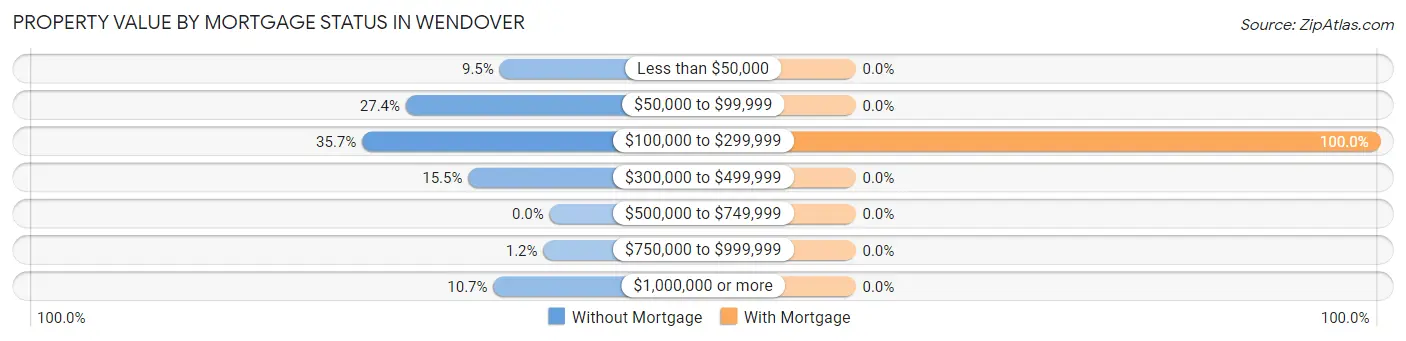
| Property Value | Without Mortgage | With Mortgage |
| Less than $50,000 | 8 (9.5%) | 0 (0.0%) |
| $50,000 to $99,999 | 23 (27.4%) | 0 (0.0%) |
| $100,000 to $299,999 | 30 (35.7%) | 15 (100.0%) |
| $300,000 to $499,999 | 13 (15.5%) | 0 (0.0%) |
| $500,000 to $749,999 | 0 (0.0%) | 0 (0.0%) |
| $750,000 to $999,999 | 1 (1.2%) | 0 (0.0%) |
| $1,000,000 or more | 9 (10.7%) | 0 (0.0%) |
| Total | 84 (100.0%) | 15 (100.0%) |
Household Income by Mortgage Status in Wendover
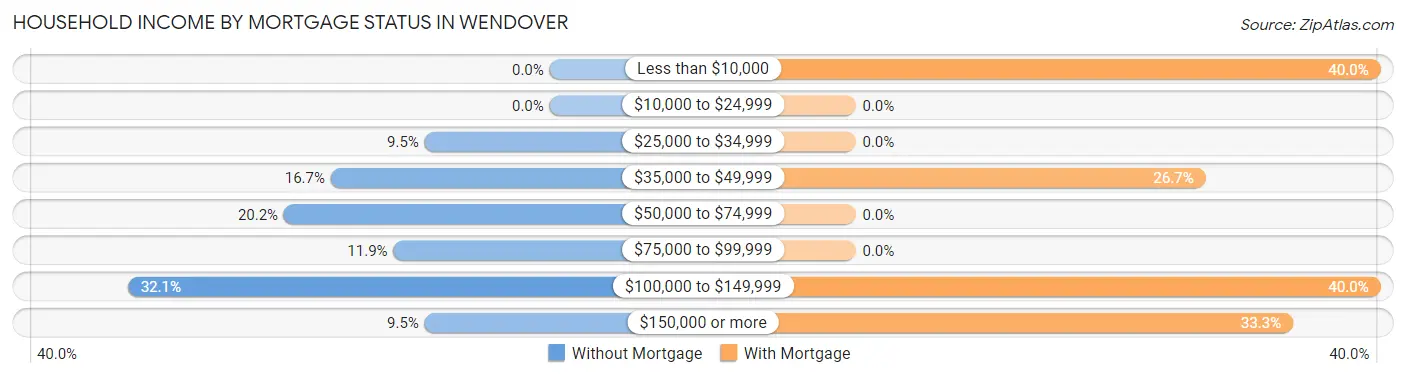
| Household Income | Without Mortgage | With Mortgage |
| Less than $10,000 | 0 (0.0%) | 6 (40.0%) |
| $10,000 to $24,999 | 0 (0.0%) | 0 (0.0%) |
| $25,000 to $34,999 | 8 (9.5%) | 0 (0.0%) |
| $35,000 to $49,999 | 14 (16.7%) | 4 (26.7%) |
| $50,000 to $74,999 | 17 (20.2%) | 0 (0.0%) |
| $75,000 to $99,999 | 10 (11.9%) | 0 (0.0%) |
| $100,000 to $149,999 | 27 (32.1%) | 6 (40.0%) |
| $150,000 or more | 8 (9.5%) | 5 (33.3%) |
| Total | 84 (100.0%) | 15 (100.0%) |
Property Value to Household Income Ratio in Wendover
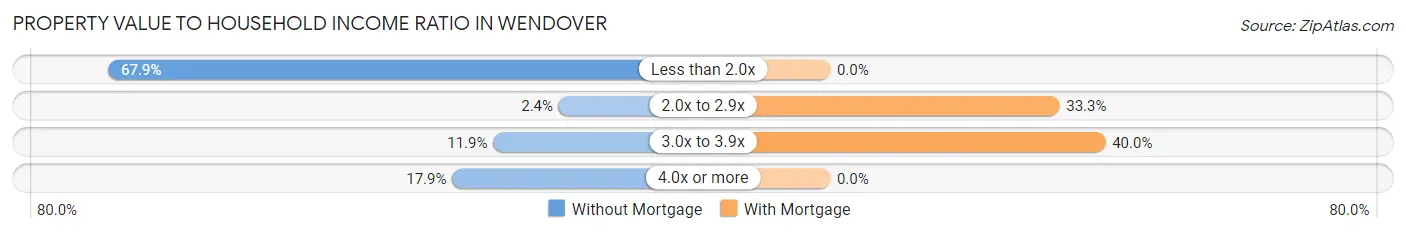
| Value-to-Income Ratio | Without Mortgage | With Mortgage |
| Less than 2.0x | 57 (67.9%) | 0 (0.0%) |
| 2.0x to 2.9x | 2 (2.4%) | 5 (33.3%) |
| 3.0x to 3.9x | 10 (11.9%) | 6 (40.0%) |
| 4.0x or more | 15 (17.9%) | 0 (0.0%) |
| Total | 84 (100.0%) | 15 (100.0%) |
Real Estate Taxes by Mortgage Status in Wendover
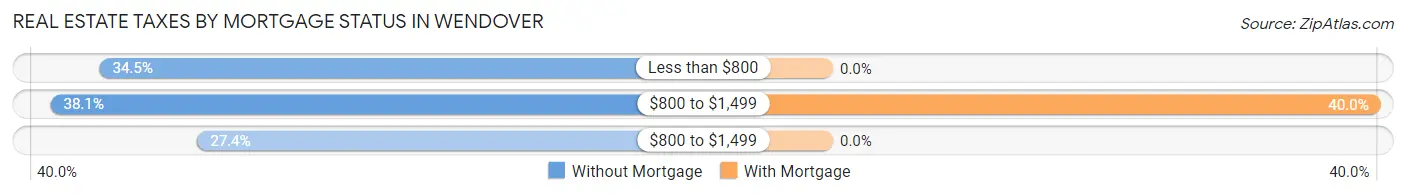
| Property Taxes | Without Mortgage | With Mortgage |
| Less than $800 | 29 (34.5%) | 0 (0.0%) |
| $800 to $1,499 | 32 (38.1%) | 6 (40.0%) |
| $800 to $1,499 | 23 (27.4%) | 0 (0.0%) |
| Total | 84 (100.0%) | 15 (100.0%) |
Health & Disability in Wendover
Health Insurance Coverage by Age in Wendover
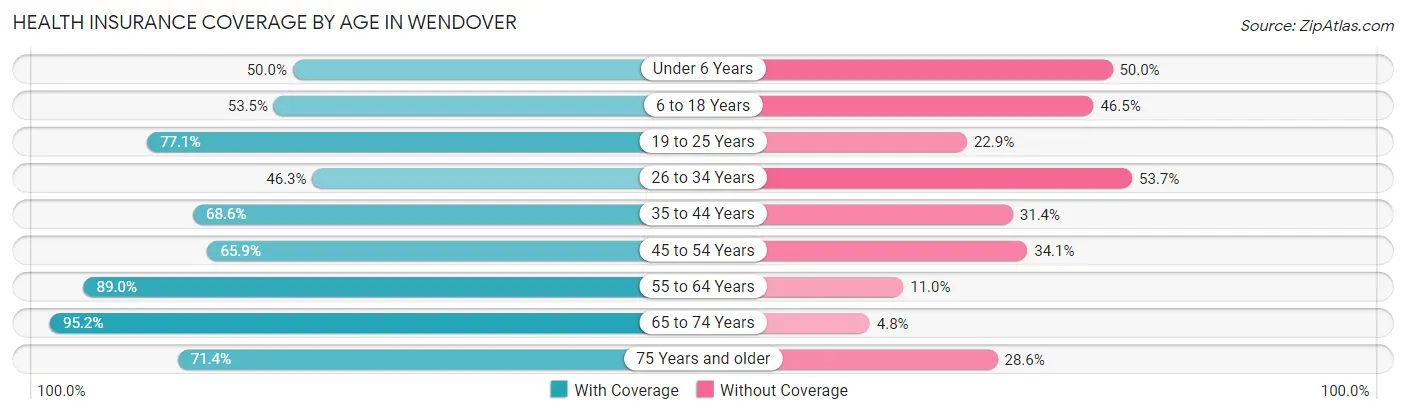
| Age Bracket | With Coverage | Without Coverage |
| Under 6 Years | 63 (50.0%) | 63 (50.0%) |
| 6 to 18 Years | 129 (53.5%) | 112 (46.5%) |
| 19 to 25 Years | 118 (77.1%) | 35 (22.9%) |
| 26 to 34 Years | 95 (46.3%) | 110 (53.7%) |
| 35 to 44 Years | 96 (68.6%) | 44 (31.4%) |
| 45 to 54 Years | 83 (65.9%) | 43 (34.1%) |
| 55 to 64 Years | 97 (89.0%) | 12 (11.0%) |
| 65 to 74 Years | 40 (95.2%) | 2 (4.8%) |
| 75 Years and older | 15 (71.4%) | 6 (28.6%) |
| Total | 736 (63.3%) | 427 (36.7%) |
Health Insurance Coverage by Citizenship Status in Wendover
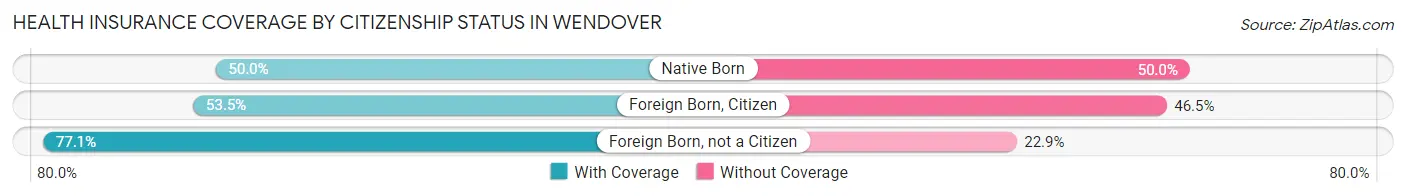
| Citizenship Status | With Coverage | Without Coverage |
| Native Born | 63 (50.0%) | 63 (50.0%) |
| Foreign Born, Citizen | 129 (53.5%) | 112 (46.5%) |
| Foreign Born, not a Citizen | 118 (77.1%) | 35 (22.9%) |
Health Insurance Coverage by Household Income in Wendover
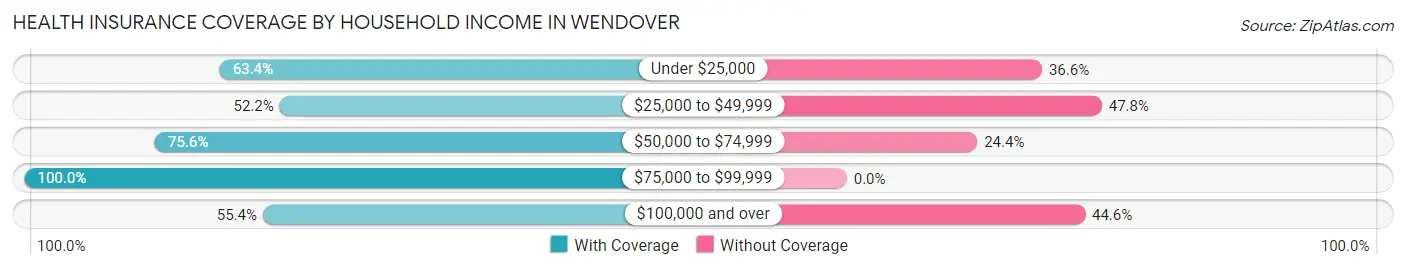
| Household Income | With Coverage | Without Coverage |
| Under $25,000 | 111 (63.4%) | 64 (36.6%) |
| $25,000 to $49,999 | 187 (52.2%) | 171 (47.8%) |
| $50,000 to $74,999 | 170 (75.6%) | 55 (24.4%) |
| $75,000 to $99,999 | 98 (100.0%) | 0 (0.0%) |
| $100,000 and over | 170 (55.4%) | 137 (44.6%) |
Public vs Private Health Insurance Coverage by Age in Wendover
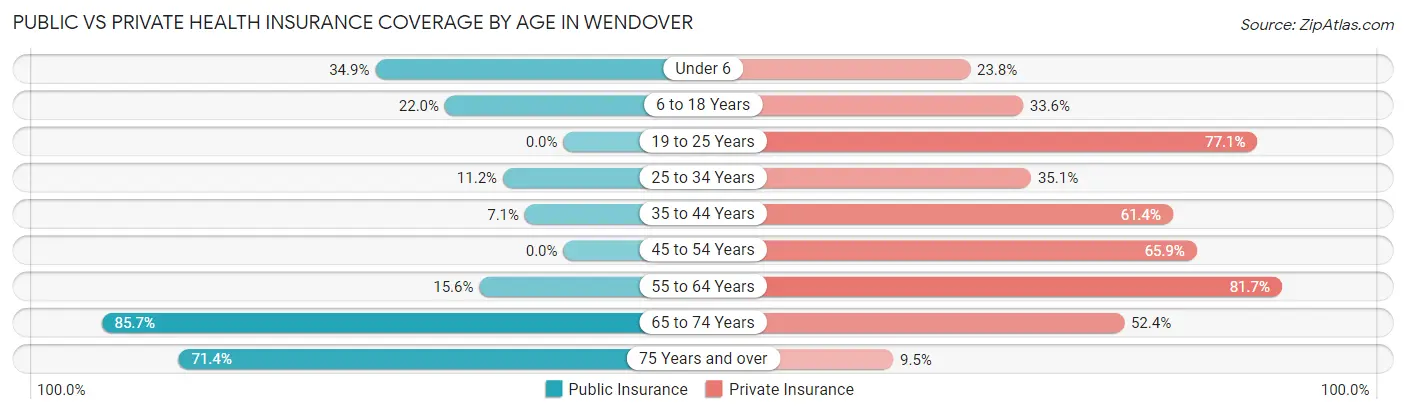
| Age Bracket | Public Insurance | Private Insurance |
| Under 6 | 44 (34.9%) | 30 (23.8%) |
| 6 to 18 Years | 53 (22.0%) | 81 (33.6%) |
| 19 to 25 Years | 0 (0.0%) | 118 (77.1%) |
| 25 to 34 Years | 23 (11.2%) | 72 (35.1%) |
| 35 to 44 Years | 10 (7.1%) | 86 (61.4%) |
| 45 to 54 Years | 0 (0.0%) | 83 (65.9%) |
| 55 to 64 Years | 17 (15.6%) | 89 (81.7%) |
| 65 to 74 Years | 36 (85.7%) | 22 (52.4%) |
| 75 Years and over | 15 (71.4%) | 2 (9.5%) |
| Total | 198 (17.0%) | 583 (50.1%) |
Disability Status by Sex by Age in Wendover
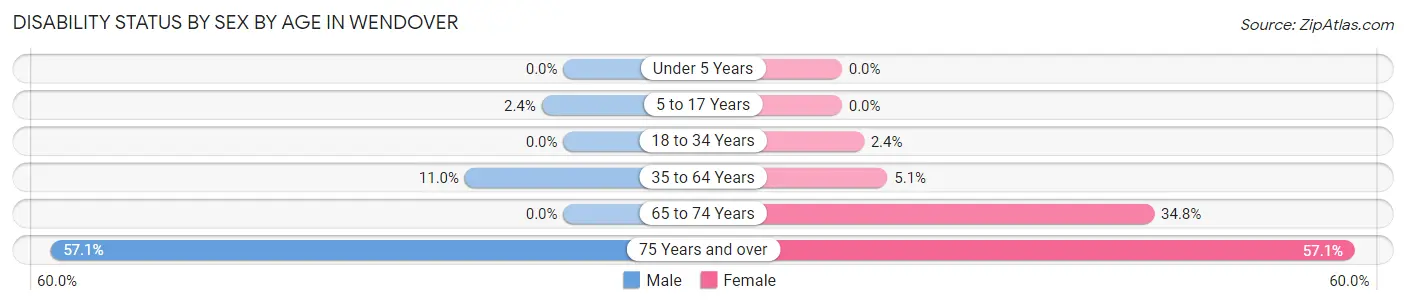
| Age Bracket | Male | Female |
| Under 5 Years | 0 (0.0%) | 0 (0.0%) |
| 5 to 17 Years | 3 (2.4%) | 0 (0.0%) |
| 18 to 34 Years | 0 (0.0%) | 5 (2.4%) |
| 35 to 64 Years | 26 (11.0%) | 7 (5.1%) |
| 65 to 74 Years | 0 (0.0%) | 8 (34.8%) |
| 75 Years and over | 4 (57.1%) | 8 (57.1%) |
Disability Class by Sex by Age in Wendover
Disability Class: Hearing Difficulty
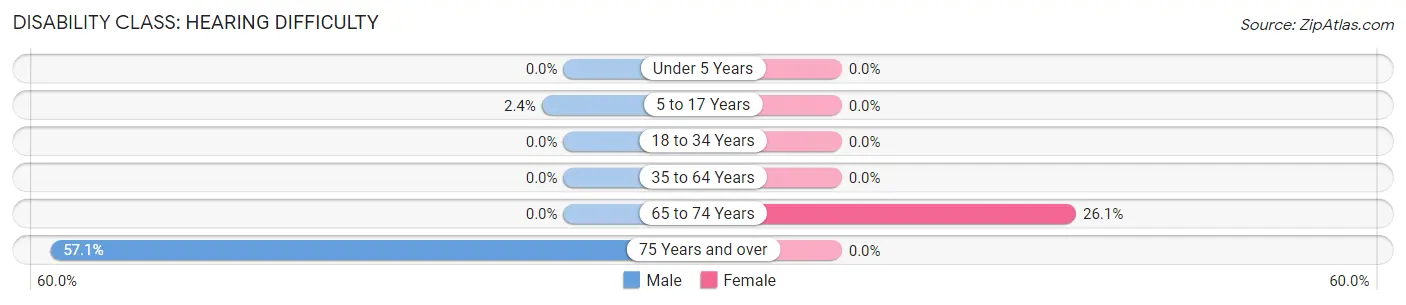
| Age Bracket | Male | Female |
| Under 5 Years | 0 (0.0%) | 0 (0.0%) |
| 5 to 17 Years | 3 (2.4%) | 0 (0.0%) |
| 18 to 34 Years | 0 (0.0%) | 0 (0.0%) |
| 35 to 64 Years | 0 (0.0%) | 0 (0.0%) |
| 65 to 74 Years | 0 (0.0%) | 6 (26.1%) |
| 75 Years and over | 4 (57.1%) | 0 (0.0%) |
Disability Class: Vision Difficulty
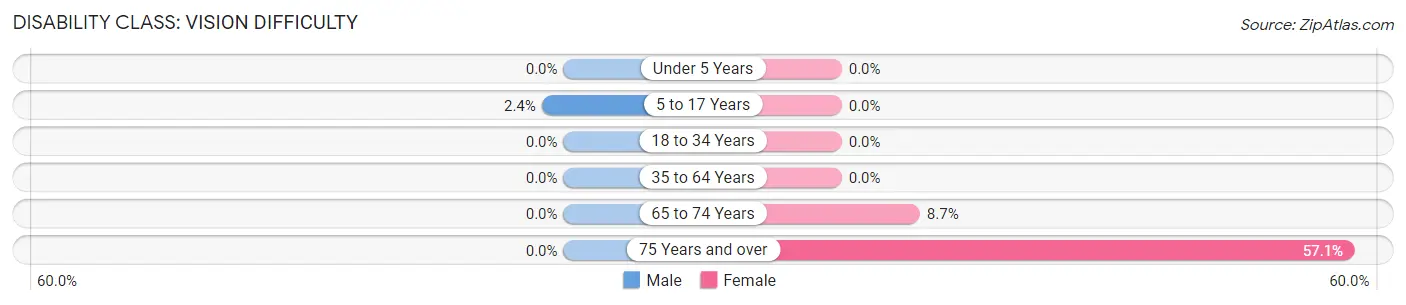
| Age Bracket | Male | Female |
| Under 5 Years | 0 (0.0%) | 0 (0.0%) |
| 5 to 17 Years | 3 (2.4%) | 0 (0.0%) |
| 18 to 34 Years | 0 (0.0%) | 0 (0.0%) |
| 35 to 64 Years | 0 (0.0%) | 0 (0.0%) |
| 65 to 74 Years | 0 (0.0%) | 2 (8.7%) |
| 75 Years and over | 0 (0.0%) | 8 (57.1%) |
Disability Class: Cognitive Difficulty
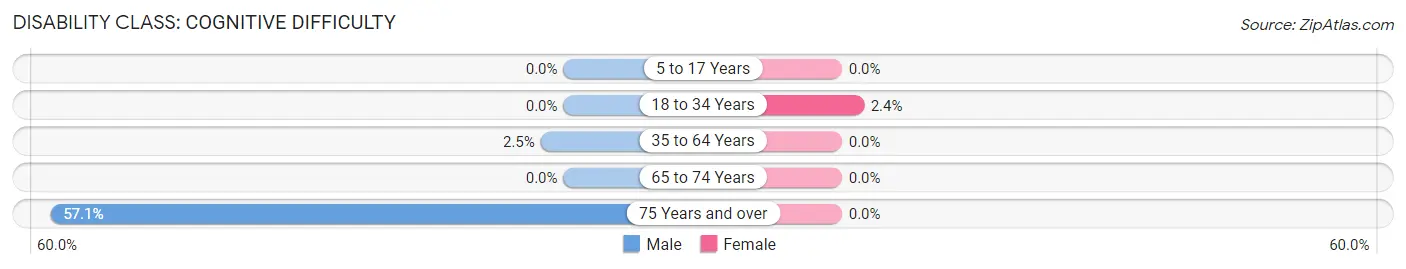
| Age Bracket | Male | Female |
| 5 to 17 Years | 0 (0.0%) | 0 (0.0%) |
| 18 to 34 Years | 0 (0.0%) | 5 (2.4%) |
| 35 to 64 Years | 6 (2.5%) | 0 (0.0%) |
| 65 to 74 Years | 0 (0.0%) | 0 (0.0%) |
| 75 Years and over | 4 (57.1%) | 0 (0.0%) |
Disability Class: Ambulatory Difficulty
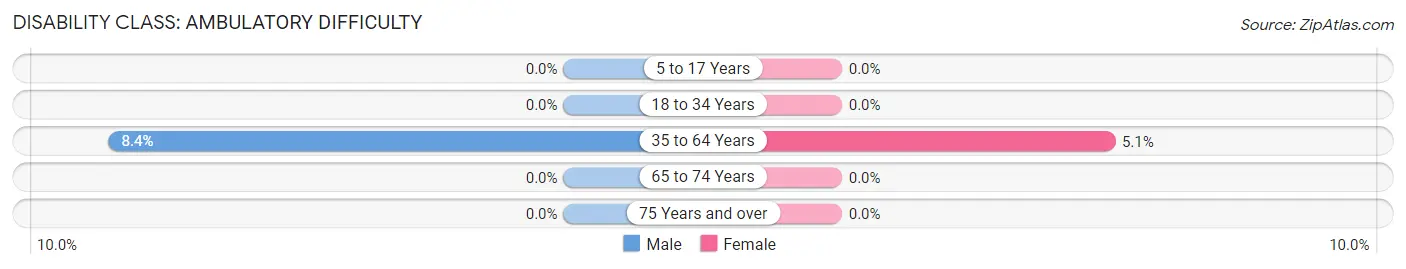
| Age Bracket | Male | Female |
| 5 to 17 Years | 0 (0.0%) | 0 (0.0%) |
| 18 to 34 Years | 0 (0.0%) | 0 (0.0%) |
| 35 to 64 Years | 20 (8.4%) | 7 (5.1%) |
| 65 to 74 Years | 0 (0.0%) | 0 (0.0%) |
| 75 Years and over | 0 (0.0%) | 0 (0.0%) |
Disability Class: Self-Care Difficulty
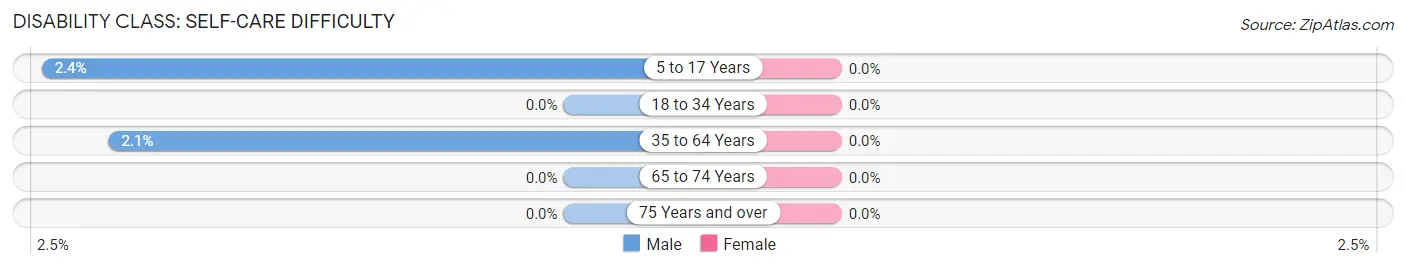
| Age Bracket | Male | Female |
| 5 to 17 Years | 3 (2.4%) | 0 (0.0%) |
| 18 to 34 Years | 0 (0.0%) | 0 (0.0%) |
| 35 to 64 Years | 5 (2.1%) | 0 (0.0%) |
| 65 to 74 Years | 0 (0.0%) | 0 (0.0%) |
| 75 Years and over | 0 (0.0%) | 0 (0.0%) |
Technology Access in Wendover
Computing Device Access in Wendover
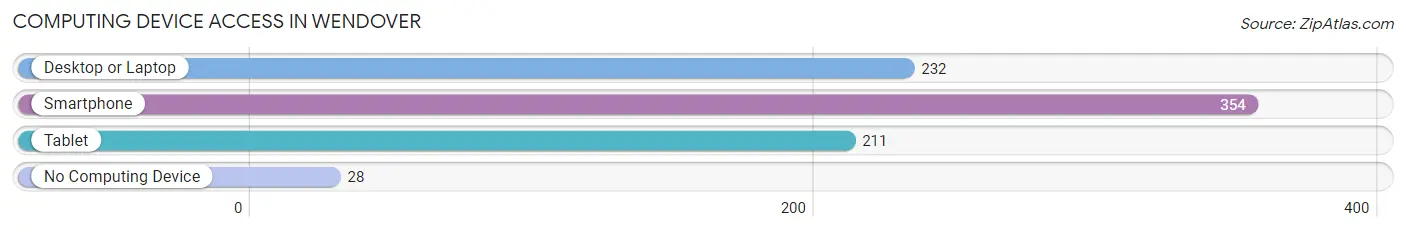
| Device Type | # Households | % Households |
| Desktop or Laptop | 232 | 60.3% |
| Smartphone | 354 | 91.9% |
| Tablet | 211 | 54.8% |
| No Computing Device | 28 | 7.3% |
| Total | 385 | 100.0% |
Internet Access in Wendover
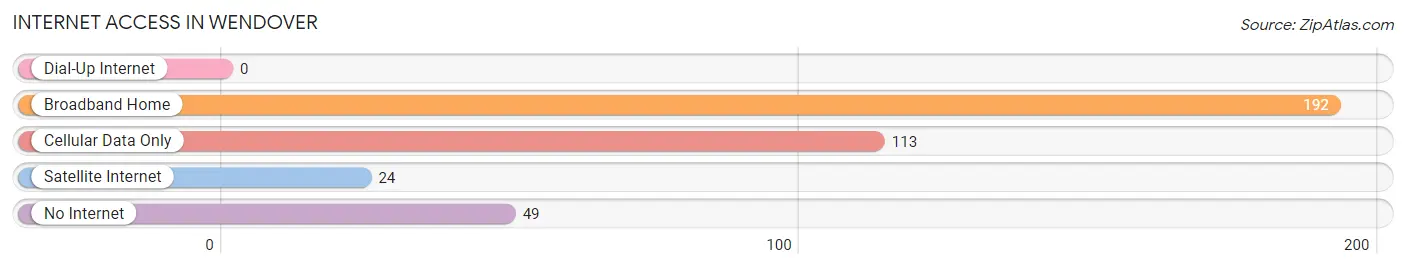
| Internet Type | # Households | % Households |
| Dial-Up Internet | 0 | 0.0% |
| Broadband Home | 192 | 49.9% |
| Cellular Data Only | 113 | 29.3% |
| Satellite Internet | 24 | 6.2% |
| No Internet | 49 | 12.7% |
| Total | 385 | 100.0% |
Wendover Summary
Wendover is a small city located in the western part of Utah, near the Nevada border. It is part of Tooele County and is located about 80 miles west of Salt Lake City. The city has a population of 1,531 as of the 2010 census.
History
The area that is now Wendover was first inhabited by the Goshute Indians. The first non-native settlers arrived in the area in the late 1800s. The town was originally called Wendover Junction, as it was the junction of the Western Pacific Railroad and the Southern Pacific Railroad. The town was renamed Wendover in 1917.
In the early 1900s, Wendover was a popular stop for travelers on the railroad. The town was also a popular destination for gamblers, as it was the closest town to the Nevada border. In the 1930s, the town was home to a large airbase, which was used to train pilots during World War II.
Geography
Wendover is located in the western part of Utah, near the Nevada border. It is part of Tooele County and is located about 80 miles west of Salt Lake City. The city has a total area of 4.2 square miles, all of which is land. The city is located in the Great Salt Lake Desert, and the terrain is mostly flat.
Economy
Wendover’s economy is largely based on tourism. The city is home to the Wendover Nugget Casino, which attracts visitors from all over the region. The city is also home to a number of hotels, restaurants, and other tourist attractions. The city is also home to a number of manufacturing and distribution companies.
Demographics
As of the 2010 census, Wendover had a population of 1,531. The racial makeup of the city was 75.3% White, 0.7% African American, 0.7% Native American, 0.7% Asian, 0.1% Pacific Islander, 19.2% from other races, and 3.5% from two or more races. Hispanic or Latino of any race were 33.2% of the population.
The median income for a household in the city was $30,938, and the median income for a family was $35,625. About 17.2% of the population was below the poverty line.
Conclusion
Wendover is a small city located in the western part of Utah, near the Nevada border. It has a population of 1,531 as of the 2010 census. The city’s economy is largely based on tourism, and it is home to a number of hotels, restaurants, and other tourist attractions. The city is also home to a number of manufacturing and distribution companies. The racial makeup of the city is mostly White, with a significant Hispanic or Latino population. The median income for a household in the city is $30,938, and the median income for a family is $35,625.
Common Questions
What is Per Capita Income in Wendover?
Per Capita income in Wendover is $20,419.
What is the Median Family Income in Wendover?
Median Family Income in Wendover is $42,070.
What is the Median Household income in Wendover?
Median Household Income in Wendover is $41,989.
What is Income or Wage Gap in Wendover?
Income or Wage Gap in Wendover is 12.7%.
Women in Wendover earn 87.3 cents for every dollar earned by a man.
What is Family Income Deficit in Wendover?
Family Income Deficit in Wendover is $10,820.
Families that are below poverty line in Wendover earn $10,820 less on average than the poverty threshold level.
What is Inequality or Gini Index in Wendover?
Inequality or Gini Index in Wendover is 0.42.
What is the Total Population of Wendover?
Total Population of Wendover is 1,163.
What is the Total Male Population of Wendover?
Total Male Population of Wendover is 622.
What is the Total Female Population of Wendover?
Total Female Population of Wendover is 541.
What is the Ratio of Males per 100 Females in Wendover?
There are 114.97 Males per 100 Females in Wendover.
What is the Ratio of Females per 100 Males in Wendover?
There are 86.98 Females per 100 Males in Wendover.
What is the Median Population Age in Wendover?
Median Population Age in Wendover is 28.7 Years.
What is the Average Family Size in Wendover
Average Family Size in Wendover is 3.5 People.
What is the Average Household Size in Wendover
Average Household Size in Wendover is 3.0 People.
How Large is the Labor Force in Wendover?
There are 589 People in the Labor Forcein in Wendover.
What is the Percentage of People in the Labor Force in Wendover?
70.9% of People are in the Labor Force in Wendover.
What is the Unemployment Rate in Wendover?
Unemployment Rate in Wendover is 3.4%.