Flat Rock, NC Map & Demographics
Flat Rock Map
Flat Rock Overview
$25,323
PER CAPITA INCOME
$63,616
AVG FAMILY INCOME
$50,032
AVG HOUSEHOLD INCOME
38.9%
WAGE / INCOME GAP [ % ]
61.1¢/ $1
WAGE / INCOME GAP [ $ ]
0.39
INEQUALITY / GINI INDEX
1,066
TOTAL POPULATION
487
MALE POPULATION
579
FEMALE POPULATION
84.11
MALES / 100 FEMALES
118.89
FEMALES / 100 MALES
44.4
MEDIAN AGE
2.9
AVG FAMILY SIZE
2.3
AVG HOUSEHOLD SIZE
489
LABOR FORCE [ PEOPLE ]
53.0%
PERCENT IN LABOR FORCE
3.3%
UNEMPLOYMENT RATE
Flat Rock Zip Codes
Flat Rock Area Codes
Income in Flat Rock
Income Overview in Flat Rock
Per Capita Income in Flat Rock is $25,323, while median incomes of families and households are $63,616 and $50,032 respectively.
| Characteristic | Number | Measure |
| Per Capita Income | 1,066 | $25,323 |
| Median Family Income | 315 | $63,616 |
| Mean Family Income | 315 | $64,459 |
| Median Household Income | 469 | $50,032 |
| Mean Household Income | 469 | $56,043 |
| Income Deficit | 315 | $0 |
| Wage / Income Gap (%) | 1,066 | 38.92% |
| Wage / Income Gap ($) | 1,066 | 61.08¢ per $1 |
| Gini / Inequality Index | 1,066 | 0.39 |
Earnings by Sex in Flat Rock
Average Earnings in Flat Rock are $46,904, $74,391 for men and $45,439 for women, a difference of 38.9%.
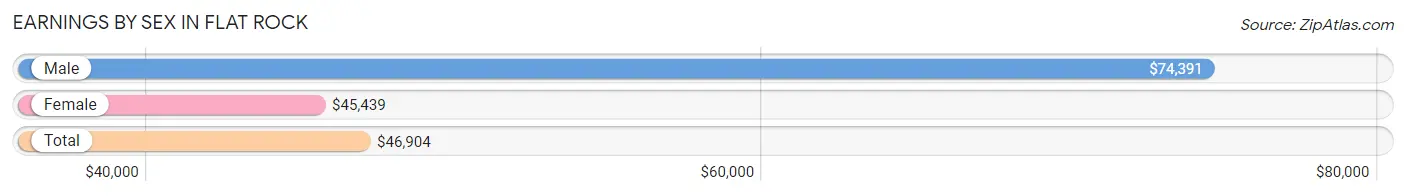
| Sex | Number | Average Earnings |
| Male | 261 (45.2%) | $74,391 |
| Female | 316 (54.8%) | $45,439 |
| Total | 577 (100.0%) | $46,904 |
Earnings by Sex by Income Bracket in Flat Rock
The most common earnings brackets in Flat Rock are $55,000 to $64,999 for men (43 | 16.5%) and $17,500 to $19,999 for women (68 | 21.5%).
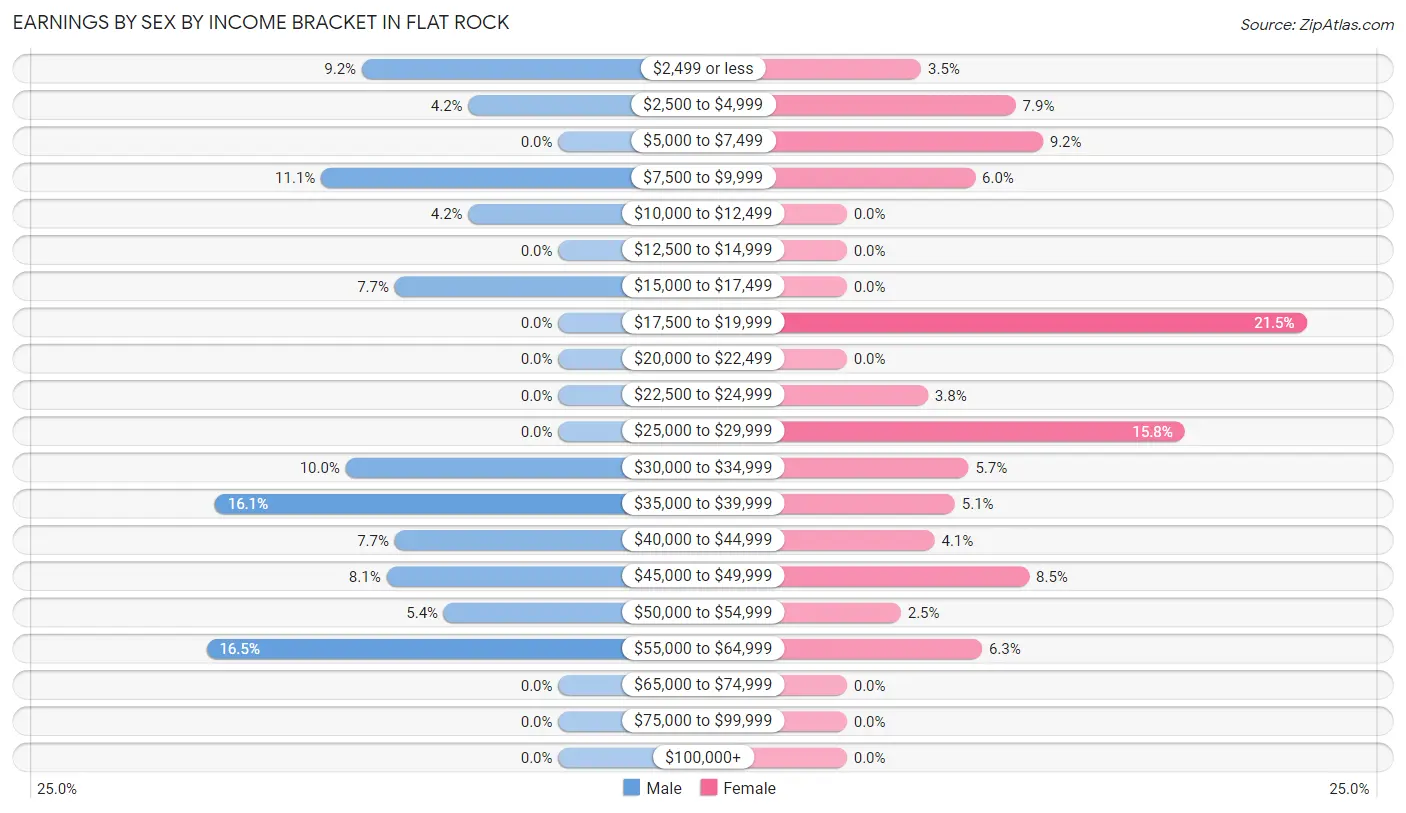
| Income | Male | Female |
| $2,499 or less | 24 (9.2%) | 11 (3.5%) |
| $2,500 to $4,999 | 11 (4.2%) | 25 (7.9%) |
| $5,000 to $7,499 | 0 (0.0%) | 29 (9.2%) |
| $7,500 to $9,999 | 29 (11.1%) | 19 (6.0%) |
| $10,000 to $12,499 | 11 (4.2%) | 0 (0.0%) |
| $12,500 to $14,999 | 0 (0.0%) | 0 (0.0%) |
| $15,000 to $17,499 | 20 (7.7%) | 0 (0.0%) |
| $17,500 to $19,999 | 0 (0.0%) | 68 (21.5%) |
| $20,000 to $22,499 | 0 (0.0%) | 0 (0.0%) |
| $22,500 to $24,999 | 0 (0.0%) | 12 (3.8%) |
| $25,000 to $29,999 | 0 (0.0%) | 50 (15.8%) |
| $30,000 to $34,999 | 26 (10.0%) | 18 (5.7%) |
| $35,000 to $39,999 | 42 (16.1%) | 16 (5.1%) |
| $40,000 to $44,999 | 20 (7.7%) | 13 (4.1%) |
| $45,000 to $49,999 | 21 (8.1%) | 27 (8.5%) |
| $50,000 to $54,999 | 14 (5.4%) | 8 (2.5%) |
| $55,000 to $64,999 | 43 (16.5%) | 20 (6.3%) |
| $65,000 to $74,999 | 0 (0.0%) | 0 (0.0%) |
| $75,000 to $99,999 | 0 (0.0%) | 0 (0.0%) |
| $100,000+ | 0 (0.0%) | 0 (0.0%) |
| Total | 261 (100.0%) | 316 (100.0%) |
Earnings by Sex by Educational Attainment in Flat Rock
Average earnings in Flat Rock are $38,092 for men and $27,404 for women, a difference of 28.1%. Men with an educational attainment of college or associate's degree enjoy the highest average annual earnings of $45,104, while those with bachelor's degree education earn the least with $39,821. Women with an educational attainment of bachelor's degree earn the most with the average annual earnings of $45,909, while those with high school diploma education have the smallest earnings of $19,400.
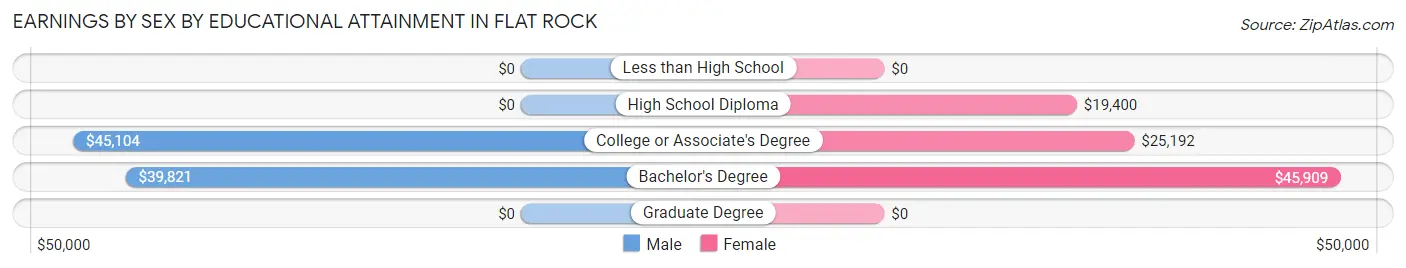
| Educational Attainment | Male Income | Female Income |
| Less than High School | - | - |
| High School Diploma | - | - |
| College or Associate's Degree | $45,104 | $25,192 |
| Bachelor's Degree | $39,821 | $45,909 |
| Graduate Degree | - | - |
| Total | $38,092 | $27,404 |
Family Income in Flat Rock
Family Income Brackets in Flat Rock
According to the Flat Rock family income data, there are 107 families falling into the $50,000 to $74,999 income range, which is the most common income bracket and makes up 34.0% of all families.
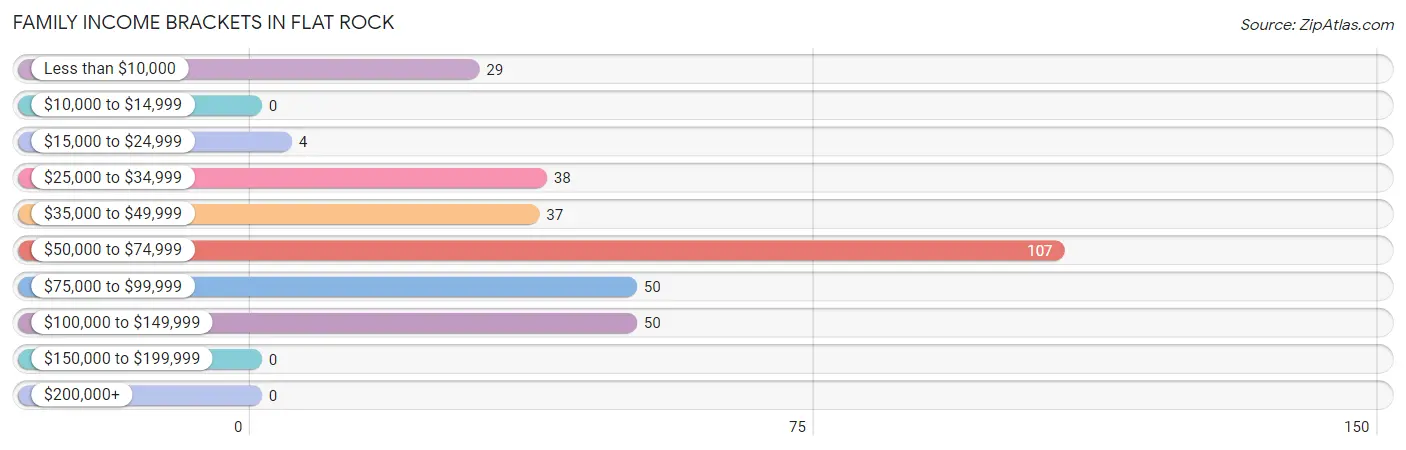
| Income Bracket | # Families | % Families |
| Less than $10,000 | 29 | 9.2% |
| $10,000 to $14,999 | 0 | 0.0% |
| $15,000 to $24,999 | 4 | 1.3% |
| $25,000 to $34,999 | 38 | 12.1% |
| $35,000 to $49,999 | 37 | 11.7% |
| $50,000 to $74,999 | 107 | 34.0% |
| $75,000 to $99,999 | 50 | 15.9% |
| $100,000 to $149,999 | 50 | 15.9% |
| $150,000 to $199,999 | 0 | 0.0% |
| $200,000+ | 0 | 0.0% |
Family Income by Famaliy Size in Flat Rock
4-person families (34 | 10.8%) account for the highest median family income in Flat Rock with $71,000 per family, while 2-person families (137 | 43.5%) have the highest median income of $32,120 per family member.
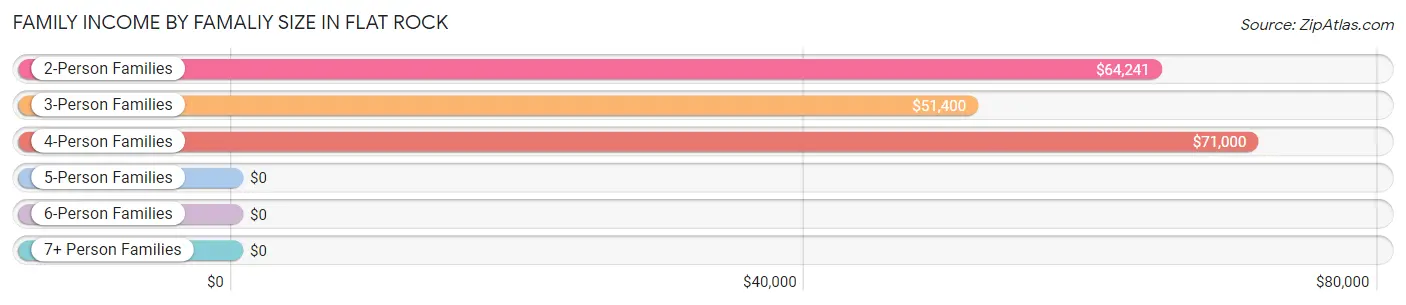
| Income Bracket | # Families | Median Income |
| 2-Person Families | 137 (43.5%) | $64,241 |
| 3-Person Families | 144 (45.7%) | $51,400 |
| 4-Person Families | 34 (10.8%) | $71,000 |
| 5-Person Families | 0 (0.0%) | $0 |
| 6-Person Families | 0 (0.0%) | $0 |
| 7+ Person Families | 0 (0.0%) | $0 |
| Total | 315 (100.0%) | $63,616 |
Family Income by Number of Earners in Flat Rock
The median family income in Flat Rock is $63,616, with families comprising 3+ earners (68) having the highest median family income of $96,071, while families with no earners (44) have the lowest median family income of $51,100, accounting for 21.6% and 14.0% of families, respectively.
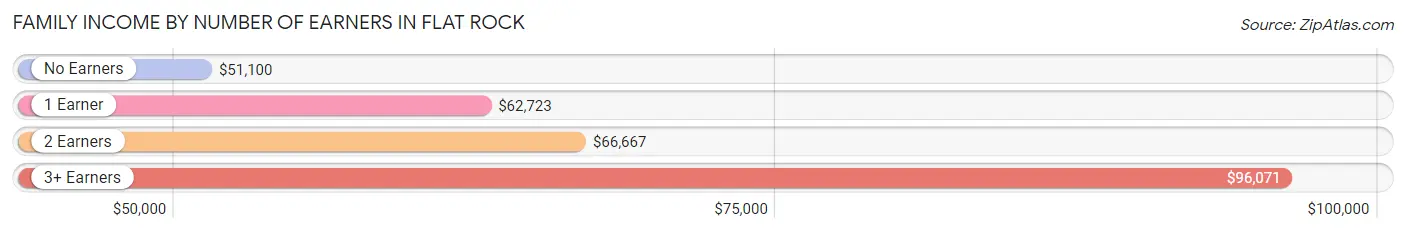
| Number of Earners | # Families | Median Income |
| No Earners | 44 (14.0%) | $51,100 |
| 1 Earner | 155 (49.2%) | $62,723 |
| 2 Earners | 48 (15.2%) | $66,667 |
| 3+ Earners | 68 (21.6%) | $96,071 |
| Total | 315 (100.0%) | $63,616 |
Household Income in Flat Rock
Household Income Brackets in Flat Rock
With 121 households falling in the category, the $50,000 to $74,999 income range is the most frequent in Flat Rock, accounting for 25.8% of all households.
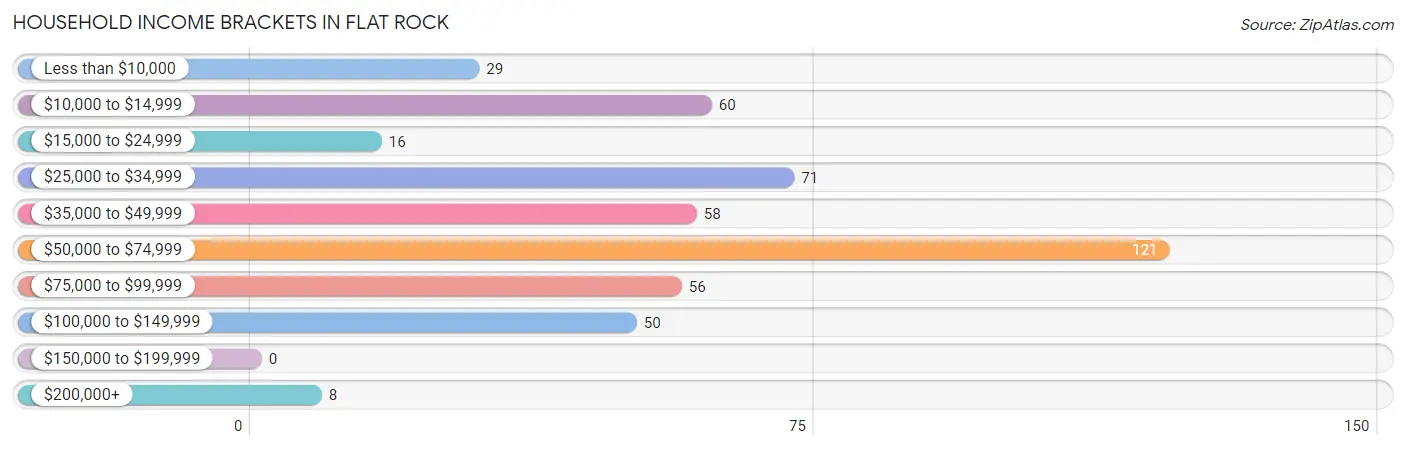
| Income Bracket | # Households | % Households |
| Less than $10,000 | 29 | 6.2% |
| $10,000 to $14,999 | 60 | 12.8% |
| $15,000 to $24,999 | 16 | 3.4% |
| $25,000 to $34,999 | 71 | 15.1% |
| $35,000 to $49,999 | 58 | 12.4% |
| $50,000 to $74,999 | 121 | 25.8% |
| $75,000 to $99,999 | 56 | 11.9% |
| $100,000 to $149,999 | 50 | 10.7% |
| $150,000 to $199,999 | 0 | 0.0% |
| $200,000+ | 8 | 1.7% |
Household Income by Householder Age in Flat Rock
The median household income in Flat Rock is $50,032, with the highest median household income of $64,107 found in the 45 to 64 years age bracket for the primary householder. A total of 204 households (43.5%) fall into this category. Meanwhile, the 15 to 24 years age bracket for the primary householder has the lowest median household income of $0, with 12 households (2.6%) in this group.
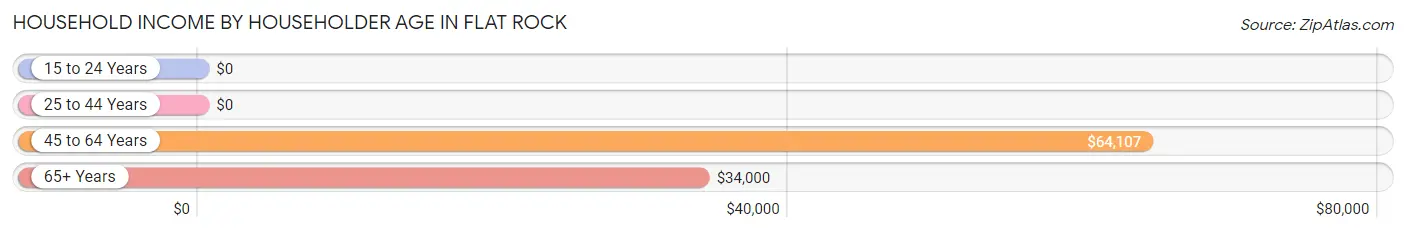
| Income Bracket | # Households | Median Income |
| 15 to 24 Years | 12 (2.6%) | $0 |
| 25 to 44 Years | 101 (21.5%) | $0 |
| 45 to 64 Years | 204 (43.5%) | $64,107 |
| 65+ Years | 152 (32.4%) | $34,000 |
| Total | 469 (100.0%) | $50,032 |
Poverty in Flat Rock
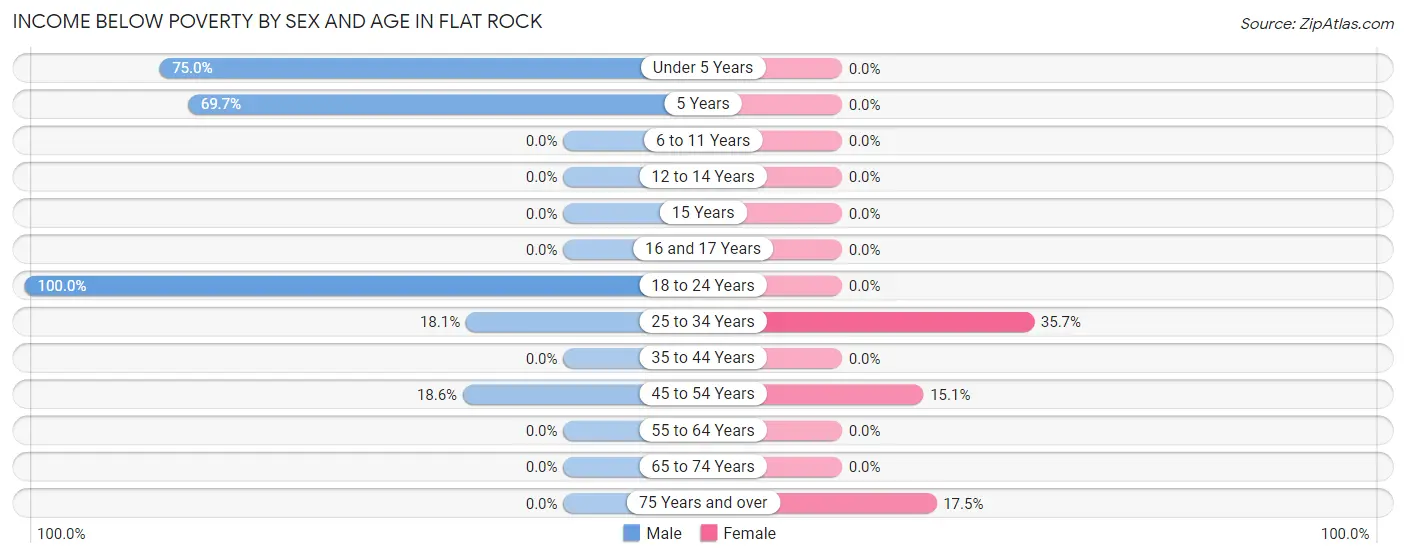
Income Below Poverty by Sex and Age in Flat Rock
With 22.6% poverty level for males and 12.3% for females among the residents of Flat Rock, 18 to 24 year old males and 25 to 34 year old females are the most vulnerable to poverty, with 40 males (100.0%) and 41 females (35.6%) in their respective age groups living below the poverty level.
| Age Bracket | Male | Female |
| Under 5 Years | 21 (75.0%) | 0 (0.0%) |
| 5 Years | 23 (69.7%) | 0 (0.0%) |
| 6 to 11 Years | 0 (0.0%) | 0 (0.0%) |
| 12 to 14 Years | 0 (0.0%) | 0 (0.0%) |
| 15 Years | 0 (0.0%) | 0 (0.0%) |
| 16 and 17 Years | 0 (0.0%) | 0 (0.0%) |
| 18 to 24 Years | 40 (100.0%) | 0 (0.0%) |
| 25 to 34 Years | 15 (18.1%) | 41 (35.6%) |
| 35 to 44 Years | 0 (0.0%) | 0 (0.0%) |
| 45 to 54 Years | 11 (18.6%) | 13 (15.1%) |
| 55 to 64 Years | 0 (0.0%) | 0 (0.0%) |
| 65 to 74 Years | 0 (0.0%) | 0 (0.0%) |
| 75 Years and over | 0 (0.0%) | 17 (17.5%) |
| Total | 110 (22.6%) | 71 (12.3%) |
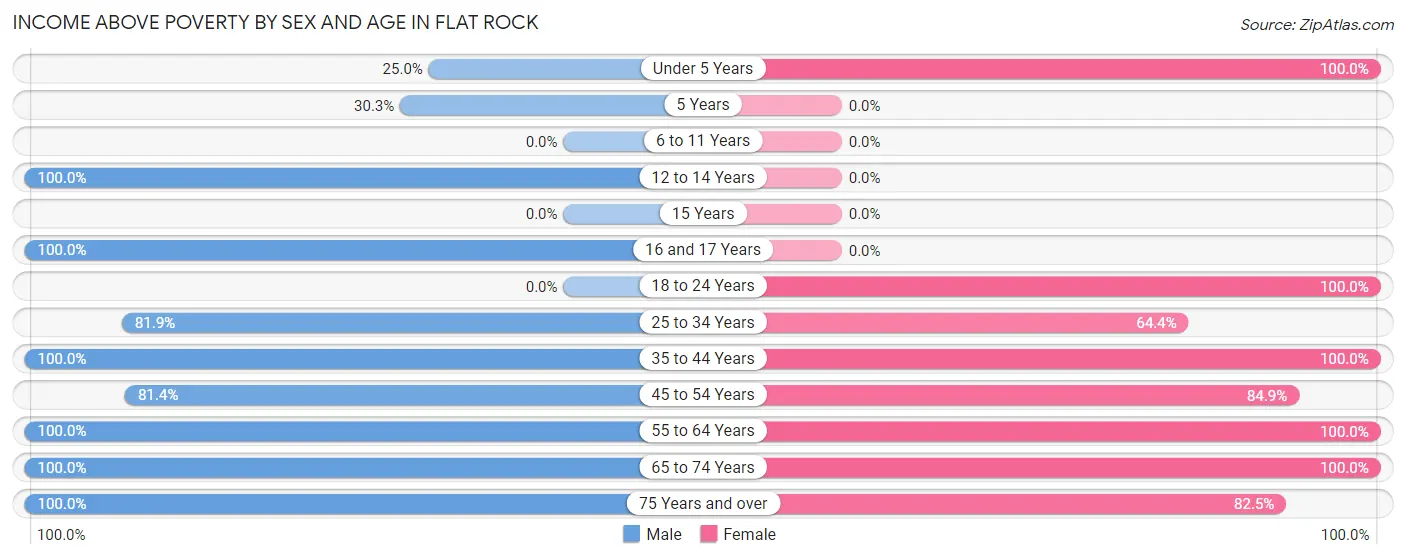
Income Above Poverty by Sex and Age in Flat Rock
According to the poverty statistics in Flat Rock, males aged 12 to 14 years and females aged under 5 years are the age groups that are most secure financially, with 100.0% of males and 100.0% of females in these age groups living above the poverty line.
| Age Bracket | Male | Female |
| Under 5 Years | 7 (25.0%) | 64 (100.0%) |
| 5 Years | 10 (30.3%) | 0 (0.0%) |
| 6 to 11 Years | 0 (0.0%) | 0 (0.0%) |
| 12 to 14 Years | 19 (100.0%) | 0 (0.0%) |
| 15 Years | 0 (0.0%) | 0 (0.0%) |
| 16 and 17 Years | 43 (100.0%) | 0 (0.0%) |
| 18 to 24 Years | 0 (0.0%) | 37 (100.0%) |
| 25 to 34 Years | 68 (81.9%) | 74 (64.3%) |
| 35 to 44 Years | 23 (100.0%) | 66 (100.0%) |
| 45 to 54 Years | 48 (81.4%) | 73 (84.9%) |
| 55 to 64 Years | 99 (100.0%) | 87 (100.0%) |
| 65 to 74 Years | 27 (100.0%) | 27 (100.0%) |
| 75 Years and over | 33 (100.0%) | 80 (82.5%) |
| Total | 377 (77.4%) | 508 (87.7%) |
Income Below Poverty Among Married-Couple Families in Flat Rock
| Children | Above Poverty | Below Poverty |
| No Children | 160 (100.0%) | 0 (0.0%) |
| 1 or 2 Children | 42 (100.0%) | 0 (0.0%) |
| 3 or 4 Children | 0 (0.0%) | 0 (0.0%) |
| 5 or more Children | 0 (0.0%) | 0 (0.0%) |
| Total | 202 (100.0%) | 0 (0.0%) |
Income Below Poverty Among Single-Parent Households in Flat Rock
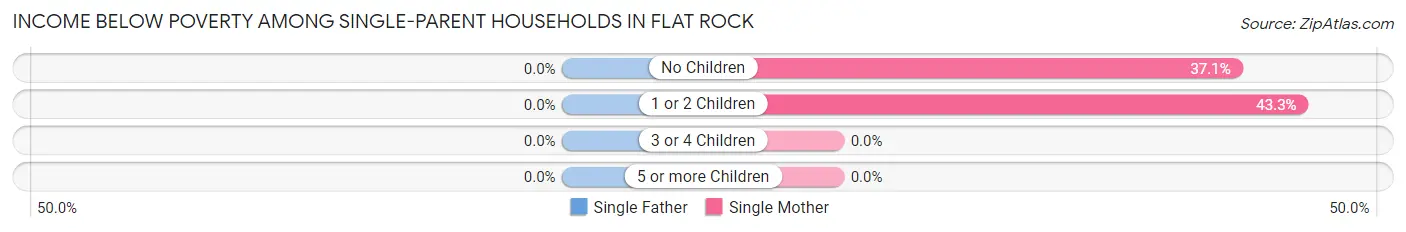
| Children | Single Father | Single Mother |
| No Children | 0 (0.0%) | 13 (37.1%) |
| 1 or 2 Children | 0 (0.0%) | 29 (43.3%) |
| 3 or 4 Children | 0 (0.0%) | 0 (0.0%) |
| 5 or more Children | 0 (0.0%) | 0 (0.0%) |
| Total | 0 (0.0%) | 42 (41.2%) |
Income Below Poverty Among Married-Couple vs Single-Parent Households in Flat Rock
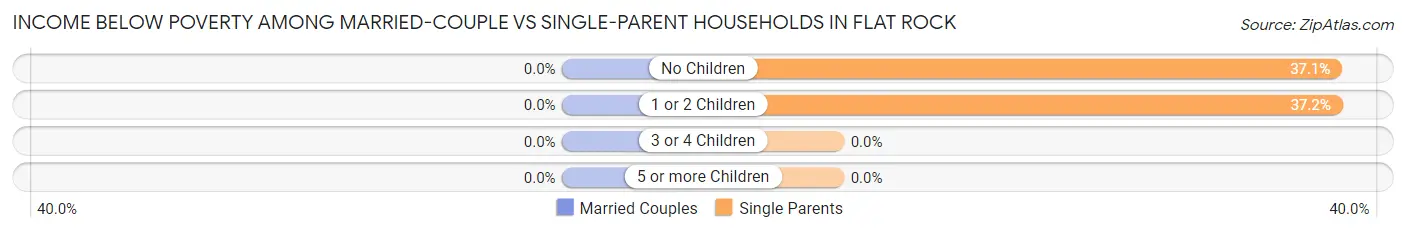
| Children | Married-Couple Families | Single-Parent Households |
| No Children | 0 (0.0%) | 13 (37.1%) |
| 1 or 2 Children | 0 (0.0%) | 29 (37.2%) |
| 3 or 4 Children | 0 (0.0%) | 0 (0.0%) |
| 5 or more Children | 0 (0.0%) | 0 (0.0%) |
| Total | 0 (0.0%) | 42 (37.2%) |
Race in Flat Rock
The most populous races in Flat Rock are White / Caucasian (950 | 89.1%), Hispanic or Latino (72 | 6.8%), and Two or more Races (61 | 5.7%).
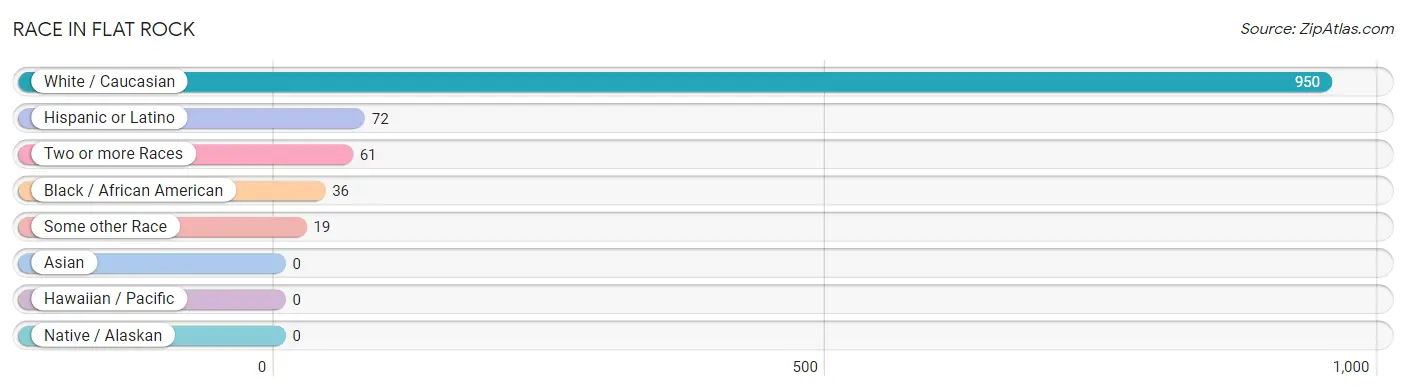
| Race | # Population | % Population |
| Asian | 0 | 0.0% |
| Black / African American | 36 | 3.4% |
| Hawaiian / Pacific | 0 | 0.0% |
| Hispanic or Latino | 72 | 6.8% |
| Native / Alaskan | 0 | 0.0% |
| White / Caucasian | 950 | 89.1% |
| Two or more Races | 61 | 5.7% |
| Some other Race | 19 | 1.8% |
| Total | 1,066 | 100.0% |
Ancestry in Flat Rock
The most populous ancestries reported in Flat Rock are English (189 | 17.7%), American (180 | 16.9%), Italian (74 | 6.9%), French (64 | 6.0%), and European (33 | 3.1%), together accounting for 50.7% of all Flat Rock residents.
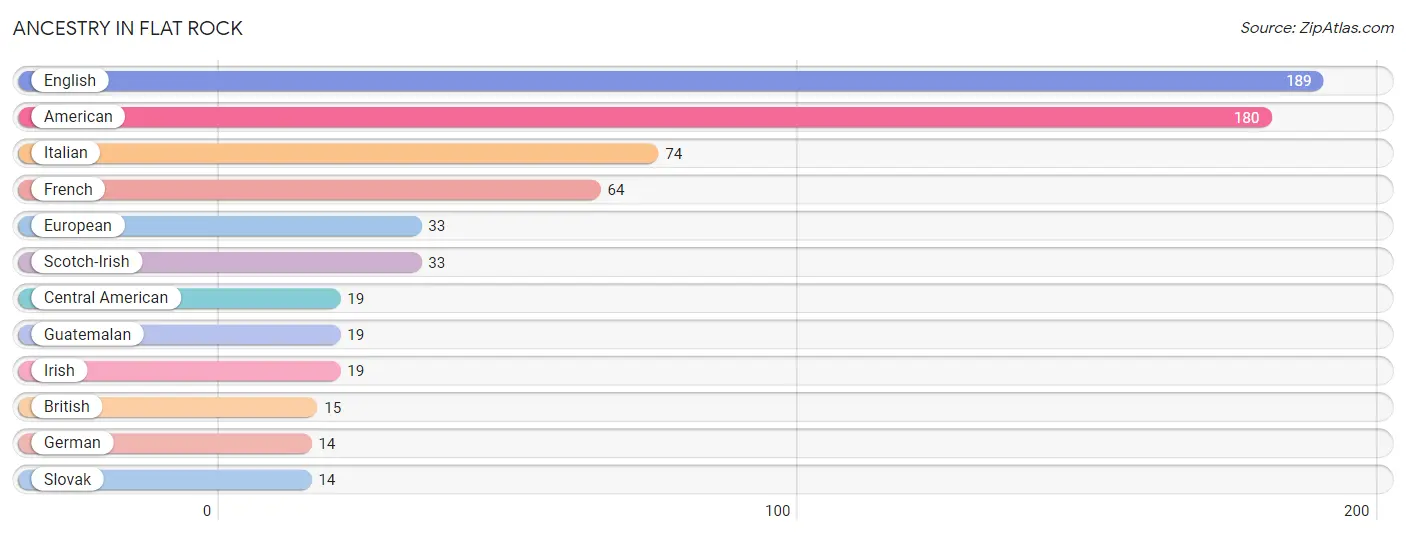
| Ancestry | # Population | % Population |
| American | 180 | 16.9% |
| British | 15 | 1.4% |
| Central American | 19 | 1.8% |
| English | 189 | 17.7% |
| European | 33 | 3.1% |
| French | 64 | 6.0% |
| German | 14 | 1.3% |
| Guatemalan | 19 | 1.8% |
| Irish | 19 | 1.8% |
| Italian | 74 | 6.9% |
| Scotch-Irish | 33 | 3.1% |
| Slovak | 14 | 1.3% | View All 12 Rows |
Immigrants in Flat Rock
The most numerous immigrant groups reported in Flat Rock came from Central America (19 | 1.8%), Guatemala (19 | 1.8%), and Latin America (19 | 1.8%), together accounting for 5.3% of all Flat Rock residents.
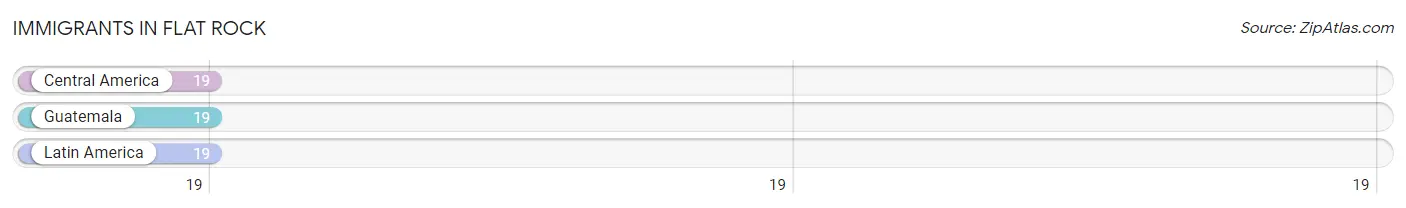
| Immigration Origin | # Population | % Population |
| Central America | 19 | 1.8% |
| Guatemala | 19 | 1.8% |
| Latin America | 19 | 1.8% | View All 3 Rows |
Sex and Age in Flat Rock
Sex and Age in Flat Rock
The most populous age groups in Flat Rock are 25 to 29 Years (60 | 12.3%) for men and 50 to 54 Years (79 | 13.6%) for women.
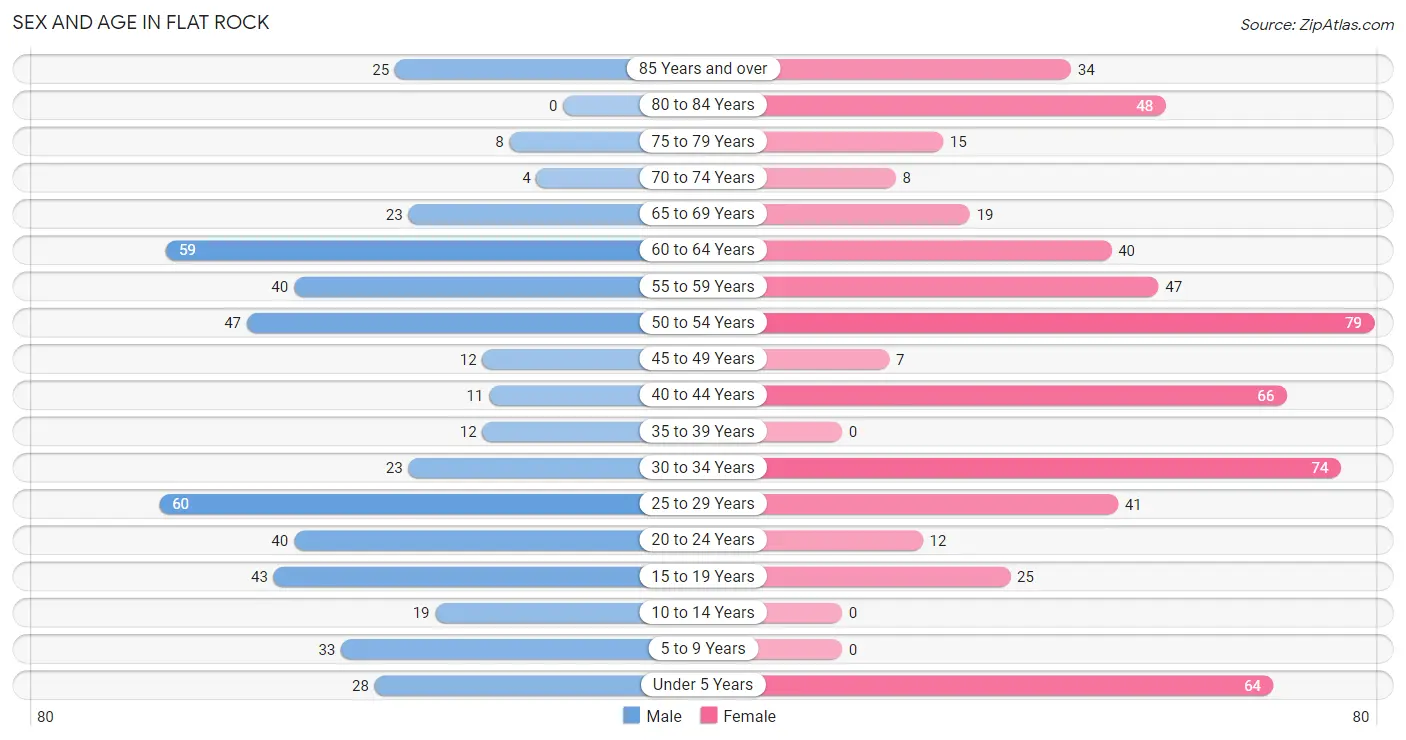
| Age Bracket | Male | Female |
| Under 5 Years | 28 (5.8%) | 64 (11.1%) |
| 5 to 9 Years | 33 (6.8%) | 0 (0.0%) |
| 10 to 14 Years | 19 (3.9%) | 0 (0.0%) |
| 15 to 19 Years | 43 (8.8%) | 25 (4.3%) |
| 20 to 24 Years | 40 (8.2%) | 12 (2.1%) |
| 25 to 29 Years | 60 (12.3%) | 41 (7.1%) |
| 30 to 34 Years | 23 (4.7%) | 74 (12.8%) |
| 35 to 39 Years | 12 (2.5%) | 0 (0.0%) |
| 40 to 44 Years | 11 (2.3%) | 66 (11.4%) |
| 45 to 49 Years | 12 (2.5%) | 7 (1.2%) |
| 50 to 54 Years | 47 (9.7%) | 79 (13.6%) |
| 55 to 59 Years | 40 (8.2%) | 47 (8.1%) |
| 60 to 64 Years | 59 (12.1%) | 40 (6.9%) |
| 65 to 69 Years | 23 (4.7%) | 19 (3.3%) |
| 70 to 74 Years | 4 (0.8%) | 8 (1.4%) |
| 75 to 79 Years | 8 (1.6%) | 15 (2.6%) |
| 80 to 84 Years | 0 (0.0%) | 48 (8.3%) |
| 85 Years and over | 25 (5.1%) | 34 (5.9%) |
| Total | 487 (100.0%) | 579 (100.0%) |
Families and Households in Flat Rock
Median Family Size in Flat Rock
The median family size in Flat Rock is 2.86 persons per family, with married-couple families (202 | 64.1%) accounting for the largest median family size of 3 persons per family. On the other hand, single male/father families (11 | 3.5%) represent the smallest median family size with 1.82 persons per family.
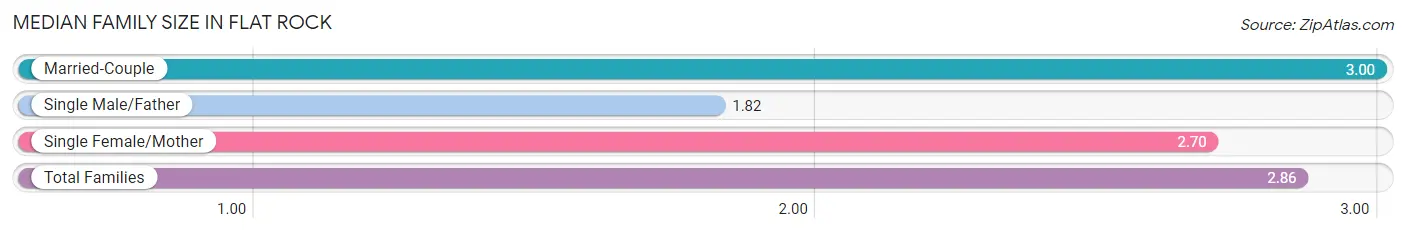
| Family Type | # Families | Family Size |
| Married-Couple | 202 (64.1%) | 3.00 |
| Single Male/Father | 11 (3.5%) | 1.82 |
| Single Female/Mother | 102 (32.4%) | 2.70 |
| Total Families | 315 (100.0%) | 2.86 |
Median Household Size in Flat Rock
The median household size in Flat Rock is 2.27 persons per household, with married-couple households (202 | 43.1%) accounting for the largest median household size of 3 persons per household. non-family households (154 | 32.8%) represent the smallest median household size with 1.08 persons per household.
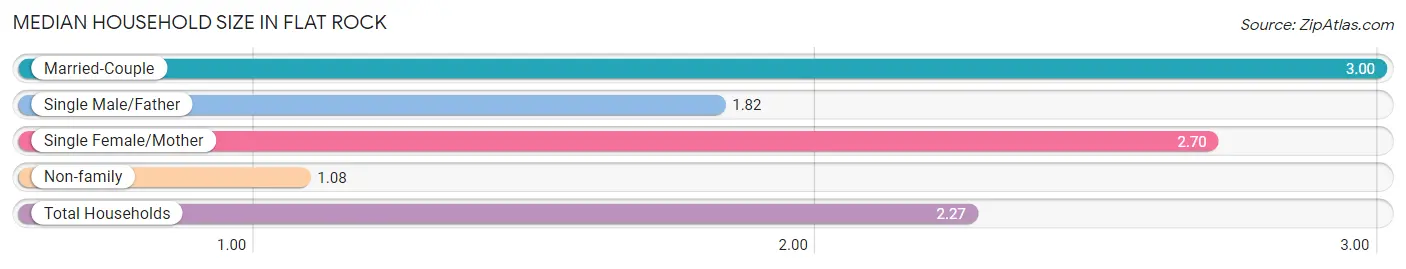
| Household Type | # Households | Household Size |
| Married-Couple | 202 (43.1%) | 3.00 |
| Single Male/Father | 11 (2.4%) | 1.82 |
| Single Female/Mother | 102 (21.7%) | 2.70 |
| Non-family | 154 (32.8%) | 1.08 |
| Total Households | 469 (100.0%) | 2.27 |
Household Size by Marriage Status in Flat Rock
Out of a total of 469 households in Flat Rock, 315 (67.2%) are family households, while 154 (32.8%) are nonfamily households. The most numerous type of family households are 3-person households, comprising 144, and the most common type of nonfamily households are 1-person households, comprising 142.
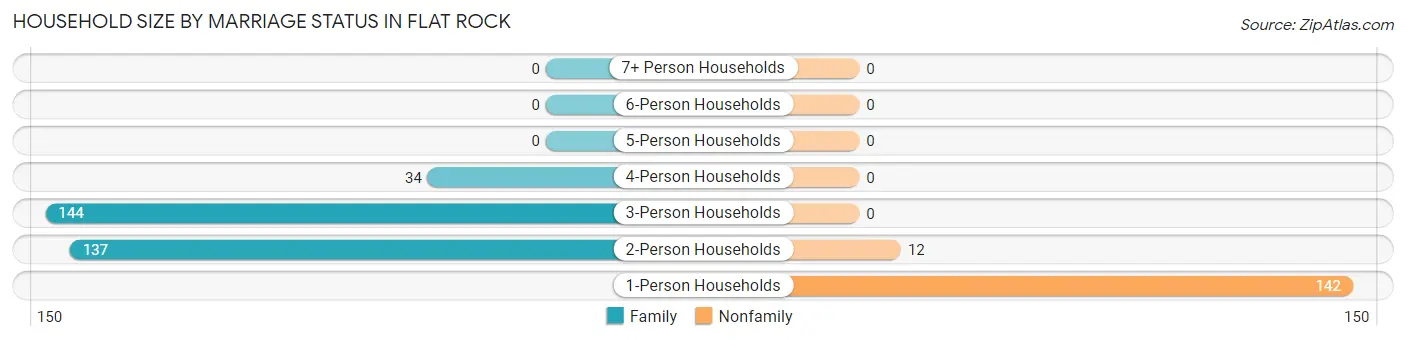
| Household Size | Family Households | Nonfamily Households |
| 1-Person Households | - | 142 (30.3%) |
| 2-Person Households | 137 (29.2%) | 12 (2.6%) |
| 3-Person Households | 144 (30.7%) | 0 (0.0%) |
| 4-Person Households | 34 (7.2%) | 0 (0.0%) |
| 5-Person Households | 0 (0.0%) | 0 (0.0%) |
| 6-Person Households | 0 (0.0%) | 0 (0.0%) |
| 7+ Person Households | 0 (0.0%) | 0 (0.0%) |
| Total | 315 (67.2%) | 154 (32.8%) |
Female Fertility in Flat Rock
Fertility by Age in Flat Rock
| Age Bracket | Women with Births | Births / 1,000 Women |
| 15 to 19 years | 0 (0.0%) | 0.0 |
| 20 to 34 years | 0 (0.0%) | 0.0 |
| 35 to 50 years | 0 (0.0%) | 0.0 |
| Total | 0 (0.0%) | 0.0 |
Fertility by Age by Marriage Status in Flat Rock
| Age Bracket | Married | Unmarried |
| 15 to 19 years | 0 (0.0%) | 0 (0.0%) |
| 20 to 34 years | 0 (0.0%) | 0 (0.0%) |
| 35 to 50 years | 0 (0.0%) | 0 (0.0%) |
| Total | 0 (0.0%) | 0 (0.0%) |
Fertility by Education in Flat Rock
| Educational Attainment | Women with Births | Births / 1,000 Women |
| Less than High School | 0 (0.0%) | 0.0 |
| High School Diploma | 0 (0.0%) | 0.0 |
| College or Associate's Degree | 0 (0.0%) | 0.0 |
| Bachelor's Degree | 0 (0.0%) | 0.0 |
| Graduate Degree | 0 (0.0%) | 0.0 |
| Total | 0 (0.0%) | 0.0 |
Fertility by Education by Marriage Status in Flat Rock
| Educational Attainment | Married | Unmarried |
| Less than High School | 0 (0.0%) | 0 (0.0%) |
| High School Diploma | 0 (0.0%) | 0 (0.0%) |
| College or Associate's Degree | 0 (0.0%) | 0 (0.0%) |
| Bachelor's Degree | 0 (0.0%) | 0 (0.0%) |
| Graduate Degree | 0 (0.0%) | 0 (0.0%) |
| Total | 0 (0.0%) | 0 (0.0%) |
Employment Characteristics in Flat Rock
Employment by Class of Employer in Flat Rock
Among the 455 employed individuals in Flat Rock, private company employees (393 | 86.4%), self-employed (not incorporated) (29 | 6.4%), and state government employees (20 | 4.4%) make up the most common classes of employment.
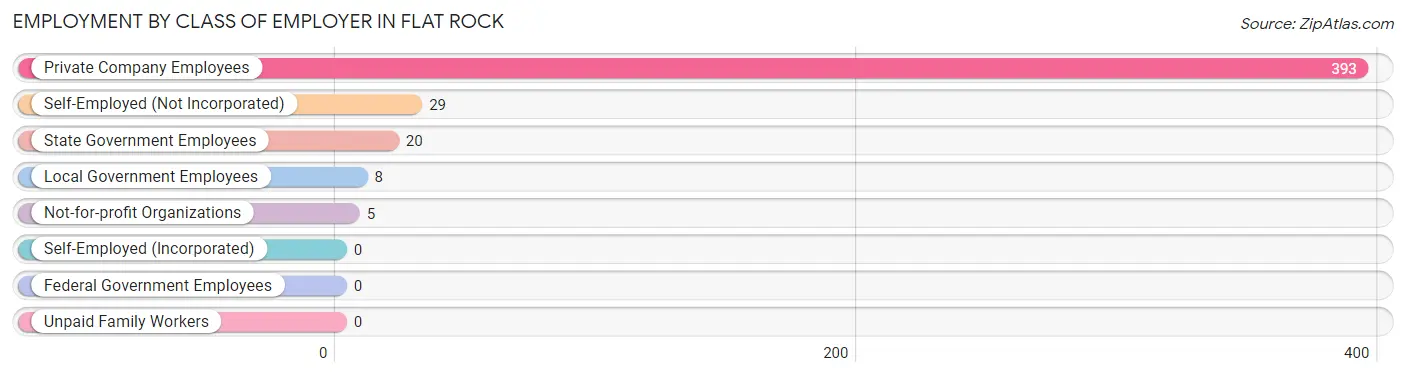
| Employer Class | # Employees | % Employees |
| Private Company Employees | 393 | 86.4% |
| Self-Employed (Incorporated) | 0 | 0.0% |
| Self-Employed (Not Incorporated) | 29 | 6.4% |
| Not-for-profit Organizations | 5 | 1.1% |
| Local Government Employees | 8 | 1.8% |
| State Government Employees | 20 | 4.4% |
| Federal Government Employees | 0 | 0.0% |
| Unpaid Family Workers | 0 | 0.0% |
| Total | 455 | 100.0% |
Employment Status by Age in Flat Rock
According to the labor force statistics for Flat Rock, out of the total population over 16 years of age (922), 53.0% or 489 individuals are in the labor force, with 3.3% or 16 of them unemployed. The age group with the highest labor force participation rate is 30 to 34 years, with 100.0% or 97 individuals in the labor force. Within the labor force, the 16 to 19 years age range has the highest percentage of unemployed individuals, with 66.7% or 16 of them being unemployed.
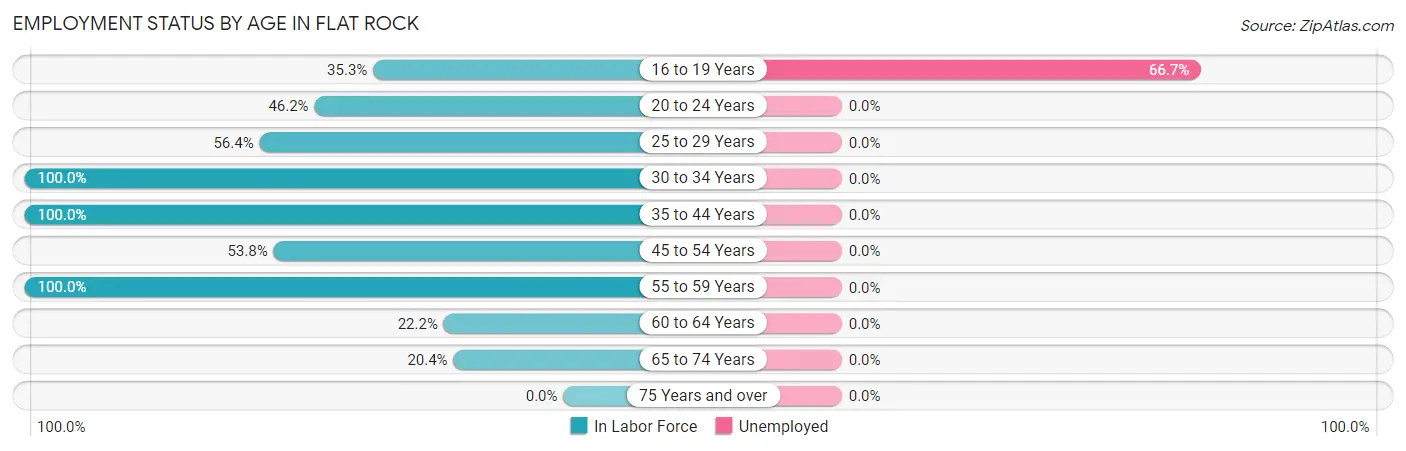
| Age Bracket | In Labor Force | Unemployed |
| 16 to 19 Years | 24 (35.3%) | 16 (66.7%) |
| 20 to 24 Years | 24 (46.2%) | 0 (0.0%) |
| 25 to 29 Years | 57 (56.4%) | 0 (0.0%) |
| 30 to 34 Years | 97 (100.0%) | 0 (0.0%) |
| 35 to 44 Years | 89 (100.0%) | 0 (0.0%) |
| 45 to 54 Years | 78 (53.8%) | 0 (0.0%) |
| 55 to 59 Years | 87 (100.0%) | 0 (0.0%) |
| 60 to 64 Years | 22 (22.2%) | 0 (0.0%) |
| 65 to 74 Years | 11 (20.4%) | 0 (0.0%) |
| 75 Years and over | 0 (0.0%) | 0 (0.0%) |
| Total | 489 (53.0%) | 16 (3.3%) |
Employment Status by Educational Attainment in Flat Rock
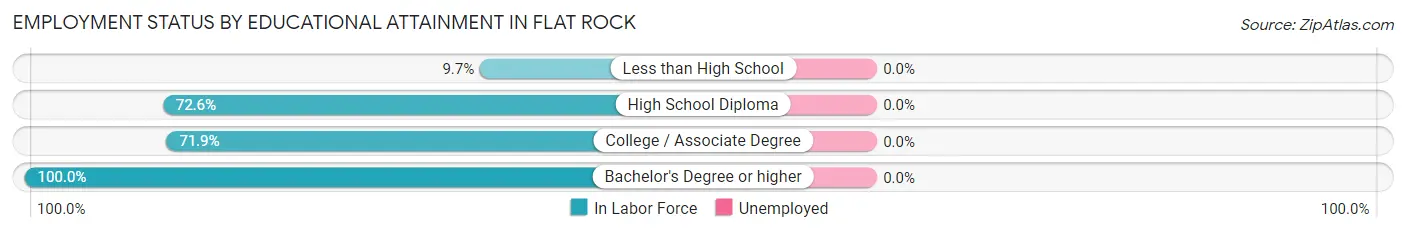
| Educational Attainment | In Labor Force | Unemployed |
| Less than High School | 7 (9.7%) | 0 (0.0%) |
| High School Diploma | 180 (72.6%) | 0 (0.0%) |
| College / Associate Degree | 141 (71.9%) | 0 (0.0%) |
| Bachelor's Degree or higher | 102 (100.0%) | 0 (0.0%) |
| Total | 430 (69.6%) | 0 (0.0%) |
Employment Occupations by Sex in Flat Rock
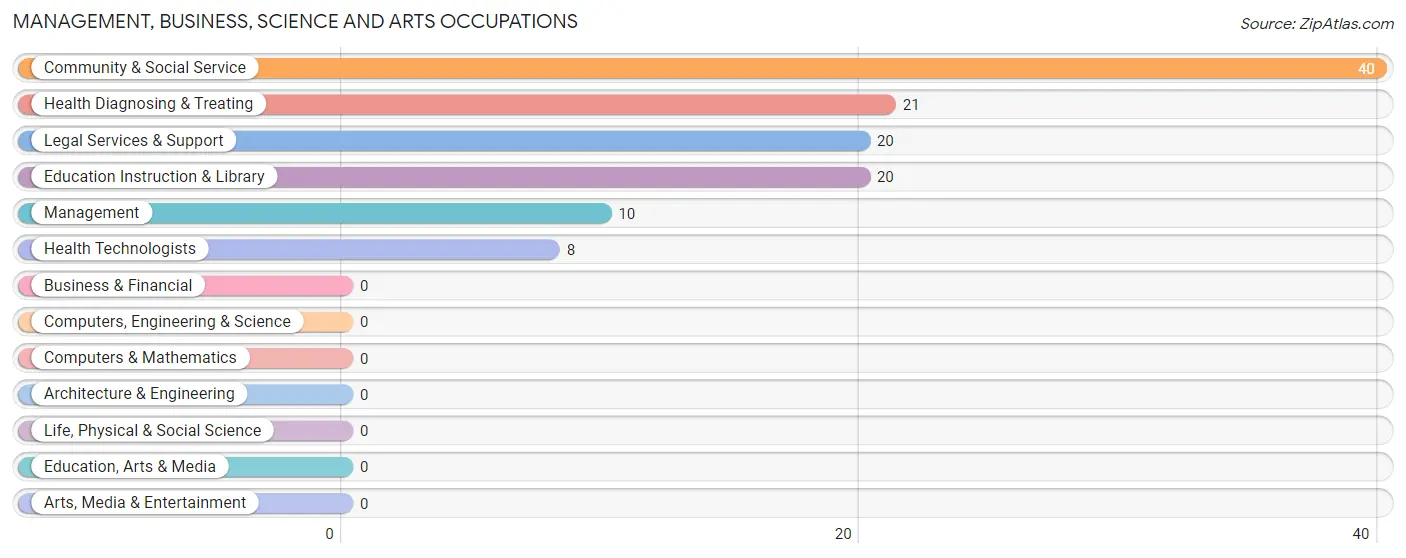
Management, Business, Science and Arts Occupations
The most common Management, Business, Science and Arts occupations in Flat Rock are Community & Social Service (40 | 8.5%), Health Diagnosing & Treating (21 | 4.4%), Legal Services & Support (20 | 4.2%), Education Instruction & Library (20 | 4.2%), and Management (10 | 2.1%).
Management, Business, Science and Arts Occupations by Sex
Within the Management, Business, Science and Arts occupations in Flat Rock, the most male-oriented occupations are Management (50.0%), Education Instruction & Library (45.0%), and Community & Social Service (22.5%), while the most female-oriented occupations are Legal Services & Support (100.0%), Health Diagnosing & Treating (100.0%), and Health Technologists (100.0%).
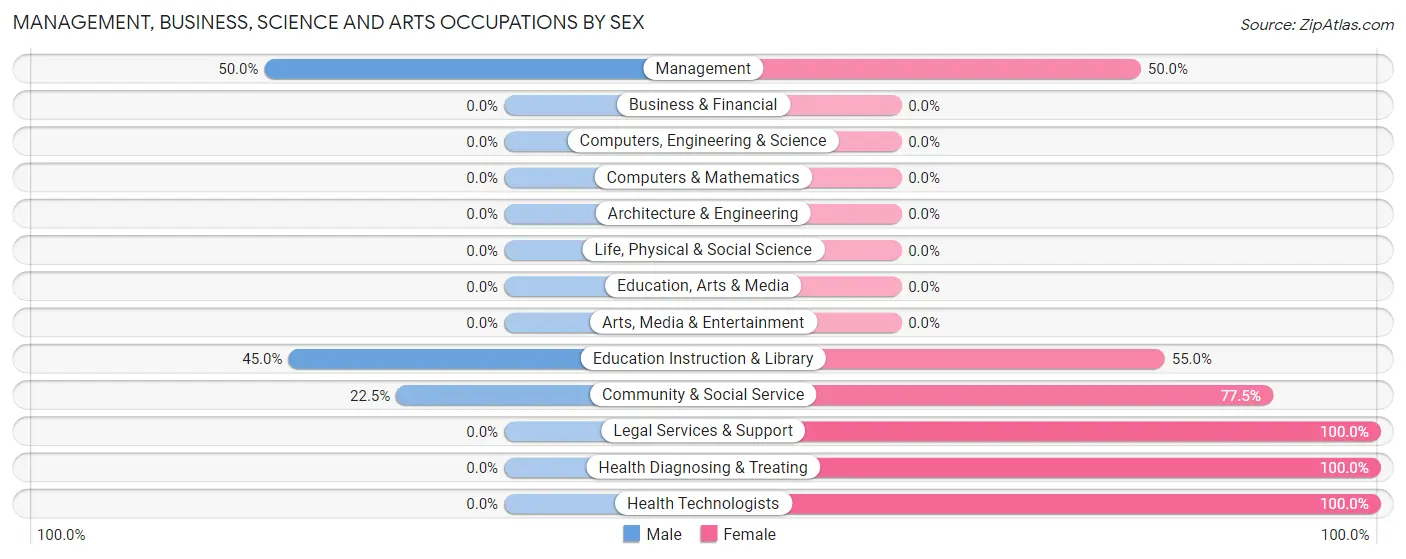
| Occupation | Male | Female |
| Management | 5 (50.0%) | 5 (50.0%) |
| Business & Financial | 0 (0.0%) | 0 (0.0%) |
| Computers, Engineering & Science | 0 (0.0%) | 0 (0.0%) |
| Computers & Mathematics | 0 (0.0%) | 0 (0.0%) |
| Architecture & Engineering | 0 (0.0%) | 0 (0.0%) |
| Life, Physical & Social Science | 0 (0.0%) | 0 (0.0%) |
| Community & Social Service | 9 (22.5%) | 31 (77.5%) |
| Education, Arts & Media | 0 (0.0%) | 0 (0.0%) |
| Legal Services & Support | 0 (0.0%) | 20 (100.0%) |
| Education Instruction & Library | 9 (45.0%) | 11 (55.0%) |
| Arts, Media & Entertainment | 0 (0.0%) | 0 (0.0%) |
| Health Diagnosing & Treating | 0 (0.0%) | 21 (100.0%) |
| Health Technologists | 0 (0.0%) | 8 (100.0%) |
| Total (Category) | 14 (19.7%) | 57 (80.3%) |
| Total (Overall) | 222 (46.9%) | 251 (53.1%) |
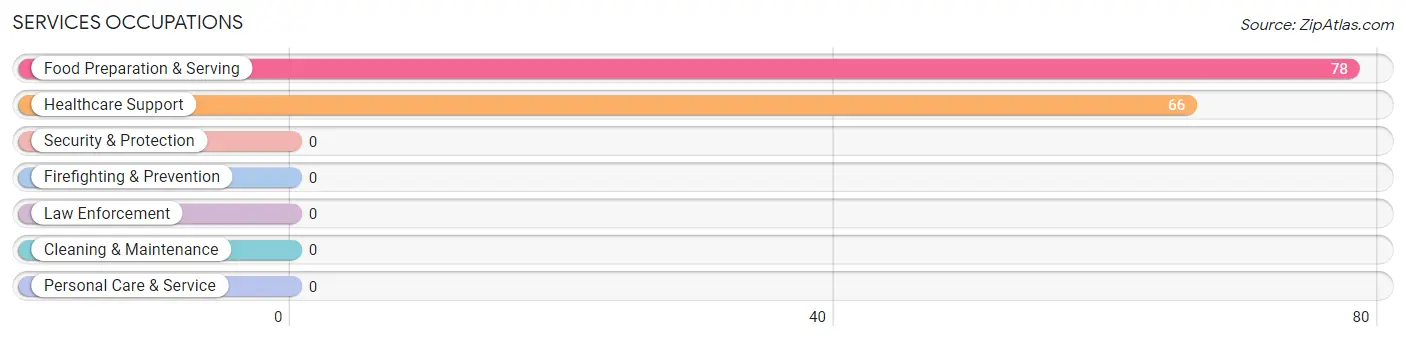
Services Occupations
The most common Services occupations in Flat Rock are Food Preparation & Serving (78 | 16.5%), and Healthcare Support (66 | 14.0%).
Services Occupations by Sex
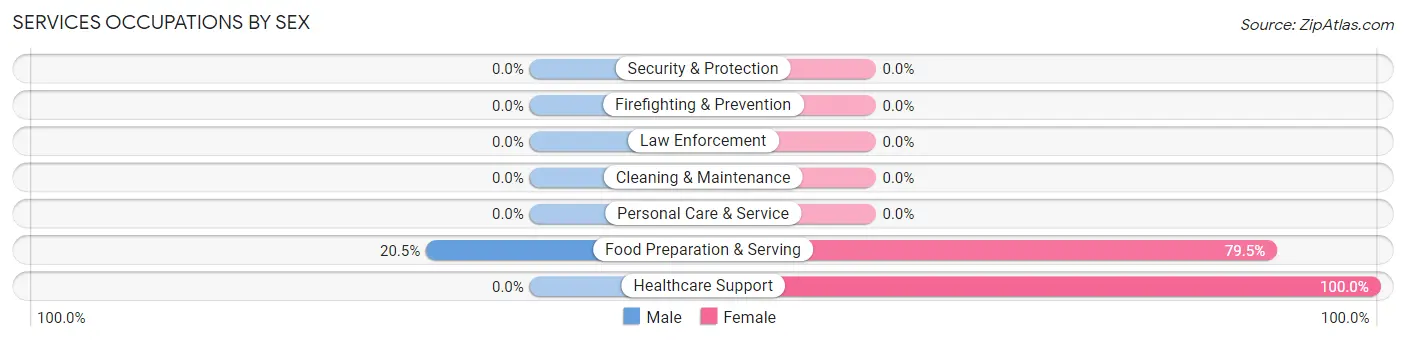
| Occupation | Male | Female |
| Healthcare Support | 0 (0.0%) | 66 (100.0%) |
| Security & Protection | 0 (0.0%) | 0 (0.0%) |
| Firefighting & Prevention | 0 (0.0%) | 0 (0.0%) |
| Law Enforcement | 0 (0.0%) | 0 (0.0%) |
| Food Preparation & Serving | 16 (20.5%) | 62 (79.5%) |
| Cleaning & Maintenance | 0 (0.0%) | 0 (0.0%) |
| Personal Care & Service | 0 (0.0%) | 0 (0.0%) |
| Total (Category) | 16 (11.1%) | 128 (88.9%) |
| Total (Overall) | 222 (46.9%) | 251 (53.1%) |
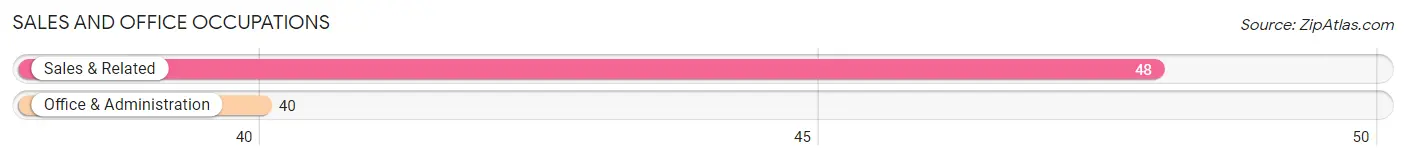
Sales and Office Occupations
The most common Sales and Office occupations in Flat Rock are Sales & Related (48 | 10.2%), and Office & Administration (40 | 8.5%).
Sales and Office Occupations by Sex
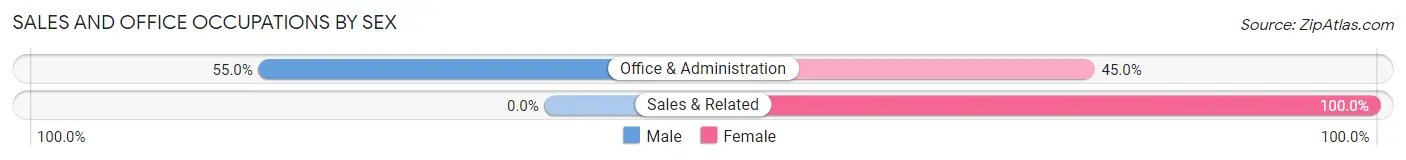
| Occupation | Male | Female |
| Sales & Related | 0 (0.0%) | 48 (100.0%) |
| Office & Administration | 22 (55.0%) | 18 (45.0%) |
| Total (Category) | 22 (25.0%) | 66 (75.0%) |
| Total (Overall) | 222 (46.9%) | 251 (53.1%) |
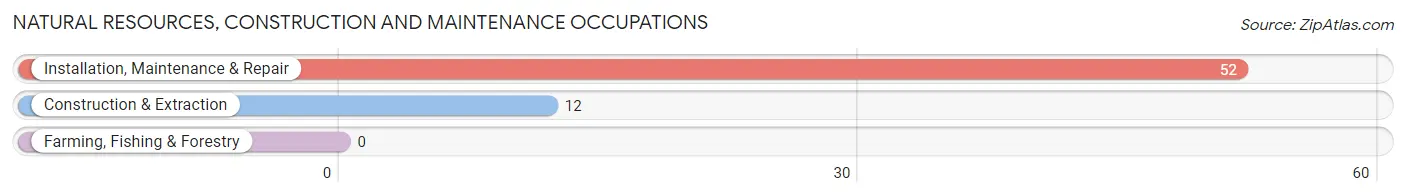
Natural Resources, Construction and Maintenance Occupations
The most common Natural Resources, Construction and Maintenance occupations in Flat Rock are Installation, Maintenance & Repair (52 | 11.0%), and Construction & Extraction (12 | 2.5%).
Natural Resources, Construction and Maintenance Occupations by Sex
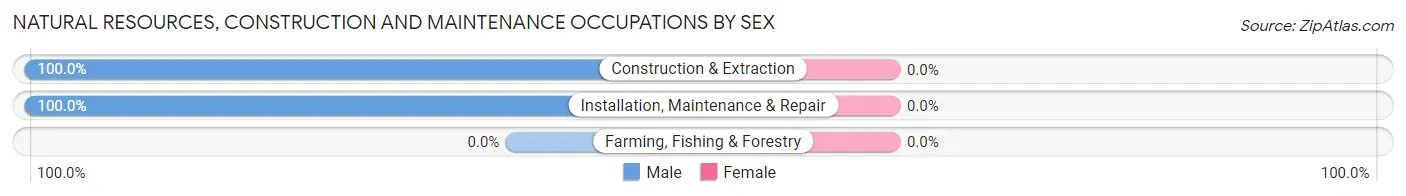
| Occupation | Male | Female |
| Farming, Fishing & Forestry | 0 (0.0%) | 0 (0.0%) |
| Construction & Extraction | 12 (100.0%) | 0 (0.0%) |
| Installation, Maintenance & Repair | 52 (100.0%) | 0 (0.0%) |
| Total (Category) | 64 (100.0%) | 0 (0.0%) |
| Total (Overall) | 222 (46.9%) | 251 (53.1%) |
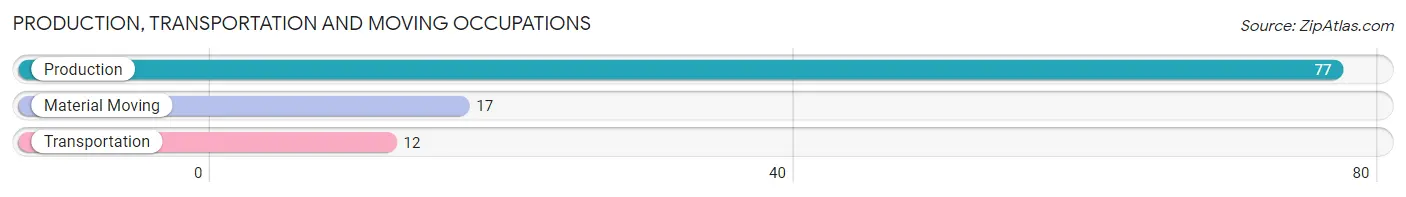
Production, Transportation and Moving Occupations
The most common Production, Transportation and Moving occupations in Flat Rock are Production (77 | 16.3%), Material Moving (17 | 3.6%), and Transportation (12 | 2.5%).
Production, Transportation and Moving Occupations by Sex
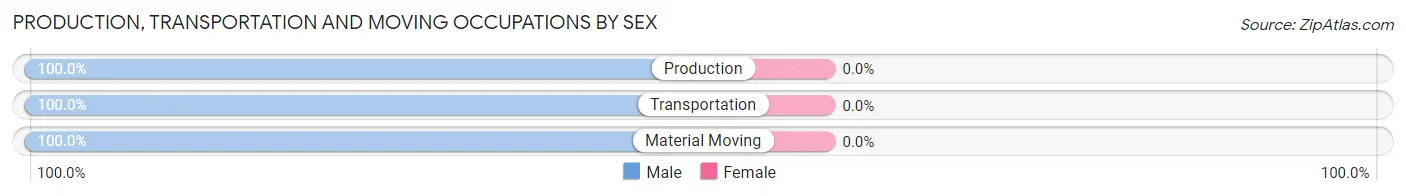
| Occupation | Male | Female |
| Production | 77 (100.0%) | 0 (0.0%) |
| Transportation | 12 (100.0%) | 0 (0.0%) |
| Material Moving | 17 (100.0%) | 0 (0.0%) |
| Total (Category) | 106 (100.0%) | 0 (0.0%) |
| Total (Overall) | 222 (46.9%) | 251 (53.1%) |
Employment Industries by Sex in Flat Rock
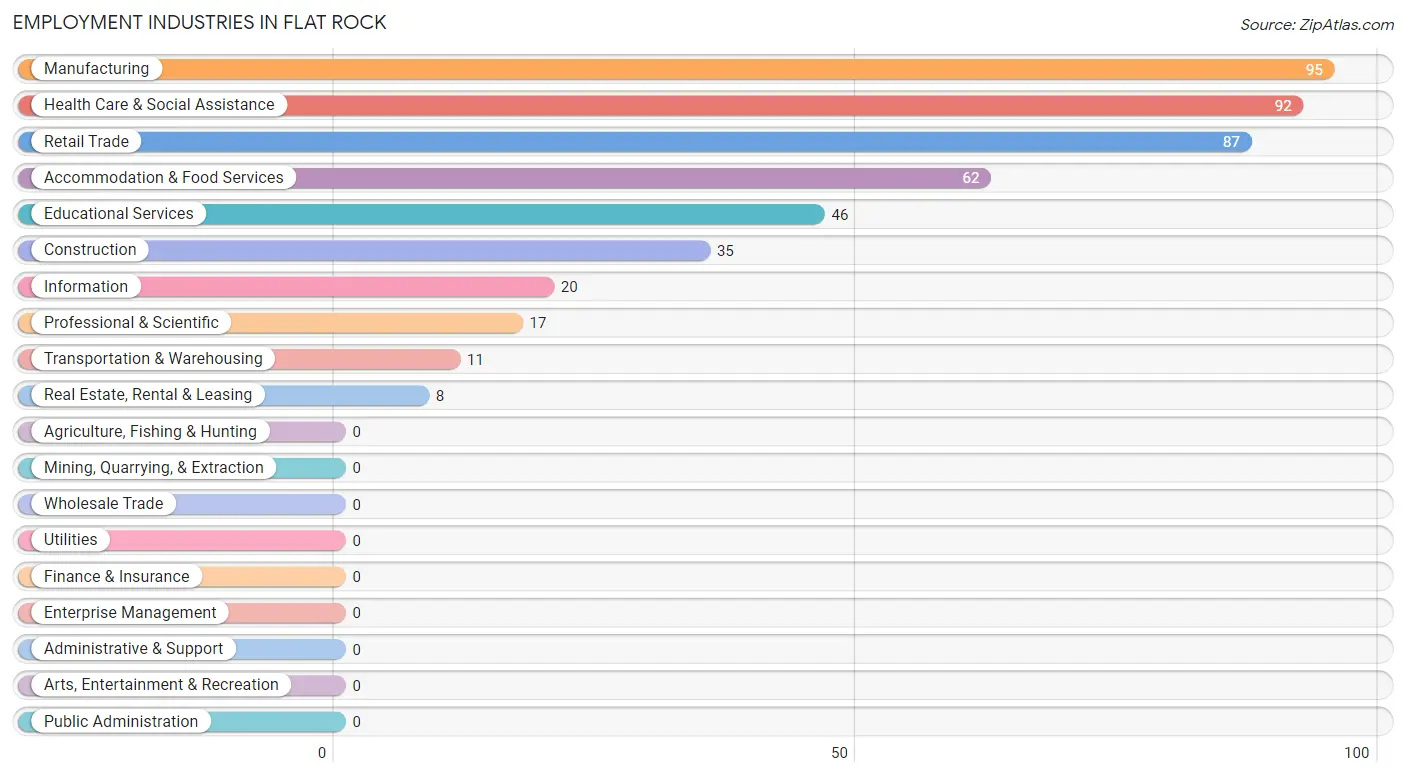
Employment Industries in Flat Rock
The major employment industries in Flat Rock include Manufacturing (95 | 20.1%), Health Care & Social Assistance (92 | 19.5%), Retail Trade (87 | 18.4%), Accommodation & Food Services (62 | 13.1%), and Educational Services (46 | 9.7%).
Employment Industries by Sex in Flat Rock
The Flat Rock industries that see more men than women are Manufacturing (100.0%), Real Estate, Rental & Leasing (100.0%), and Professional & Scientific (100.0%), whereas the industries that tend to have a higher number of women are Transportation & Warehousing (100.0%), Information (100.0%), and Health Care & Social Assistance (100.0%).
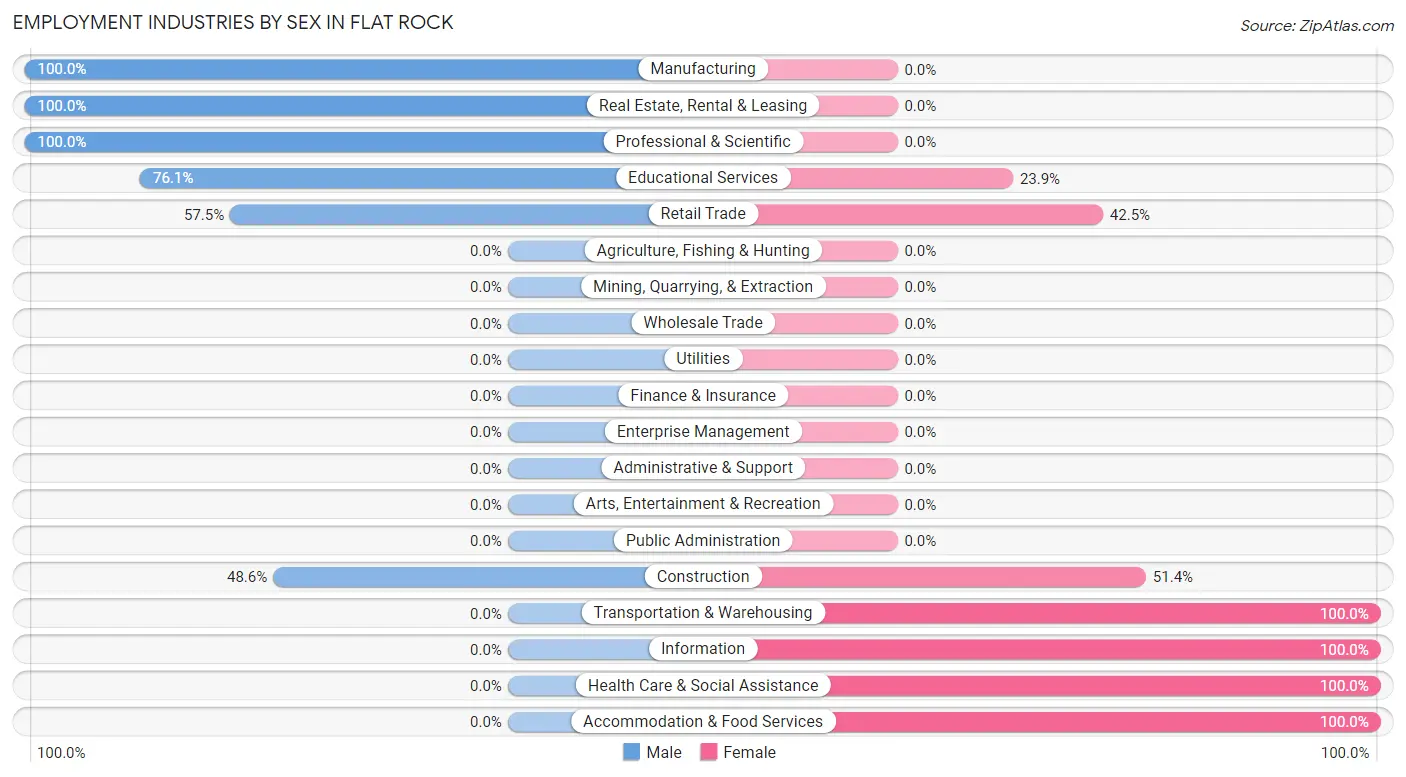
| Industry | Male | Female |
| Agriculture, Fishing & Hunting | 0 (0.0%) | 0 (0.0%) |
| Mining, Quarrying, & Extraction | 0 (0.0%) | 0 (0.0%) |
| Construction | 17 (48.6%) | 18 (51.4%) |
| Manufacturing | 95 (100.0%) | 0 (0.0%) |
| Wholesale Trade | 0 (0.0%) | 0 (0.0%) |
| Retail Trade | 50 (57.5%) | 37 (42.5%) |
| Transportation & Warehousing | 0 (0.0%) | 11 (100.0%) |
| Utilities | 0 (0.0%) | 0 (0.0%) |
| Information | 0 (0.0%) | 20 (100.0%) |
| Finance & Insurance | 0 (0.0%) | 0 (0.0%) |
| Real Estate, Rental & Leasing | 8 (100.0%) | 0 (0.0%) |
| Professional & Scientific | 17 (100.0%) | 0 (0.0%) |
| Enterprise Management | 0 (0.0%) | 0 (0.0%) |
| Administrative & Support | 0 (0.0%) | 0 (0.0%) |
| Educational Services | 35 (76.1%) | 11 (23.9%) |
| Health Care & Social Assistance | 0 (0.0%) | 92 (100.0%) |
| Arts, Entertainment & Recreation | 0 (0.0%) | 0 (0.0%) |
| Accommodation & Food Services | 0 (0.0%) | 62 (100.0%) |
| Public Administration | 0 (0.0%) | 0 (0.0%) |
| Total | 222 (46.9%) | 251 (53.1%) |
Education in Flat Rock
School Enrollment in Flat Rock
The most common levels of schooling among the 117 students in Flat Rock are high school (68 | 58.1%), middle school (30 | 25.6%), and kindergarten (10 | 8.6%).
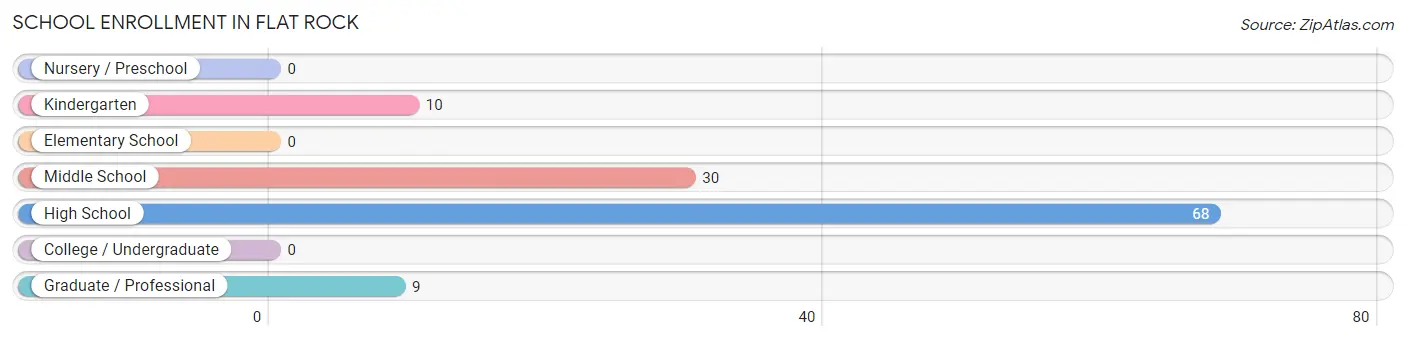
| School Level | # Students | % Students |
| Nursery / Preschool | 0 | 0.0% |
| Kindergarten | 10 | 8.6% |
| Elementary School | 0 | 0.0% |
| Middle School | 30 | 25.6% |
| High School | 68 | 58.1% |
| College / Undergraduate | 0 | 0.0% |
| Graduate / Professional | 9 | 7.7% |
| Total | 117 | 100.0% |
School Enrollment by Age by Funding Source in Flat Rock
Out of a total of 117 students who are enrolled in schools in Flat Rock, 30 (25.6%) attend a private institution, while the remaining 87 (74.4%) are enrolled in public schools. The age group of 5 to 9 year old has the highest likelihood of being enrolled in private schools, with 10 (100.0% in the age bracket) enrolled. Conversely, the age group of 10 to 14 year olds has the lowest likelihood of being enrolled in a private school, with 19 (100.0% in the age bracket) attending a public institution.
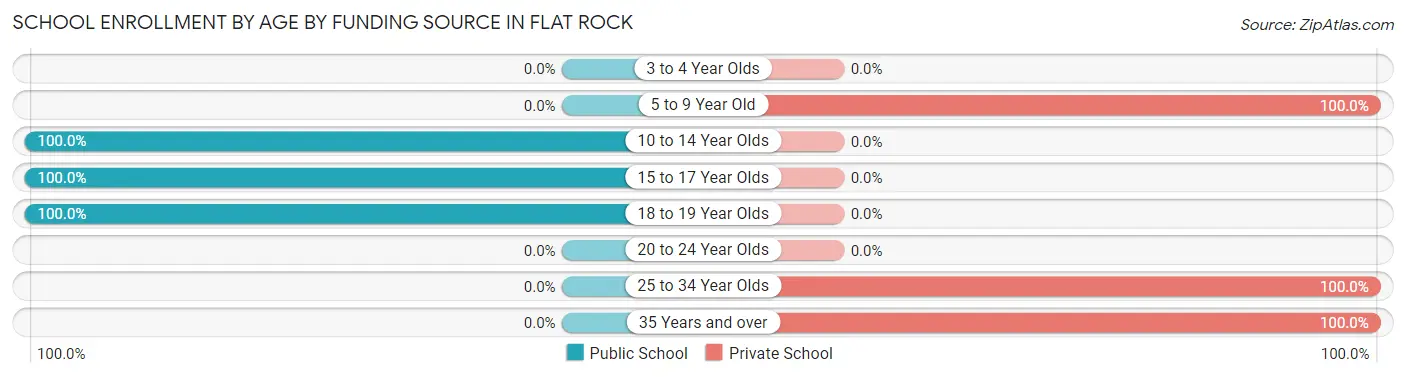
| Age Bracket | Public School | Private School |
| 3 to 4 Year Olds | 0 (0.0%) | 0 (0.0%) |
| 5 to 9 Year Old | 0 (0.0%) | 10 (100.0%) |
| 10 to 14 Year Olds | 19 (100.0%) | 0 (0.0%) |
| 15 to 17 Year Olds | 43 (100.0%) | 0 (0.0%) |
| 18 to 19 Year Olds | 25 (100.0%) | 0 (0.0%) |
| 20 to 24 Year Olds | 0 (0.0%) | 0 (0.0%) |
| 25 to 34 Year Olds | 0 (0.0%) | 9 (100.0%) |
| 35 Years and over | 0 (0.0%) | 11 (100.0%) |
| Total | 87 (74.4%) | 30 (25.6%) |
Educational Attainment by Field of Study in Flat Rock
Business (52 | 46.0%), education (22 | 19.5%), engineering (14 | 12.4%), arts & humanities (11 | 9.7%), and computers & mathematics (9 | 8.0%) are the most common fields of study among 113 individuals in Flat Rock who have obtained a bachelor's degree or higher.
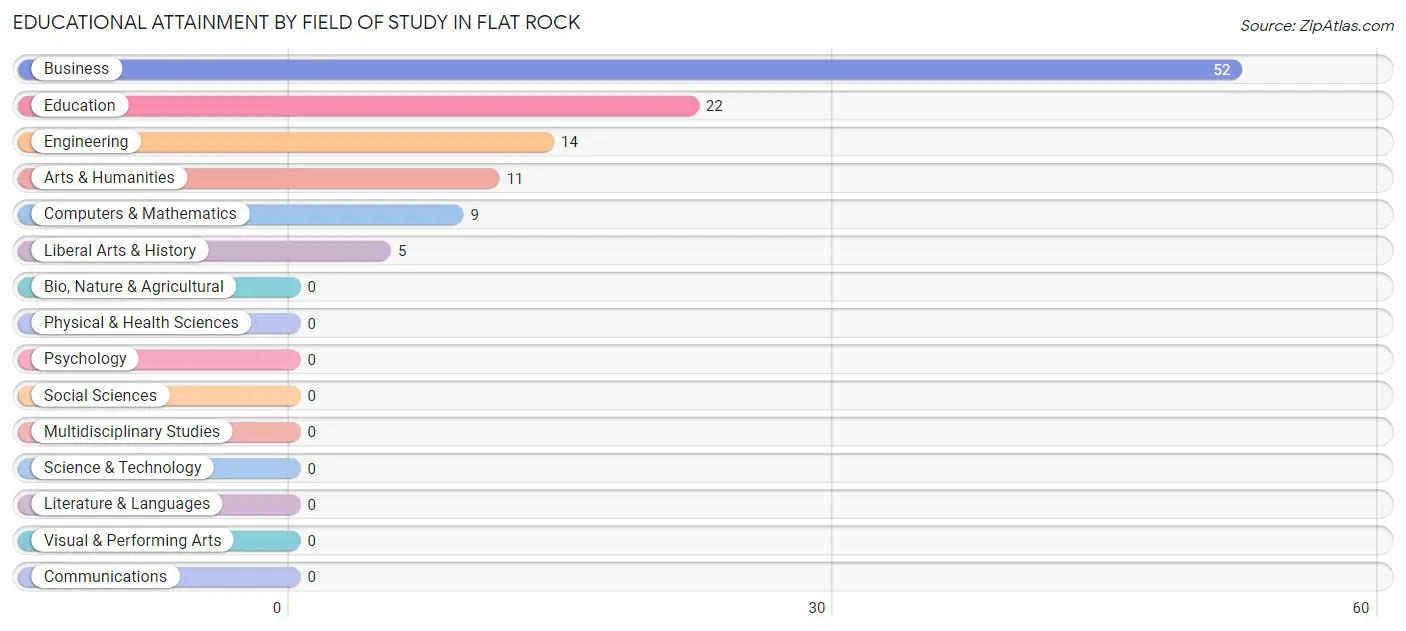
| Field of Study | # Graduates | % Graduates |
| Computers & Mathematics | 9 | 8.0% |
| Bio, Nature & Agricultural | 0 | 0.0% |
| Physical & Health Sciences | 0 | 0.0% |
| Psychology | 0 | 0.0% |
| Social Sciences | 0 | 0.0% |
| Engineering | 14 | 12.4% |
| Multidisciplinary Studies | 0 | 0.0% |
| Science & Technology | 0 | 0.0% |
| Business | 52 | 46.0% |
| Education | 22 | 19.5% |
| Literature & Languages | 0 | 0.0% |
| Liberal Arts & History | 5 | 4.4% |
| Visual & Performing Arts | 0 | 0.0% |
| Communications | 0 | 0.0% |
| Arts & Humanities | 11 | 9.7% |
| Total | 113 | 100.0% |
Transportation & Commute in Flat Rock
Vehicle Availability by Sex in Flat Rock
The most prevalent vehicle ownership categories in Flat Rock are males with 3 vehicles (58, accounting for 26.1%) and females with 3 vehicles (98, making up 24.9%).
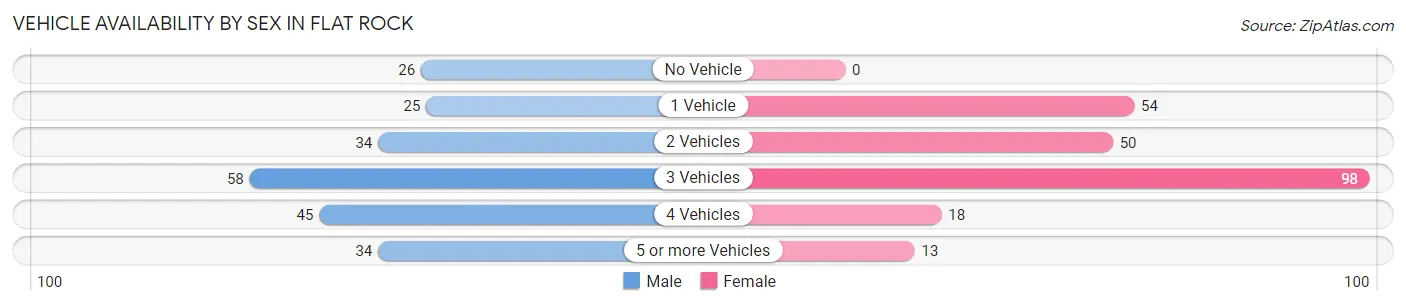
| Vehicles Available | Male | Female |
| No Vehicle | 26 (11.7%) | 0 (0.0%) |
| 1 Vehicle | 25 (11.3%) | 54 (23.2%) |
| 2 Vehicles | 34 (15.3%) | 50 (21.5%) |
| 3 Vehicles | 58 (26.1%) | 98 (42.1%) |
| 4 Vehicles | 45 (20.3%) | 18 (7.7%) |
| 5 or more Vehicles | 34 (15.3%) | 13 (5.6%) |
| Total | 222 (100.0%) | 233 (100.0%) |
Commute Time in Flat Rock
The most frequently occuring commute durations in Flat Rock are 10 to 14 minutes (205 commuters, 48.3%), 15 to 19 minutes (80 commuters, 18.9%), and 5 to 9 minutes (49 commuters, 11.6%).
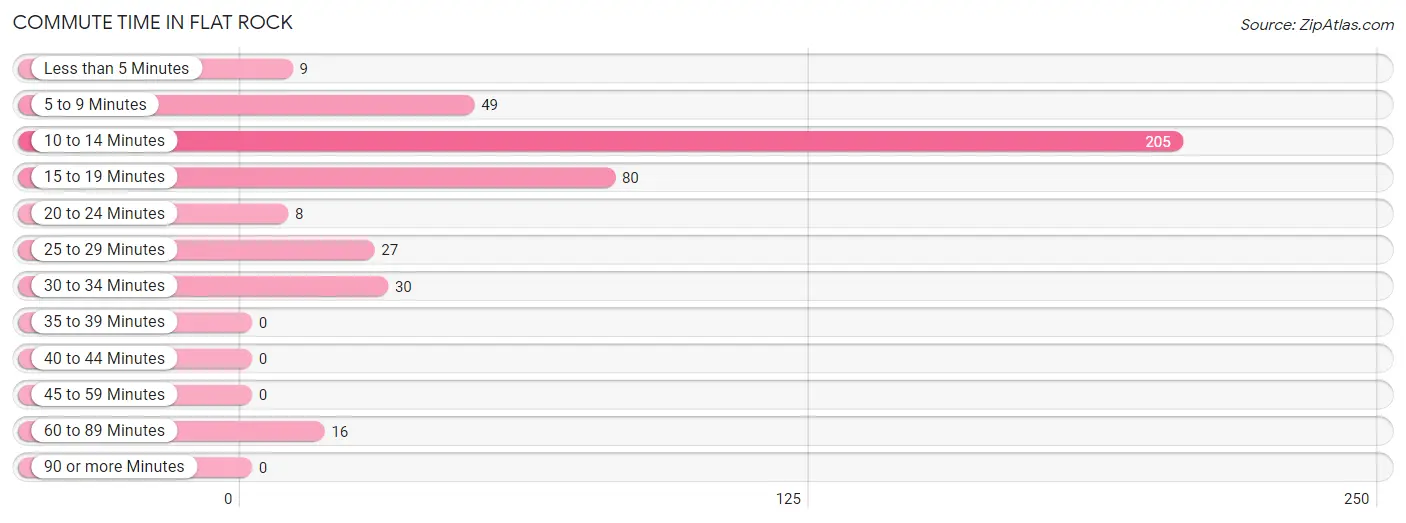
| Commute Time | # Commuters | % Commuters |
| Less than 5 Minutes | 9 | 2.1% |
| 5 to 9 Minutes | 49 | 11.6% |
| 10 to 14 Minutes | 205 | 48.3% |
| 15 to 19 Minutes | 80 | 18.9% |
| 20 to 24 Minutes | 8 | 1.9% |
| 25 to 29 Minutes | 27 | 6.4% |
| 30 to 34 Minutes | 30 | 7.1% |
| 35 to 39 Minutes | 0 | 0.0% |
| 40 to 44 Minutes | 0 | 0.0% |
| 45 to 59 Minutes | 0 | 0.0% |
| 60 to 89 Minutes | 16 | 3.8% |
| 90 or more Minutes | 0 | 0.0% |
Commute Time by Sex in Flat Rock
The most common commute times in Flat Rock are 10 to 14 minutes (86 commuters, 40.8%) for males and 10 to 14 minutes (119 commuters, 55.9%) for females.
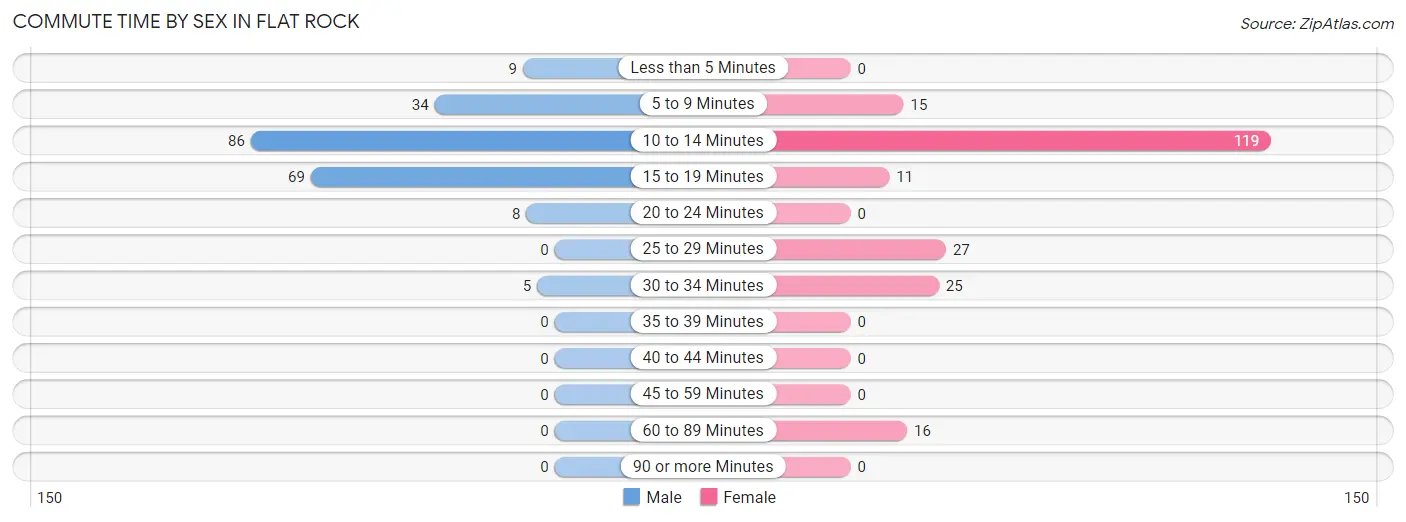
| Commute Time | Male | Female |
| Less than 5 Minutes | 9 (4.3%) | 0 (0.0%) |
| 5 to 9 Minutes | 34 (16.1%) | 15 (7.0%) |
| 10 to 14 Minutes | 86 (40.8%) | 119 (55.9%) |
| 15 to 19 Minutes | 69 (32.7%) | 11 (5.2%) |
| 20 to 24 Minutes | 8 (3.8%) | 0 (0.0%) |
| 25 to 29 Minutes | 0 (0.0%) | 27 (12.7%) |
| 30 to 34 Minutes | 5 (2.4%) | 25 (11.7%) |
| 35 to 39 Minutes | 0 (0.0%) | 0 (0.0%) |
| 40 to 44 Minutes | 0 (0.0%) | 0 (0.0%) |
| 45 to 59 Minutes | 0 (0.0%) | 0 (0.0%) |
| 60 to 89 Minutes | 0 (0.0%) | 16 (7.5%) |
| 90 or more Minutes | 0 (0.0%) | 0 (0.0%) |
Time of Departure to Work by Sex in Flat Rock
The most frequent times of departure to work in Flat Rock are 6:00 AM to 6:29 AM (83, 39.3%) for males and 5:00 AM to 5:29 AM (63, 29.6%) for females.
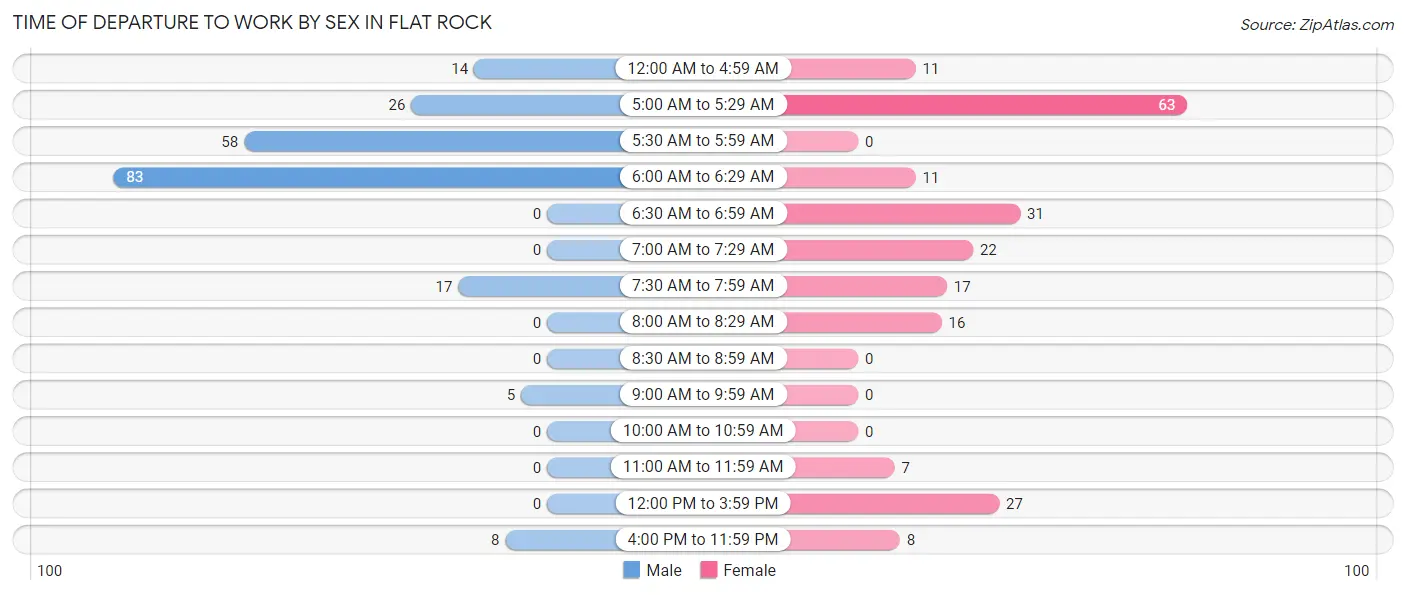
| Time of Departure | Male | Female |
| 12:00 AM to 4:59 AM | 14 (6.6%) | 11 (5.2%) |
| 5:00 AM to 5:29 AM | 26 (12.3%) | 63 (29.6%) |
| 5:30 AM to 5:59 AM | 58 (27.5%) | 0 (0.0%) |
| 6:00 AM to 6:29 AM | 83 (39.3%) | 11 (5.2%) |
| 6:30 AM to 6:59 AM | 0 (0.0%) | 31 (14.5%) |
| 7:00 AM to 7:29 AM | 0 (0.0%) | 22 (10.3%) |
| 7:30 AM to 7:59 AM | 17 (8.1%) | 17 (8.0%) |
| 8:00 AM to 8:29 AM | 0 (0.0%) | 16 (7.5%) |
| 8:30 AM to 8:59 AM | 0 (0.0%) | 0 (0.0%) |
| 9:00 AM to 9:59 AM | 5 (2.4%) | 0 (0.0%) |
| 10:00 AM to 10:59 AM | 0 (0.0%) | 0 (0.0%) |
| 11:00 AM to 11:59 AM | 0 (0.0%) | 7 (3.3%) |
| 12:00 PM to 3:59 PM | 0 (0.0%) | 27 (12.7%) |
| 4:00 PM to 11:59 PM | 8 (3.8%) | 8 (3.8%) |
| Total | 211 (100.0%) | 213 (100.0%) |
Housing Occupancy in Flat Rock
Occupancy by Ownership in Flat Rock
Of the total 1,667 dwellings in Flat Rock, owner-occupied units account for 1,631 (97.8%), while renter-occupied units make up 36 (2.2%).
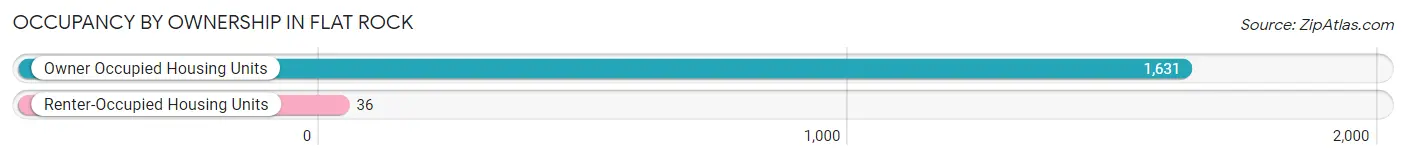
| Occupancy | # Housing Units | % Housing Units |
| Owner Occupied Housing Units | 1,631 | 97.8% |
| Renter-Occupied Housing Units | 36 | 2.2% |
| Total Occupied Housing Units | 1,667 | 100.0% |
Occupancy by Household Size in Flat Rock
| Household Size | # Housing Units | % Housing Units |
| 1-Person Household | 456 | 27.4% |
| 2-Person Household | 900 | 54.0% |
| 3-Person Household | 162 | 9.7% |
| 4+ Person Household | 149 | 8.9% |
| Total Housing Units | 1,667 | 100.0% |
Occupancy by Ownership by Household Size in Flat Rock
| Household Size | Owner-occupied | Renter-occupied |
| 1-Person Household | 438 (96.1%) | 18 (4.0%) |
| 2-Person Household | 900 (100.0%) | 0 (0.0%) |
| 3-Person Household | 144 (88.9%) | 18 (11.1%) |
| 4+ Person Household | 149 (100.0%) | 0 (0.0%) |
| Total Housing Units | 1,631 (97.8%) | 36 (2.2%) |
Occupancy by Educational Attainment in Flat Rock
| Household Size | Owner-occupied | Renter-occupied |
| Less than High School | 9 (100.0%) | 0 (0.0%) |
| High School Diploma | 142 (92.8%) | 11 (7.2%) |
| College/Associate Degree | 386 (96.3%) | 15 (3.7%) |
| Bachelor's Degree or higher | 1,094 (99.1%) | 10 (0.9%) |
Occupancy by Age of Householder in Flat Rock
| Age Bracket | # Households | % Households |
| Under 35 Years | 31 | 1.9% |
| 35 to 44 Years | 143 | 8.6% |
| 45 to 54 Years | 132 | 7.9% |
| 55 to 64 Years | 414 | 24.8% |
| 65 to 74 Years | 465 | 27.9% |
| 75 to 84 Years | 414 | 24.8% |
| 85 Years and Over | 68 | 4.1% |
| Total | 1,667 | 100.0% |
Housing Finances in Flat Rock
Median Income by Occupancy in Flat Rock
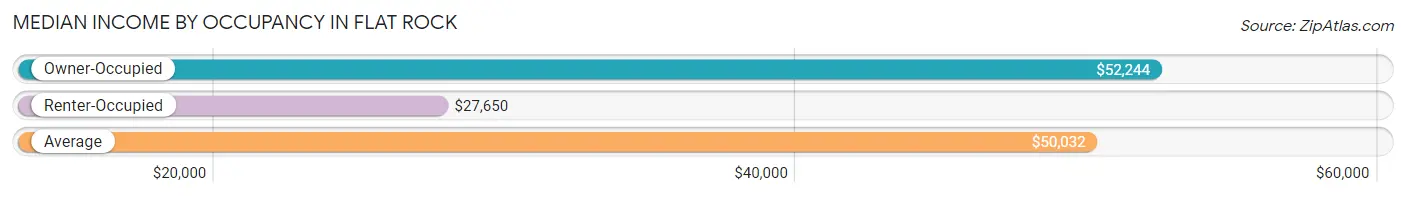
| Occupancy Type | # Households | Median Income |
| Owner-Occupied | 320 (68.2%) | $52,244 |
| Renter-Occupied | 149 (31.8%) | $27,650 |
| Average | 469 (100.0%) | $50,032 |
Occupancy by Householder Income Bracket in Flat Rock
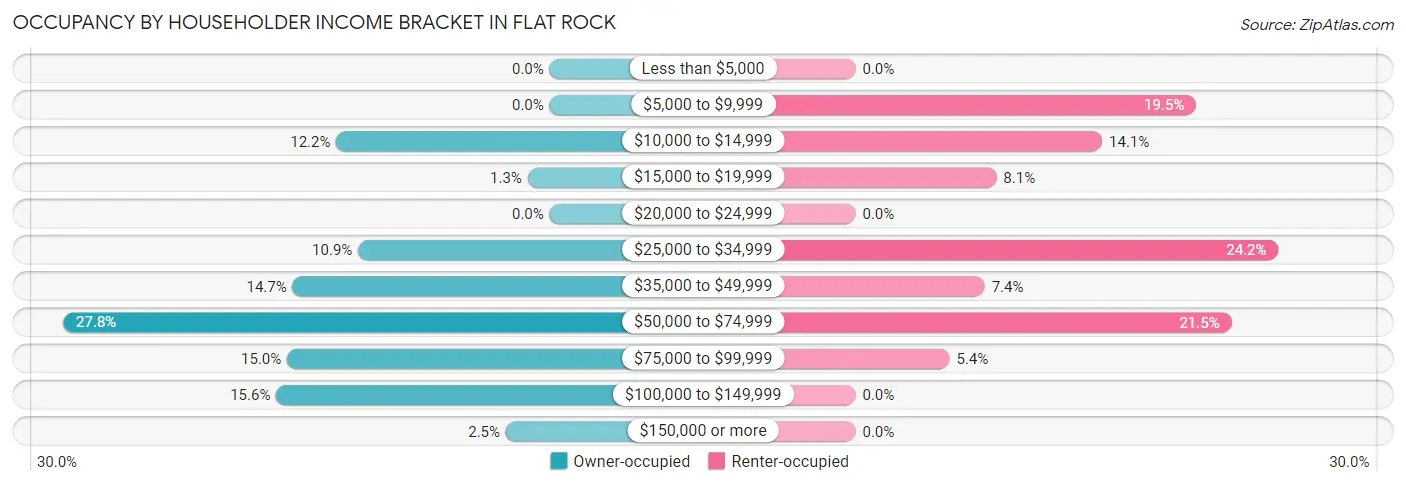
| Income Bracket | Owner-occupied | Renter-occupied |
| Less than $5,000 | 0 (0.0%) | 0 (0.0%) |
| $5,000 to $9,999 | 0 (0.0%) | 29 (19.5%) |
| $10,000 to $14,999 | 39 (12.2%) | 21 (14.1%) |
| $15,000 to $19,999 | 4 (1.3%) | 12 (8.1%) |
| $20,000 to $24,999 | 0 (0.0%) | 0 (0.0%) |
| $25,000 to $34,999 | 35 (10.9%) | 36 (24.2%) |
| $35,000 to $49,999 | 47 (14.7%) | 11 (7.4%) |
| $50,000 to $74,999 | 89 (27.8%) | 32 (21.5%) |
| $75,000 to $99,999 | 48 (15.0%) | 8 (5.4%) |
| $100,000 to $149,999 | 50 (15.6%) | 0 (0.0%) |
| $150,000 or more | 8 (2.5%) | 0 (0.0%) |
| Total | 320 (100.0%) | 149 (100.0%) |
Monthly Housing Cost Tiers in Flat Rock
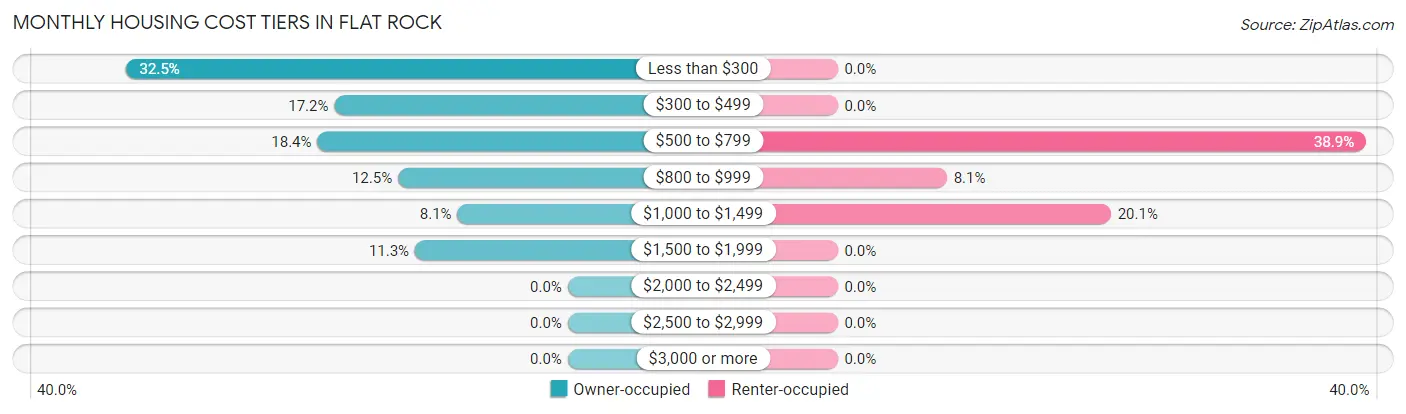
| Monthly Cost | Owner-occupied | Renter-occupied |
| Less than $300 | 104 (32.5%) | 0 (0.0%) |
| $300 to $499 | 55 (17.2%) | 0 (0.0%) |
| $500 to $799 | 59 (18.4%) | 58 (38.9%) |
| $800 to $999 | 40 (12.5%) | 12 (8.1%) |
| $1,000 to $1,499 | 26 (8.1%) | 30 (20.1%) |
| $1,500 to $1,999 | 36 (11.3%) | 0 (0.0%) |
| $2,000 to $2,499 | 0 (0.0%) | 0 (0.0%) |
| $2,500 to $2,999 | 0 (0.0%) | 0 (0.0%) |
| $3,000 or more | 0 (0.0%) | 0 (0.0%) |
| Total | 320 (100.0%) | 149 (100.0%) |
Physical Housing Characteristics in Flat Rock
Housing Structures in Flat Rock
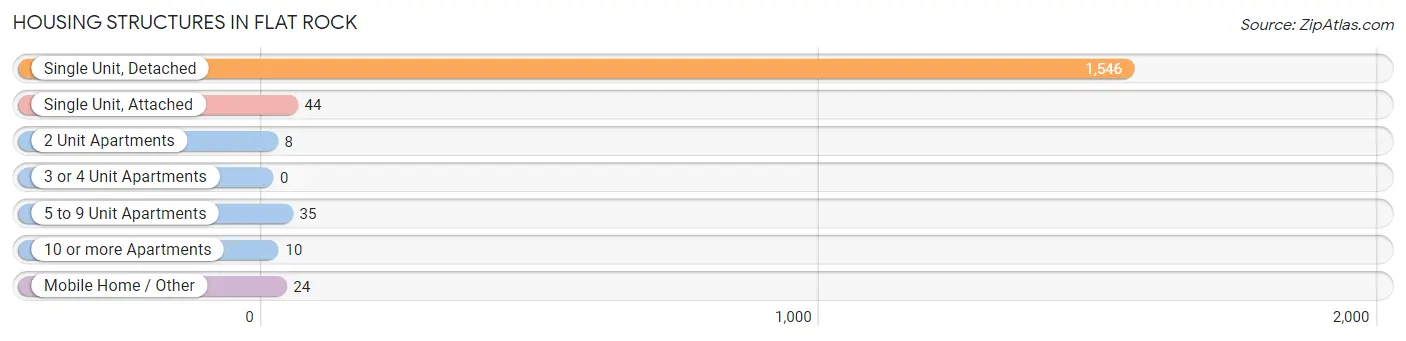
| Structure Type | # Housing Units | % Housing Units |
| Single Unit, Detached | 1,546 | 92.7% |
| Single Unit, Attached | 44 | 2.6% |
| 2 Unit Apartments | 8 | 0.5% |
| 3 or 4 Unit Apartments | 0 | 0.0% |
| 5 to 9 Unit Apartments | 35 | 2.1% |
| 10 or more Apartments | 10 | 0.6% |
| Mobile Home / Other | 24 | 1.4% |
| Total | 1,667 | 100.0% |
Housing Structures by Occupancy in Flat Rock
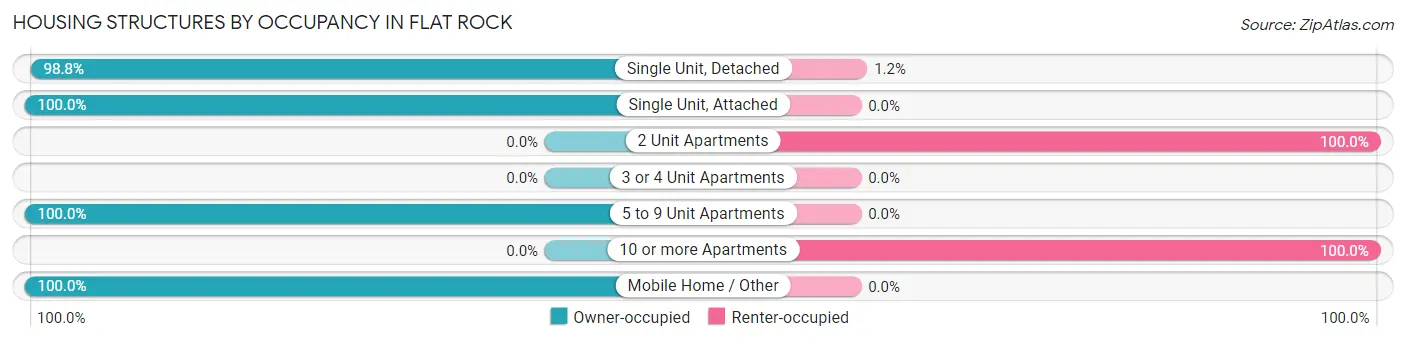
| Structure Type | Owner-occupied | Renter-occupied |
| Single Unit, Detached | 1,528 (98.8%) | 18 (1.2%) |
| Single Unit, Attached | 44 (100.0%) | 0 (0.0%) |
| 2 Unit Apartments | 0 (0.0%) | 8 (100.0%) |
| 3 or 4 Unit Apartments | 0 (0.0%) | 0 (0.0%) |
| 5 to 9 Unit Apartments | 35 (100.0%) | 0 (0.0%) |
| 10 or more Apartments | 0 (0.0%) | 10 (100.0%) |
| Mobile Home / Other | 24 (100.0%) | 0 (0.0%) |
| Total | 1,631 (97.8%) | 36 (2.2%) |
Housing Structures by Number of Rooms in Flat Rock
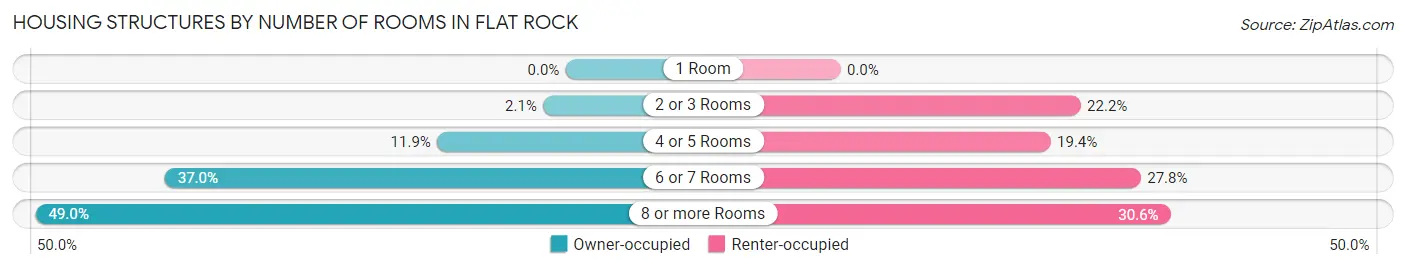
| Number of Rooms | Owner-occupied | Renter-occupied |
| 1 Room | 0 (0.0%) | 0 (0.0%) |
| 2 or 3 Rooms | 34 (2.1%) | 8 (22.2%) |
| 4 or 5 Rooms | 194 (11.9%) | 7 (19.4%) |
| 6 or 7 Rooms | 604 (37.0%) | 10 (27.8%) |
| 8 or more Rooms | 799 (49.0%) | 11 (30.6%) |
| Total | 1,631 (100.0%) | 36 (100.0%) |
Housing Structure by Heating Type in Flat Rock
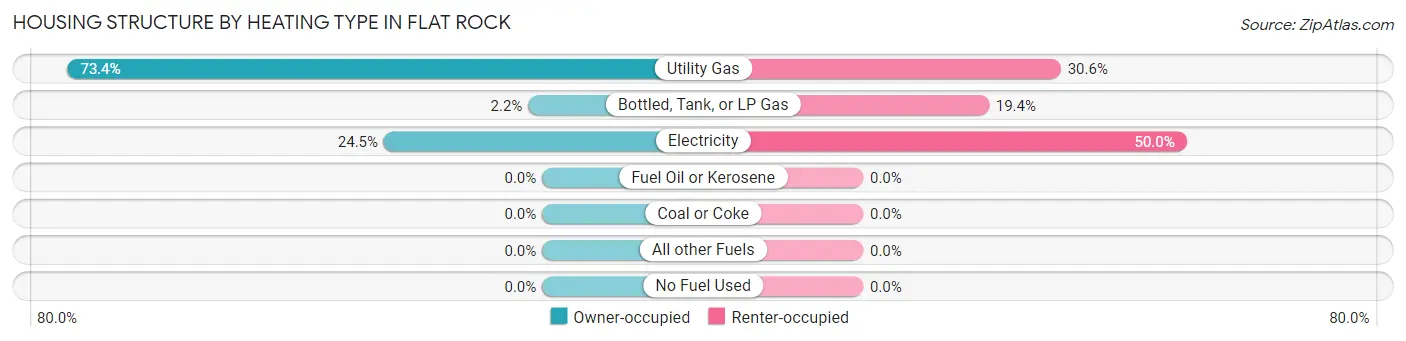
| Heating Type | Owner-occupied | Renter-occupied |
| Utility Gas | 1,197 (73.4%) | 11 (30.6%) |
| Bottled, Tank, or LP Gas | 35 (2.1%) | 7 (19.4%) |
| Electricity | 399 (24.5%) | 18 (50.0%) |
| Fuel Oil or Kerosene | 0 (0.0%) | 0 (0.0%) |
| Coal or Coke | 0 (0.0%) | 0 (0.0%) |
| All other Fuels | 0 (0.0%) | 0 (0.0%) |
| No Fuel Used | 0 (0.0%) | 0 (0.0%) |
| Total | 1,631 (100.0%) | 36 (100.0%) |
Household Vehicle Usage in Flat Rock
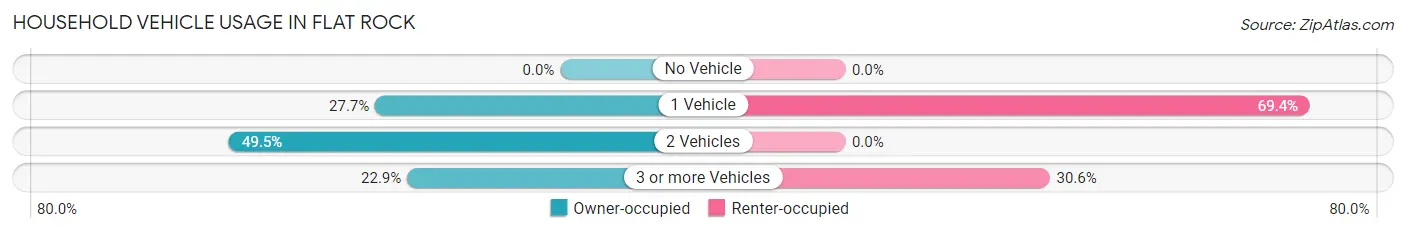
| Vehicles per Household | Owner-occupied | Renter-occupied |
| No Vehicle | 0 (0.0%) | 0 (0.0%) |
| 1 Vehicle | 451 (27.7%) | 25 (69.4%) |
| 2 Vehicles | 807 (49.5%) | 0 (0.0%) |
| 3 or more Vehicles | 373 (22.9%) | 11 (30.6%) |
| Total | 1,631 (100.0%) | 36 (100.0%) |
Real Estate & Mortgages in Flat Rock
Real Estate and Mortgage Overview in Flat Rock
| Characteristic | Without Mortgage | With Mortgage |
| Housing Units | 937 | 173 |
| Median Property Value | $532,000 | $113,200 |
| Median Household Income | $88,750 | $0 |
| Monthly Housing Costs | $676 | $0 |
| Real Estate Taxes | $2,895 | $0 |
Property Value by Mortgage Status in Flat Rock
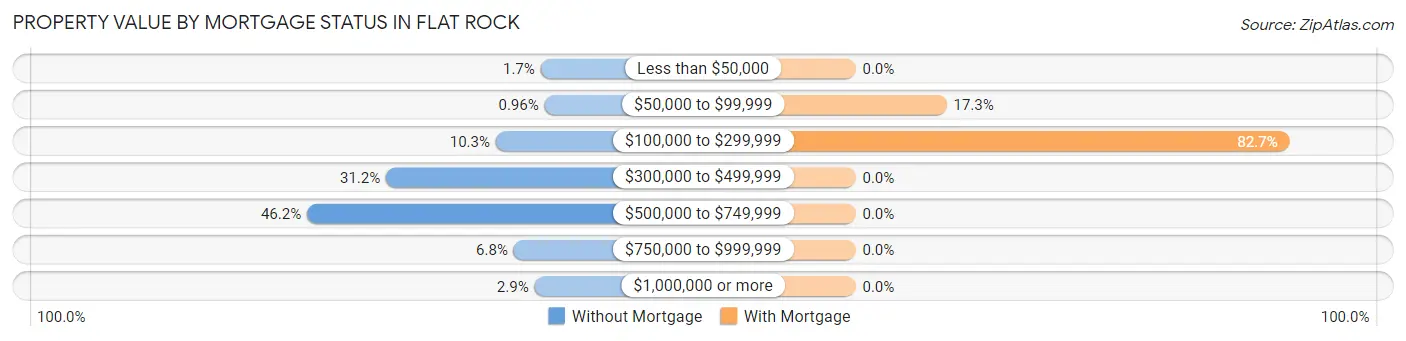
| Property Value | Without Mortgage | With Mortgage |
| Less than $50,000 | 16 (1.7%) | 0 (0.0%) |
| $50,000 to $99,999 | 9 (1.0%) | 30 (17.3%) |
| $100,000 to $299,999 | 96 (10.2%) | 143 (82.7%) |
| $300,000 to $499,999 | 292 (31.2%) | 0 (0.0%) |
| $500,000 to $749,999 | 433 (46.2%) | 0 (0.0%) |
| $750,000 to $999,999 | 64 (6.8%) | 0 (0.0%) |
| $1,000,000 or more | 27 (2.9%) | 0 (0.0%) |
| Total | 937 (100.0%) | 173 (100.0%) |
Household Income by Mortgage Status in Flat Rock
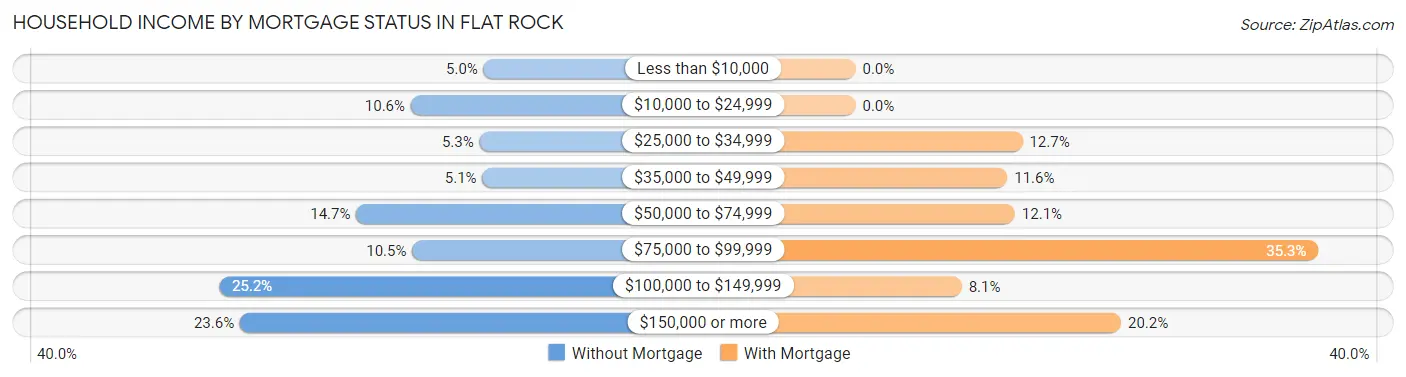
| Household Income | Without Mortgage | With Mortgage |
| Less than $10,000 | 47 (5.0%) | 0 (0.0%) |
| $10,000 to $24,999 | 99 (10.6%) | 0 (0.0%) |
| $25,000 to $34,999 | 50 (5.3%) | 22 (12.7%) |
| $35,000 to $49,999 | 48 (5.1%) | 20 (11.6%) |
| $50,000 to $74,999 | 138 (14.7%) | 21 (12.1%) |
| $75,000 to $99,999 | 98 (10.5%) | 61 (35.3%) |
| $100,000 to $149,999 | 236 (25.2%) | 14 (8.1%) |
| $150,000 or more | 221 (23.6%) | 35 (20.2%) |
| Total | 937 (100.0%) | 173 (100.0%) |
Property Value to Household Income Ratio in Flat Rock
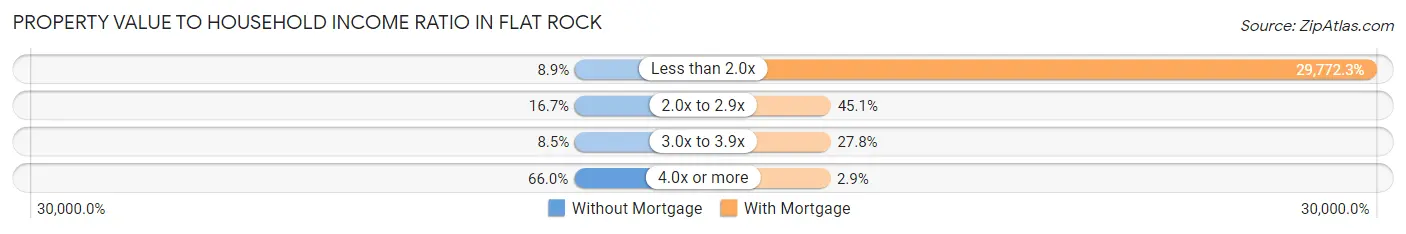
| Value-to-Income Ratio | Without Mortgage | With Mortgage |
| Less than 2.0x | 83 (8.9%) | 51,506 (29,772.3%) |
| 2.0x to 2.9x | 156 (16.7%) | 78 (45.1%) |
| 3.0x to 3.9x | 80 (8.5%) | 48 (27.8%) |
| 4.0x or more | 618 (66.0%) | 5 (2.9%) |
| Total | 937 (100.0%) | 173 (100.0%) |
Real Estate Taxes by Mortgage Status in Flat Rock
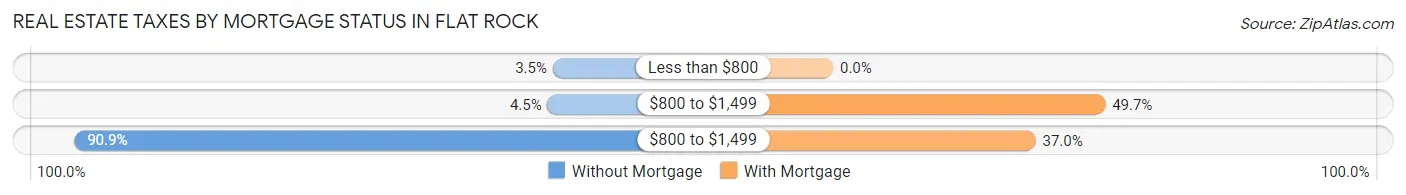
| Property Taxes | Without Mortgage | With Mortgage |
| Less than $800 | 33 (3.5%) | 0 (0.0%) |
| $800 to $1,499 | 42 (4.5%) | 86 (49.7%) |
| $800 to $1,499 | 852 (90.9%) | 64 (37.0%) |
| Total | 937 (100.0%) | 173 (100.0%) |
Health & Disability in Flat Rock
Health Insurance Coverage by Age in Flat Rock
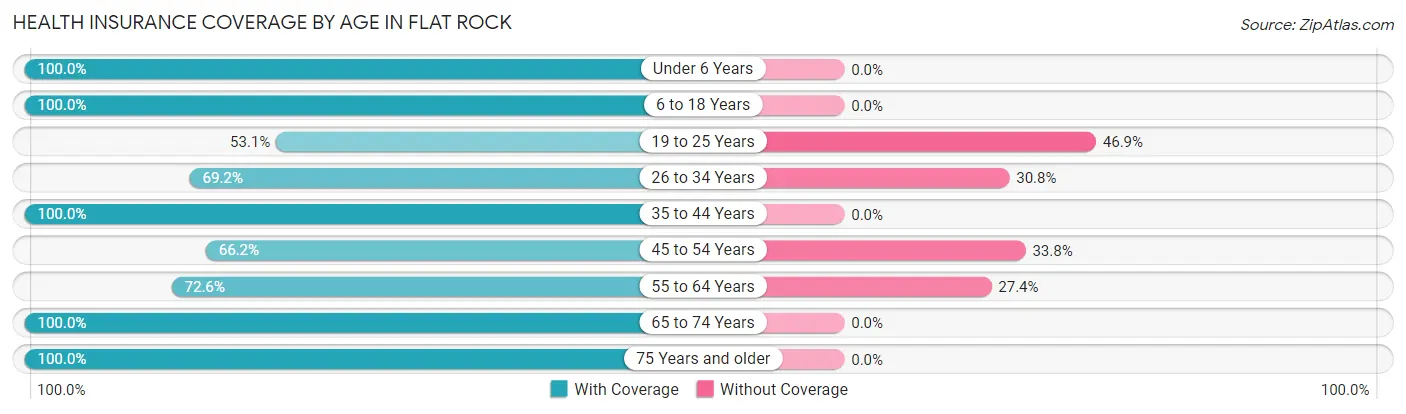
| Age Bracket | With Coverage | Without Coverage |
| Under 6 Years | 125 (100.0%) | 0 (0.0%) |
| 6 to 18 Years | 87 (100.0%) | 0 (0.0%) |
| 19 to 25 Years | 43 (53.1%) | 38 (46.9%) |
| 26 to 34 Years | 117 (69.2%) | 52 (30.8%) |
| 35 to 44 Years | 89 (100.0%) | 0 (0.0%) |
| 45 to 54 Years | 96 (66.2%) | 49 (33.8%) |
| 55 to 64 Years | 135 (72.6%) | 51 (27.4%) |
| 65 to 74 Years | 54 (100.0%) | 0 (0.0%) |
| 75 Years and older | 130 (100.0%) | 0 (0.0%) |
| Total | 876 (82.2%) | 190 (17.8%) |
Health Insurance Coverage by Citizenship Status in Flat Rock
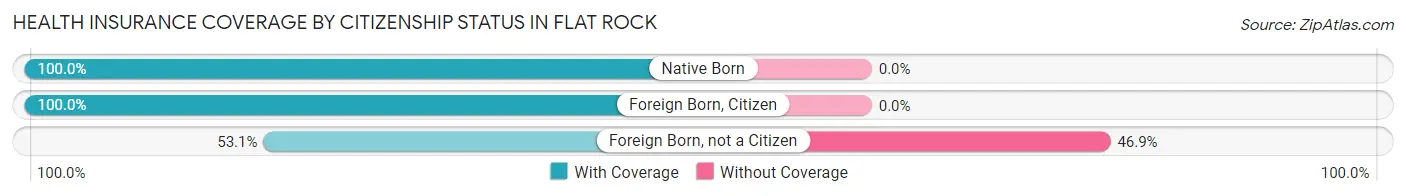
| Citizenship Status | With Coverage | Without Coverage |
| Native Born | 125 (100.0%) | 0 (0.0%) |
| Foreign Born, Citizen | 87 (100.0%) | 0 (0.0%) |
| Foreign Born, not a Citizen | 43 (53.1%) | 38 (46.9%) |
Health Insurance Coverage by Household Income in Flat Rock
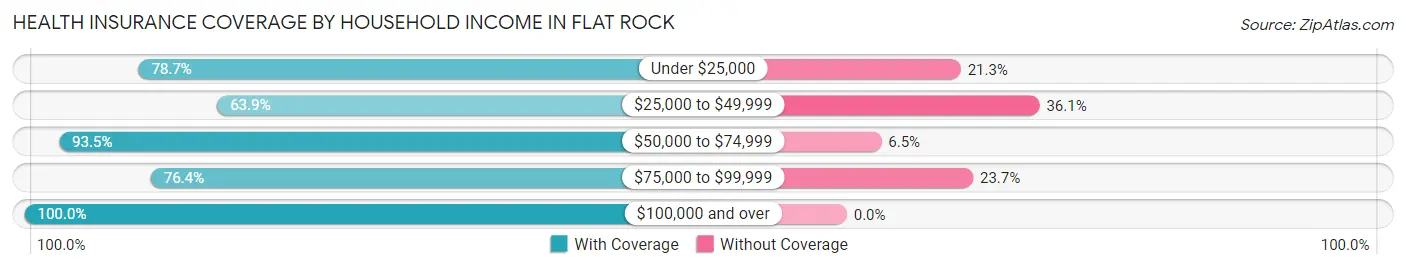
| Household Income | With Coverage | Without Coverage |
| Under $25,000 | 129 (78.7%) | 35 (21.3%) |
| $25,000 to $49,999 | 177 (63.9%) | 100 (36.1%) |
| $50,000 to $74,999 | 289 (93.5%) | 20 (6.5%) |
| $75,000 to $99,999 | 113 (76.3%) | 35 (23.6%) |
| $100,000 and over | 168 (100.0%) | 0 (0.0%) |
Public vs Private Health Insurance Coverage by Age in Flat Rock
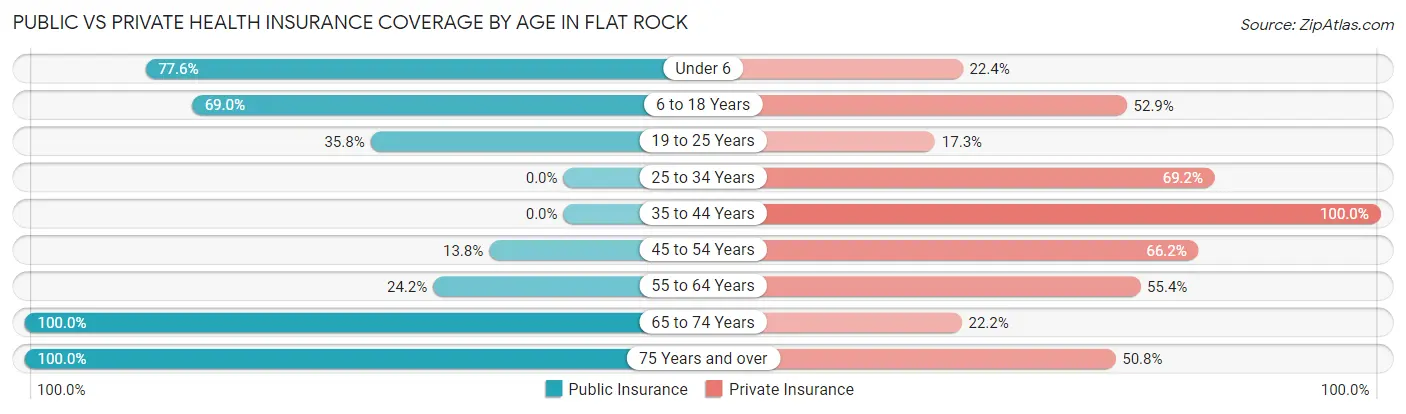
| Age Bracket | Public Insurance | Private Insurance |
| Under 6 | 97 (77.6%) | 28 (22.4%) |
| 6 to 18 Years | 60 (69.0%) | 46 (52.9%) |
| 19 to 25 Years | 29 (35.8%) | 14 (17.3%) |
| 25 to 34 Years | 0 (0.0%) | 117 (69.2%) |
| 35 to 44 Years | 0 (0.0%) | 89 (100.0%) |
| 45 to 54 Years | 20 (13.8%) | 96 (66.2%) |
| 55 to 64 Years | 45 (24.2%) | 103 (55.4%) |
| 65 to 74 Years | 54 (100.0%) | 12 (22.2%) |
| 75 Years and over | 130 (100.0%) | 66 (50.8%) |
| Total | 435 (40.8%) | 571 (53.6%) |
Disability Status by Sex by Age in Flat Rock
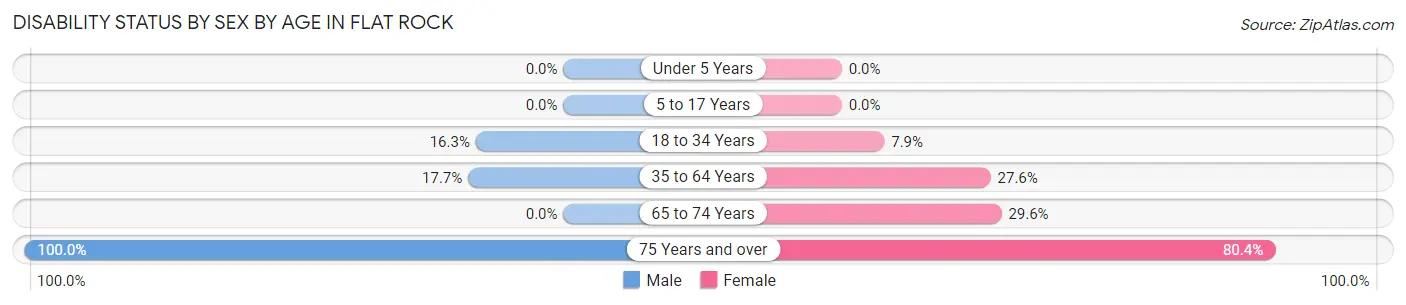
| Age Bracket | Male | Female |
| Under 5 Years | 0 (0.0%) | 0 (0.0%) |
| 5 to 17 Years | 0 (0.0%) | 0 (0.0%) |
| 18 to 34 Years | 20 (16.3%) | 12 (7.9%) |
| 35 to 64 Years | 32 (17.7%) | 66 (27.6%) |
| 65 to 74 Years | 0 (0.0%) | 8 (29.6%) |
| 75 Years and over | 33 (100.0%) | 78 (80.4%) |
Disability Class by Sex by Age in Flat Rock
Disability Class: Hearing Difficulty
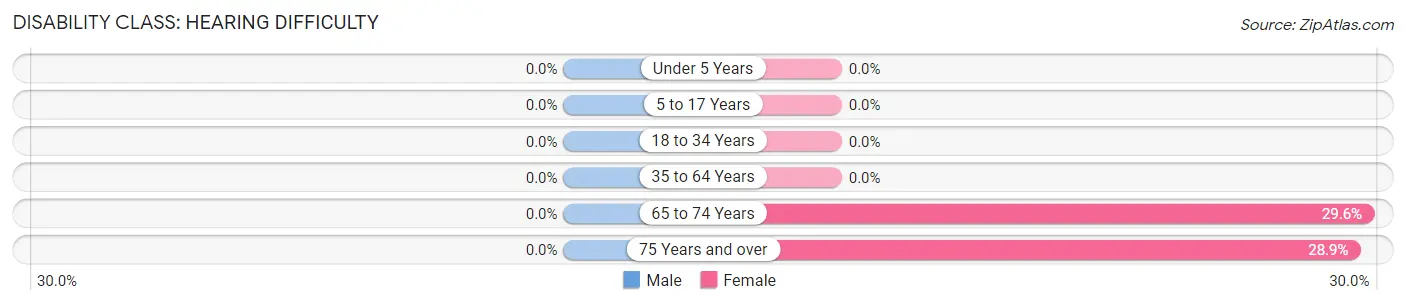
| Age Bracket | Male | Female |
| Under 5 Years | 0 (0.0%) | 0 (0.0%) |
| 5 to 17 Years | 0 (0.0%) | 0 (0.0%) |
| 18 to 34 Years | 0 (0.0%) | 0 (0.0%) |
| 35 to 64 Years | 0 (0.0%) | 0 (0.0%) |
| 65 to 74 Years | 0 (0.0%) | 8 (29.6%) |
| 75 Years and over | 0 (0.0%) | 28 (28.9%) |
Disability Class: Vision Difficulty
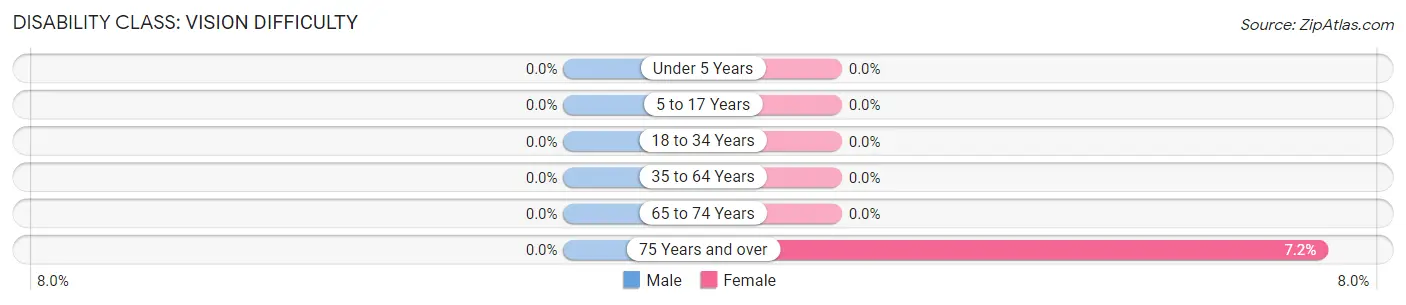
| Age Bracket | Male | Female |
| Under 5 Years | 0 (0.0%) | 0 (0.0%) |
| 5 to 17 Years | 0 (0.0%) | 0 (0.0%) |
| 18 to 34 Years | 0 (0.0%) | 0 (0.0%) |
| 35 to 64 Years | 0 (0.0%) | 0 (0.0%) |
| 65 to 74 Years | 0 (0.0%) | 0 (0.0%) |
| 75 Years and over | 0 (0.0%) | 7 (7.2%) |
Disability Class: Cognitive Difficulty
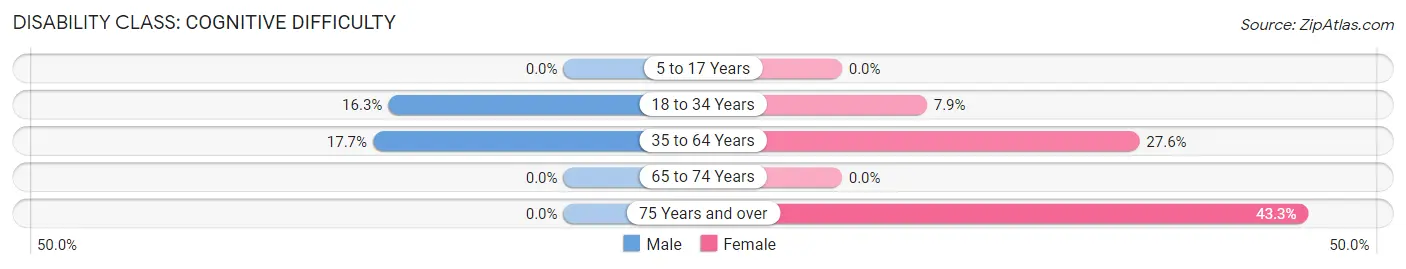
| Age Bracket | Male | Female |
| 5 to 17 Years | 0 (0.0%) | 0 (0.0%) |
| 18 to 34 Years | 20 (16.3%) | 12 (7.9%) |
| 35 to 64 Years | 32 (17.7%) | 66 (27.6%) |
| 65 to 74 Years | 0 (0.0%) | 0 (0.0%) |
| 75 Years and over | 0 (0.0%) | 42 (43.3%) |
Disability Class: Ambulatory Difficulty
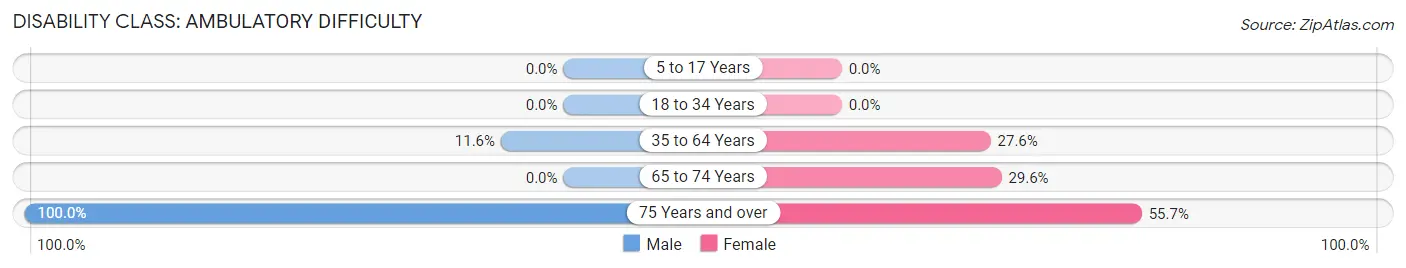
| Age Bracket | Male | Female |
| 5 to 17 Years | 0 (0.0%) | 0 (0.0%) |
| 18 to 34 Years | 0 (0.0%) | 0 (0.0%) |
| 35 to 64 Years | 21 (11.6%) | 66 (27.6%) |
| 65 to 74 Years | 0 (0.0%) | 8 (29.6%) |
| 75 Years and over | 33 (100.0%) | 54 (55.7%) |
Disability Class: Self-Care Difficulty
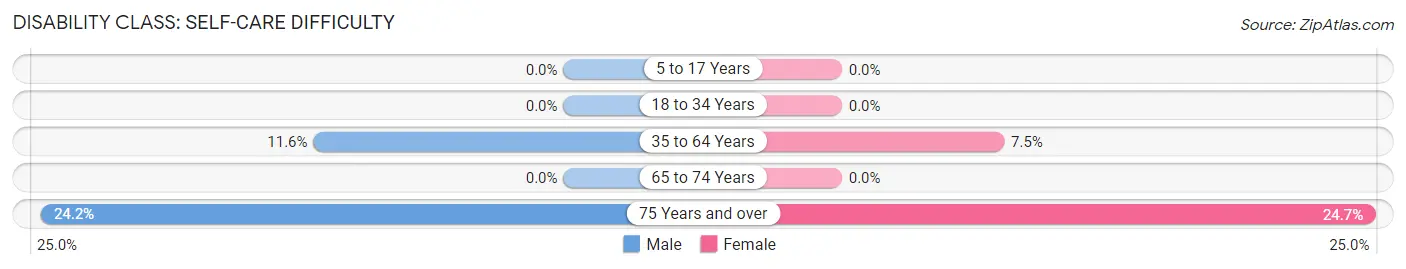
| Age Bracket | Male | Female |
| 5 to 17 Years | 0 (0.0%) | 0 (0.0%) |
| 18 to 34 Years | 0 (0.0%) | 0 (0.0%) |
| 35 to 64 Years | 21 (11.6%) | 18 (7.5%) |
| 65 to 74 Years | 0 (0.0%) | 0 (0.0%) |
| 75 Years and over | 8 (24.2%) | 24 (24.7%) |
Technology Access in Flat Rock
Computing Device Access in Flat Rock
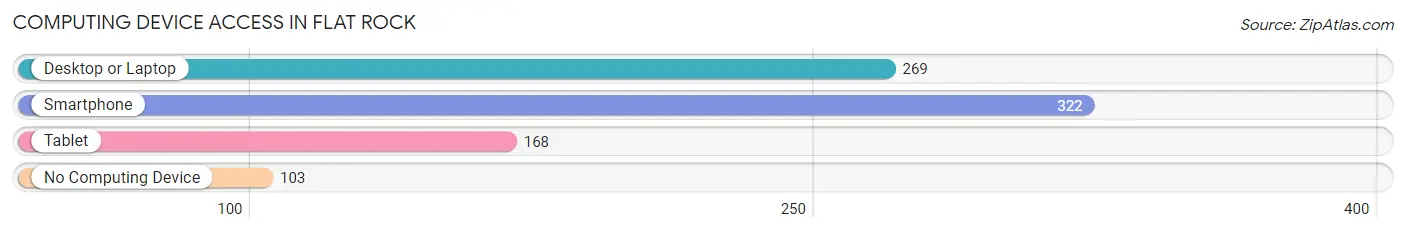
| Device Type | # Households | % Households |
| Desktop or Laptop | 269 | 57.4% |
| Smartphone | 322 | 68.7% |
| Tablet | 168 | 35.8% |
| No Computing Device | 103 | 22.0% |
| Total | 469 | 100.0% |
Internet Access in Flat Rock
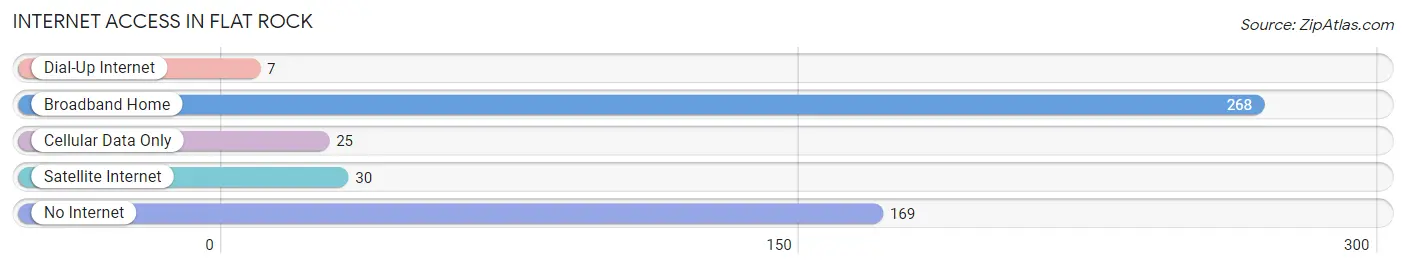
| Internet Type | # Households | % Households |
| Dial-Up Internet | 7 | 1.5% |
| Broadband Home | 268 | 57.1% |
| Cellular Data Only | 25 | 5.3% |
| Satellite Internet | 30 | 6.4% |
| No Internet | 169 | 36.0% |
| Total | 469 | 100.0% |
Flat Rock Summary
Flat Rock is a small unincorporated community located in Henderson County, North Carolina. It is situated in the foothills of the Blue Ridge Mountains, about 25 miles south of Asheville. The community is named after a large flat rock formation located in the area.
History
Flat Rock was first settled in the late 1700s by a group of settlers from Virginia. The settlers were attracted to the area by its fertile soil and abundant natural resources. The community was initially known as “Little Charleston” due to its resemblance to the city of Charleston, South Carolina.
In 1807, the community was officially named Flat Rock. The name was chosen to reflect the large flat rock formation located in the area. The formation was used as a meeting place for the local Native American tribes.
In 1838, the community was incorporated as the town of Flat Rock. The town was home to a variety of businesses, including a grist mill, a sawmill, a tannery, and a blacksmith shop.
In 1855, the town was home to the Flat Rock Academy, a private school for boys. The school was founded by Reverend William H. McLean, a Presbyterian minister. The school was later renamed the Flat Rock Institute and was open to both boys and girls.
In 1875, the town was home to the Flat Rock Hotel, a popular destination for tourists. The hotel was destroyed by fire in 1887.
In the late 1800s, the town was home to a variety of industries, including a cotton mill, a furniture factory, and a brickyard.
Geography
Flat Rock is located in the foothills of the Blue Ridge Mountains in Henderson County, North Carolina. The town is situated at an elevation of 1,400 feet above sea level.
The town is located near the French Broad River, which flows through the area. The town is also located near the Pisgah National Forest, which is home to a variety of wildlife.
The climate in Flat Rock is mild and humid. The average temperature in the summer is around 75 degrees Fahrenheit, and the average temperature in the winter is around 45 degrees Fahrenheit.
Economy
The economy of Flat Rock is largely based on tourism. The town is home to a variety of attractions, including the Flat Rock Playhouse, the Carl Sandburg Home National Historic Site, and the Flat Rock Historic Village.
The town is also home to a variety of shops and restaurants. The town is home to a variety of businesses, including a grocery store, a hardware store, and a variety of other retail stores.
Demographics
As of the 2010 census, the population of Flat Rock was 1,812. The racial makeup of the town was 94.3% White, 2.2% African American, 0.3% Native American, 0.7% Asian, 0.1% Pacific Islander, and 2.4% from other races.
The median household income in Flat Rock was $41,250, and the median family income was $50,000. The per capita income in Flat Rock was $20,945.
Conclusion
Flat Rock is a small unincorporated community located in Henderson County, North Carolina. It is situated in the foothills of the Blue Ridge Mountains, about 25 miles south of Asheville. The community was first settled in the late 1700s and was officially named Flat Rock in 1807. The town is home to a variety of attractions, including the Flat Rock Playhouse, the Carl Sandburg Home National Historic Site, and the Flat Rock Historic Village. The economy of Flat Rock is largely based on tourism, and the town is home to a variety of businesses, including a grocery store, a hardware store, and a variety of other retail stores. As of the 2010 census, the population of Flat Rock was 1,812. The racial makeup of the town was 94.3% White, 2.2% African American, 0.3% Native American, 0.7% Asian, 0.1% Pacific Islander, and 2.4% from other races. The median household income in Flat Rock was $41,250, and the median family income was $50,000.
Common Questions
What is Per Capita Income in Flat Rock?
Per Capita income in Flat Rock is $25,323.
What is the Median Family Income in Flat Rock?
Median Family Income in Flat Rock is $63,616.
What is the Median Household income in Flat Rock?
Median Household Income in Flat Rock is $50,032.
What is Income or Wage Gap in Flat Rock?
Income or Wage Gap in Flat Rock is 38.9%.
Women in Flat Rock earn 61.1 cents for every dollar earned by a man.
What is Inequality or Gini Index in Flat Rock?
Inequality or Gini Index in Flat Rock is 0.39.
What is the Total Population of Flat Rock?
Total Population of Flat Rock is 1,066.
What is the Total Male Population of Flat Rock?
Total Male Population of Flat Rock is 487.
What is the Total Female Population of Flat Rock?
Total Female Population of Flat Rock is 579.
What is the Ratio of Males per 100 Females in Flat Rock?
There are 84.11 Males per 100 Females in Flat Rock.
What is the Ratio of Females per 100 Males in Flat Rock?
There are 118.89 Females per 100 Males in Flat Rock.
What is the Median Population Age in Flat Rock?
Median Population Age in Flat Rock is 44.4 Years.
What is the Average Family Size in Flat Rock
Average Family Size in Flat Rock is 2.9 People.
What is the Average Household Size in Flat Rock
Average Household Size in Flat Rock is 2.3 People.
How Large is the Labor Force in Flat Rock?
There are 489 People in the Labor Forcein in Flat Rock.
What is the Percentage of People in the Labor Force in Flat Rock?
53.0% of People are in the Labor Force in Flat Rock.
What is the Unemployment Rate in Flat Rock?
Unemployment Rate in Flat Rock is 3.3%.