Jefferson, NC Map & Demographics
Jefferson Map
Jefferson Overview
$20,703
PER CAPITA INCOME
$49,563
AVG FAMILY INCOME
$37,232
AVG HOUSEHOLD INCOME
18.1%
WAGE / INCOME GAP [ % ]
81.9¢/ $1
WAGE / INCOME GAP [ $ ]
0.41
INEQUALITY / GINI INDEX
1,872
TOTAL POPULATION
874
MALE POPULATION
998
FEMALE POPULATION
87.58
MALES / 100 FEMALES
114.19
FEMALES / 100 MALES
45.4
MEDIAN AGE
2.9
AVG FAMILY SIZE
2.2
AVG HOUSEHOLD SIZE
795
LABOR FORCE [ PEOPLE ]
51.7%
PERCENT IN LABOR FORCE
4.3%
UNEMPLOYMENT RATE
Jefferson Zip Codes
Jefferson Area Codes
Income in Jefferson
Income Overview in Jefferson
Per Capita Income in Jefferson is $20,703, while median incomes of families and households are $49,563 and $37,232 respectively.
| Characteristic | Number | Measure |
| Per Capita Income | 1,872 | $20,703 |
| Median Family Income | 415 | $49,563 |
| Mean Family Income | 415 | $57,509 |
| Median Household Income | 754 | $37,232 |
| Mean Household Income | 754 | $44,222 |
| Income Deficit | 415 | $0 |
| Wage / Income Gap (%) | 1,872 | 18.15% |
| Wage / Income Gap ($) | 1,872 | 81.85¢ per $1 |
| Gini / Inequality Index | 1,872 | 0.41 |
Earnings by Sex in Jefferson
Average Earnings in Jefferson are $31,667, $33,750 for men and $27,625 for women, a difference of 18.1%.
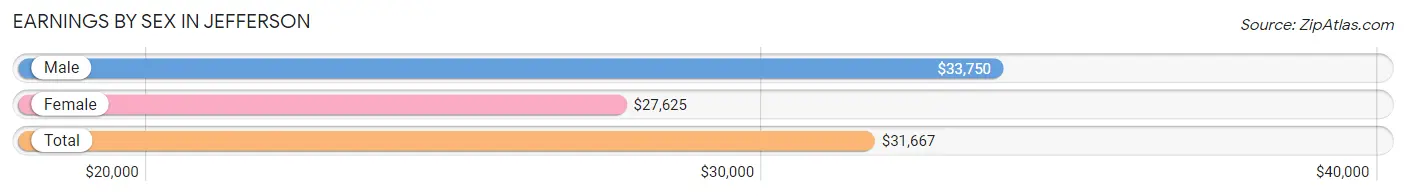
| Sex | Number | Average Earnings |
| Male | 479 (55.2%) | $33,750 |
| Female | 389 (44.8%) | $27,625 |
| Total | 868 (100.0%) | $31,667 |
Earnings by Sex by Income Bracket in Jefferson
The most common earnings brackets in Jefferson are $35,000 to $39,999 for men (67 | 14.0%) and $35,000 to $39,999 for women (53 | 13.6%).
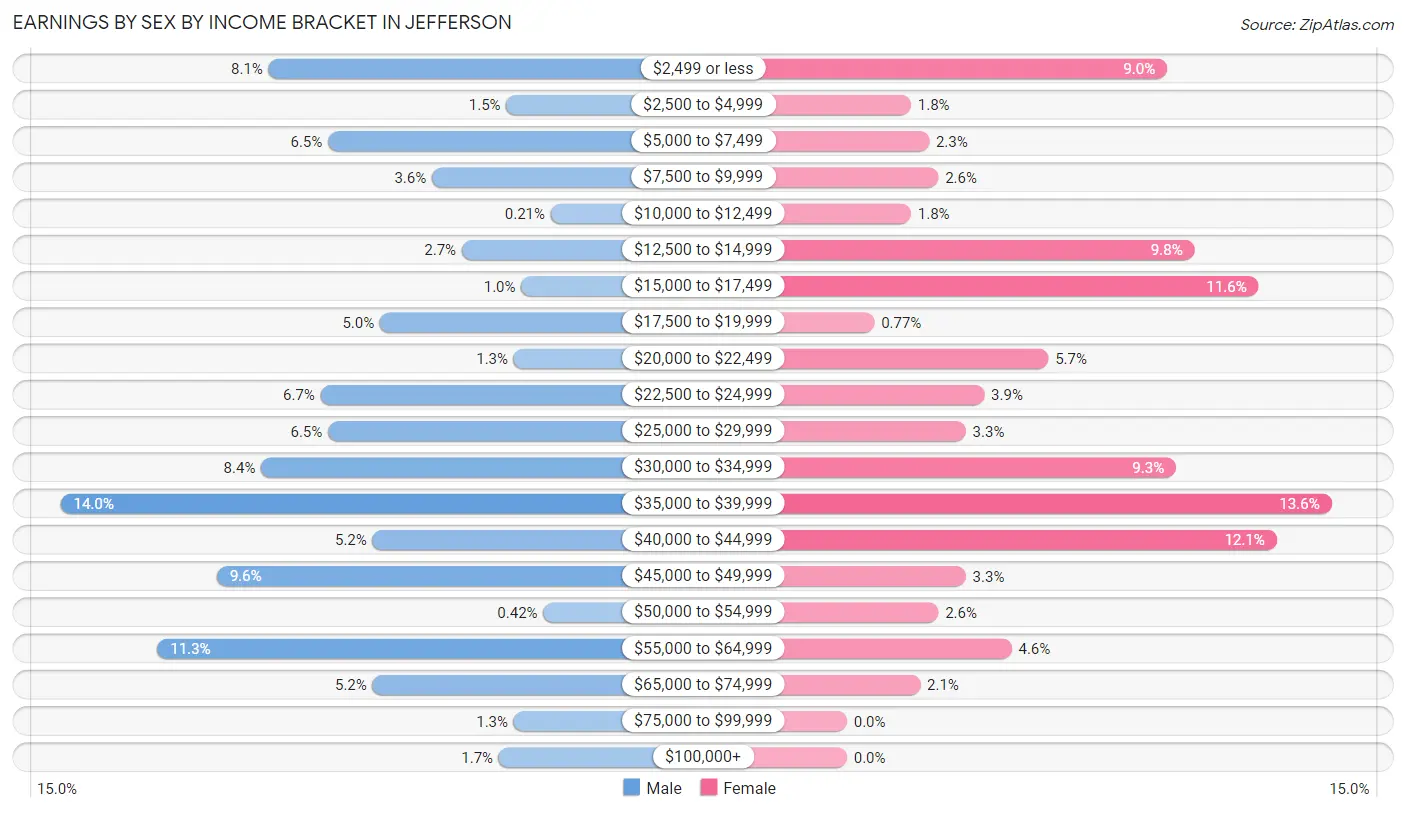
| Income | Male | Female |
| $2,499 or less | 39 (8.1%) | 35 (9.0%) |
| $2,500 to $4,999 | 7 (1.5%) | 7 (1.8%) |
| $5,000 to $7,499 | 31 (6.5%) | 9 (2.3%) |
| $7,500 to $9,999 | 17 (3.5%) | 10 (2.6%) |
| $10,000 to $12,499 | 1 (0.2%) | 7 (1.8%) |
| $12,500 to $14,999 | 13 (2.7%) | 38 (9.8%) |
| $15,000 to $17,499 | 5 (1.0%) | 45 (11.6%) |
| $17,500 to $19,999 | 24 (5.0%) | 3 (0.8%) |
| $20,000 to $22,499 | 6 (1.3%) | 22 (5.7%) |
| $22,500 to $24,999 | 32 (6.7%) | 15 (3.9%) |
| $25,000 to $29,999 | 31 (6.5%) | 13 (3.3%) |
| $30,000 to $34,999 | 40 (8.4%) | 36 (9.2%) |
| $35,000 to $39,999 | 67 (14.0%) | 53 (13.6%) |
| $40,000 to $44,999 | 25 (5.2%) | 47 (12.1%) |
| $45,000 to $49,999 | 46 (9.6%) | 13 (3.3%) |
| $50,000 to $54,999 | 2 (0.4%) | 10 (2.6%) |
| $55,000 to $64,999 | 54 (11.3%) | 18 (4.6%) |
| $65,000 to $74,999 | 25 (5.2%) | 8 (2.1%) |
| $75,000 to $99,999 | 6 (1.3%) | 0 (0.0%) |
| $100,000+ | 8 (1.7%) | 0 (0.0%) |
| Total | 479 (100.0%) | 389 (100.0%) |
Earnings by Sex by Educational Attainment in Jefferson
Average earnings in Jefferson are $37,551 for men and $33,056 for women, a difference of 12.0%. Men with an educational attainment of college or associate's degree enjoy the highest average annual earnings of $43,750, while those with high school diploma education earn the least with $24,779. Women with an educational attainment of college or associate's degree earn the most with the average annual earnings of $36,375, while those with high school diploma education have the smallest earnings of $19,167.
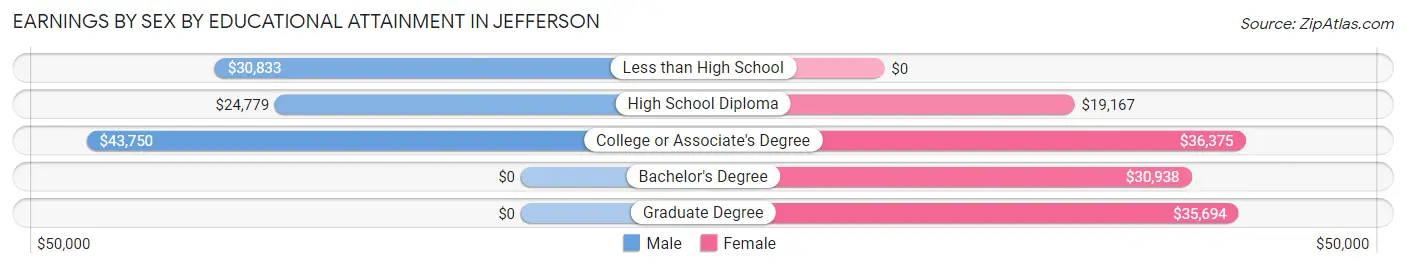
| Educational Attainment | Male Income | Female Income |
| Less than High School | $30,833 | $0 |
| High School Diploma | $24,779 | $19,167 |
| College or Associate's Degree | $43,750 | $36,375 |
| Bachelor's Degree | - | - |
| Graduate Degree | - | - |
| Total | $37,551 | $33,056 |
Family Income in Jefferson
Family Income Brackets in Jefferson
According to the Jefferson family income data, there are 106 families falling into the $50,000 to $74,999 income range, which is the most common income bracket and makes up 25.5% of all families.
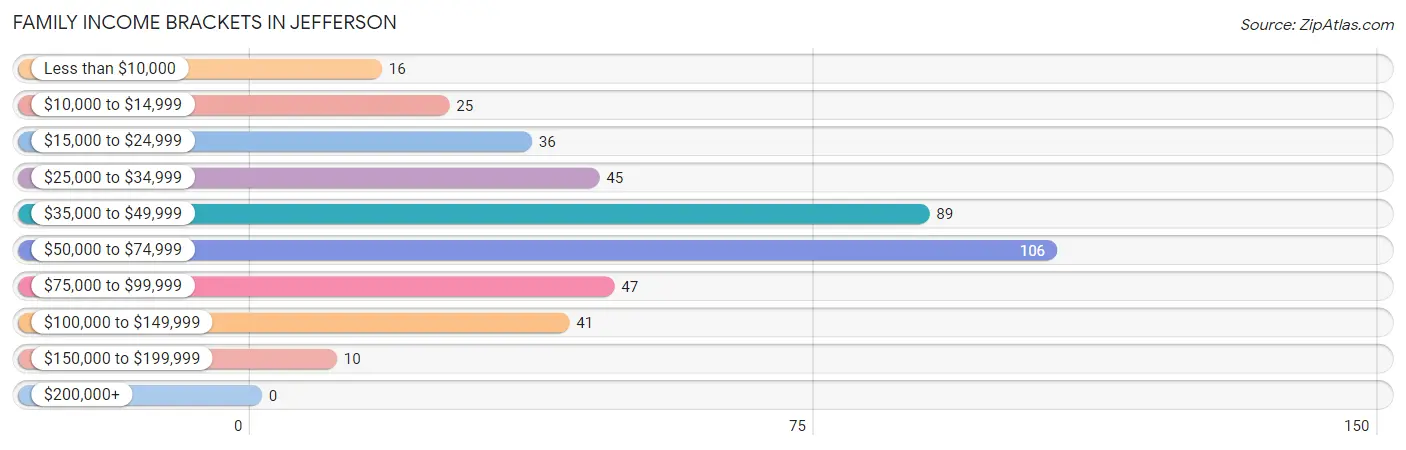
| Income Bracket | # Families | % Families |
| Less than $10,000 | 16 | 3.9% |
| $10,000 to $14,999 | 25 | 6.0% |
| $15,000 to $24,999 | 36 | 8.7% |
| $25,000 to $34,999 | 45 | 10.8% |
| $35,000 to $49,999 | 89 | 21.4% |
| $50,000 to $74,999 | 106 | 25.5% |
| $75,000 to $99,999 | 47 | 11.3% |
| $100,000 to $149,999 | 41 | 9.9% |
| $150,000 to $199,999 | 10 | 2.4% |
| $200,000+ | 0 | 0.0% |
Family Income by Famaliy Size in Jefferson
4-person families (25 | 6.0%) account for the highest median family income in Jefferson with $85,208 per family, while 2-person families (234 | 56.4%) have the highest median income of $23,375 per family member.
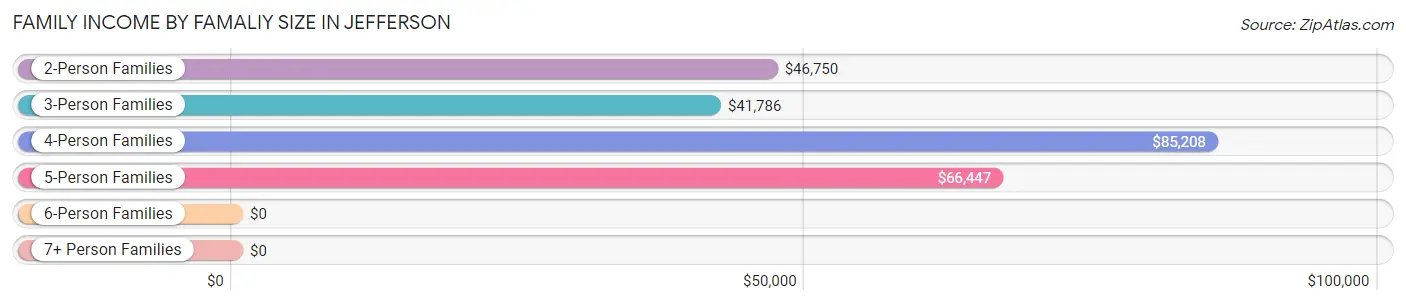
| Income Bracket | # Families | Median Income |
| 2-Person Families | 234 (56.4%) | $46,750 |
| 3-Person Families | 88 (21.2%) | $41,786 |
| 4-Person Families | 25 (6.0%) | $85,208 |
| 5-Person Families | 52 (12.5%) | $66,447 |
| 6-Person Families | 13 (3.1%) | $0 |
| 7+ Person Families | 3 (0.7%) | $0 |
| Total | 415 (100.0%) | $49,563 |
Family Income by Number of Earners in Jefferson
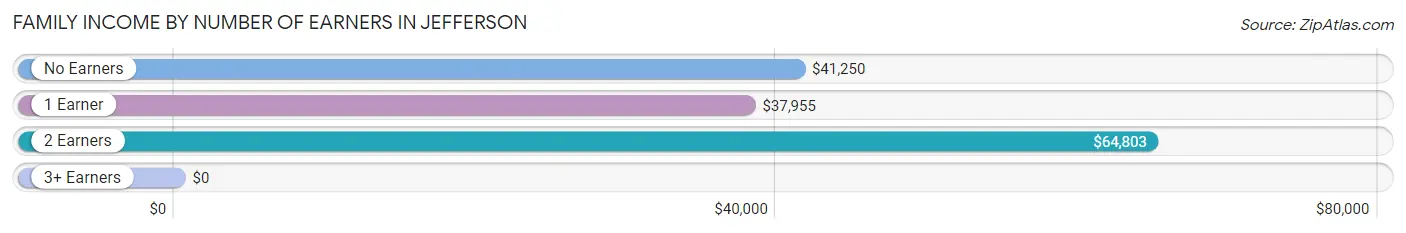
| Number of Earners | # Families | Median Income |
| No Earners | 70 (16.9%) | $41,250 |
| 1 Earner | 186 (44.8%) | $37,955 |
| 2 Earners | 115 (27.7%) | $64,803 |
| 3+ Earners | 44 (10.6%) | $0 |
| Total | 415 (100.0%) | $49,563 |
Household Income in Jefferson
Household Income Brackets in Jefferson
With 165 households falling in the category, the $35,000 to $49,999 income range is the most frequent in Jefferson, accounting for 21.9% of all households.
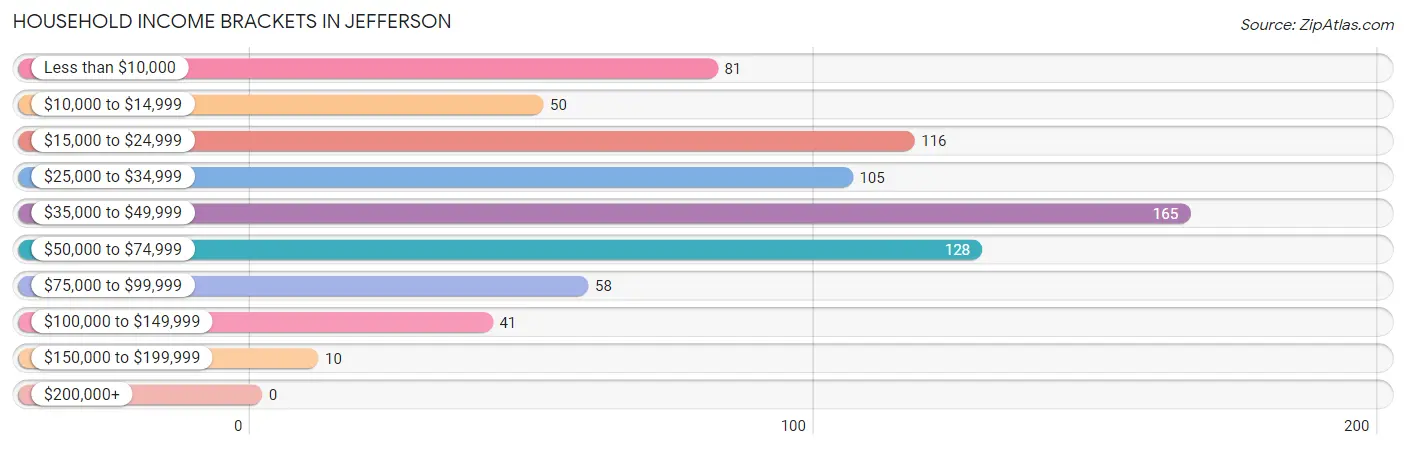
| Income Bracket | # Households | % Households |
| Less than $10,000 | 81 | 10.7% |
| $10,000 to $14,999 | 50 | 6.6% |
| $15,000 to $24,999 | 116 | 15.4% |
| $25,000 to $34,999 | 105 | 13.9% |
| $35,000 to $49,999 | 165 | 21.9% |
| $50,000 to $74,999 | 128 | 17.0% |
| $75,000 to $99,999 | 58 | 7.7% |
| $100,000 to $149,999 | 41 | 5.4% |
| $150,000 to $199,999 | 10 | 1.3% |
| $200,000+ | 0 | 0.0% |
Household Income by Householder Age in Jefferson
The median household income in Jefferson is $37,232, with the highest median household income of $45,729 found in the 45 to 64 years age bracket for the primary householder. A total of 243 households (32.2%) fall into this category. Meanwhile, the 15 to 24 years age bracket for the primary householder has the lowest median household income of $0, with 41 households (5.4%) in this group.
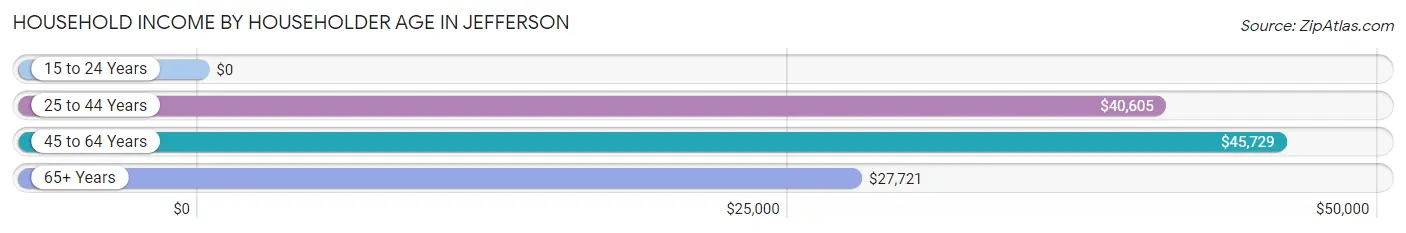
| Income Bracket | # Households | Median Income |
| 15 to 24 Years | 41 (5.4%) | $0 |
| 25 to 44 Years | 243 (32.2%) | $40,605 |
| 45 to 64 Years | 243 (32.2%) | $45,729 |
| 65+ Years | 227 (30.1%) | $27,721 |
| Total | 754 (100.0%) | $37,232 |
Poverty in Jefferson
Income Below Poverty by Sex and Age in Jefferson
With 22.3% poverty level for males and 28.4% for females among the residents of Jefferson, 5 year old males and 5 year old females are the most vulnerable to poverty, with 4 males (100.0%) and 11 females (100.0%) in their respective age groups living below the poverty level.
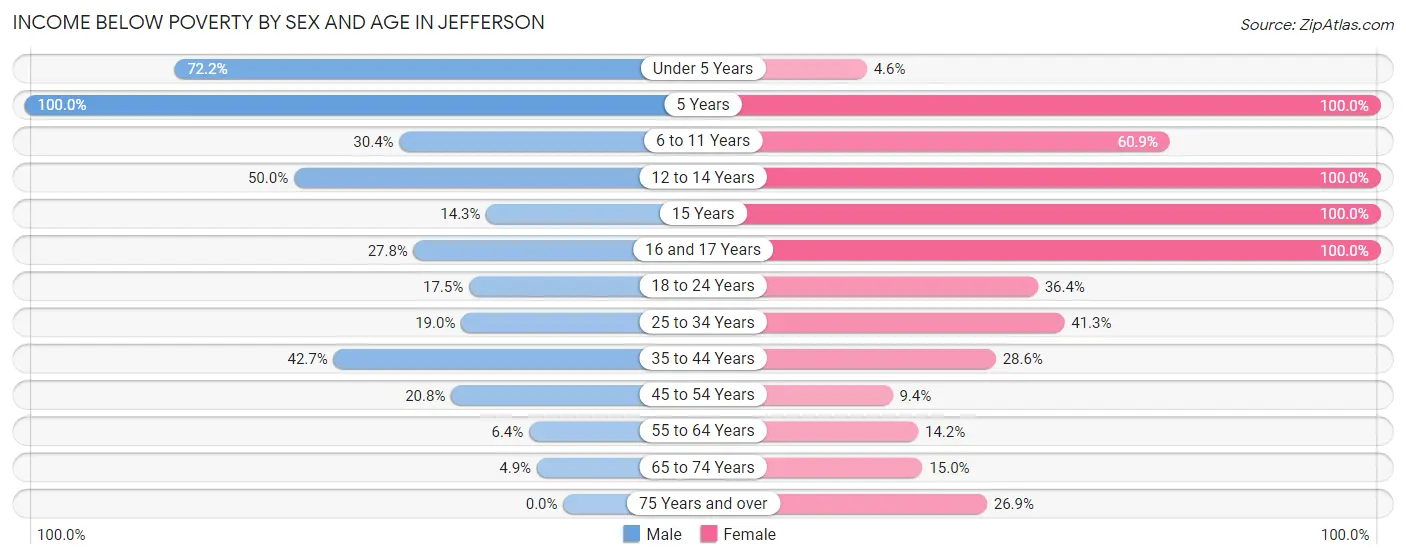
| Age Bracket | Male | Female |
| Under 5 Years | 13 (72.2%) | 3 (4.6%) |
| 5 Years | 4 (100.0%) | 11 (100.0%) |
| 6 to 11 Years | 21 (30.4%) | 42 (60.9%) |
| 12 to 14 Years | 23 (50.0%) | 15 (100.0%) |
| 15 Years | 2 (14.3%) | 2 (100.0%) |
| 16 and 17 Years | 5 (27.8%) | 2 (100.0%) |
| 18 to 24 Years | 7 (17.5%) | 20 (36.4%) |
| 25 to 34 Years | 29 (19.0%) | 57 (41.3%) |
| 35 to 44 Years | 29 (42.6%) | 20 (28.6%) |
| 45 to 54 Years | 31 (20.8%) | 8 (9.4%) |
| 55 to 64 Years | 4 (6.4%) | 16 (14.2%) |
| 65 to 74 Years | 5 (4.9%) | 19 (15.0%) |
| 75 Years and over | 0 (0.0%) | 28 (26.9%) |
| Total | 173 (22.3%) | 243 (28.4%) |
Income Above Poverty by Sex and Age in Jefferson
According to the poverty statistics in Jefferson, males aged 75 years and over and females aged under 5 years are the age groups that are most secure financially, with 100.0% of males and 95.4% of females in these age groups living above the poverty line.
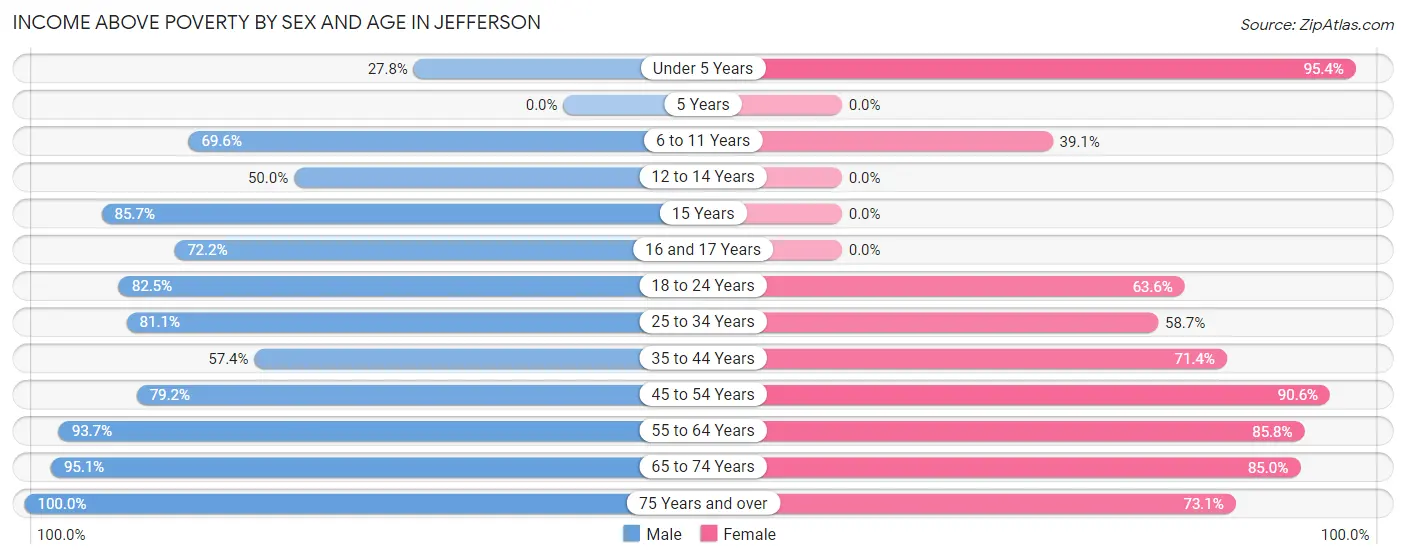
| Age Bracket | Male | Female |
| Under 5 Years | 5 (27.8%) | 62 (95.4%) |
| 5 Years | 0 (0.0%) | 0 (0.0%) |
| 6 to 11 Years | 48 (69.6%) | 27 (39.1%) |
| 12 to 14 Years | 23 (50.0%) | 0 (0.0%) |
| 15 Years | 12 (85.7%) | 0 (0.0%) |
| 16 and 17 Years | 13 (72.2%) | 0 (0.0%) |
| 18 to 24 Years | 33 (82.5%) | 35 (63.6%) |
| 25 to 34 Years | 124 (81.0%) | 81 (58.7%) |
| 35 to 44 Years | 39 (57.4%) | 50 (71.4%) |
| 45 to 54 Years | 118 (79.2%) | 77 (90.6%) |
| 55 to 64 Years | 59 (93.6%) | 97 (85.8%) |
| 65 to 74 Years | 97 (95.1%) | 108 (85.0%) |
| 75 Years and over | 31 (100.0%) | 76 (73.1%) |
| Total | 602 (77.7%) | 613 (71.6%) |
Income Below Poverty Among Married-Couple Families in Jefferson
The poverty statistics for married-couple families in Jefferson show that 6.7% or 16 of the total 239 families live below the poverty line. Families with 5 or more children have the highest poverty rate of 100.0%, comprising of 3 families. On the other hand, families with 1 or 2 children have the lowest poverty rate of 0.0%, which includes 0 families.
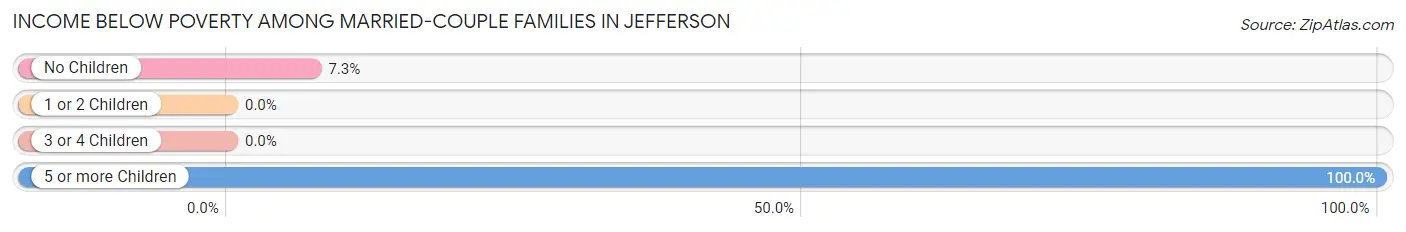
| Children | Above Poverty | Below Poverty |
| No Children | 166 (92.7%) | 13 (7.3%) |
| 1 or 2 Children | 33 (100.0%) | 0 (0.0%) |
| 3 or 4 Children | 24 (100.0%) | 0 (0.0%) |
| 5 or more Children | 0 (0.0%) | 3 (100.0%) |
| Total | 223 (93.3%) | 16 (6.7%) |
Income Below Poverty Among Single-Parent Households in Jefferson
According to the poverty data in Jefferson, 37.7% or 20 single-father households and 34.2% or 42 single-mother households are living below the poverty line. Among single-father households, those with 1 or 2 children have the highest poverty rate, with 20 households (40.8%) experiencing poverty. Likewise, among single-mother households, those with 3 or 4 children have the highest poverty rate, with 14 households (100.0%) falling below the poverty line.
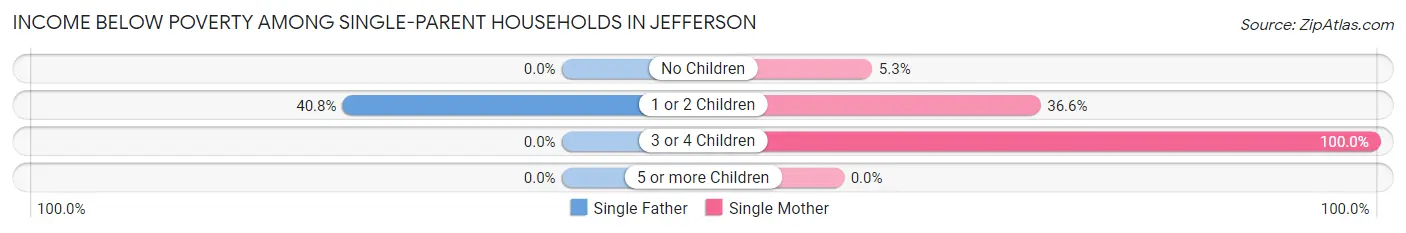
| Children | Single Father | Single Mother |
| No Children | 0 (0.0%) | 2 (5.3%) |
| 1 or 2 Children | 20 (40.8%) | 26 (36.6%) |
| 3 or 4 Children | 0 (0.0%) | 14 (100.0%) |
| 5 or more Children | 0 (0.0%) | 0 (0.0%) |
| Total | 20 (37.7%) | 42 (34.2%) |
Income Below Poverty Among Married-Couple vs Single-Parent Households in Jefferson
The poverty data for Jefferson shows that 16 of the married-couple family households (6.7%) and 62 of the single-parent households (35.2%) are living below the poverty level. Within the married-couple family households, those with 5 or more children have the highest poverty rate, with 3 households (100.0%) falling below the poverty line. Among the single-parent households, those with 3 or 4 children have the highest poverty rate, with 14 household (100.0%) living below poverty.
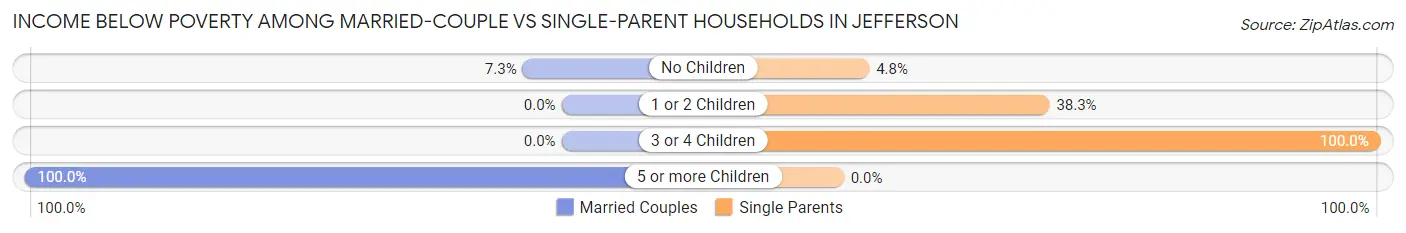
| Children | Married-Couple Families | Single-Parent Households |
| No Children | 13 (7.3%) | 2 (4.8%) |
| 1 or 2 Children | 0 (0.0%) | 46 (38.3%) |
| 3 or 4 Children | 0 (0.0%) | 14 (100.0%) |
| 5 or more Children | 3 (100.0%) | 0 (0.0%) |
| Total | 16 (6.7%) | 62 (35.2%) |
Race in Jefferson
The most populous races in Jefferson are White / Caucasian (1,741 | 93.0%), Hispanic or Latino (162 | 8.6%), and Two or more Races (88 | 4.7%).
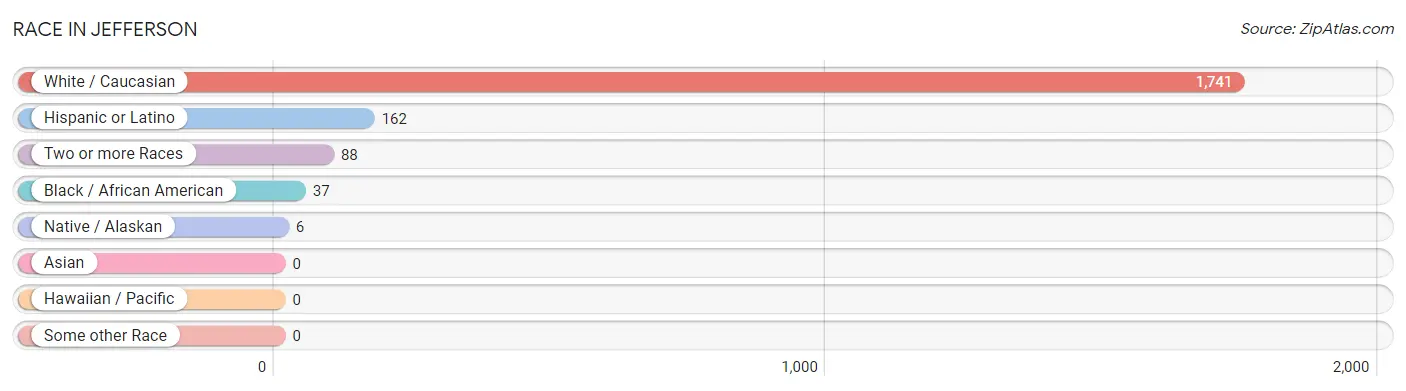
| Race | # Population | % Population |
| Asian | 0 | 0.0% |
| Black / African American | 37 | 2.0% |
| Hawaiian / Pacific | 0 | 0.0% |
| Hispanic or Latino | 162 | 8.6% |
| Native / Alaskan | 6 | 0.3% |
| White / Caucasian | 1,741 | 93.0% |
| Two or more Races | 88 | 4.7% |
| Some other Race | 0 | 0.0% |
| Total | 1,872 | 100.0% |
Ancestry in Jefferson
The most populous ancestries reported in Jefferson are American (645 | 34.5%), English (170 | 9.1%), Irish (112 | 6.0%), German (103 | 5.5%), and Mexican (90 | 4.8%), together accounting for 59.8% of all Jefferson residents.
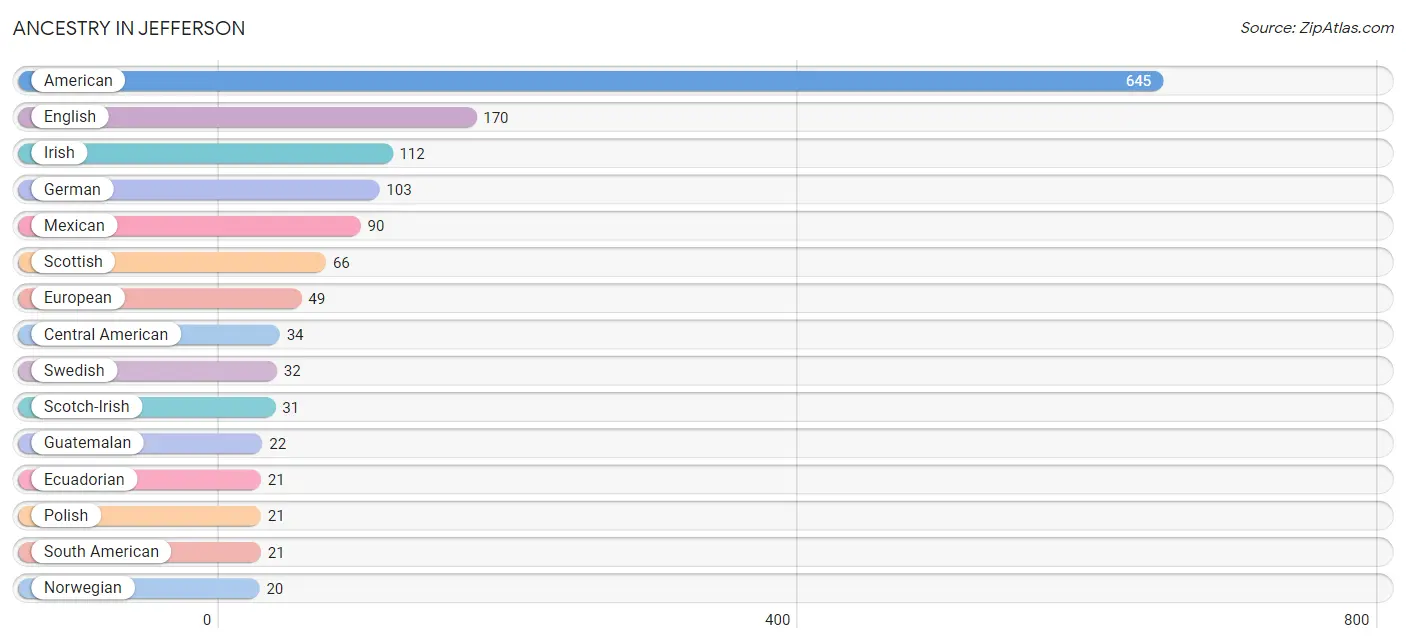
| Ancestry | # Population | % Population |
| American | 645 | 34.5% |
| Canadian | 4 | 0.2% |
| Central American | 34 | 1.8% |
| Cherokee | 6 | 0.3% |
| Chickasaw | 9 | 0.5% |
| Cuban | 3 | 0.2% |
| Czech | 16 | 0.9% |
| Dutch | 15 | 0.8% |
| Ecuadorian | 21 | 1.1% |
| English | 170 | 9.1% |
| European | 49 | 2.6% |
| French | 19 | 1.0% |
| German | 103 | 5.5% |
| Guatemalan | 22 | 1.2% |
| Honduran | 12 | 0.6% |
| Irish | 112 | 6.0% |
| Italian | 18 | 1.0% |
| Lithuanian | 7 | 0.4% |
| Lumbee | 5 | 0.3% |
| Mexican | 90 | 4.8% |
| Northern European | 5 | 0.3% |
| Norwegian | 20 | 1.1% |
| Polish | 21 | 1.1% |
| Puerto Rican | 5 | 0.3% |
| Scotch-Irish | 31 | 1.7% |
| Scottish | 66 | 3.5% |
| South American | 21 | 1.1% |
| Swedish | 32 | 1.7% | View All 28 Rows |
Immigrants in Jefferson
The most numerous immigrant groups reported in Jefferson came from Latin America (92 | 4.9%), Central America (71 | 3.8%), Mexico (49 | 2.6%), Guatemala (22 | 1.2%), and Ecuador (21 | 1.1%), together accounting for 13.6% of all Jefferson residents.
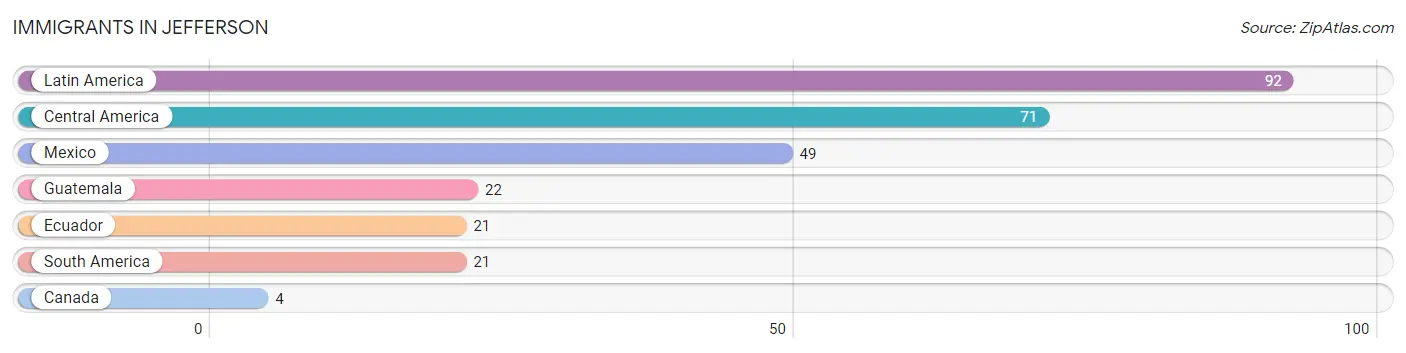
| Immigration Origin | # Population | % Population |
| Canada | 4 | 0.2% |
| Central America | 71 | 3.8% |
| Ecuador | 21 | 1.1% |
| Guatemala | 22 | 1.2% |
| Latin America | 92 | 4.9% |
| Mexico | 49 | 2.6% |
| South America | 21 | 1.1% | View All 7 Rows |
Sex and Age in Jefferson
Sex and Age in Jefferson
The most populous age groups in Jefferson are 30 to 34 Years (84 | 9.6%) for men and 80 to 84 Years (86 | 8.6%) for women.
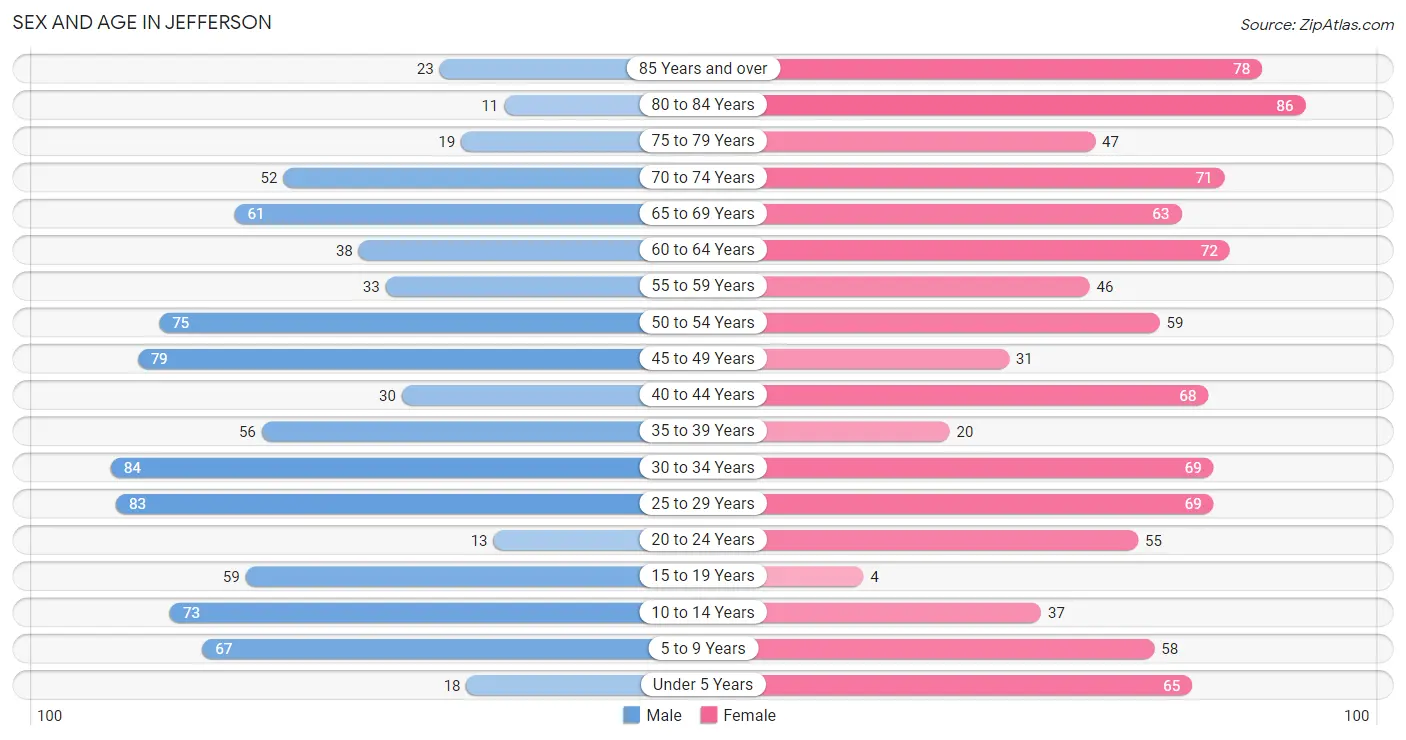
| Age Bracket | Male | Female |
| Under 5 Years | 18 (2.1%) | 65 (6.5%) |
| 5 to 9 Years | 67 (7.7%) | 58 (5.8%) |
| 10 to 14 Years | 73 (8.4%) | 37 (3.7%) |
| 15 to 19 Years | 59 (6.8%) | 4 (0.4%) |
| 20 to 24 Years | 13 (1.5%) | 55 (5.5%) |
| 25 to 29 Years | 83 (9.5%) | 69 (6.9%) |
| 30 to 34 Years | 84 (9.6%) | 69 (6.9%) |
| 35 to 39 Years | 56 (6.4%) | 20 (2.0%) |
| 40 to 44 Years | 30 (3.4%) | 68 (6.8%) |
| 45 to 49 Years | 79 (9.0%) | 31 (3.1%) |
| 50 to 54 Years | 75 (8.6%) | 59 (5.9%) |
| 55 to 59 Years | 33 (3.8%) | 46 (4.6%) |
| 60 to 64 Years | 38 (4.3%) | 72 (7.2%) |
| 65 to 69 Years | 61 (7.0%) | 63 (6.3%) |
| 70 to 74 Years | 52 (5.9%) | 71 (7.1%) |
| 75 to 79 Years | 19 (2.2%) | 47 (4.7%) |
| 80 to 84 Years | 11 (1.3%) | 86 (8.6%) |
| 85 Years and over | 23 (2.6%) | 78 (7.8%) |
| Total | 874 (100.0%) | 998 (100.0%) |
Families and Households in Jefferson
Median Family Size in Jefferson
The median family size in Jefferson is 2.88 persons per family, with single female/mother families (123 | 29.6%) accounting for the largest median family size of 3.07 persons per family. On the other hand, single male/father families (53 | 12.8%) represent the smallest median family size with 2.79 persons per family.
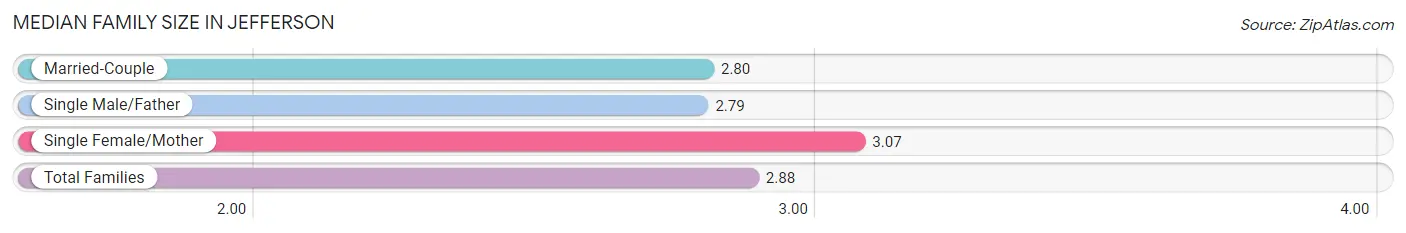
| Family Type | # Families | Family Size |
| Married-Couple | 239 (57.6%) | 2.80 |
| Single Male/Father | 53 (12.8%) | 2.79 |
| Single Female/Mother | 123 (29.6%) | 3.07 |
| Total Families | 415 (100.0%) | 2.88 |
Median Household Size in Jefferson
The median household size in Jefferson is 2.18 persons per household, with single male/father households (53 | 7.0%) accounting for the largest median household size of 3.55 persons per household. non-family households (339 | 45.0%) represent the smallest median household size with 1.12 persons per household.
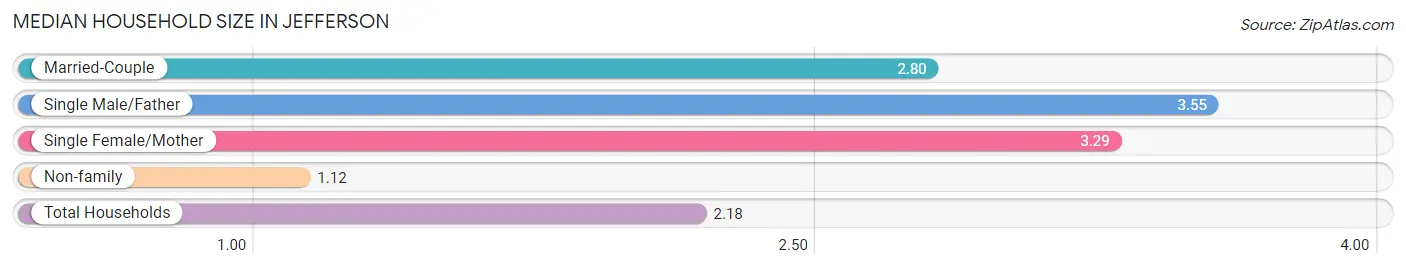
| Household Type | # Households | Household Size |
| Married-Couple | 239 (31.7%) | 2.80 |
| Single Male/Father | 53 (7.0%) | 3.55 |
| Single Female/Mother | 123 (16.3%) | 3.29 |
| Non-family | 339 (45.0%) | 1.12 |
| Total Households | 754 (100.0%) | 2.18 |
Household Size by Marriage Status in Jefferson
Out of a total of 754 households in Jefferson, 415 (55.0%) are family households, while 339 (45.0%) are nonfamily households. The most numerous type of family households are 2-person households, comprising 216, and the most common type of nonfamily households are 1-person households, comprising 307.
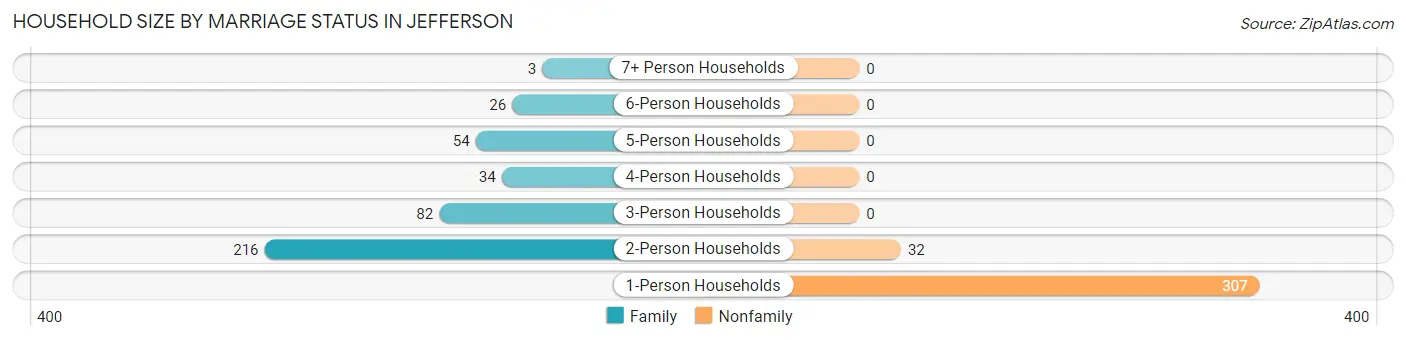
| Household Size | Family Households | Nonfamily Households |
| 1-Person Households | - | 307 (40.7%) |
| 2-Person Households | 216 (28.6%) | 32 (4.2%) |
| 3-Person Households | 82 (10.9%) | 0 (0.0%) |
| 4-Person Households | 34 (4.5%) | 0 (0.0%) |
| 5-Person Households | 54 (7.2%) | 0 (0.0%) |
| 6-Person Households | 26 (3.5%) | 0 (0.0%) |
| 7+ Person Households | 3 (0.4%) | 0 (0.0%) |
| Total | 415 (55.0%) | 339 (45.0%) |
Female Fertility in Jefferson
Fertility by Age in Jefferson
Average fertility rate in Jefferson is 83.0 births per 1,000 women. Women in the age bracket of 20 to 34 years have the highest fertility rate with 140.0 births per 1,000 women. Women in the age bracket of 20 to 34 years acount for 100.0% of all women with births.
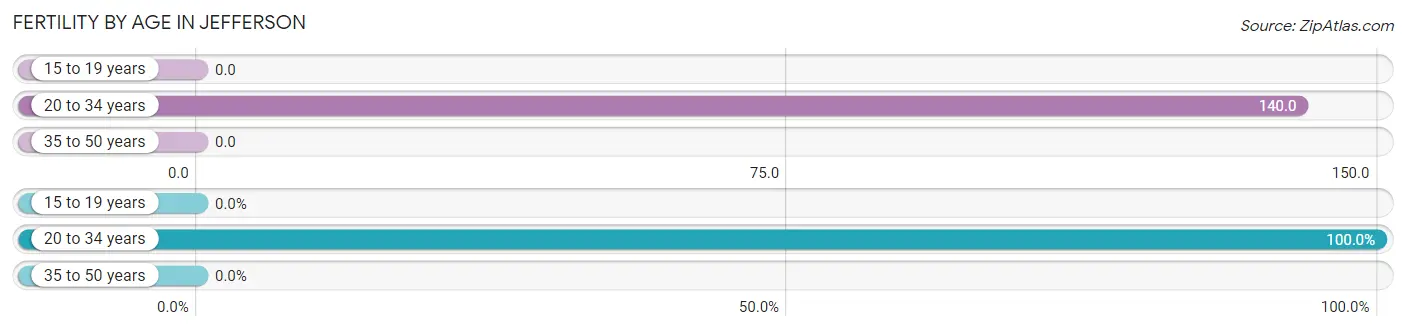
| Age Bracket | Women with Births | Births / 1,000 Women |
| 15 to 19 years | 0 (0.0%) | 0.0 |
| 20 to 34 years | 27 (100.0%) | 140.0 |
| 35 to 50 years | 0 (0.0%) | 0.0 |
| Total | 27 (100.0%) | 83.0 |
Fertility by Age by Marriage Status in Jefferson
37.0% of women with births (27) in Jefferson are married. The highest percentage of unmarried women with births falls into 20 to 34 years age bracket with 63.0% of them unmarried at the time of birth, while the lowest percentage of unmarried women with births belong to 20 to 34 years age bracket with 63.0% of them unmarried.
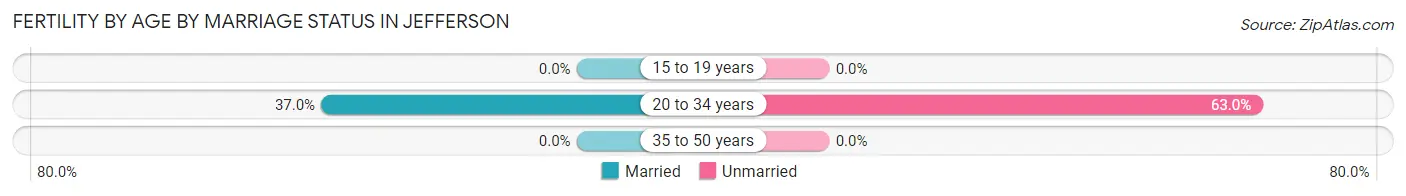
| Age Bracket | Married | Unmarried |
| 15 to 19 years | 0 (0.0%) | 0 (0.0%) |
| 20 to 34 years | 10 (37.0%) | 17 (63.0%) |
| 35 to 50 years | 0 (0.0%) | 0 (0.0%) |
| Total | 10 (37.0%) | 17 (63.0%) |
Fertility by Education in Jefferson
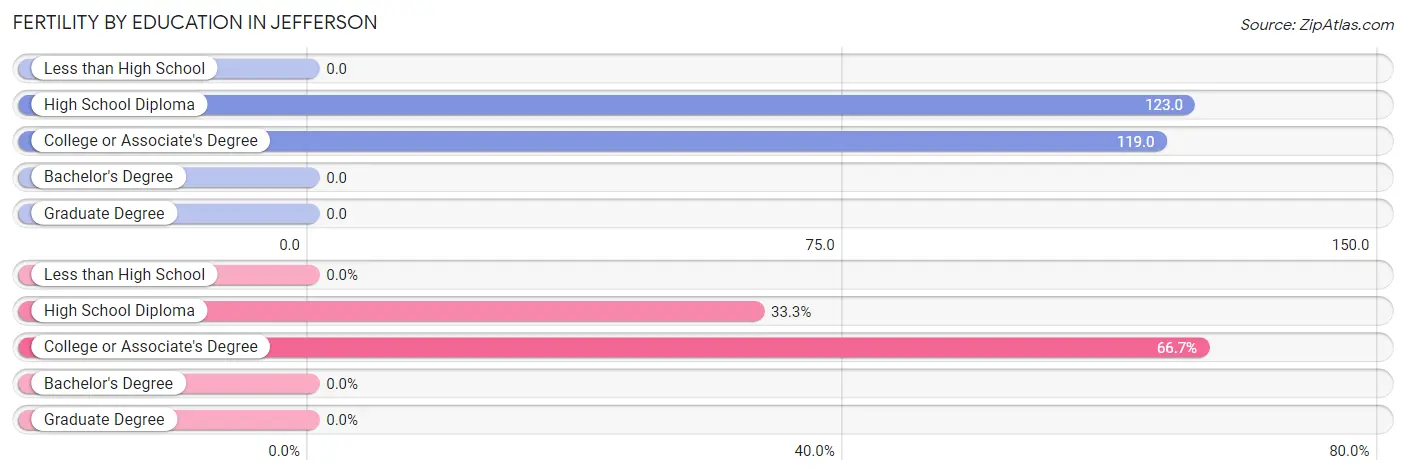
| Educational Attainment | Women with Births | Births / 1,000 Women |
| Less than High School | 0 (0.0%) | 0.0 |
| High School Diploma | 9 (33.3%) | 123.0 |
| College or Associate's Degree | 18 (66.7%) | 119.0 |
| Bachelor's Degree | 0 (0.0%) | 0.0 |
| Graduate Degree | 0 (0.0%) | 0.0 |
| Total | 27 (100.0%) | 83.0 |
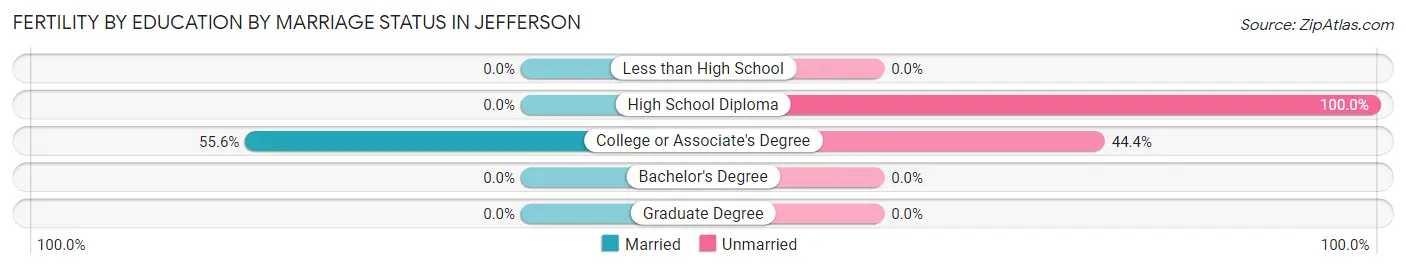
Fertility by Education by Marriage Status in Jefferson
63.0% of women with births in Jefferson are unmarried. Women with the educational attainment of college or associate's degree are most likely to be married with 55.6% of them married at childbirth, while women with the educational attainment of high school diploma are least likely to be married with 100.0% of them unmarried at childbirth.
| Educational Attainment | Married | Unmarried |
| Less than High School | 0 (0.0%) | 0 (0.0%) |
| High School Diploma | 0 (0.0%) | 9 (100.0%) |
| College or Associate's Degree | 10 (55.6%) | 8 (44.4%) |
| Bachelor's Degree | 0 (0.0%) | 0 (0.0%) |
| Graduate Degree | 0 (0.0%) | 0 (0.0%) |
| Total | 10 (37.0%) | 17 (63.0%) |
Employment Characteristics in Jefferson
Employment by Class of Employer in Jefferson
Among the 729 employed individuals in Jefferson, private company employees (552 | 75.7%), self-employed (not incorporated) (59 | 8.1%), and not-for-profit organizations (30 | 4.1%) make up the most common classes of employment.
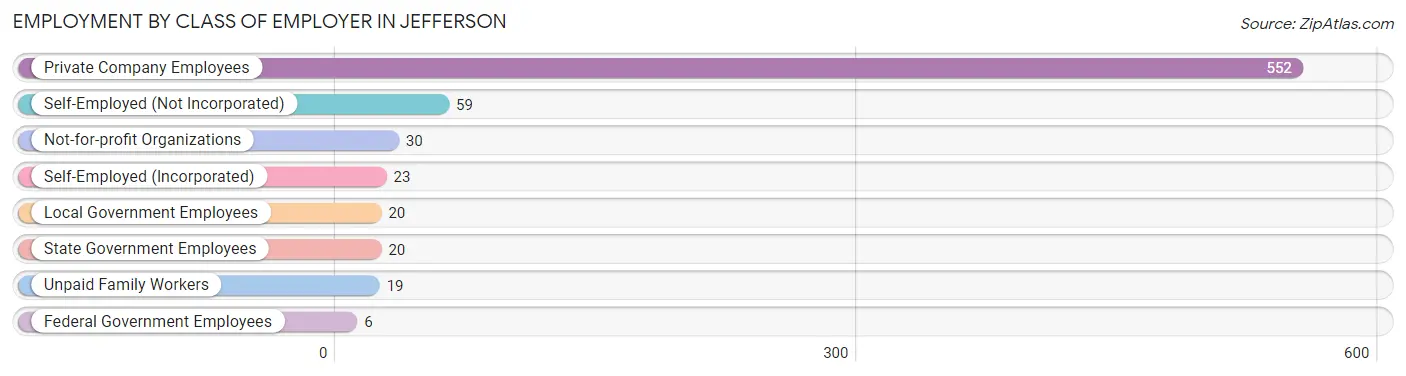
| Employer Class | # Employees | % Employees |
| Private Company Employees | 552 | 75.7% |
| Self-Employed (Incorporated) | 23 | 3.2% |
| Self-Employed (Not Incorporated) | 59 | 8.1% |
| Not-for-profit Organizations | 30 | 4.1% |
| Local Government Employees | 20 | 2.7% |
| State Government Employees | 20 | 2.7% |
| Federal Government Employees | 6 | 0.8% |
| Unpaid Family Workers | 19 | 2.6% |
| Total | 729 | 100.0% |
Employment Status by Age in Jefferson
According to the labor force statistics for Jefferson, out of the total population over 16 years of age (1,538), 51.7% or 795 individuals are in the labor force, with 4.3% or 34 of them unemployed. The age group with the highest labor force participation rate is 20 to 24 years, with 97.1% or 66 individuals in the labor force. Within the labor force, the 25 to 29 years age range has the highest percentage of unemployed individuals, with 9.7% or 12 of them being unemployed.
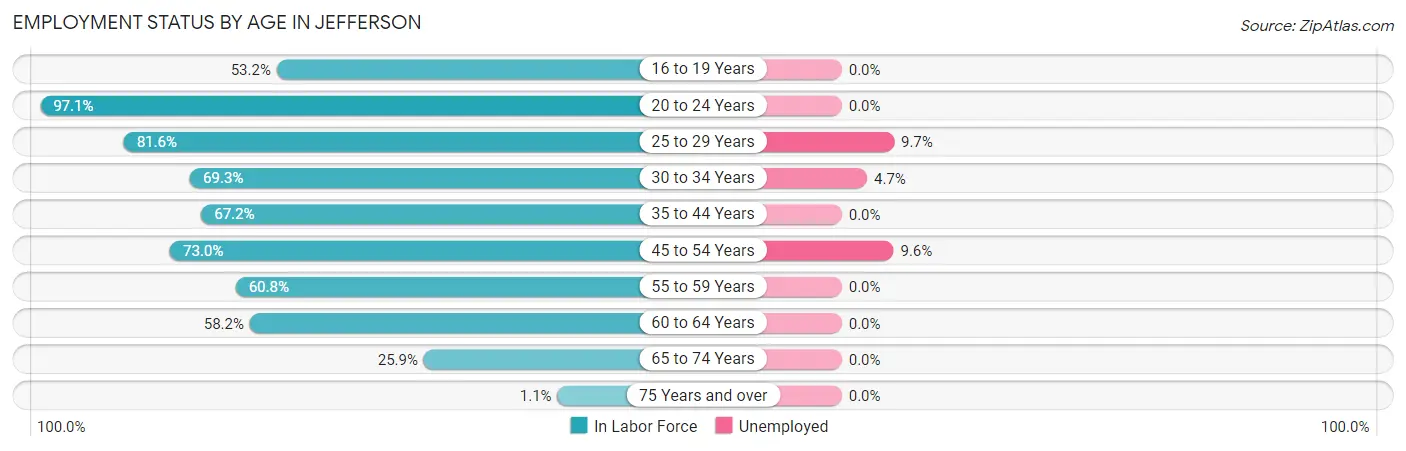
| Age Bracket | In Labor Force | Unemployed |
| 16 to 19 Years | 25 (53.2%) | 0 (0.0%) |
| 20 to 24 Years | 66 (97.1%) | 0 (0.0%) |
| 25 to 29 Years | 124 (81.6%) | 12 (9.7%) |
| 30 to 34 Years | 106 (69.3%) | 5 (4.7%) |
| 35 to 44 Years | 117 (67.2%) | 0 (0.0%) |
| 45 to 54 Years | 178 (73.0%) | 17 (9.6%) |
| 55 to 59 Years | 48 (60.8%) | 0 (0.0%) |
| 60 to 64 Years | 64 (58.2%) | 0 (0.0%) |
| 65 to 74 Years | 64 (25.9%) | 0 (0.0%) |
| 75 Years and over | 3 (1.1%) | 0 (0.0%) |
| Total | 795 (51.7%) | 34 (4.3%) |
Employment Status by Educational Attainment in Jefferson
According to labor force statistics for Jefferson, 69.8% of individuals (637) out of the total population between 25 and 64 years of age (912) are in the labor force, with 5.3% or 34 of them being unemployed. The group with the highest labor force participation rate are those with the educational attainment of bachelor's degree or higher, with 85.8% or 103 individuals in the labor force. Within the labor force, individuals with less than high school education have the highest percentage of unemployment, with 12.7% or 8 of them being unemployed.
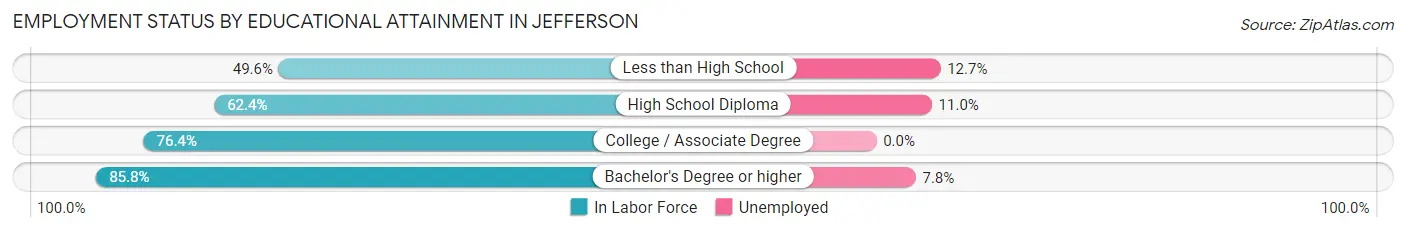
| Educational Attainment | In Labor Force | Unemployed |
| Less than High School | 63 (49.6%) | 16 (12.7%) |
| High School Diploma | 164 (62.4%) | 29 (11.0%) |
| College / Associate Degree | 307 (76.4%) | 0 (0.0%) |
| Bachelor's Degree or higher | 103 (85.8%) | 9 (7.8%) |
| Total | 637 (69.8%) | 48 (5.3%) |
Employment Occupations by Sex in Jefferson
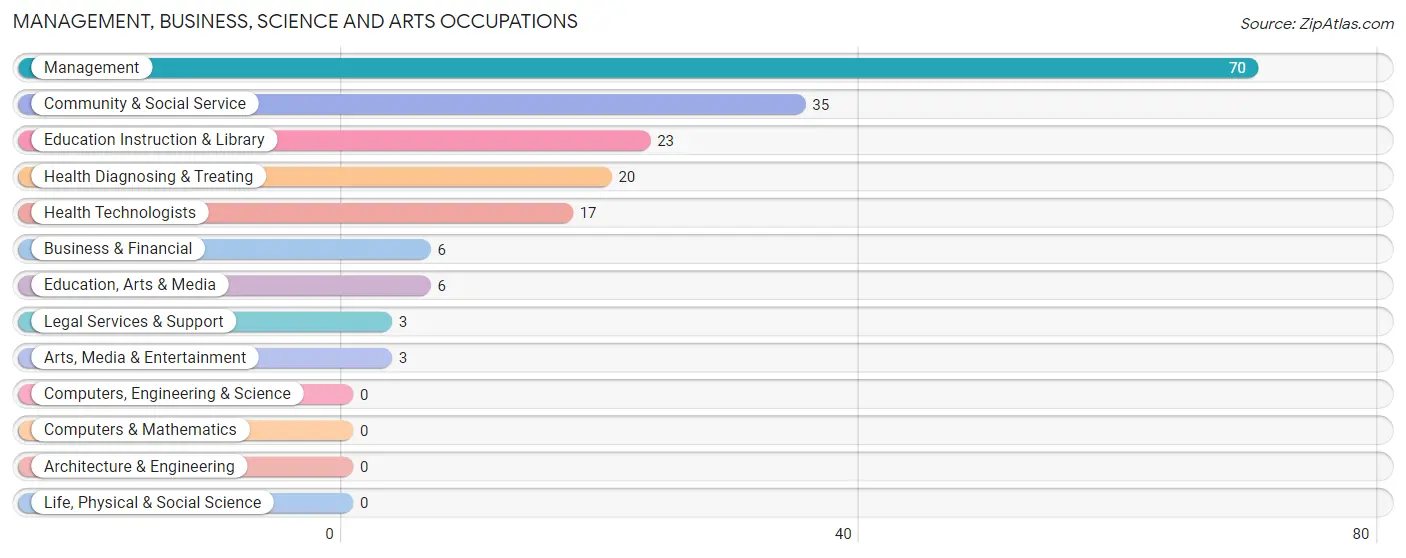
Management, Business, Science and Arts Occupations
The most common Management, Business, Science and Arts occupations in Jefferson are Management (70 | 9.2%), Community & Social Service (35 | 4.6%), Education Instruction & Library (23 | 3.0%), Health Diagnosing & Treating (20 | 2.6%), and Health Technologists (17 | 2.2%).
Management, Business, Science and Arts Occupations by Sex
Within the Management, Business, Science and Arts occupations in Jefferson, the most male-oriented occupations are Legal Services & Support (100.0%), Management (80.0%), and Community & Social Service (17.1%), while the most female-oriented occupations are Business & Financial (100.0%), Education, Arts & Media (100.0%), and Arts, Media & Entertainment (100.0%).
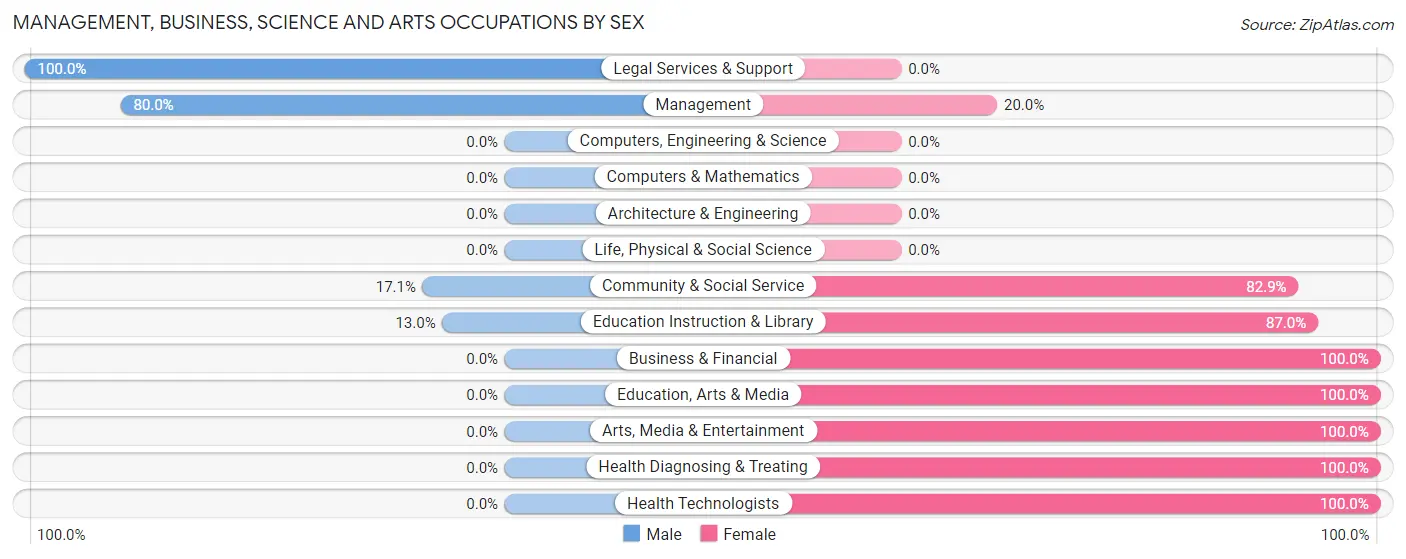
| Occupation | Male | Female |
| Management | 56 (80.0%) | 14 (20.0%) |
| Business & Financial | 0 (0.0%) | 6 (100.0%) |
| Computers, Engineering & Science | 0 (0.0%) | 0 (0.0%) |
| Computers & Mathematics | 0 (0.0%) | 0 (0.0%) |
| Architecture & Engineering | 0 (0.0%) | 0 (0.0%) |
| Life, Physical & Social Science | 0 (0.0%) | 0 (0.0%) |
| Community & Social Service | 6 (17.1%) | 29 (82.9%) |
| Education, Arts & Media | 0 (0.0%) | 6 (100.0%) |
| Legal Services & Support | 3 (100.0%) | 0 (0.0%) |
| Education Instruction & Library | 3 (13.0%) | 20 (87.0%) |
| Arts, Media & Entertainment | 0 (0.0%) | 3 (100.0%) |
| Health Diagnosing & Treating | 0 (0.0%) | 20 (100.0%) |
| Health Technologists | 0 (0.0%) | 17 (100.0%) |
| Total (Category) | 62 (47.3%) | 69 (52.7%) |
| Total (Overall) | 422 (55.4%) | 339 (44.6%) |
Services Occupations
The most common Services occupations in Jefferson are Food Preparation & Serving (68 | 8.9%), Healthcare Support (40 | 5.3%), and Cleaning & Maintenance (25 | 3.3%).
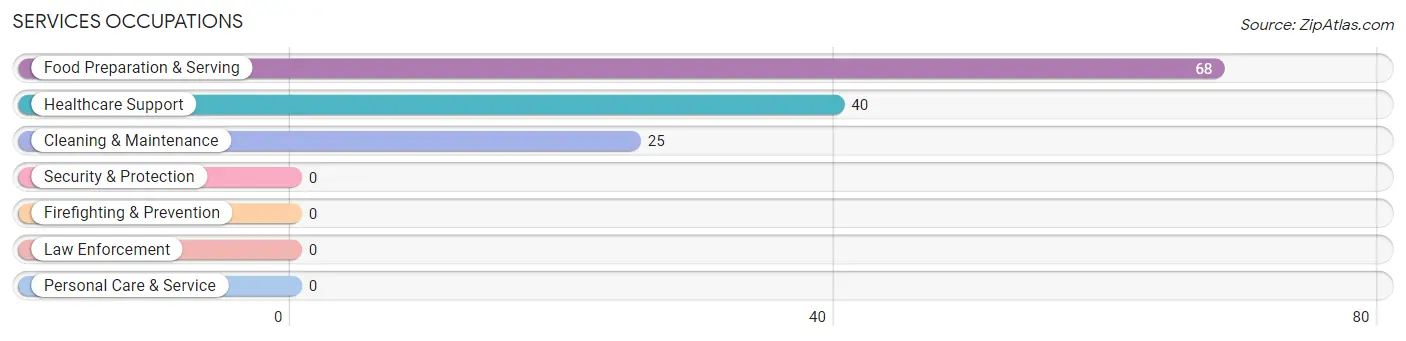
Services Occupations by Sex
Within the Services occupations in Jefferson, the most male-oriented occupations are Cleaning & Maintenance (64.0%), and Food Preparation & Serving (63.2%), while the most female-oriented occupations are Healthcare Support (100.0%), Food Preparation & Serving (36.8%), and Cleaning & Maintenance (36.0%).
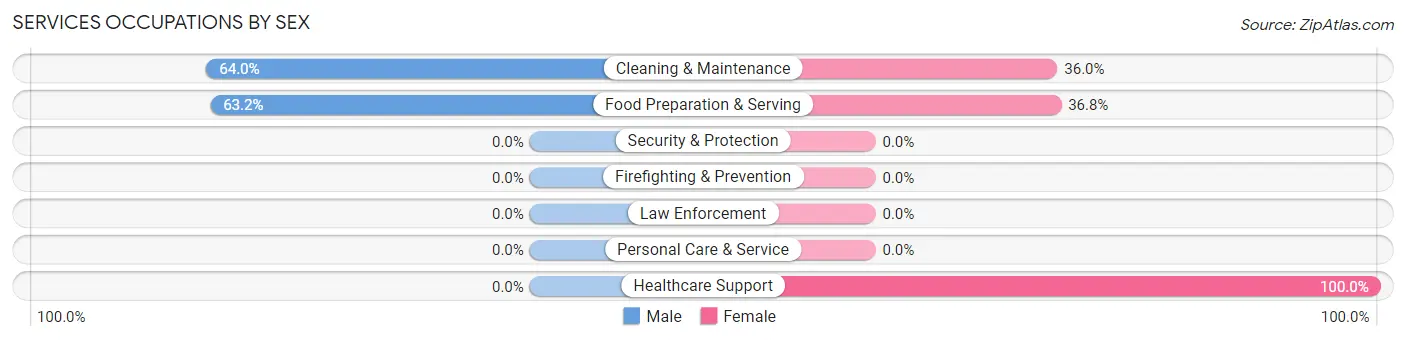
| Occupation | Male | Female |
| Healthcare Support | 0 (0.0%) | 40 (100.0%) |
| Security & Protection | 0 (0.0%) | 0 (0.0%) |
| Firefighting & Prevention | 0 (0.0%) | 0 (0.0%) |
| Law Enforcement | 0 (0.0%) | 0 (0.0%) |
| Food Preparation & Serving | 43 (63.2%) | 25 (36.8%) |
| Cleaning & Maintenance | 16 (64.0%) | 9 (36.0%) |
| Personal Care & Service | 0 (0.0%) | 0 (0.0%) |
| Total (Category) | 59 (44.4%) | 74 (55.6%) |
| Total (Overall) | 422 (55.4%) | 339 (44.6%) |
Sales and Office Occupations
The most common Sales and Office occupations in Jefferson are Office & Administration (106 | 13.9%), and Sales & Related (101 | 13.3%).
Sales and Office Occupations by Sex
| Occupation | Male | Female |
| Sales & Related | 36 (35.6%) | 65 (64.4%) |
| Office & Administration | 15 (14.1%) | 91 (85.9%) |
| Total (Category) | 51 (24.6%) | 156 (75.4%) |
| Total (Overall) | 422 (55.4%) | 339 (44.6%) |
Natural Resources, Construction and Maintenance Occupations
The most common Natural Resources, Construction and Maintenance occupations in Jefferson are Construction & Extraction (69 | 9.1%), Installation, Maintenance & Repair (68 | 8.9%), and Farming, Fishing & Forestry (27 | 3.5%).
Natural Resources, Construction and Maintenance Occupations by Sex
| Occupation | Male | Female |
| Farming, Fishing & Forestry | 27 (100.0%) | 0 (0.0%) |
| Construction & Extraction | 69 (100.0%) | 0 (0.0%) |
| Installation, Maintenance & Repair | 53 (77.9%) | 15 (22.1%) |
| Total (Category) | 149 (90.8%) | 15 (9.1%) |
| Total (Overall) | 422 (55.4%) | 339 (44.6%) |
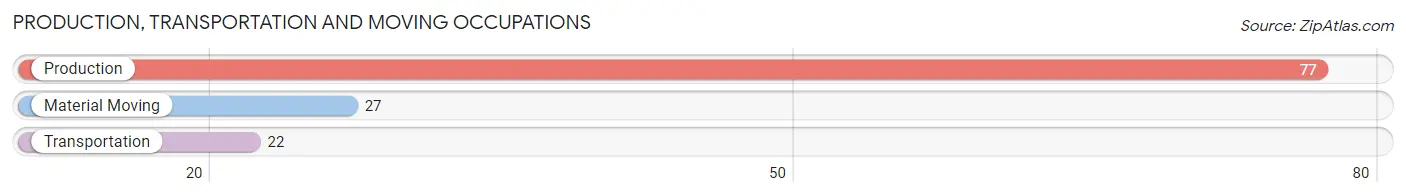
Production, Transportation and Moving Occupations
The most common Production, Transportation and Moving occupations in Jefferson are Production (77 | 10.1%), Material Moving (27 | 3.5%), and Transportation (22 | 2.9%).
Production, Transportation and Moving Occupations by Sex
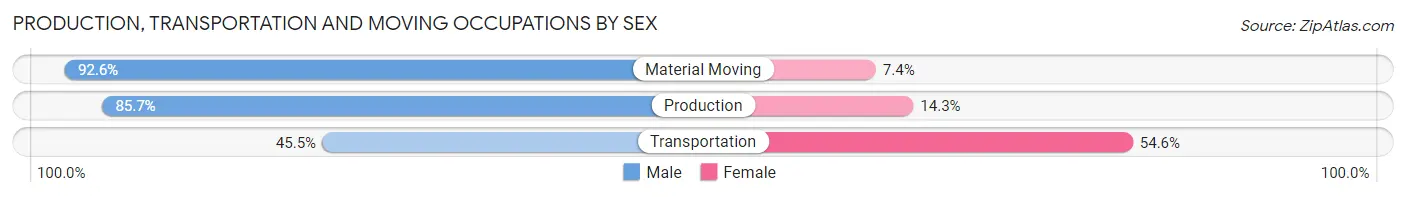
| Occupation | Male | Female |
| Production | 66 (85.7%) | 11 (14.3%) |
| Transportation | 10 (45.5%) | 12 (54.5%) |
| Material Moving | 25 (92.6%) | 2 (7.4%) |
| Total (Category) | 101 (80.2%) | 25 (19.8%) |
| Total (Overall) | 422 (55.4%) | 339 (44.6%) |
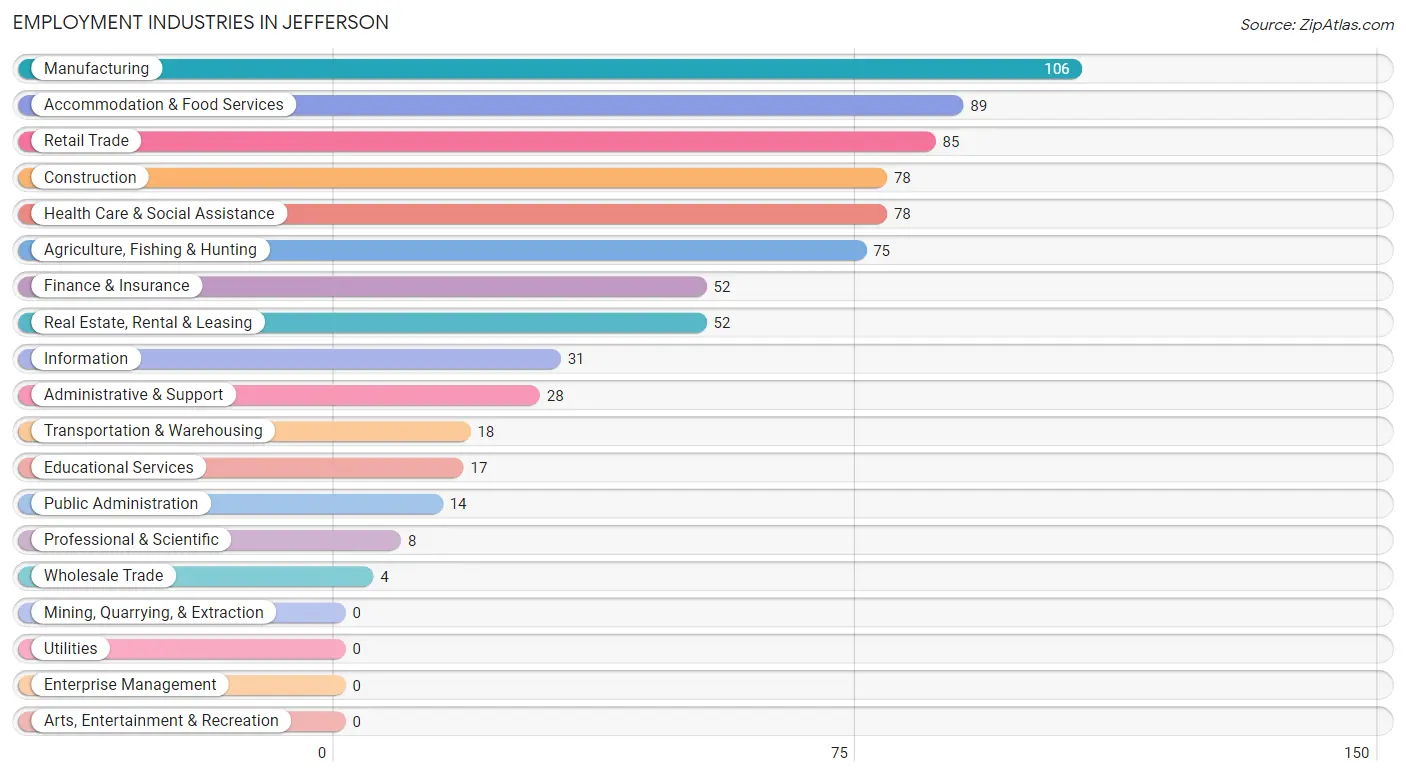
Employment Industries by Sex in Jefferson
Employment Industries in Jefferson
The major employment industries in Jefferson include Manufacturing (106 | 13.9%), Accommodation & Food Services (89 | 11.7%), Retail Trade (85 | 11.2%), Construction (78 | 10.2%), and Health Care & Social Assistance (78 | 10.2%).
Employment Industries by Sex in Jefferson
The Jefferson industries that see more men than women are Wholesale Trade (100.0%), Construction (94.9%), and Manufacturing (85.9%), whereas the industries that tend to have a higher number of women are Health Care & Social Assistance (100.0%), Information (96.8%), and Finance & Insurance (88.5%).
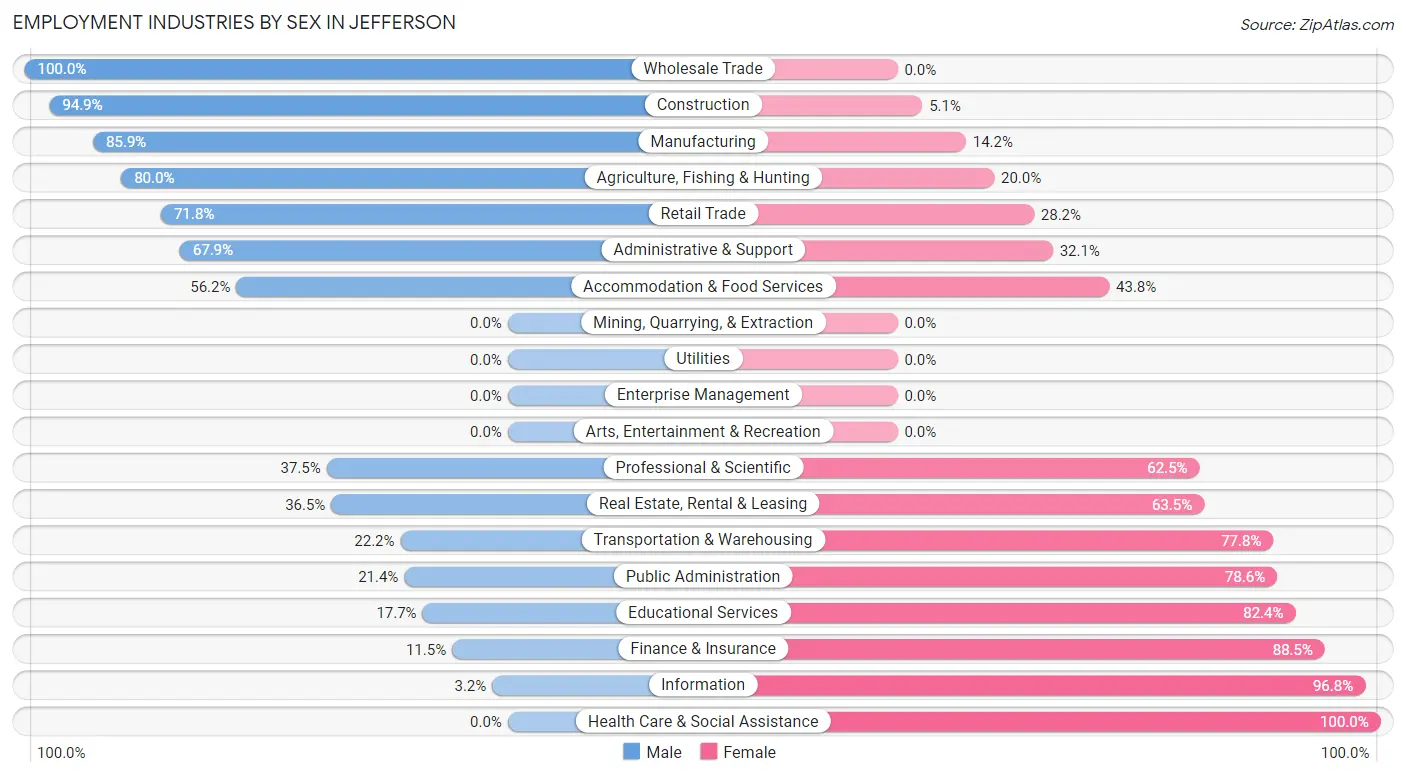
| Industry | Male | Female |
| Agriculture, Fishing & Hunting | 60 (80.0%) | 15 (20.0%) |
| Mining, Quarrying, & Extraction | 0 (0.0%) | 0 (0.0%) |
| Construction | 74 (94.9%) | 4 (5.1%) |
| Manufacturing | 91 (85.9%) | 15 (14.1%) |
| Wholesale Trade | 4 (100.0%) | 0 (0.0%) |
| Retail Trade | 61 (71.8%) | 24 (28.2%) |
| Transportation & Warehousing | 4 (22.2%) | 14 (77.8%) |
| Utilities | 0 (0.0%) | 0 (0.0%) |
| Information | 1 (3.2%) | 30 (96.8%) |
| Finance & Insurance | 6 (11.5%) | 46 (88.5%) |
| Real Estate, Rental & Leasing | 19 (36.5%) | 33 (63.5%) |
| Professional & Scientific | 3 (37.5%) | 5 (62.5%) |
| Enterprise Management | 0 (0.0%) | 0 (0.0%) |
| Administrative & Support | 19 (67.9%) | 9 (32.1%) |
| Educational Services | 3 (17.6%) | 14 (82.4%) |
| Health Care & Social Assistance | 0 (0.0%) | 78 (100.0%) |
| Arts, Entertainment & Recreation | 0 (0.0%) | 0 (0.0%) |
| Accommodation & Food Services | 50 (56.2%) | 39 (43.8%) |
| Public Administration | 3 (21.4%) | 11 (78.6%) |
| Total | 422 (55.4%) | 339 (44.6%) |
Education in Jefferson
School Enrollment in Jefferson
The most common levels of schooling among the 340 students in Jefferson are elementary school (106 | 31.2%), high school (75 | 22.1%), and middle school (70 | 20.6%).
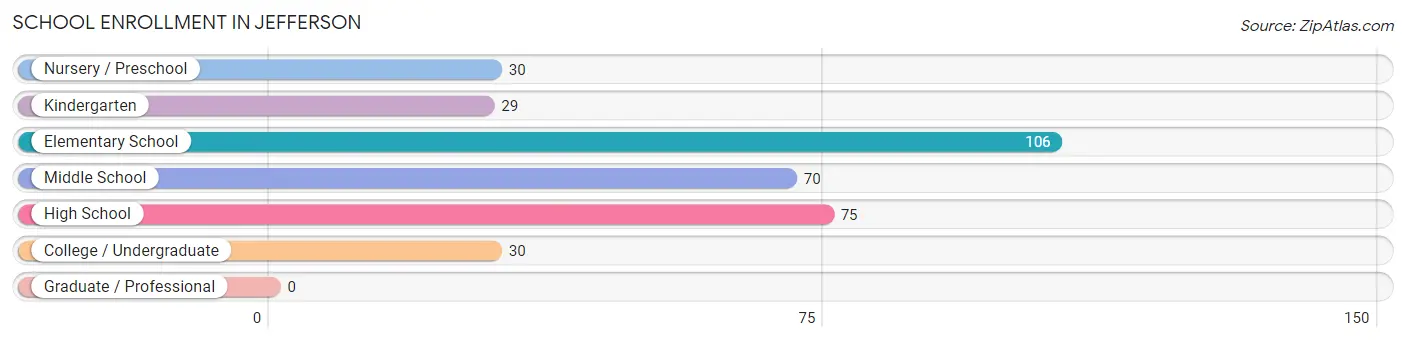
| School Level | # Students | % Students |
| Nursery / Preschool | 30 | 8.8% |
| Kindergarten | 29 | 8.5% |
| Elementary School | 106 | 31.2% |
| Middle School | 70 | 20.6% |
| High School | 75 | 22.1% |
| College / Undergraduate | 30 | 8.8% |
| Graduate / Professional | 0 | 0.0% |
| Total | 340 | 100.0% |
School Enrollment by Age by Funding Source in Jefferson
Out of a total of 340 students who are enrolled in schools in Jefferson, 16 (4.7%) attend a private institution, while the remaining 324 (95.3%) are enrolled in public schools. The age group of 5 to 9 year old has the highest likelihood of being enrolled in private schools, with 16 (12.8% in the age bracket) enrolled. Conversely, the age group of 3 to 4 year olds has the lowest likelihood of being enrolled in a private school, with 19 (100.0% in the age bracket) attending a public institution.
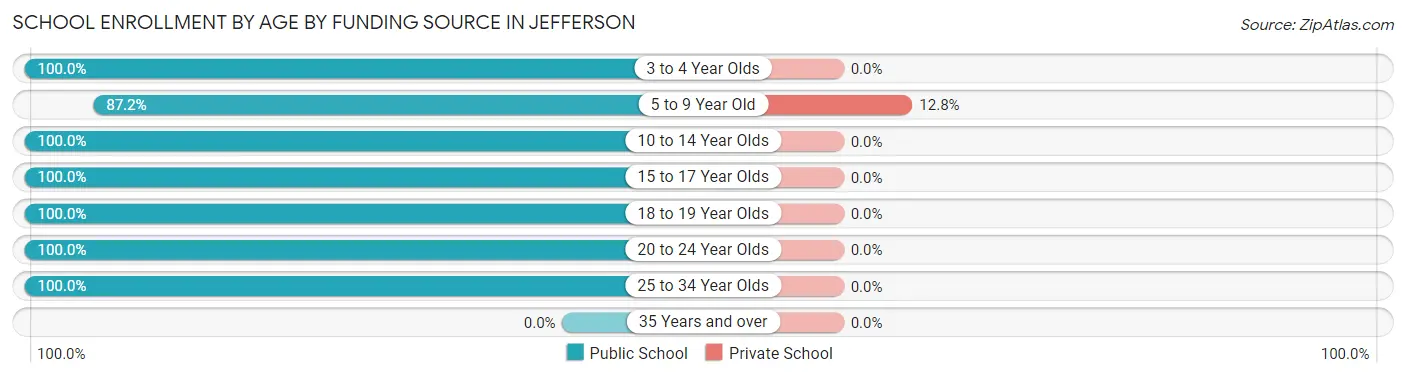
| Age Bracket | Public School | Private School |
| 3 to 4 Year Olds | 19 (100.0%) | 0 (0.0%) |
| 5 to 9 Year Old | 109 (87.2%) | 16 (12.8%) |
| 10 to 14 Year Olds | 110 (100.0%) | 0 (0.0%) |
| 15 to 17 Year Olds | 36 (100.0%) | 0 (0.0%) |
| 18 to 19 Year Olds | 22 (100.0%) | 0 (0.0%) |
| 20 to 24 Year Olds | 8 (100.0%) | 0 (0.0%) |
| 25 to 34 Year Olds | 20 (100.0%) | 0 (0.0%) |
| 35 Years and over | 0 (0.0%) | 0 (0.0%) |
| Total | 324 (95.3%) | 16 (4.7%) |
Educational Attainment by Field of Study in Jefferson
Business (52 | 28.6%), education (40 | 22.0%), arts & humanities (23 | 12.6%), science & technology (14 | 7.7%), and social sciences (13 | 7.1%) are the most common fields of study among 182 individuals in Jefferson who have obtained a bachelor's degree or higher.
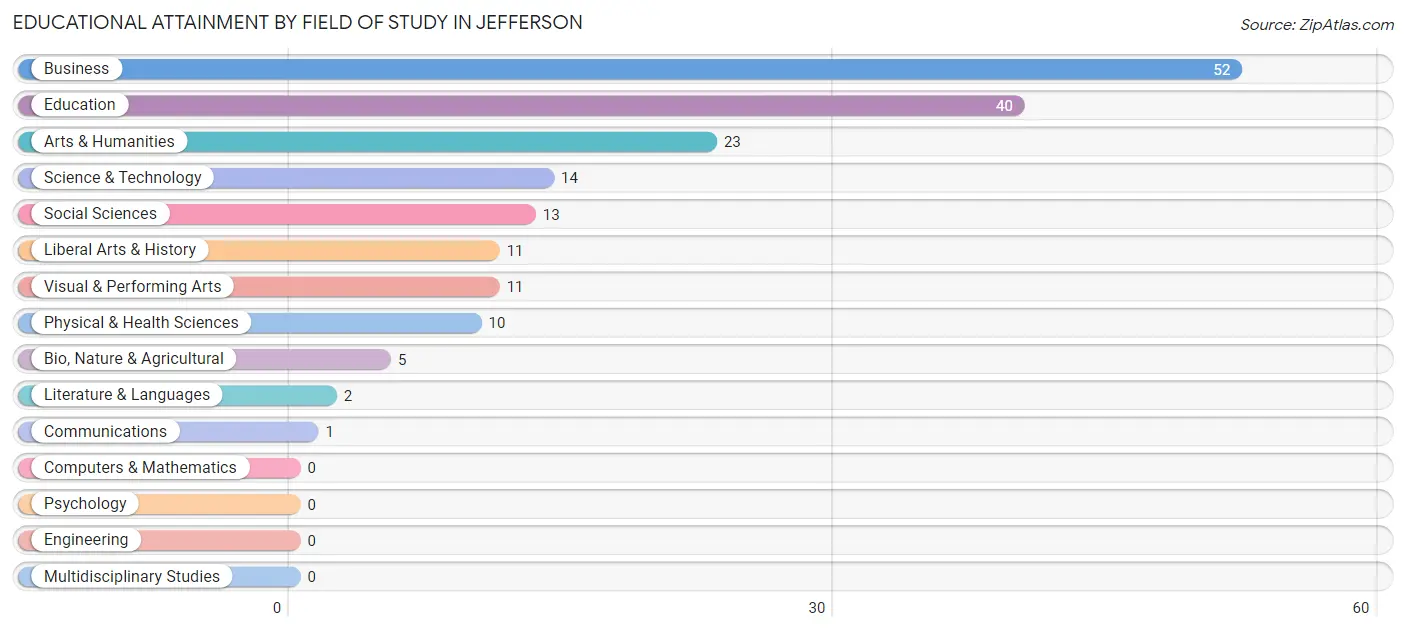
| Field of Study | # Graduates | % Graduates |
| Computers & Mathematics | 0 | 0.0% |
| Bio, Nature & Agricultural | 5 | 2.8% |
| Physical & Health Sciences | 10 | 5.5% |
| Psychology | 0 | 0.0% |
| Social Sciences | 13 | 7.1% |
| Engineering | 0 | 0.0% |
| Multidisciplinary Studies | 0 | 0.0% |
| Science & Technology | 14 | 7.7% |
| Business | 52 | 28.6% |
| Education | 40 | 22.0% |
| Literature & Languages | 2 | 1.1% |
| Liberal Arts & History | 11 | 6.0% |
| Visual & Performing Arts | 11 | 6.0% |
| Communications | 1 | 0.5% |
| Arts & Humanities | 23 | 12.6% |
| Total | 182 | 100.0% |
Transportation & Commute in Jefferson
Vehicle Availability by Sex in Jefferson
The most prevalent vehicle ownership categories in Jefferson are males with 2 vehicles (240, accounting for 61.2%) and females with 2 vehicles (146, making up 71.2%).
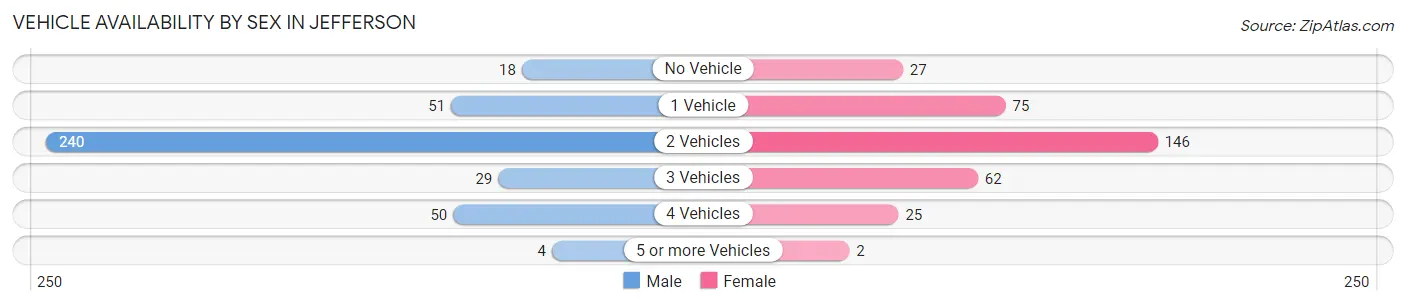
| Vehicles Available | Male | Female |
| No Vehicle | 18 (4.6%) | 27 (8.0%) |
| 1 Vehicle | 51 (13.0%) | 75 (22.3%) |
| 2 Vehicles | 240 (61.2%) | 146 (43.3%) |
| 3 Vehicles | 29 (7.4%) | 62 (18.4%) |
| 4 Vehicles | 50 (12.8%) | 25 (7.4%) |
| 5 or more Vehicles | 4 (1.0%) | 2 (0.6%) |
| Total | 392 (100.0%) | 337 (100.0%) |
Commute Time in Jefferson
The most frequently occuring commute durations in Jefferson are 5 to 9 minutes (245 commuters, 36.0%), 10 to 14 minutes (157 commuters, 23.1%), and 15 to 19 minutes (53 commuters, 7.8%).
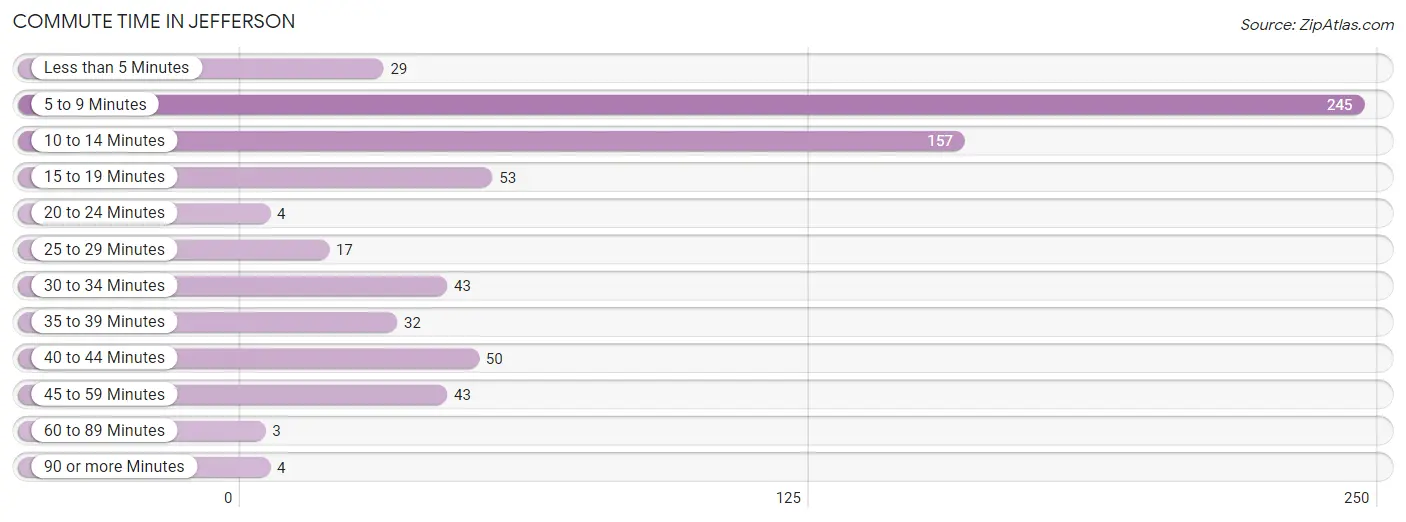
| Commute Time | # Commuters | % Commuters |
| Less than 5 Minutes | 29 | 4.3% |
| 5 to 9 Minutes | 245 | 36.0% |
| 10 to 14 Minutes | 157 | 23.1% |
| 15 to 19 Minutes | 53 | 7.8% |
| 20 to 24 Minutes | 4 | 0.6% |
| 25 to 29 Minutes | 17 | 2.5% |
| 30 to 34 Minutes | 43 | 6.3% |
| 35 to 39 Minutes | 32 | 4.7% |
| 40 to 44 Minutes | 50 | 7.3% |
| 45 to 59 Minutes | 43 | 6.3% |
| 60 to 89 Minutes | 3 | 0.4% |
| 90 or more Minutes | 4 | 0.6% |
Commute Time by Sex in Jefferson
The most common commute times in Jefferson are 10 to 14 minutes (112 commuters, 29.6%) for males and 5 to 9 minutes (151 commuters, 50.0%) for females.
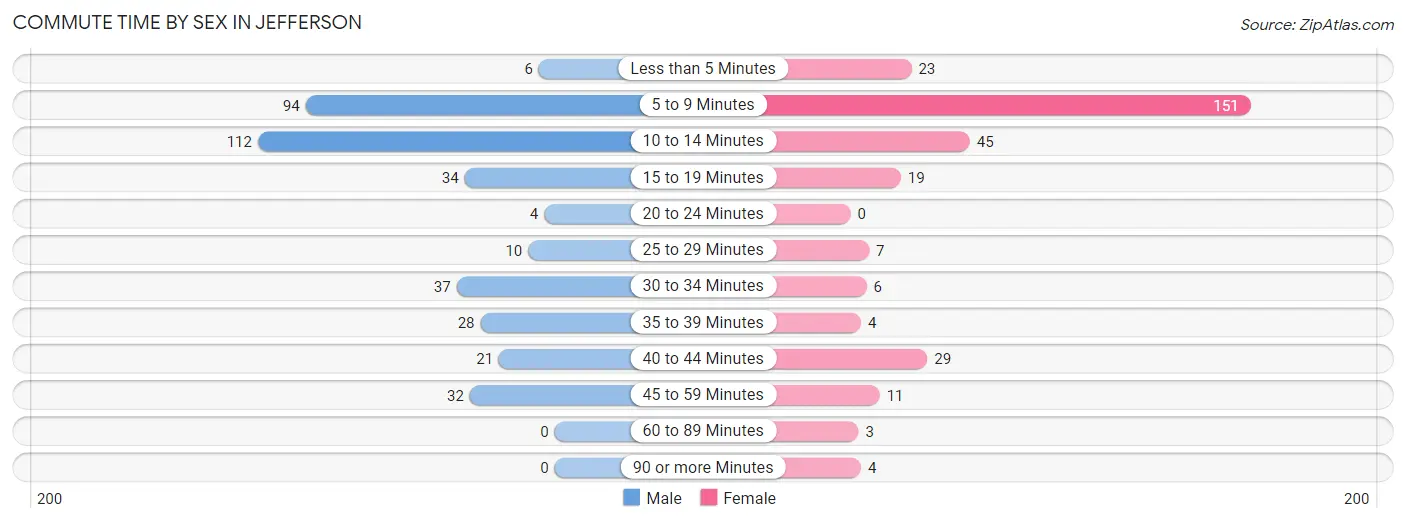
| Commute Time | Male | Female |
| Less than 5 Minutes | 6 (1.6%) | 23 (7.6%) |
| 5 to 9 Minutes | 94 (24.9%) | 151 (50.0%) |
| 10 to 14 Minutes | 112 (29.6%) | 45 (14.9%) |
| 15 to 19 Minutes | 34 (9.0%) | 19 (6.3%) |
| 20 to 24 Minutes | 4 (1.1%) | 0 (0.0%) |
| 25 to 29 Minutes | 10 (2.6%) | 7 (2.3%) |
| 30 to 34 Minutes | 37 (9.8%) | 6 (2.0%) |
| 35 to 39 Minutes | 28 (7.4%) | 4 (1.3%) |
| 40 to 44 Minutes | 21 (5.6%) | 29 (9.6%) |
| 45 to 59 Minutes | 32 (8.5%) | 11 (3.6%) |
| 60 to 89 Minutes | 0 (0.0%) | 3 (1.0%) |
| 90 or more Minutes | 0 (0.0%) | 4 (1.3%) |
Time of Departure to Work by Sex in Jefferson
The most frequent times of departure to work in Jefferson are 12:00 PM to 3:59 PM (100, 26.5%) for males and 8:00 AM to 8:29 AM (91, 30.1%) for females.
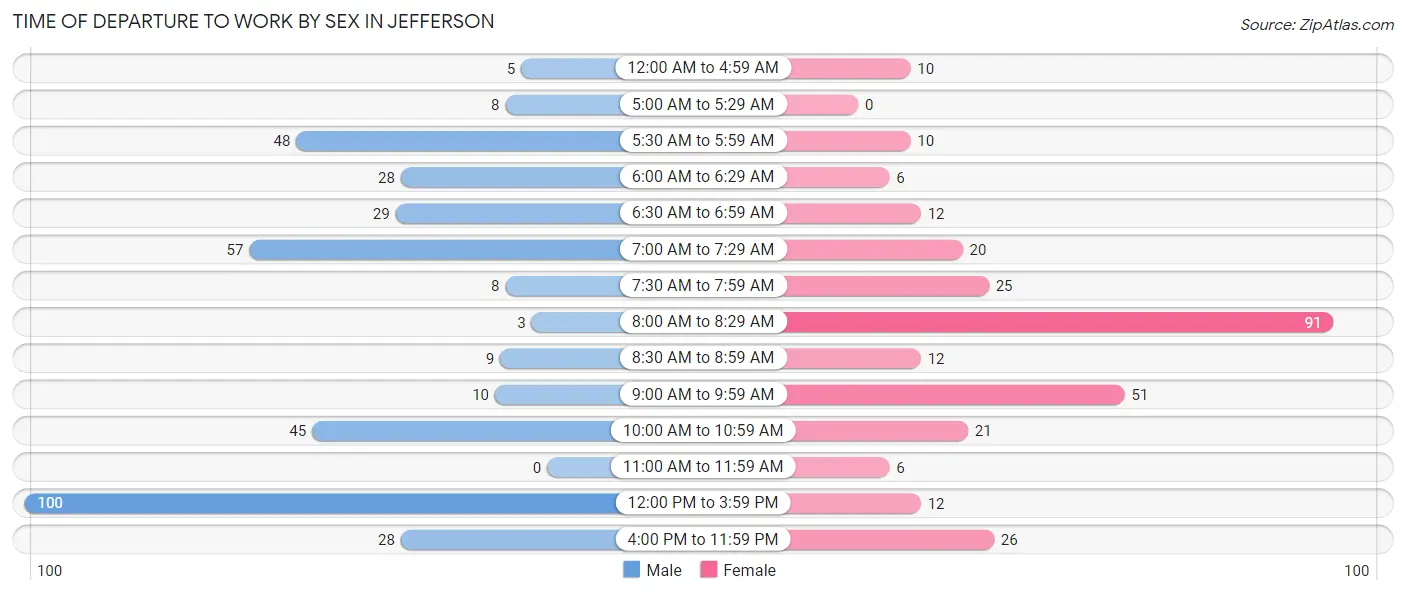
| Time of Departure | Male | Female |
| 12:00 AM to 4:59 AM | 5 (1.3%) | 10 (3.3%) |
| 5:00 AM to 5:29 AM | 8 (2.1%) | 0 (0.0%) |
| 5:30 AM to 5:59 AM | 48 (12.7%) | 10 (3.3%) |
| 6:00 AM to 6:29 AM | 28 (7.4%) | 6 (2.0%) |
| 6:30 AM to 6:59 AM | 29 (7.7%) | 12 (4.0%) |
| 7:00 AM to 7:29 AM | 57 (15.1%) | 20 (6.6%) |
| 7:30 AM to 7:59 AM | 8 (2.1%) | 25 (8.3%) |
| 8:00 AM to 8:29 AM | 3 (0.8%) | 91 (30.1%) |
| 8:30 AM to 8:59 AM | 9 (2.4%) | 12 (4.0%) |
| 9:00 AM to 9:59 AM | 10 (2.6%) | 51 (16.9%) |
| 10:00 AM to 10:59 AM | 45 (11.9%) | 21 (7.0%) |
| 11:00 AM to 11:59 AM | 0 (0.0%) | 6 (2.0%) |
| 12:00 PM to 3:59 PM | 100 (26.5%) | 12 (4.0%) |
| 4:00 PM to 11:59 PM | 28 (7.4%) | 26 (8.6%) |
| Total | 378 (100.0%) | 302 (100.0%) |
Housing Occupancy in Jefferson
Occupancy by Ownership in Jefferson
Of the total 754 dwellings in Jefferson, owner-occupied units account for 360 (47.7%), while renter-occupied units make up 394 (52.2%).
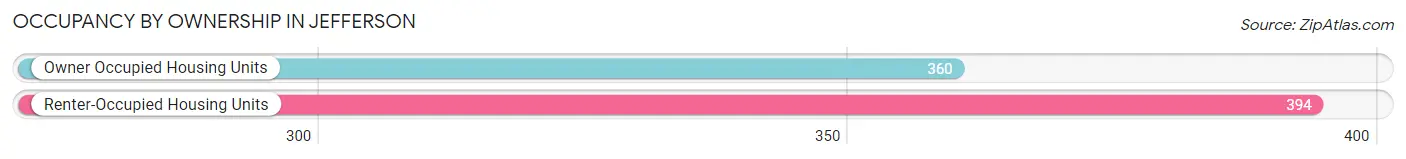
| Occupancy | # Housing Units | % Housing Units |
| Owner Occupied Housing Units | 360 | 47.7% |
| Renter-Occupied Housing Units | 394 | 52.2% |
| Total Occupied Housing Units | 754 | 100.0% |
Occupancy by Household Size in Jefferson
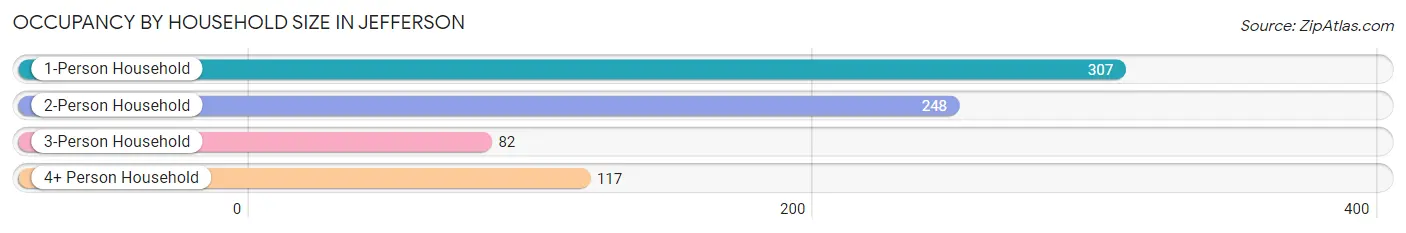
| Household Size | # Housing Units | % Housing Units |
| 1-Person Household | 307 | 40.7% |
| 2-Person Household | 248 | 32.9% |
| 3-Person Household | 82 | 10.9% |
| 4+ Person Household | 117 | 15.5% |
| Total Housing Units | 754 | 100.0% |
Occupancy by Ownership by Household Size in Jefferson
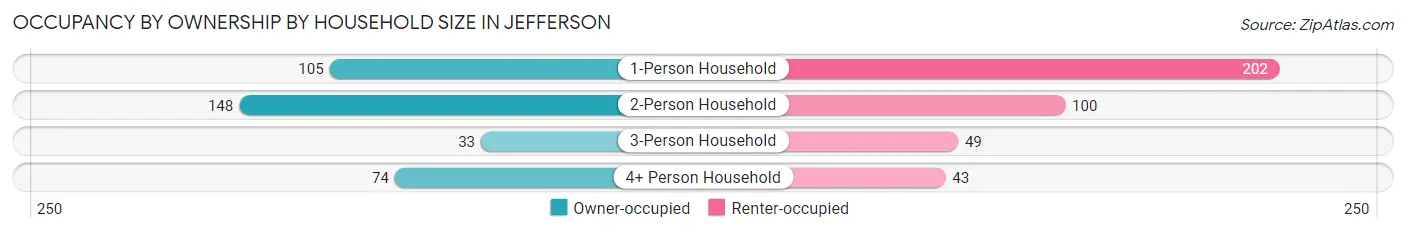
| Household Size | Owner-occupied | Renter-occupied |
| 1-Person Household | 105 (34.2%) | 202 (65.8%) |
| 2-Person Household | 148 (59.7%) | 100 (40.3%) |
| 3-Person Household | 33 (40.2%) | 49 (59.8%) |
| 4+ Person Household | 74 (63.2%) | 43 (36.7%) |
| Total Housing Units | 360 (47.7%) | 394 (52.2%) |
Occupancy by Educational Attainment in Jefferson
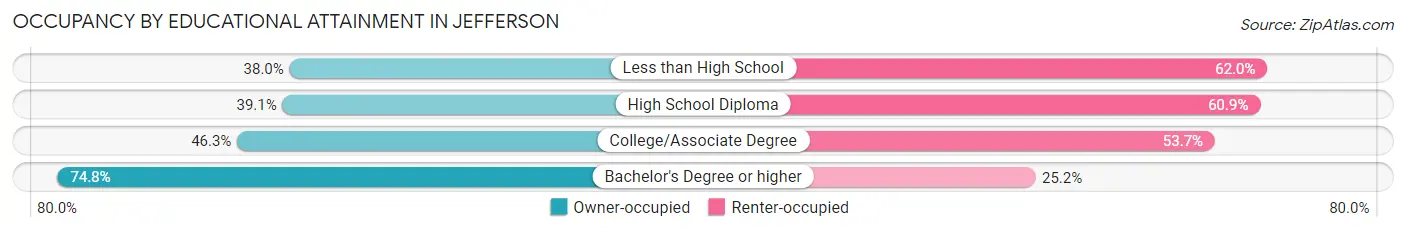
| Household Size | Owner-occupied | Renter-occupied |
| Less than High School | 30 (38.0%) | 49 (62.0%) |
| High School Diploma | 95 (39.1%) | 148 (60.9%) |
| College/Associate Degree | 143 (46.3%) | 166 (53.7%) |
| Bachelor's Degree or higher | 92 (74.8%) | 31 (25.2%) |
Occupancy by Age of Householder in Jefferson
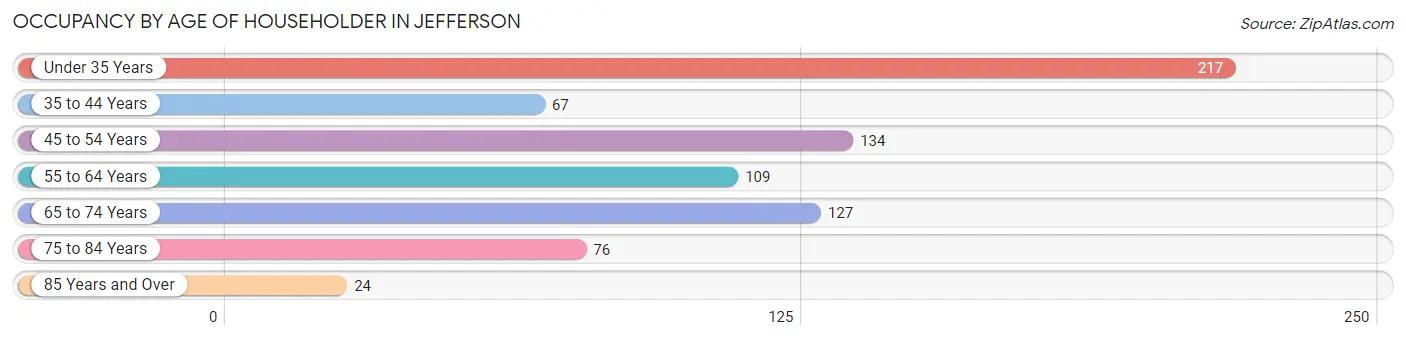
| Age Bracket | # Households | % Households |
| Under 35 Years | 217 | 28.8% |
| 35 to 44 Years | 67 | 8.9% |
| 45 to 54 Years | 134 | 17.8% |
| 55 to 64 Years | 109 | 14.5% |
| 65 to 74 Years | 127 | 16.8% |
| 75 to 84 Years | 76 | 10.1% |
| 85 Years and Over | 24 | 3.2% |
| Total | 754 | 100.0% |
Housing Finances in Jefferson
Median Income by Occupancy in Jefferson
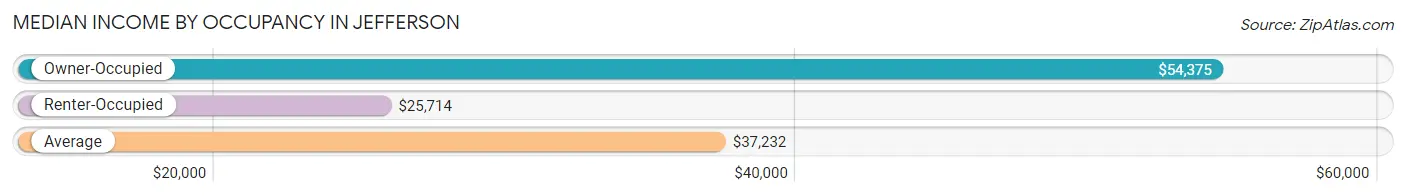
| Occupancy Type | # Households | Median Income |
| Owner-Occupied | 360 (47.7%) | $54,375 |
| Renter-Occupied | 394 (52.2%) | $25,714 |
| Average | 754 (100.0%) | $37,232 |
Occupancy by Householder Income Bracket in Jefferson
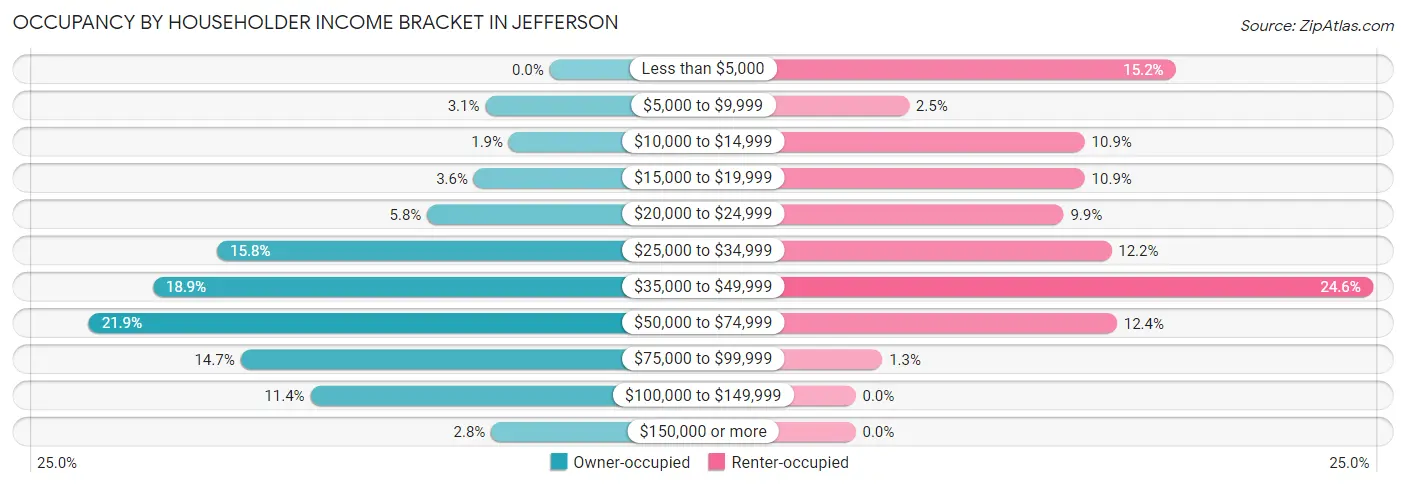
| Income Bracket | Owner-occupied | Renter-occupied |
| Less than $5,000 | 0 (0.0%) | 60 (15.2%) |
| $5,000 to $9,999 | 11 (3.1%) | 10 (2.5%) |
| $10,000 to $14,999 | 7 (1.9%) | 43 (10.9%) |
| $15,000 to $19,999 | 13 (3.6%) | 43 (10.9%) |
| $20,000 to $24,999 | 21 (5.8%) | 39 (9.9%) |
| $25,000 to $34,999 | 57 (15.8%) | 48 (12.2%) |
| $35,000 to $49,999 | 68 (18.9%) | 97 (24.6%) |
| $50,000 to $74,999 | 79 (21.9%) | 49 (12.4%) |
| $75,000 to $99,999 | 53 (14.7%) | 5 (1.3%) |
| $100,000 to $149,999 | 41 (11.4%) | 0 (0.0%) |
| $150,000 or more | 10 (2.8%) | 0 (0.0%) |
| Total | 360 (100.0%) | 394 (100.0%) |
Monthly Housing Cost Tiers in Jefferson
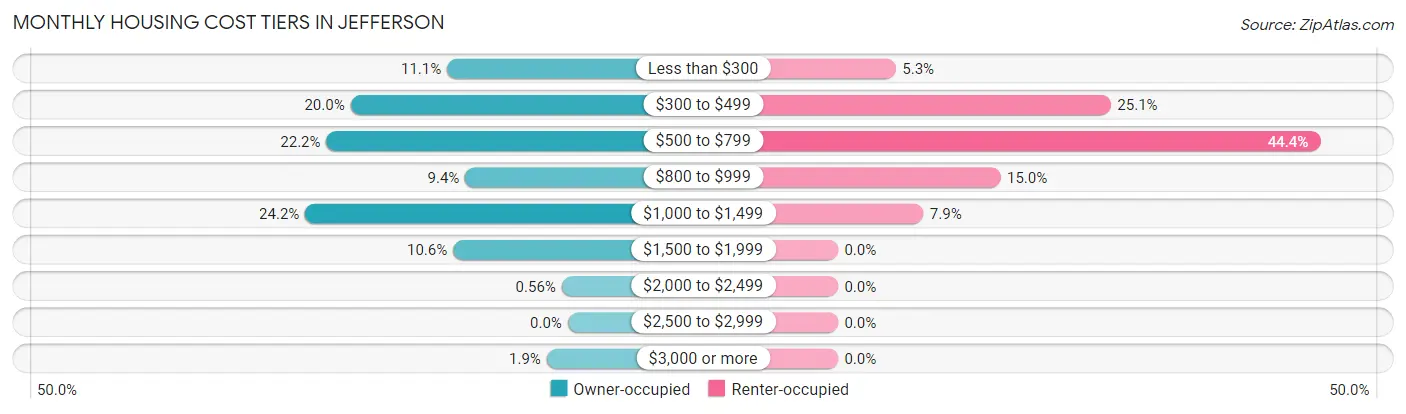
| Monthly Cost | Owner-occupied | Renter-occupied |
| Less than $300 | 40 (11.1%) | 21 (5.3%) |
| $300 to $499 | 72 (20.0%) | 99 (25.1%) |
| $500 to $799 | 80 (22.2%) | 175 (44.4%) |
| $800 to $999 | 34 (9.4%) | 59 (15.0%) |
| $1,000 to $1,499 | 87 (24.2%) | 31 (7.9%) |
| $1,500 to $1,999 | 38 (10.6%) | 0 (0.0%) |
| $2,000 to $2,499 | 2 (0.6%) | 0 (0.0%) |
| $2,500 to $2,999 | 0 (0.0%) | 0 (0.0%) |
| $3,000 or more | 7 (1.9%) | 0 (0.0%) |
| Total | 360 (100.0%) | 394 (100.0%) |
Physical Housing Characteristics in Jefferson
Housing Structures in Jefferson
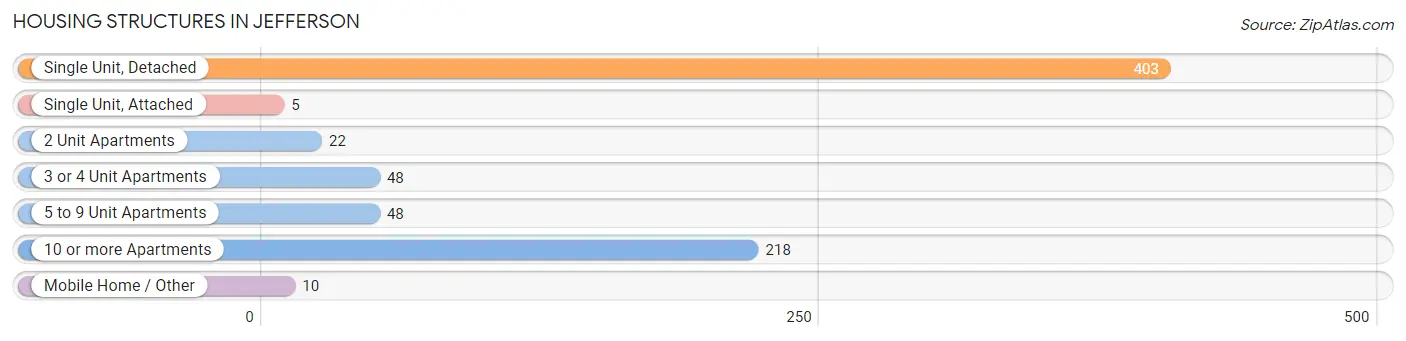
| Structure Type | # Housing Units | % Housing Units |
| Single Unit, Detached | 403 | 53.4% |
| Single Unit, Attached | 5 | 0.7% |
| 2 Unit Apartments | 22 | 2.9% |
| 3 or 4 Unit Apartments | 48 | 6.4% |
| 5 to 9 Unit Apartments | 48 | 6.4% |
| 10 or more Apartments | 218 | 28.9% |
| Mobile Home / Other | 10 | 1.3% |
| Total | 754 | 100.0% |
Housing Structures by Occupancy in Jefferson
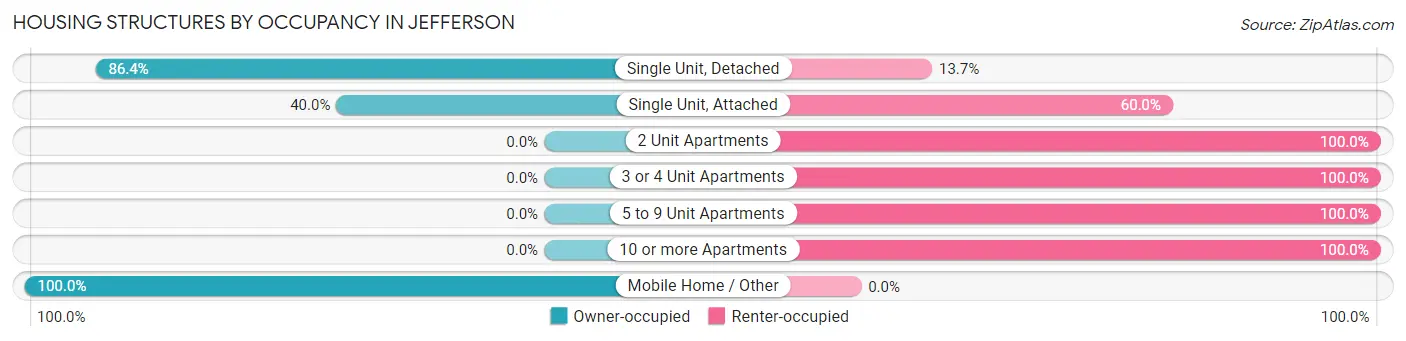
| Structure Type | Owner-occupied | Renter-occupied |
| Single Unit, Detached | 348 (86.4%) | 55 (13.7%) |
| Single Unit, Attached | 2 (40.0%) | 3 (60.0%) |
| 2 Unit Apartments | 0 (0.0%) | 22 (100.0%) |
| 3 or 4 Unit Apartments | 0 (0.0%) | 48 (100.0%) |
| 5 to 9 Unit Apartments | 0 (0.0%) | 48 (100.0%) |
| 10 or more Apartments | 0 (0.0%) | 218 (100.0%) |
| Mobile Home / Other | 10 (100.0%) | 0 (0.0%) |
| Total | 360 (47.7%) | 394 (52.2%) |
Housing Structures by Number of Rooms in Jefferson
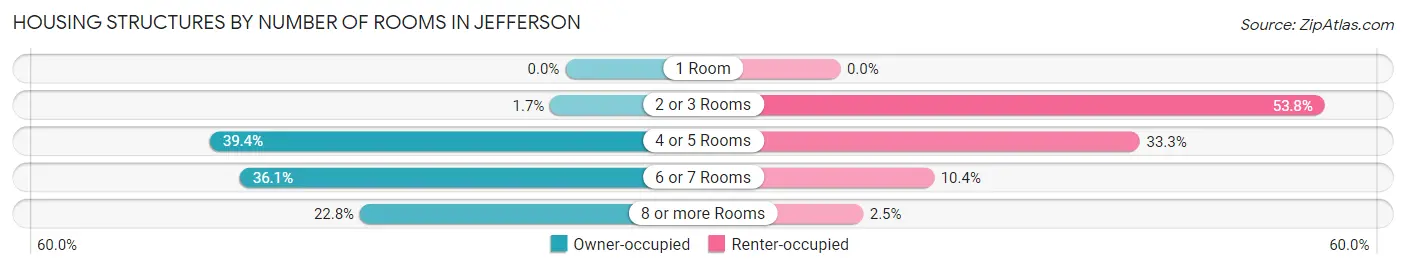
| Number of Rooms | Owner-occupied | Renter-occupied |
| 1 Room | 0 (0.0%) | 0 (0.0%) |
| 2 or 3 Rooms | 6 (1.7%) | 212 (53.8%) |
| 4 or 5 Rooms | 142 (39.4%) | 131 (33.3%) |
| 6 or 7 Rooms | 130 (36.1%) | 41 (10.4%) |
| 8 or more Rooms | 82 (22.8%) | 10 (2.5%) |
| Total | 360 (100.0%) | 394 (100.0%) |
Housing Structure by Heating Type in Jefferson
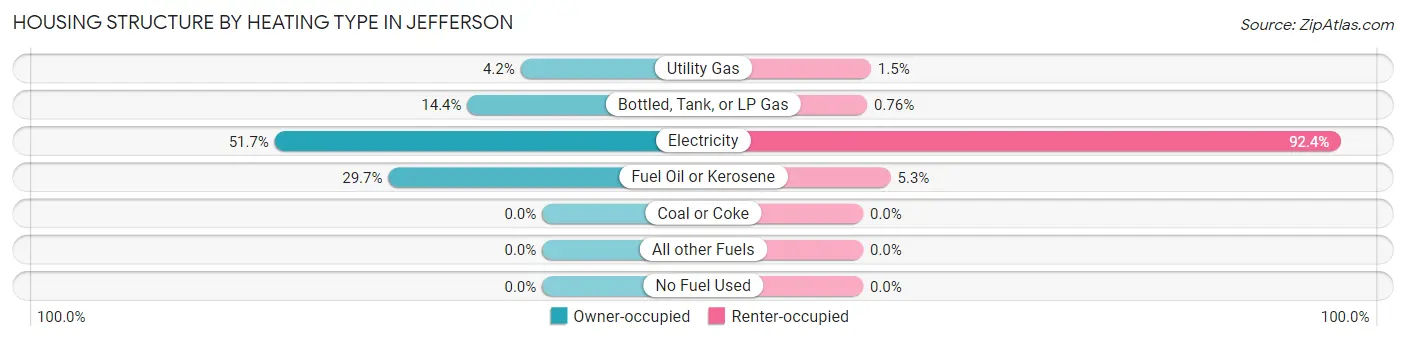
| Heating Type | Owner-occupied | Renter-occupied |
| Utility Gas | 15 (4.2%) | 6 (1.5%) |
| Bottled, Tank, or LP Gas | 52 (14.4%) | 3 (0.8%) |
| Electricity | 186 (51.7%) | 364 (92.4%) |
| Fuel Oil or Kerosene | 107 (29.7%) | 21 (5.3%) |
| Coal or Coke | 0 (0.0%) | 0 (0.0%) |
| All other Fuels | 0 (0.0%) | 0 (0.0%) |
| No Fuel Used | 0 (0.0%) | 0 (0.0%) |
| Total | 360 (100.0%) | 394 (100.0%) |
Household Vehicle Usage in Jefferson
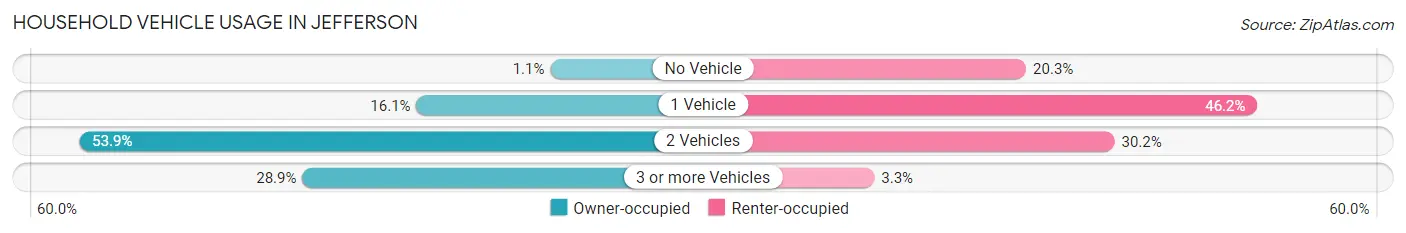
| Vehicles per Household | Owner-occupied | Renter-occupied |
| No Vehicle | 4 (1.1%) | 80 (20.3%) |
| 1 Vehicle | 58 (16.1%) | 182 (46.2%) |
| 2 Vehicles | 194 (53.9%) | 119 (30.2%) |
| 3 or more Vehicles | 104 (28.9%) | 13 (3.3%) |
| Total | 360 (100.0%) | 394 (100.0%) |
Real Estate & Mortgages in Jefferson
Real Estate and Mortgage Overview in Jefferson
| Characteristic | Without Mortgage | With Mortgage |
| Housing Units | 174 | 186 |
| Median Property Value | $208,300 | $165,700 |
| Median Household Income | $46,522 | $10 |
| Monthly Housing Costs | $462 | $7 |
| Real Estate Taxes | $1,389 | $0 |
Property Value by Mortgage Status in Jefferson
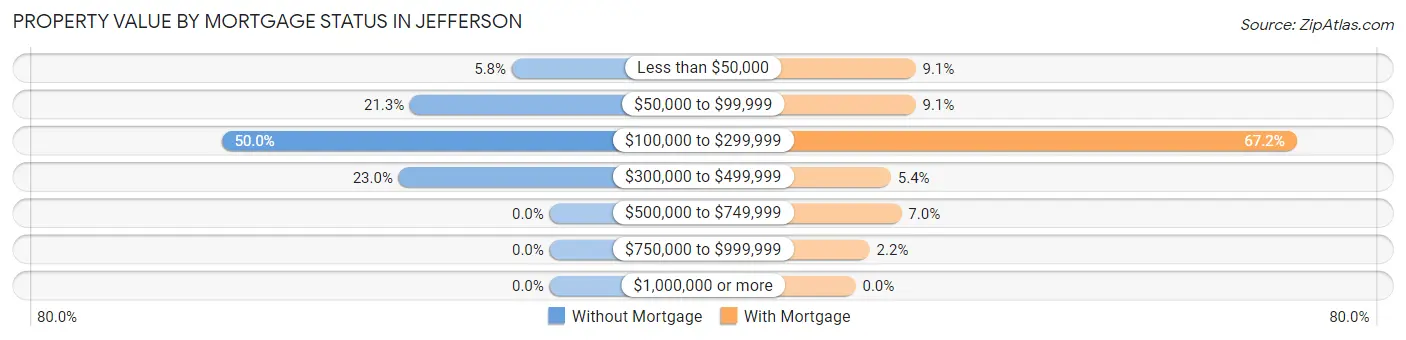
| Property Value | Without Mortgage | With Mortgage |
| Less than $50,000 | 10 (5.8%) | 17 (9.1%) |
| $50,000 to $99,999 | 37 (21.3%) | 17 (9.1%) |
| $100,000 to $299,999 | 87 (50.0%) | 125 (67.2%) |
| $300,000 to $499,999 | 40 (23.0%) | 10 (5.4%) |
| $500,000 to $749,999 | 0 (0.0%) | 13 (7.0%) |
| $750,000 to $999,999 | 0 (0.0%) | 4 (2.1%) |
| $1,000,000 or more | 0 (0.0%) | 0 (0.0%) |
| Total | 174 (100.0%) | 186 (100.0%) |
Household Income by Mortgage Status in Jefferson
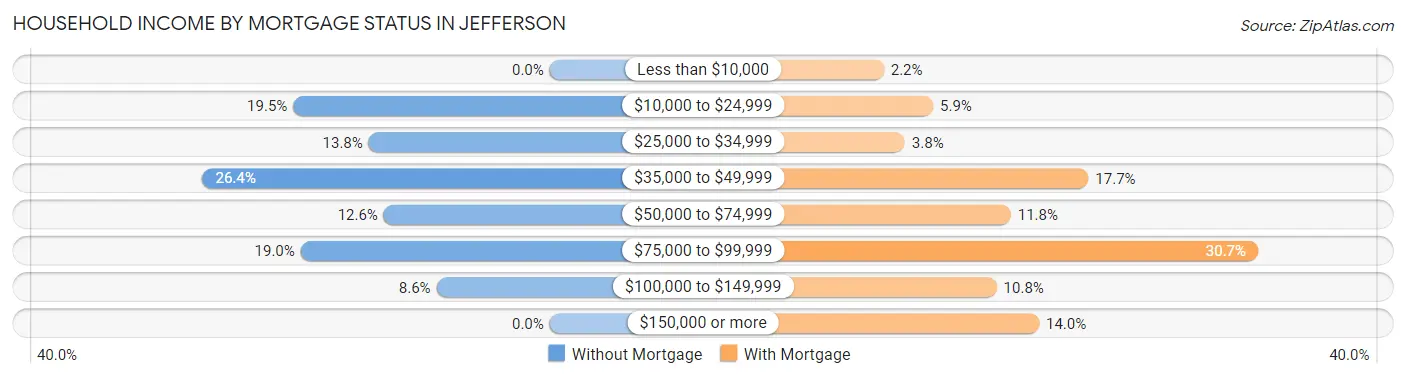
| Household Income | Without Mortgage | With Mortgage |
| Less than $10,000 | 0 (0.0%) | 4 (2.1%) |
| $10,000 to $24,999 | 34 (19.5%) | 11 (5.9%) |
| $25,000 to $34,999 | 24 (13.8%) | 7 (3.8%) |
| $35,000 to $49,999 | 46 (26.4%) | 33 (17.7%) |
| $50,000 to $74,999 | 22 (12.6%) | 22 (11.8%) |
| $75,000 to $99,999 | 33 (19.0%) | 57 (30.6%) |
| $100,000 to $149,999 | 15 (8.6%) | 20 (10.7%) |
| $150,000 or more | 0 (0.0%) | 26 (14.0%) |
| Total | 174 (100.0%) | 186 (100.0%) |
Property Value to Household Income Ratio in Jefferson
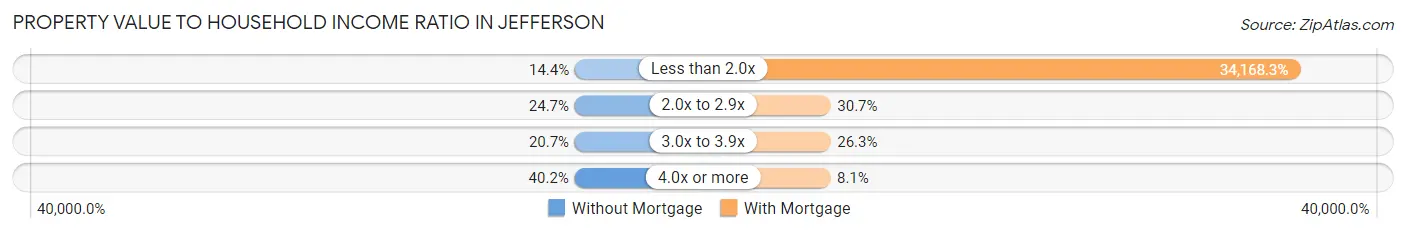
| Value-to-Income Ratio | Without Mortgage | With Mortgage |
| Less than 2.0x | 25 (14.4%) | 63,553 (34,168.3%) |
| 2.0x to 2.9x | 43 (24.7%) | 57 (30.6%) |
| 3.0x to 3.9x | 36 (20.7%) | 49 (26.3%) |
| 4.0x or more | 70 (40.2%) | 15 (8.1%) |
| Total | 174 (100.0%) | 186 (100.0%) |
Real Estate Taxes by Mortgage Status in Jefferson
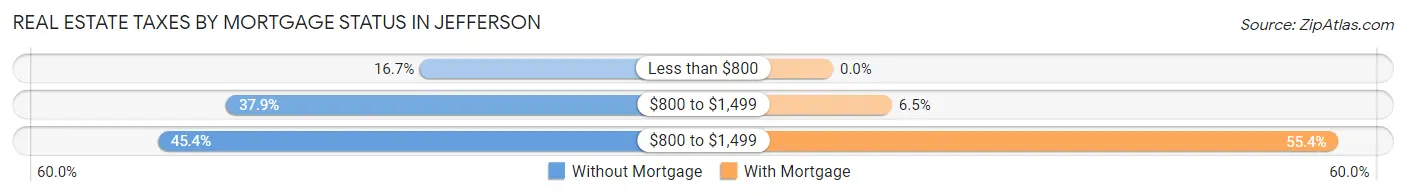
| Property Taxes | Without Mortgage | With Mortgage |
| Less than $800 | 29 (16.7%) | 0 (0.0%) |
| $800 to $1,499 | 66 (37.9%) | 12 (6.5%) |
| $800 to $1,499 | 79 (45.4%) | 103 (55.4%) |
| Total | 174 (100.0%) | 186 (100.0%) |
Health & Disability in Jefferson
Health Insurance Coverage by Age in Jefferson
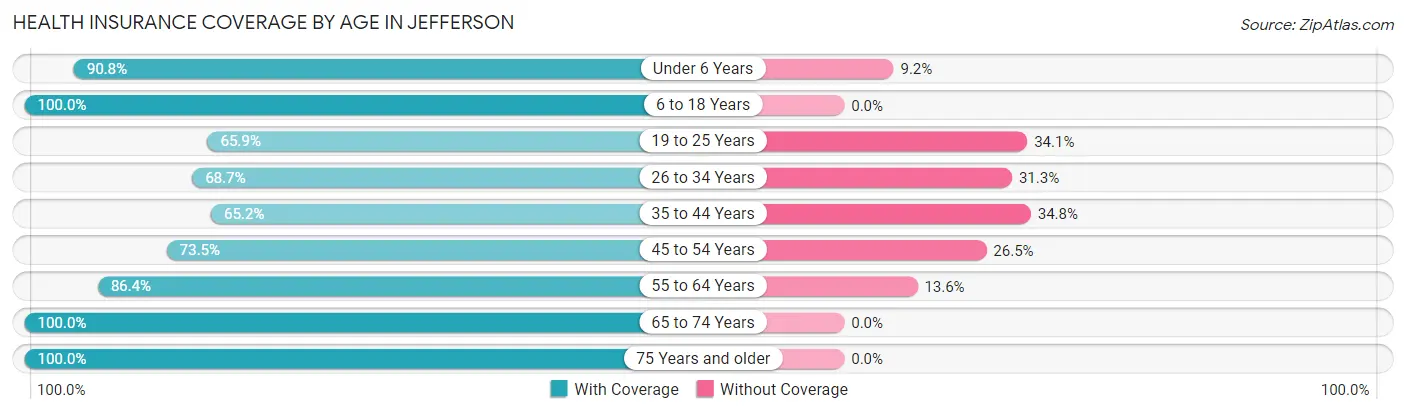
| Age Bracket | With Coverage | Without Coverage |
| Under 6 Years | 89 (90.8%) | 9 (9.2%) |
| 6 to 18 Years | 282 (100.0%) | 0 (0.0%) |
| 19 to 25 Years | 56 (65.9%) | 29 (34.1%) |
| 26 to 34 Years | 189 (68.7%) | 86 (31.3%) |
| 35 to 44 Years | 90 (65.2%) | 48 (34.8%) |
| 45 to 54 Years | 172 (73.5%) | 62 (26.5%) |
| 55 to 64 Years | 152 (86.4%) | 24 (13.6%) |
| 65 to 74 Years | 229 (100.0%) | 0 (0.0%) |
| 75 Years and older | 135 (100.0%) | 0 (0.0%) |
| Total | 1,394 (84.4%) | 258 (15.6%) |
Health Insurance Coverage by Citizenship Status in Jefferson
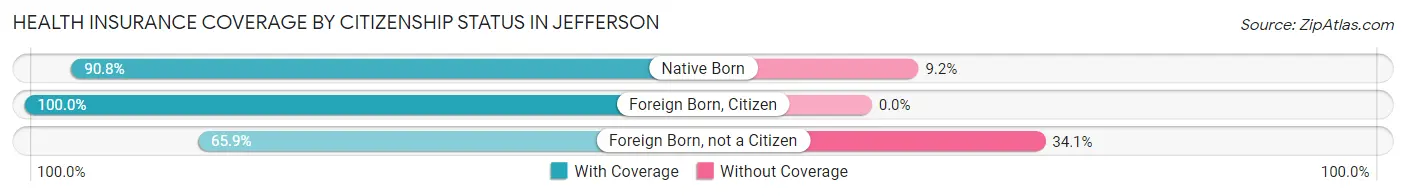
| Citizenship Status | With Coverage | Without Coverage |
| Native Born | 89 (90.8%) | 9 (9.2%) |
| Foreign Born, Citizen | 282 (100.0%) | 0 (0.0%) |
| Foreign Born, not a Citizen | 56 (65.9%) | 29 (34.1%) |
Health Insurance Coverage by Household Income in Jefferson
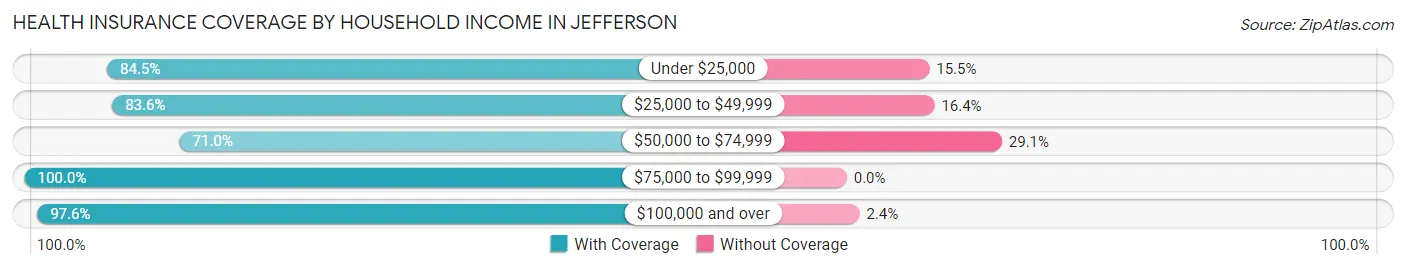
| Household Income | With Coverage | Without Coverage |
| Under $25,000 | 339 (84.5%) | 62 (15.5%) |
| $25,000 to $49,999 | 443 (83.6%) | 87 (16.4%) |
| $50,000 to $74,999 | 254 (71.0%) | 104 (29.0%) |
| $75,000 to $99,999 | 143 (100.0%) | 0 (0.0%) |
| $100,000 and over | 206 (97.6%) | 5 (2.4%) |
Public vs Private Health Insurance Coverage by Age in Jefferson
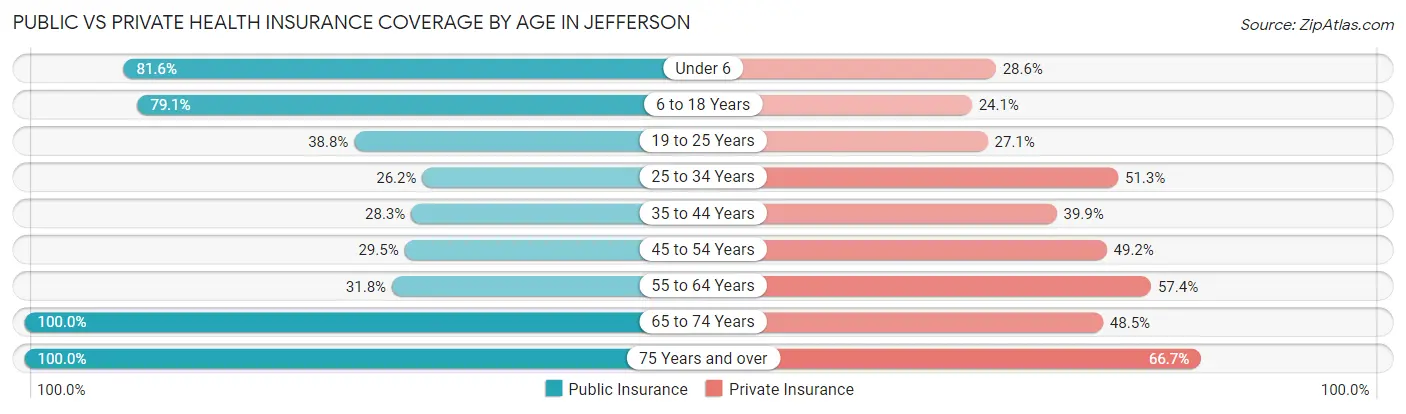
| Age Bracket | Public Insurance | Private Insurance |
| Under 6 | 80 (81.6%) | 28 (28.6%) |
| 6 to 18 Years | 223 (79.1%) | 68 (24.1%) |
| 19 to 25 Years | 33 (38.8%) | 23 (27.1%) |
| 25 to 34 Years | 72 (26.2%) | 141 (51.3%) |
| 35 to 44 Years | 39 (28.3%) | 55 (39.9%) |
| 45 to 54 Years | 69 (29.5%) | 115 (49.1%) |
| 55 to 64 Years | 56 (31.8%) | 101 (57.4%) |
| 65 to 74 Years | 229 (100.0%) | 111 (48.5%) |
| 75 Years and over | 135 (100.0%) | 90 (66.7%) |
| Total | 936 (56.7%) | 732 (44.3%) |
Disability Status by Sex by Age in Jefferson
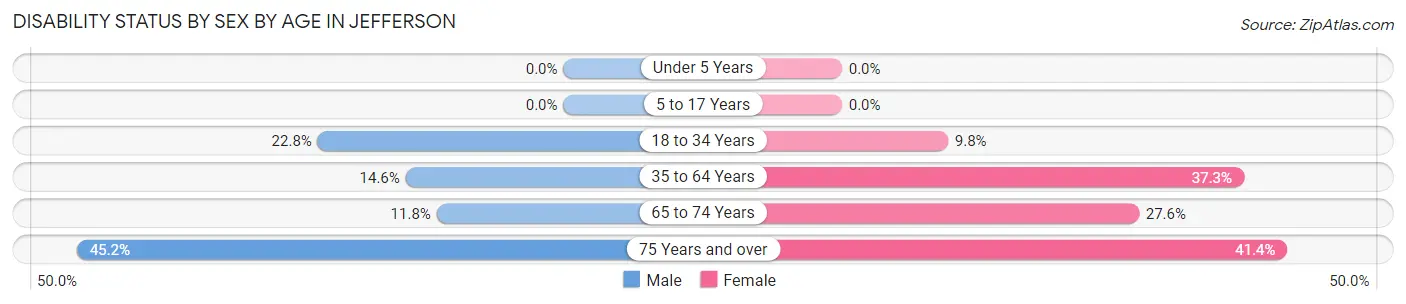
| Age Bracket | Male | Female |
| Under 5 Years | 0 (0.0%) | 0 (0.0%) |
| 5 to 17 Years | 0 (0.0%) | 0 (0.0%) |
| 18 to 34 Years | 44 (22.8%) | 19 (9.8%) |
| 35 to 64 Years | 41 (14.6%) | 100 (37.3%) |
| 65 to 74 Years | 12 (11.8%) | 35 (27.6%) |
| 75 Years and over | 14 (45.2%) | 43 (41.3%) |
Disability Class by Sex by Age in Jefferson
Disability Class: Hearing Difficulty
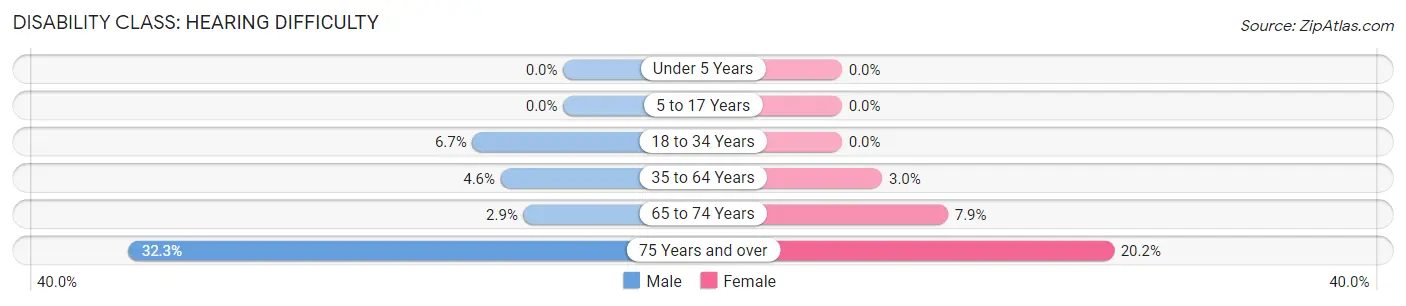
| Age Bracket | Male | Female |
| Under 5 Years | 0 (0.0%) | 0 (0.0%) |
| 5 to 17 Years | 0 (0.0%) | 0 (0.0%) |
| 18 to 34 Years | 13 (6.7%) | 0 (0.0%) |
| 35 to 64 Years | 13 (4.6%) | 8 (3.0%) |
| 65 to 74 Years | 3 (2.9%) | 10 (7.9%) |
| 75 Years and over | 10 (32.3%) | 21 (20.2%) |
Disability Class: Vision Difficulty
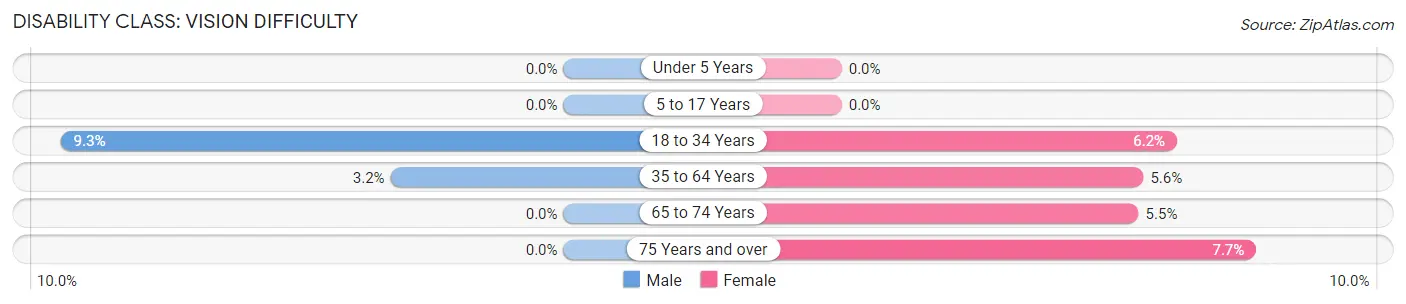
| Age Bracket | Male | Female |
| Under 5 Years | 0 (0.0%) | 0 (0.0%) |
| 5 to 17 Years | 0 (0.0%) | 0 (0.0%) |
| 18 to 34 Years | 18 (9.3%) | 12 (6.2%) |
| 35 to 64 Years | 9 (3.2%) | 15 (5.6%) |
| 65 to 74 Years | 0 (0.0%) | 7 (5.5%) |
| 75 Years and over | 0 (0.0%) | 8 (7.7%) |
Disability Class: Cognitive Difficulty
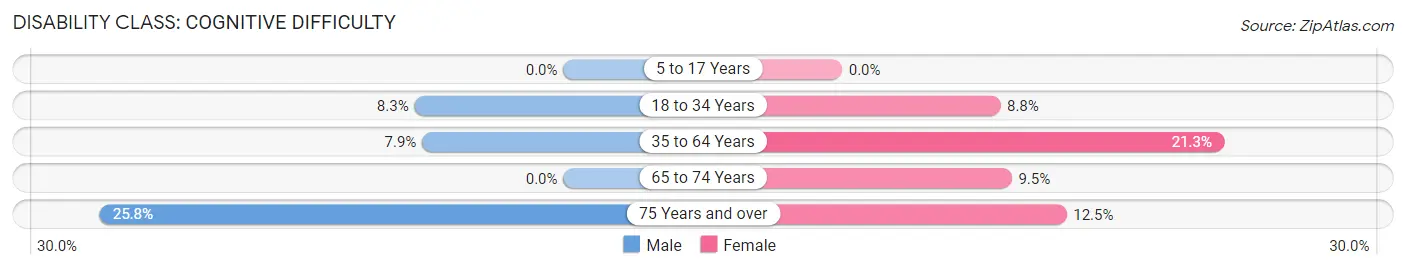
| Age Bracket | Male | Female |
| 5 to 17 Years | 0 (0.0%) | 0 (0.0%) |
| 18 to 34 Years | 16 (8.3%) | 17 (8.8%) |
| 35 to 64 Years | 22 (7.9%) | 57 (21.3%) |
| 65 to 74 Years | 0 (0.0%) | 12 (9.5%) |
| 75 Years and over | 8 (25.8%) | 13 (12.5%) |
Disability Class: Ambulatory Difficulty
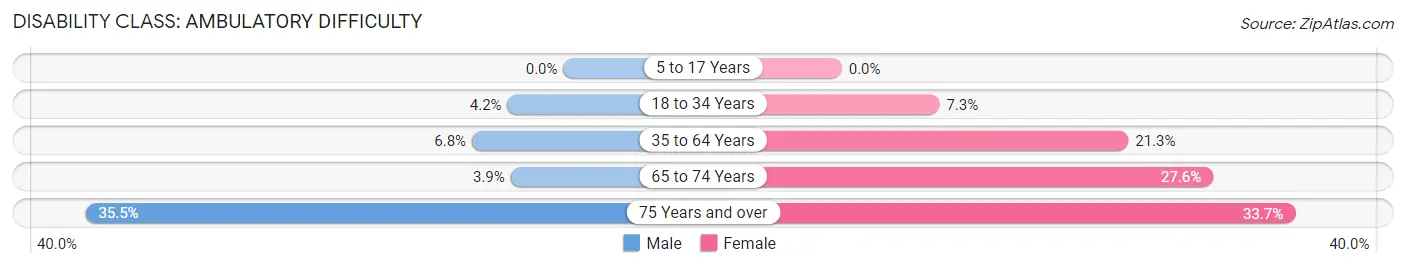
| Age Bracket | Male | Female |
| 5 to 17 Years | 0 (0.0%) | 0 (0.0%) |
| 18 to 34 Years | 8 (4.2%) | 14 (7.2%) |
| 35 to 64 Years | 19 (6.8%) | 57 (21.3%) |
| 65 to 74 Years | 4 (3.9%) | 35 (27.6%) |
| 75 Years and over | 11 (35.5%) | 35 (33.7%) |
Disability Class: Self-Care Difficulty
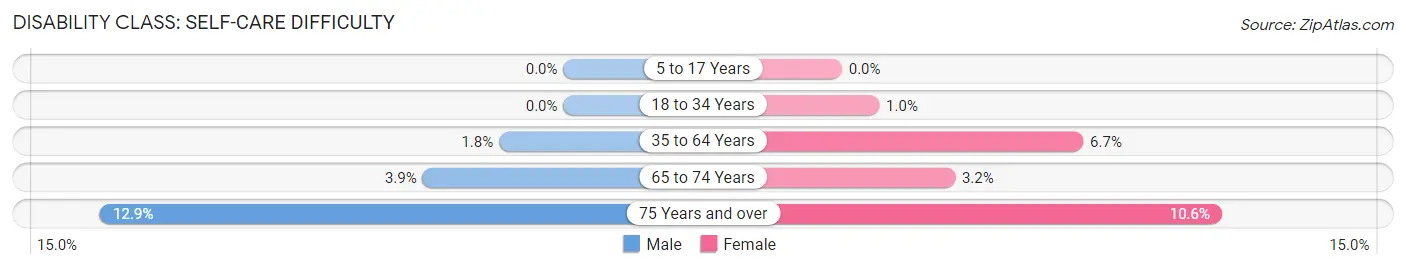
| Age Bracket | Male | Female |
| 5 to 17 Years | 0 (0.0%) | 0 (0.0%) |
| 18 to 34 Years | 0 (0.0%) | 2 (1.0%) |
| 35 to 64 Years | 5 (1.8%) | 18 (6.7%) |
| 65 to 74 Years | 4 (3.9%) | 4 (3.2%) |
| 75 Years and over | 4 (12.9%) | 11 (10.6%) |
Technology Access in Jefferson
Computing Device Access in Jefferson
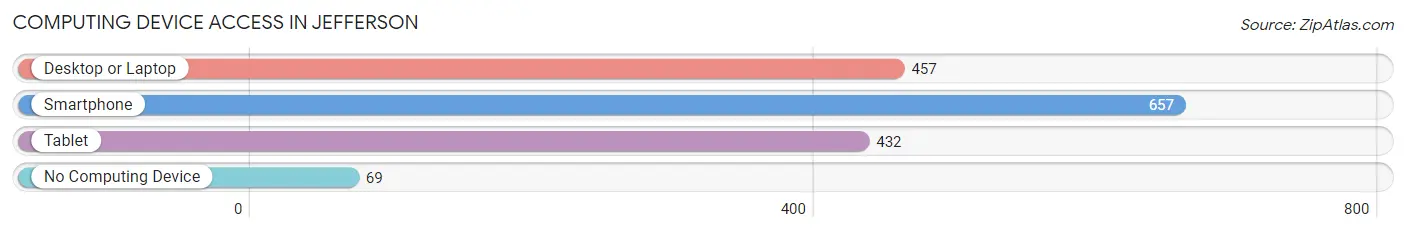
| Device Type | # Households | % Households |
| Desktop or Laptop | 457 | 60.6% |
| Smartphone | 657 | 87.1% |
| Tablet | 432 | 57.3% |
| No Computing Device | 69 | 9.1% |
| Total | 754 | 100.0% |
Internet Access in Jefferson
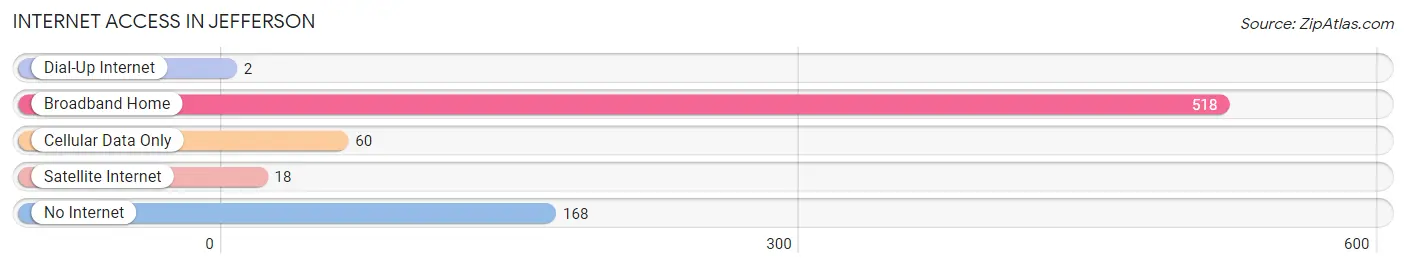
| Internet Type | # Households | % Households |
| Dial-Up Internet | 2 | 0.3% |
| Broadband Home | 518 | 68.7% |
| Cellular Data Only | 60 | 8.0% |
| Satellite Internet | 18 | 2.4% |
| No Internet | 168 | 22.3% |
| Total | 754 | 100.0% |
Jefferson Summary
Jefferson, NC is a small town located in Ashe County, North Carolina. It is situated in the Appalachian Mountains and is part of the Blue Ridge Mountains. The town is located on the banks of the New River and is surrounded by the beautiful Blue Ridge Mountains. The town is known for its rich history, stunning scenery, and friendly people.
Geography
Jefferson, NC is located in the Appalachian Mountains of North Carolina. It is situated in the Blue Ridge Mountains and is surrounded by the beautiful New River. The town is located at an elevation of 1,890 feet and has a total area of 1.2 square miles. The town is located in the foothills of the Blue Ridge Mountains and is surrounded by lush forests and rolling hills. The town is located in the Appalachian Highlands and is part of the Appalachian Trail.
The climate in Jefferson, NC is mild and humid. The average temperature in the summer is around 75 degrees Fahrenheit and the average temperature in the winter is around 40 degrees Fahrenheit. The town receives an average of 45 inches of rain per year and an average of 10 inches of snow per year.
Economy
The economy of Jefferson, NC is largely based on tourism. The town is known for its stunning scenery and friendly people. The town is home to several tourist attractions, including the Ashe County Cheese Factory, the Ashe County Historical Museum, and the Ashe County Arts Council. The town is also home to several wineries and breweries.
The town is also home to several small businesses, including restaurants, retail stores, and service providers. The town is also home to several manufacturing companies, including furniture makers, woodworkers, and metal fabricators.
Demographics
As of the 2010 census, the population of Jefferson, NC was 1,890. The population is largely white, with a small percentage of African Americans and Hispanics. The median age of the population is 44.7 years. The median household income is $35,000 and the median family income is $41,000.
The town is home to several churches, including the First Baptist Church, the First Presbyterian Church, and the United Methodist Church. The town is also home to several schools, including Ashe County High School, Ashe County Middle School, and Ashe County Elementary School.
Conclusion
Jefferson, NC is a small town located in Ashe County, North Carolina. It is situated in the Appalachian Mountains and is part of the Blue Ridge Mountains. The town is known for its rich history, stunning scenery, and friendly people. The economy of the town is largely based on tourism and small businesses. The population of the town is largely white, with a small percentage of African Americans and Hispanics. The town is home to several churches, schools, and tourist attractions.
Common Questions
What is Per Capita Income in Jefferson?
Per Capita income in Jefferson is $20,703.
What is the Median Family Income in Jefferson?
Median Family Income in Jefferson is $49,563.
What is the Median Household income in Jefferson?
Median Household Income in Jefferson is $37,232.
What is Income or Wage Gap in Jefferson?
Income or Wage Gap in Jefferson is 18.1%.
Women in Jefferson earn 81.9 cents for every dollar earned by a man.
What is Inequality or Gini Index in Jefferson?
Inequality or Gini Index in Jefferson is 0.41.
What is the Total Population of Jefferson?
Total Population of Jefferson is 1,872.
What is the Total Male Population of Jefferson?
Total Male Population of Jefferson is 874.
What is the Total Female Population of Jefferson?
Total Female Population of Jefferson is 998.
What is the Ratio of Males per 100 Females in Jefferson?
There are 87.58 Males per 100 Females in Jefferson.
What is the Ratio of Females per 100 Males in Jefferson?
There are 114.19 Females per 100 Males in Jefferson.
What is the Median Population Age in Jefferson?
Median Population Age in Jefferson is 45.4 Years.
What is the Average Family Size in Jefferson
Average Family Size in Jefferson is 2.9 People.
What is the Average Household Size in Jefferson
Average Household Size in Jefferson is 2.2 People.
How Large is the Labor Force in Jefferson?
There are 795 People in the Labor Forcein in Jefferson.
What is the Percentage of People in the Labor Force in Jefferson?
51.7% of People are in the Labor Force in Jefferson.
What is the Unemployment Rate in Jefferson?
Unemployment Rate in Jefferson is 4.3%.