Badin, NC Map & Demographics
Badin Map
Badin Overview
$16,397
PER CAPITA INCOME
$50,625
AVG FAMILY INCOME
$42,708
AVG HOUSEHOLD INCOME
36.2%
WAGE / INCOME GAP [ % ]
63.8¢/ $1
WAGE / INCOME GAP [ $ ]
0.43
INEQUALITY / GINI INDEX
2,075
TOTAL POPULATION
1,416
MALE POPULATION
659
FEMALE POPULATION
214.87
MALES / 100 FEMALES
46.54
FEMALES / 100 MALES
47.0
MEDIAN AGE
3.5
AVG FAMILY SIZE
2.9
AVG HOUSEHOLD SIZE
483
LABOR FORCE [ PEOPLE ]
27.5%
PERCENT IN LABOR FORCE
11.3%
UNEMPLOYMENT RATE
Badin Zip Codes
Badin Area Codes
Income in Badin
Income Overview in Badin
Per Capita Income in Badin is $16,397, while median incomes of families and households are $50,625 and $42,708 respectively.
| Characteristic | Number | Measure |
| Per Capita Income | 2,075 | $16,397 |
| Median Family Income | 297 | $50,625 |
| Mean Family Income | 297 | $65,891 |
| Median Household Income | 424 | $42,708 |
| Mean Household Income | 424 | $58,621 |
| Income Deficit | 297 | $0 |
| Wage / Income Gap (%) | 2,075 | 36.17% |
| Wage / Income Gap ($) | 2,075 | 63.83¢ per $1 |
| Gini / Inequality Index | 2,075 | 0.43 |
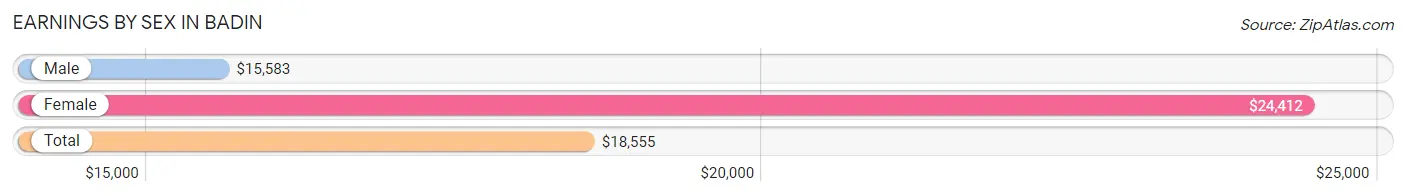
Earnings by Sex in Badin
Average Earnings in Badin are $18,555, $15,583 for men and $24,412 for women, a difference of 36.2%.
| Sex | Number | Average Earnings |
| Male | 722 (72.6%) | $15,583 |
| Female | 272 (27.4%) | $24,412 |
| Total | 994 (100.0%) | $18,555 |
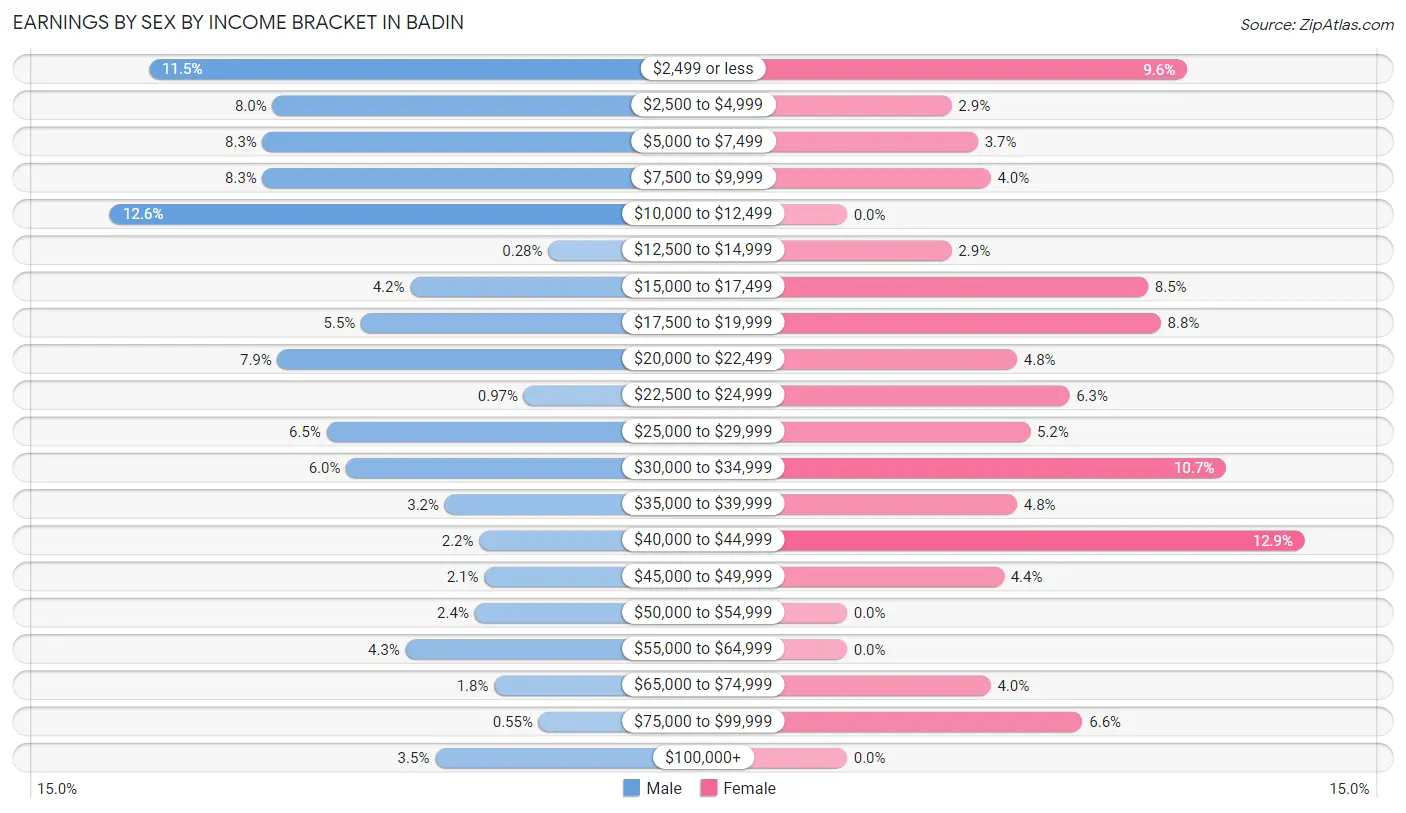
Earnings by Sex by Income Bracket in Badin
The most common earnings brackets in Badin are $10,000 to $12,499 for men (91 | 12.6%) and $40,000 to $44,999 for women (35 | 12.9%).
| Income | Male | Female |
| $2,499 or less | 83 (11.5%) | 26 (9.6%) |
| $2,500 to $4,999 | 58 (8.0%) | 8 (2.9%) |
| $5,000 to $7,499 | 60 (8.3%) | 10 (3.7%) |
| $7,500 to $9,999 | 60 (8.3%) | 11 (4.0%) |
| $10,000 to $12,499 | 91 (12.6%) | 0 (0.0%) |
| $12,500 to $14,999 | 2 (0.3%) | 8 (2.9%) |
| $15,000 to $17,499 | 30 (4.2%) | 23 (8.5%) |
| $17,500 to $19,999 | 40 (5.5%) | 24 (8.8%) |
| $20,000 to $22,499 | 57 (7.9%) | 13 (4.8%) |
| $22,500 to $24,999 | 7 (1.0%) | 17 (6.2%) |
| $25,000 to $29,999 | 47 (6.5%) | 14 (5.1%) |
| $30,000 to $34,999 | 43 (6.0%) | 29 (10.7%) |
| $35,000 to $39,999 | 23 (3.2%) | 13 (4.8%) |
| $40,000 to $44,999 | 16 (2.2%) | 35 (12.9%) |
| $45,000 to $49,999 | 15 (2.1%) | 12 (4.4%) |
| $50,000 to $54,999 | 17 (2.4%) | 0 (0.0%) |
| $55,000 to $64,999 | 31 (4.3%) | 0 (0.0%) |
| $65,000 to $74,999 | 13 (1.8%) | 11 (4.0%) |
| $75,000 to $99,999 | 4 (0.5%) | 18 (6.6%) |
| $100,000+ | 25 (3.5%) | 0 (0.0%) |
| Total | 722 (100.0%) | 272 (100.0%) |
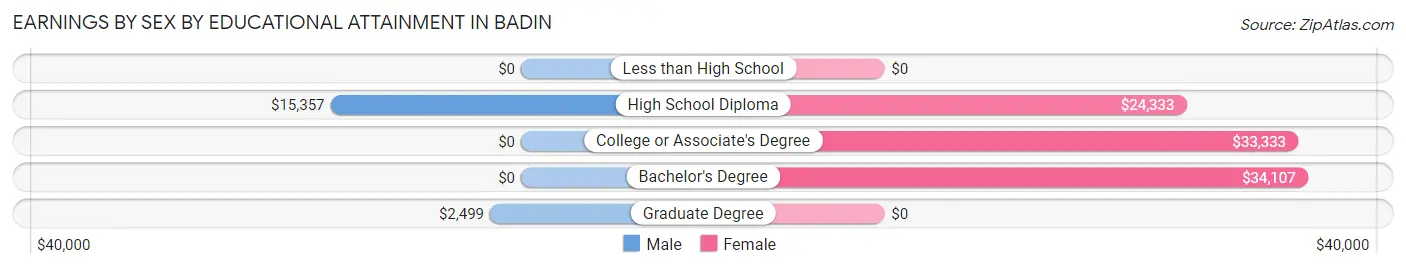
Earnings by Sex by Educational Attainment in Badin
Average earnings in Badin are $16,167 for men and $27,500 for women, a difference of 41.2%. Men with an educational attainment of high school diploma enjoy the highest average annual earnings of $15,357, while those with graduate degree education earn the least with $2,499. Women with an educational attainment of bachelor's degree earn the most with the average annual earnings of $34,107, while those with high school diploma education have the smallest earnings of $24,333.
| Educational Attainment | Male Income | Female Income |
| Less than High School | - | - |
| High School Diploma | $15,357 | $24,333 |
| College or Associate's Degree | - | - |
| Bachelor's Degree | - | - |
| Graduate Degree | $2,499 | $0 |
| Total | $16,167 | $27,500 |
Family Income in Badin
Family Income Brackets in Badin
According to the Badin family income data, there are 58 families falling into the $50,000 to $74,999 income range, which is the most common income bracket and makes up 19.5% of all families. Conversely, the $150,000 to $199,999 income bracket is the least frequent group with only 5 families (1.7%) belonging to this category.
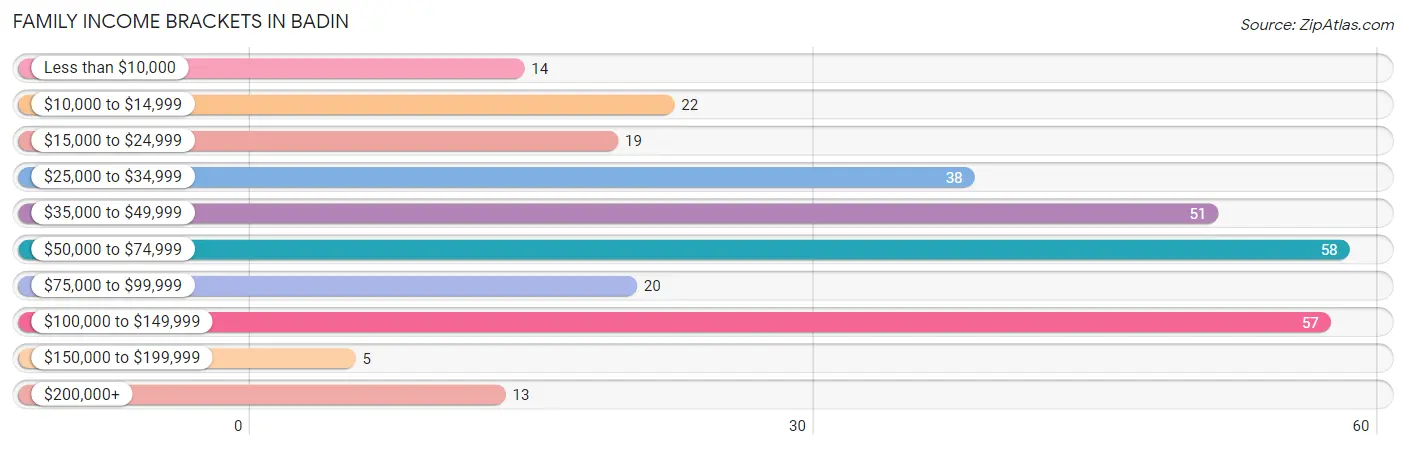
| Income Bracket | # Families | % Families |
| Less than $10,000 | 14 | 4.7% |
| $10,000 to $14,999 | 22 | 7.4% |
| $15,000 to $24,999 | 19 | 6.4% |
| $25,000 to $34,999 | 38 | 12.8% |
| $35,000 to $49,999 | 51 | 17.2% |
| $50,000 to $74,999 | 58 | 19.5% |
| $75,000 to $99,999 | 20 | 6.7% |
| $100,000 to $149,999 | 57 | 19.2% |
| $150,000 to $199,999 | 5 | 1.7% |
| $200,000+ | 13 | 4.4% |
Family Income by Famaliy Size in Badin
2-person families (125 | 42.1%) account for the highest median family income in Badin with $51,875 per family, while 2-person families (125 | 42.1%) have the highest median income of $25,938 per family member.
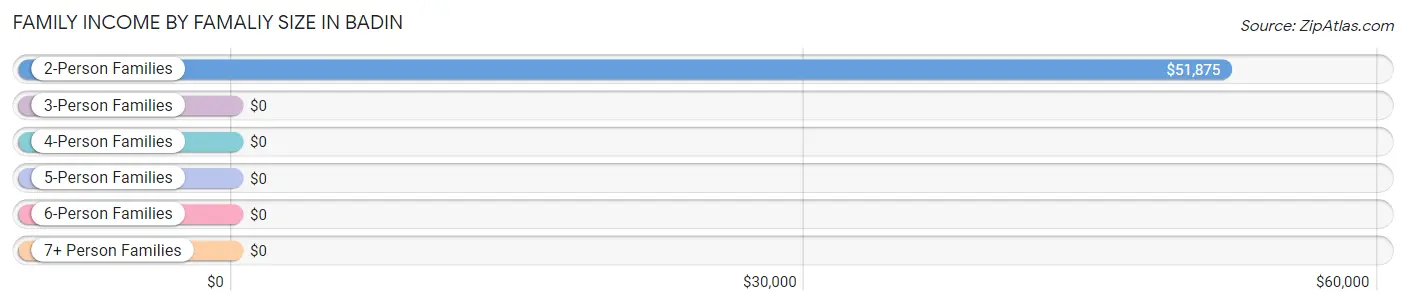
| Income Bracket | # Families | Median Income |
| 2-Person Families | 125 (42.1%) | $51,875 |
| 3-Person Families | 63 (21.2%) | $0 |
| 4-Person Families | 80 (26.9%) | $0 |
| 5-Person Families | 12 (4.0%) | $0 |
| 6-Person Families | 5 (1.7%) | $0 |
| 7+ Person Families | 12 (4.0%) | $0 |
| Total | 297 (100.0%) | $50,625 |
Family Income by Number of Earners in Badin
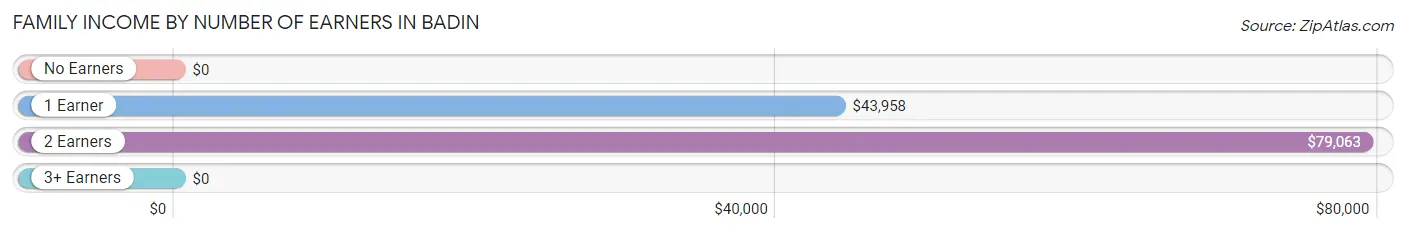
| Number of Earners | # Families | Median Income |
| No Earners | 68 (22.9%) | $0 |
| 1 Earner | 104 (35.0%) | $43,958 |
| 2 Earners | 105 (35.3%) | $79,063 |
| 3+ Earners | 20 (6.7%) | $0 |
| Total | 297 (100.0%) | $50,625 |
Household Income in Badin
Household Income Brackets in Badin
With 82 households falling in the category, the $35,000 to $49,999 income range is the most frequent in Badin, accounting for 19.3% of all households. In contrast, only 10 households (2.4%) fall into the $150,000 to $199,999 income bracket, making it the least populous group.
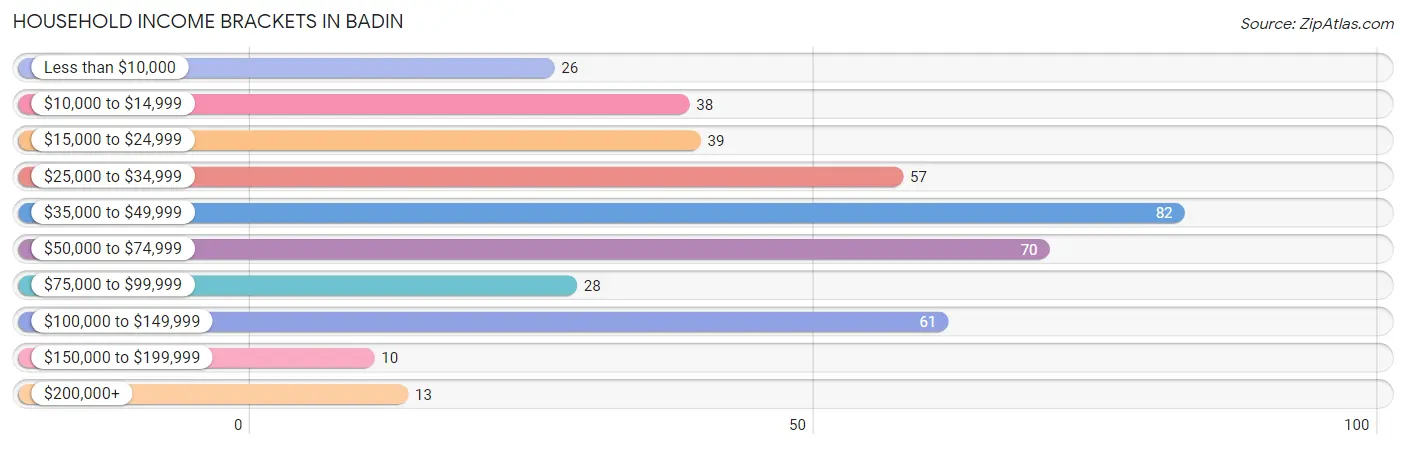
| Income Bracket | # Households | % Households |
| Less than $10,000 | 26 | 6.1% |
| $10,000 to $14,999 | 38 | 9.0% |
| $15,000 to $24,999 | 39 | 9.2% |
| $25,000 to $34,999 | 57 | 13.4% |
| $35,000 to $49,999 | 82 | 19.3% |
| $50,000 to $74,999 | 70 | 16.5% |
| $75,000 to $99,999 | 28 | 6.6% |
| $100,000 to $149,999 | 61 | 14.4% |
| $150,000 to $199,999 | 10 | 2.4% |
| $200,000+ | 13 | 3.1% |
Household Income by Householder Age in Badin
The median household income in Badin is $42,708, with the highest median household income of $47,596 found in the 65+ years age bracket for the primary householder. A total of 133 households (31.4%) fall into this category. Meanwhile, the 15 to 24 years age bracket for the primary householder has the lowest median household income of $0, with 6 households (1.4%) in this group.
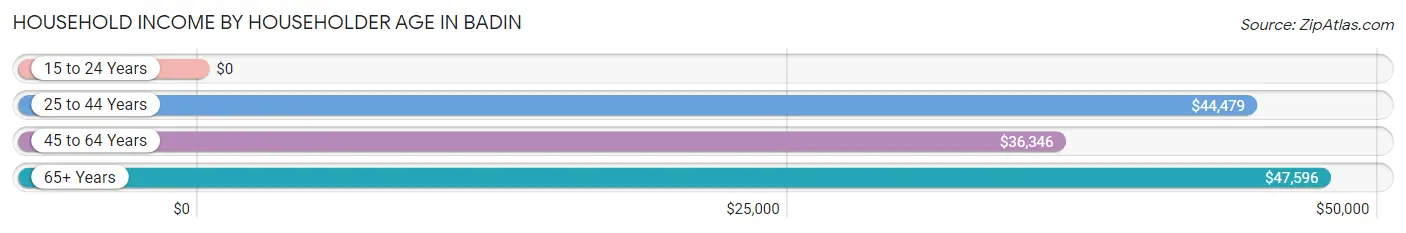
| Income Bracket | # Households | Median Income |
| 15 to 24 Years | 6 (1.4%) | $0 |
| 25 to 44 Years | 97 (22.9%) | $44,479 |
| 45 to 64 Years | 188 (44.3%) | $36,346 |
| 65+ Years | 133 (31.4%) | $47,596 |
| Total | 424 (100.0%) | $42,708 |
Poverty in Badin
Income Below Poverty by Sex and Age in Badin
With 32.7% poverty level for males and 16.7% for females among the residents of Badin, under 5 year old males and 18 to 24 year old females are the most vulnerable to poverty, with 26 males (81.2%) and 16 females (35.6%) in their respective age groups living below the poverty level.
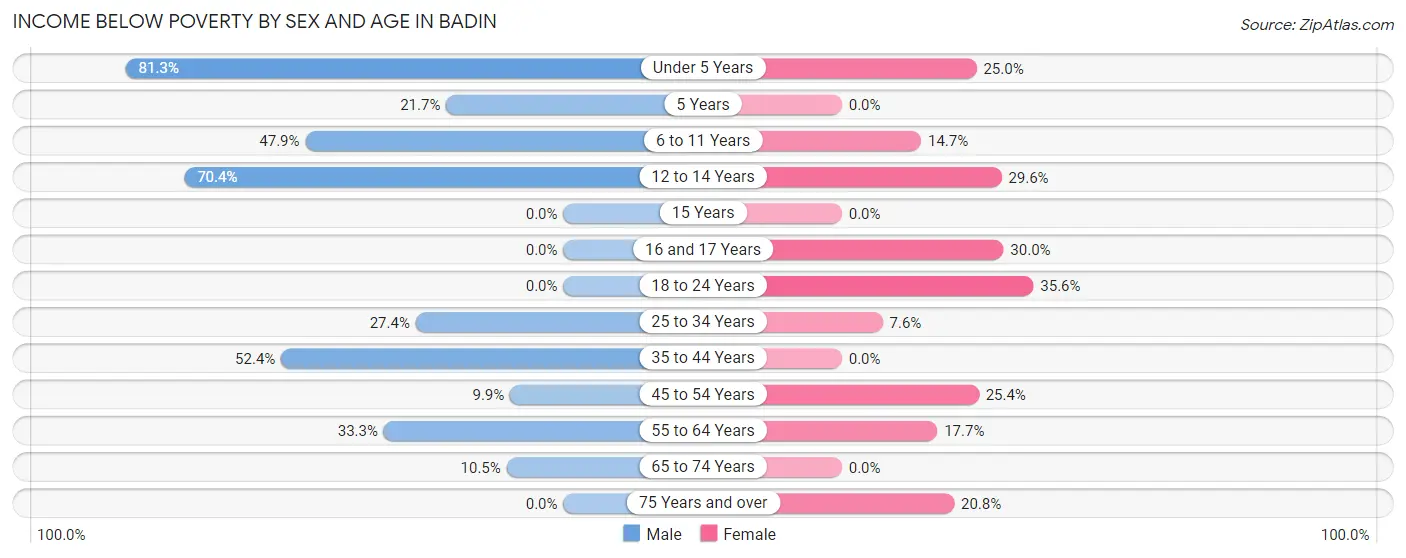
| Age Bracket | Male | Female |
| Under 5 Years | 26 (81.2%) | 7 (25.0%) |
| 5 Years | 5 (21.7%) | 0 (0.0%) |
| 6 to 11 Years | 34 (47.9%) | 10 (14.7%) |
| 12 to 14 Years | 19 (70.4%) | 8 (29.6%) |
| 15 Years | 0 (0.0%) | 0 (0.0%) |
| 16 and 17 Years | 0 (0.0%) | 6 (30.0%) |
| 18 to 24 Years | 0 (0.0%) | 16 (35.6%) |
| 25 to 34 Years | 20 (27.4%) | 5 (7.6%) |
| 35 to 44 Years | 55 (52.4%) | 0 (0.0%) |
| 45 to 54 Years | 8 (9.9%) | 31 (25.4%) |
| 55 to 64 Years | 11 (33.3%) | 17 (17.7%) |
| 65 to 74 Years | 4 (10.5%) | 0 (0.0%) |
| 75 Years and over | 0 (0.0%) | 10 (20.8%) |
| Total | 182 (32.7%) | 110 (16.7%) |
Income Above Poverty by Sex and Age in Badin
According to the poverty statistics in Badin, males aged 16 and 17 years and females aged 5 years are the age groups that are most secure financially, with 100.0% of males and 100.0% of females in these age groups living above the poverty line.
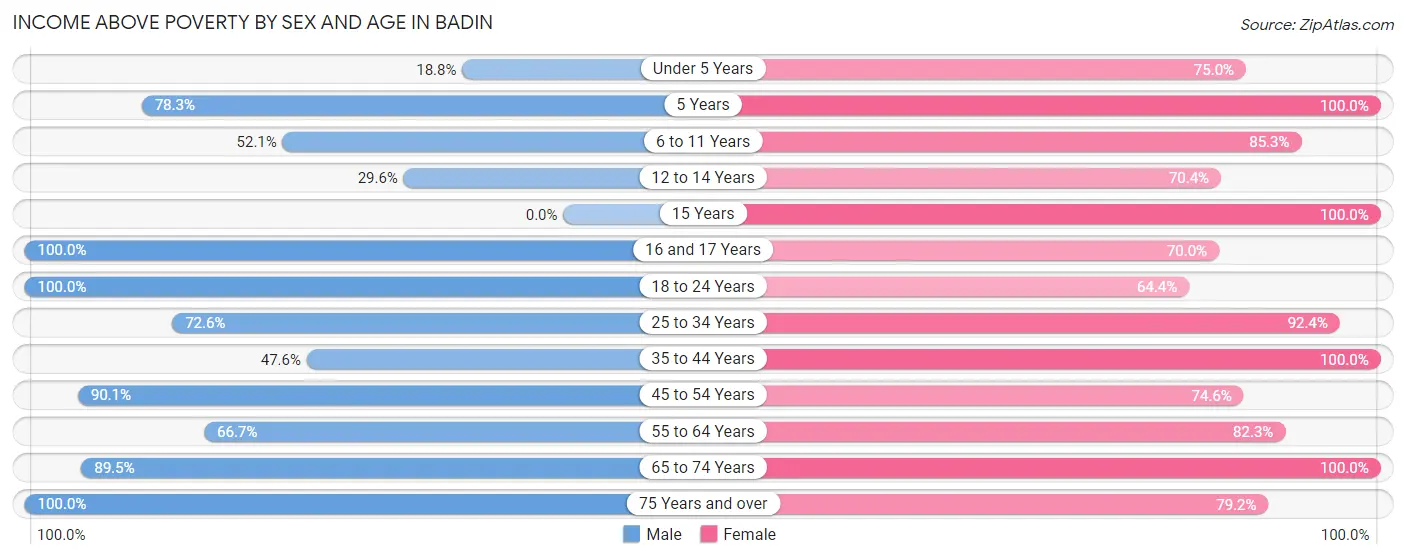
| Age Bracket | Male | Female |
| Under 5 Years | 6 (18.8%) | 21 (75.0%) |
| 5 Years | 18 (78.3%) | 31 (100.0%) |
| 6 to 11 Years | 37 (52.1%) | 58 (85.3%) |
| 12 to 14 Years | 8 (29.6%) | 19 (70.4%) |
| 15 Years | 0 (0.0%) | 10 (100.0%) |
| 16 and 17 Years | 10 (100.0%) | 14 (70.0%) |
| 18 to 24 Years | 19 (100.0%) | 29 (64.4%) |
| 25 to 34 Years | 53 (72.6%) | 61 (92.4%) |
| 35 to 44 Years | 50 (47.6%) | 42 (100.0%) |
| 45 to 54 Years | 73 (90.1%) | 91 (74.6%) |
| 55 to 64 Years | 22 (66.7%) | 79 (82.3%) |
| 65 to 74 Years | 34 (89.5%) | 56 (100.0%) |
| 75 Years and over | 45 (100.0%) | 38 (79.2%) |
| Total | 375 (67.3%) | 549 (83.3%) |
Income Below Poverty Among Married-Couple Families in Badin
The poverty statistics for married-couple families in Badin show that 10.5% or 22 of the total 210 families live below the poverty line. Families with 1 or 2 children have the highest poverty rate of 20.3%, comprising of 16 families. On the other hand, families with 3 or 4 children have the lowest poverty rate of 0.0%, which includes 0 families.
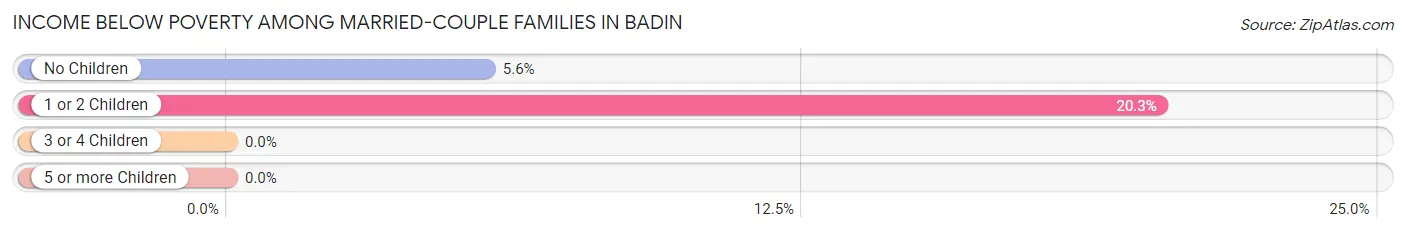
| Children | Above Poverty | Below Poverty |
| No Children | 101 (94.4%) | 6 (5.6%) |
| 1 or 2 Children | 63 (79.7%) | 16 (20.3%) |
| 3 or 4 Children | 24 (100.0%) | 0 (0.0%) |
| 5 or more Children | 0 (0.0%) | 0 (0.0%) |
| Total | 188 (89.5%) | 22 (10.5%) |
Income Below Poverty Among Single-Parent Households in Badin
According to the poverty data in Badin, 59.1% or 13 single-father households and 27.7% or 18 single-mother households are living below the poverty line. Among single-father households, those with 3 or 4 children have the highest poverty rate, with 5 households (100.0%) experiencing poverty. Likewise, among single-mother households, those with 1 or 2 children have the highest poverty rate, with 18 households (46.2%) falling below the poverty line.
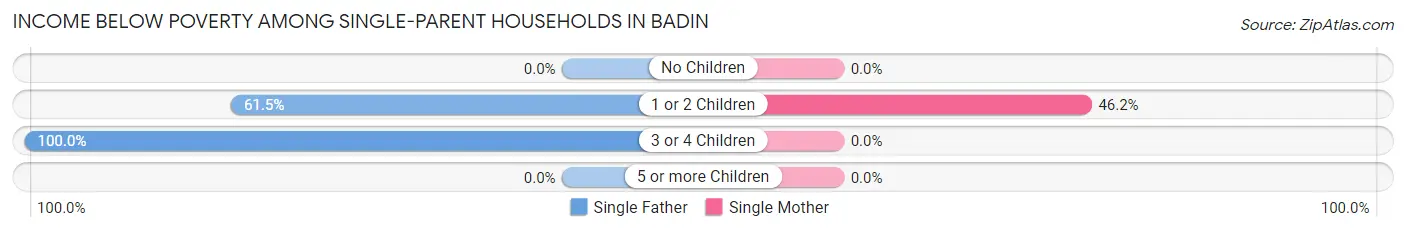
| Children | Single Father | Single Mother |
| No Children | 0 (0.0%) | 0 (0.0%) |
| 1 or 2 Children | 8 (61.5%) | 18 (46.2%) |
| 3 or 4 Children | 5 (100.0%) | 0 (0.0%) |
| 5 or more Children | 0 (0.0%) | 0 (0.0%) |
| Total | 13 (59.1%) | 18 (27.7%) |
Income Below Poverty Among Married-Couple vs Single-Parent Households in Badin
The poverty data for Badin shows that 22 of the married-couple family households (10.5%) and 31 of the single-parent households (35.6%) are living below the poverty level. Within the married-couple family households, those with 1 or 2 children have the highest poverty rate, with 16 households (20.3%) falling below the poverty line. Among the single-parent households, those with 3 or 4 children have the highest poverty rate, with 5 household (100.0%) living below poverty.
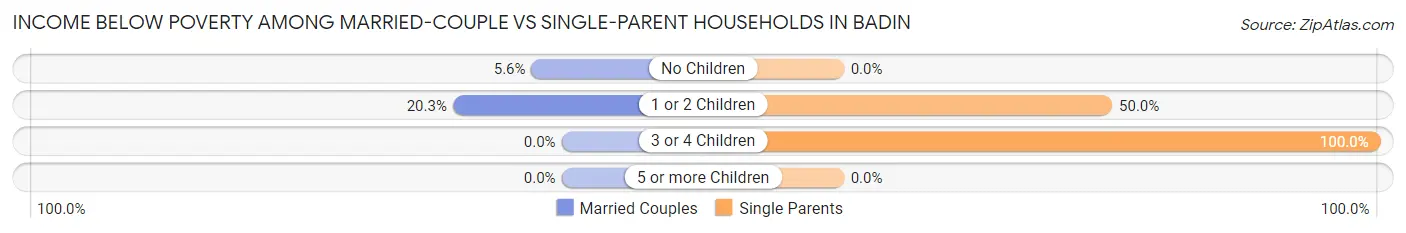
| Children | Married-Couple Families | Single-Parent Households |
| No Children | 6 (5.6%) | 0 (0.0%) |
| 1 or 2 Children | 16 (20.3%) | 26 (50.0%) |
| 3 or 4 Children | 0 (0.0%) | 5 (100.0%) |
| 5 or more Children | 0 (0.0%) | 0 (0.0%) |
| Total | 22 (10.5%) | 31 (35.6%) |
Race in Badin
The most populous races in Badin are White / Caucasian (1,177 | 56.7%), Black / African American (752 | 36.2%), and Hispanic or Latino (137 | 6.6%).
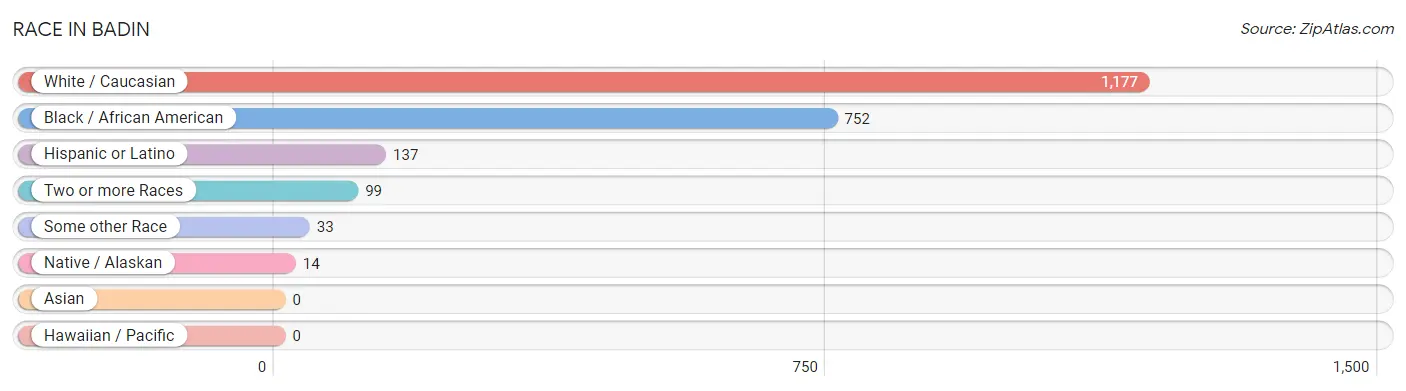
| Race | # Population | % Population |
| Asian | 0 | 0.0% |
| Black / African American | 752 | 36.2% |
| Hawaiian / Pacific | 0 | 0.0% |
| Hispanic or Latino | 137 | 6.6% |
| Native / Alaskan | 14 | 0.7% |
| White / Caucasian | 1,177 | 56.7% |
| Two or more Races | 99 | 4.8% |
| Some other Race | 33 | 1.6% |
| Total | 2,075 | 100.0% |
Ancestry in Badin
The most populous ancestries reported in Badin are English (140 | 6.8%), German (118 | 5.7%), African (117 | 5.6%), Subsaharan African (117 | 5.6%), and Irish (94 | 4.5%), together accounting for 28.3% of all Badin residents.
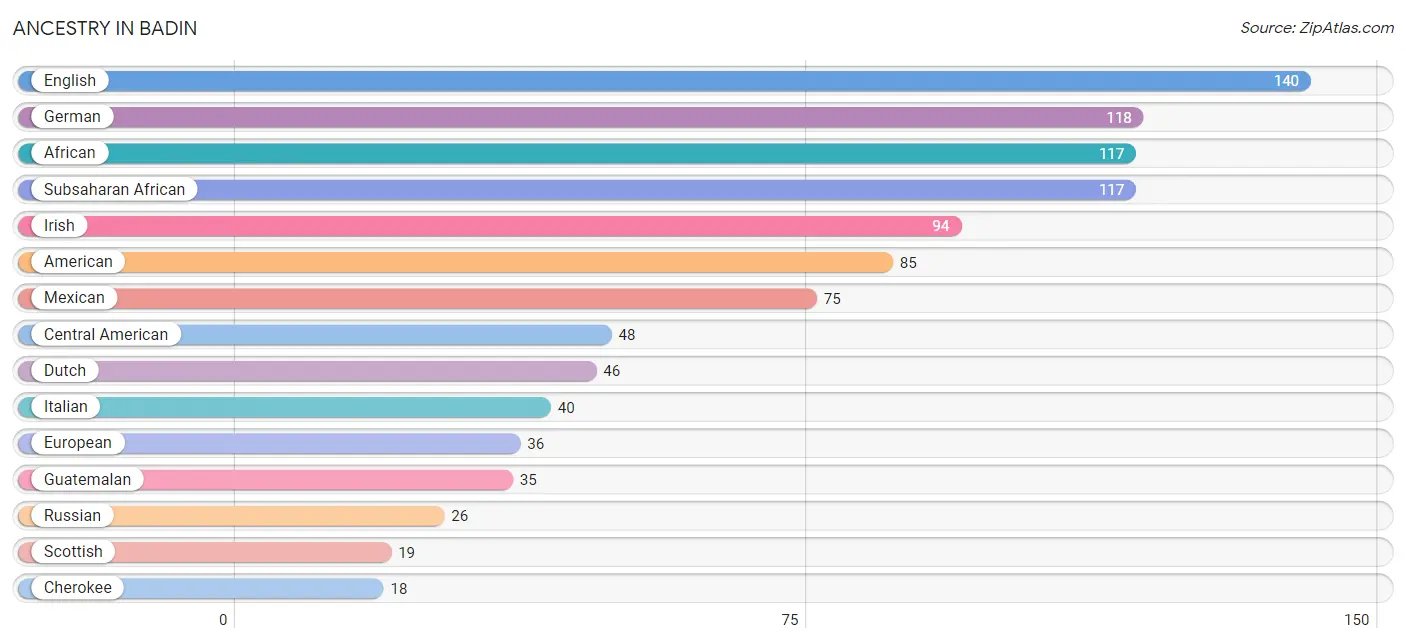
| Ancestry | # Population | % Population |
| African | 117 | 5.6% |
| American | 85 | 4.1% |
| Arab | 6 | 0.3% |
| Blackfeet | 9 | 0.4% |
| Central American | 48 | 2.3% |
| Central American Indian | 13 | 0.6% |
| Cherokee | 18 | 0.9% |
| Cuban | 14 | 0.7% |
| Dutch | 46 | 2.2% |
| English | 140 | 6.8% |
| European | 36 | 1.7% |
| French Canadian | 5 | 0.2% |
| German | 118 | 5.7% |
| Guatemalan | 35 | 1.7% |
| Haitian | 7 | 0.3% |
| Irish | 94 | 4.5% |
| Italian | 40 | 1.9% |
| Lumbee | 7 | 0.3% |
| Mexican | 75 | 3.6% |
| Moroccan | 6 | 0.3% |
| Northern European | 8 | 0.4% |
| Norwegian | 3 | 0.1% |
| Polish | 5 | 0.2% |
| Russian | 26 | 1.3% |
| Salvadoran | 13 | 0.6% |
| Scandinavian | 6 | 0.3% |
| Scotch-Irish | 11 | 0.5% |
| Scottish | 19 | 0.9% |
| Subsaharan African | 117 | 5.6% |
| Welsh | 7 | 0.3% | View All 30 Rows |
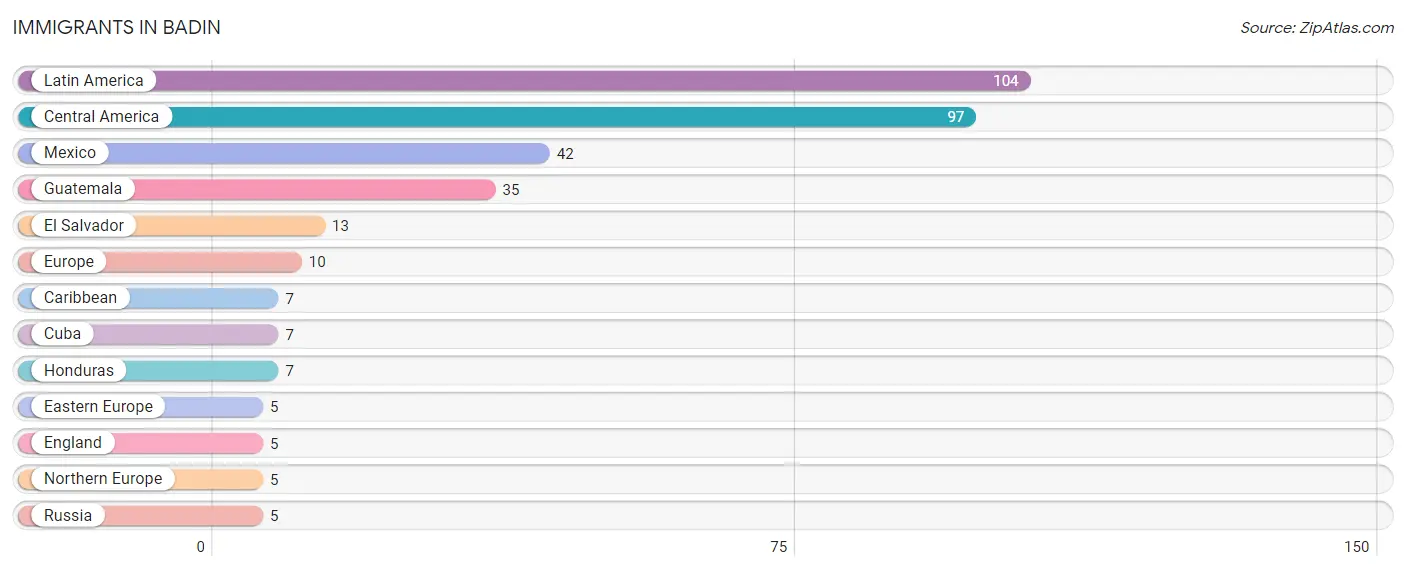
Immigrants in Badin
The most numerous immigrant groups reported in Badin came from Latin America (104 | 5.0%), Central America (97 | 4.7%), Mexico (42 | 2.0%), Guatemala (35 | 1.7%), and El Salvador (13 | 0.6%), together accounting for 14.0% of all Badin residents.
| Immigration Origin | # Population | % Population |
| Caribbean | 7 | 0.3% |
| Central America | 97 | 4.7% |
| Cuba | 7 | 0.3% |
| Eastern Europe | 5 | 0.2% |
| El Salvador | 13 | 0.6% |
| England | 5 | 0.2% |
| Europe | 10 | 0.5% |
| Guatemala | 35 | 1.7% |
| Honduras | 7 | 0.3% |
| Latin America | 104 | 5.0% |
| Mexico | 42 | 2.0% |
| Northern Europe | 5 | 0.2% |
| Russia | 5 | 0.2% | View All 13 Rows |
Sex and Age in Badin
Sex and Age in Badin
The most populous age groups in Badin are 45 to 49 Years (238 | 16.8%) for men and 45 to 49 Years (98 | 14.9%) for women.
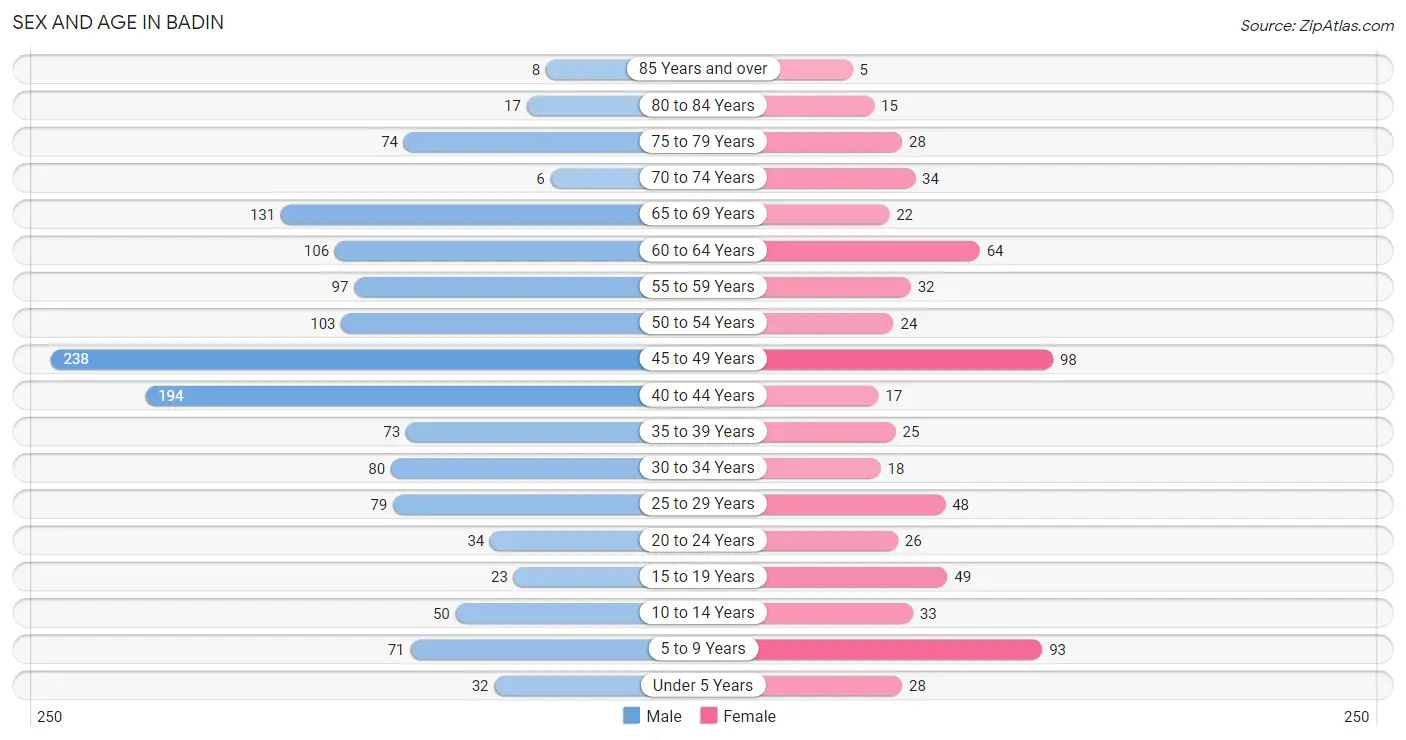
| Age Bracket | Male | Female |
| Under 5 Years | 32 (2.3%) | 28 (4.3%) |
| 5 to 9 Years | 71 (5.0%) | 93 (14.1%) |
| 10 to 14 Years | 50 (3.5%) | 33 (5.0%) |
| 15 to 19 Years | 23 (1.6%) | 49 (7.4%) |
| 20 to 24 Years | 34 (2.4%) | 26 (4.0%) |
| 25 to 29 Years | 79 (5.6%) | 48 (7.3%) |
| 30 to 34 Years | 80 (5.7%) | 18 (2.7%) |
| 35 to 39 Years | 73 (5.2%) | 25 (3.8%) |
| 40 to 44 Years | 194 (13.7%) | 17 (2.6%) |
| 45 to 49 Years | 238 (16.8%) | 98 (14.9%) |
| 50 to 54 Years | 103 (7.3%) | 24 (3.6%) |
| 55 to 59 Years | 97 (6.9%) | 32 (4.9%) |
| 60 to 64 Years | 106 (7.5%) | 64 (9.7%) |
| 65 to 69 Years | 131 (9.2%) | 22 (3.3%) |
| 70 to 74 Years | 6 (0.4%) | 34 (5.2%) |
| 75 to 79 Years | 74 (5.2%) | 28 (4.3%) |
| 80 to 84 Years | 17 (1.2%) | 15 (2.3%) |
| 85 Years and over | 8 (0.6%) | 5 (0.8%) |
| Total | 1,416 (100.0%) | 659 (100.0%) |
Families and Households in Badin
Median Family Size in Badin
The median family size in Badin is 3.47 persons per family, with single male/father families (22 | 7.4%) accounting for the largest median family size of 5.09 persons per family. On the other hand, single female/mother families (65 | 21.9%) represent the smallest median family size with 2.88 persons per family.
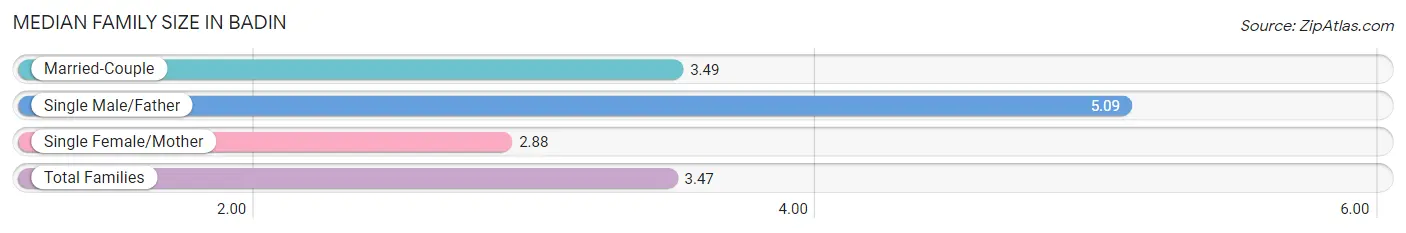
| Family Type | # Families | Family Size |
| Married-Couple | 210 (70.7%) | 3.49 |
| Single Male/Father | 22 (7.4%) | 5.09 |
| Single Female/Mother | 65 (21.9%) | 2.88 |
| Total Families | 297 (100.0%) | 3.47 |
Median Household Size in Badin
The median household size in Badin is 2.87 persons per household, with single male/father households (22 | 5.2%) accounting for the largest median household size of 6.27 persons per household. non-family households (127 | 29.9%) represent the smallest median household size with 1.04 persons per household.
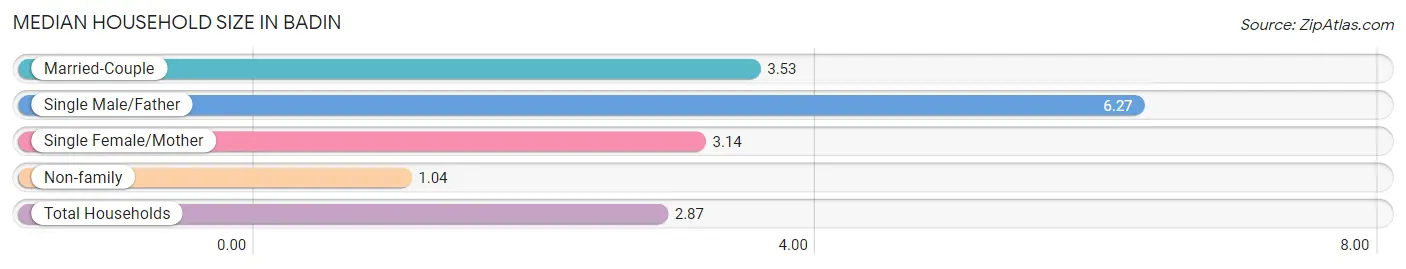
| Household Type | # Households | Household Size |
| Married-Couple | 210 (49.5%) | 3.53 |
| Single Male/Father | 22 (5.2%) | 6.27 |
| Single Female/Mother | 65 (15.3%) | 3.14 |
| Non-family | 127 (29.9%) | 1.04 |
| Total Households | 424 (100.0%) | 2.87 |
Household Size by Marriage Status in Badin
Out of a total of 424 households in Badin, 297 (70.1%) are family households, while 127 (29.9%) are nonfamily households. The most numerous type of family households are 2-person households, comprising 120, and the most common type of nonfamily households are 1-person households, comprising 122.
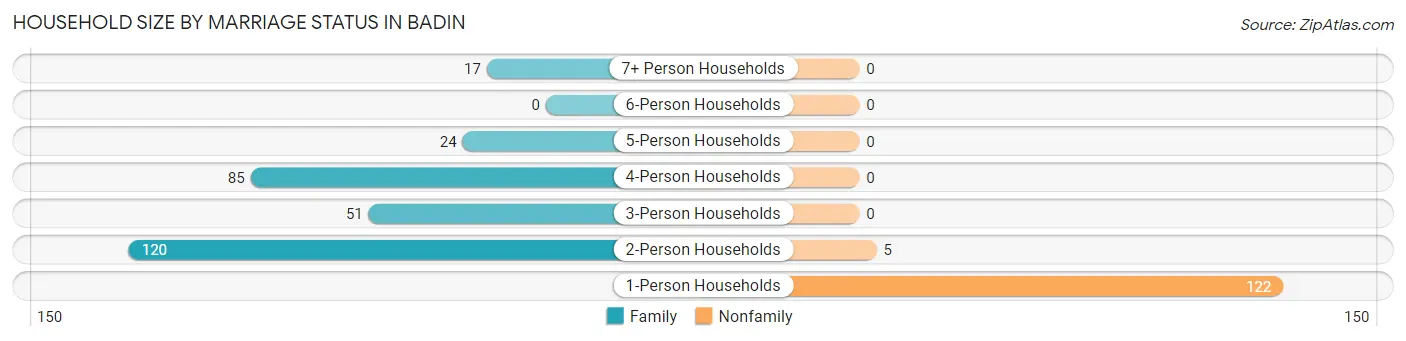
| Household Size | Family Households | Nonfamily Households |
| 1-Person Households | - | 122 (28.8%) |
| 2-Person Households | 120 (28.3%) | 5 (1.2%) |
| 3-Person Households | 51 (12.0%) | 0 (0.0%) |
| 4-Person Households | 85 (20.1%) | 0 (0.0%) |
| 5-Person Households | 24 (5.7%) | 0 (0.0%) |
| 6-Person Households | 0 (0.0%) | 0 (0.0%) |
| 7+ Person Households | 17 (4.0%) | 0 (0.0%) |
| Total | 297 (70.1%) | 127 (29.9%) |
Female Fertility in Badin
Fertility by Age in Badin
Average fertility rate in Badin is 25.0 births per 1,000 women. Women in the age bracket of 15 to 19 years have the highest fertility rate with 102.0 births per 1,000 women. Women in the age bracket of 15 to 19 years acount for 71.4% of all women with births.
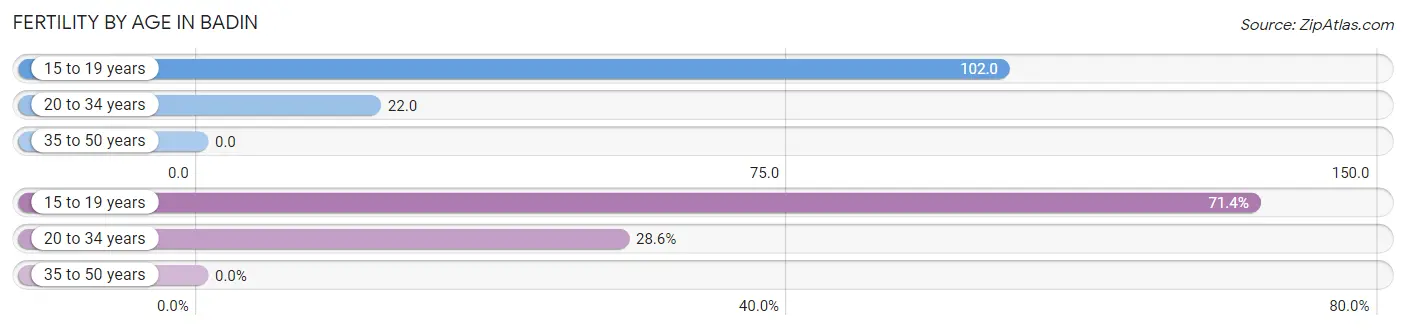
| Age Bracket | Women with Births | Births / 1,000 Women |
| 15 to 19 years | 5 (71.4%) | 102.0 |
| 20 to 34 years | 2 (28.6%) | 22.0 |
| 35 to 50 years | 0 (0.0%) | 0.0 |
| Total | 7 (100.0%) | 25.0 |
Fertility by Age by Marriage Status in Badin
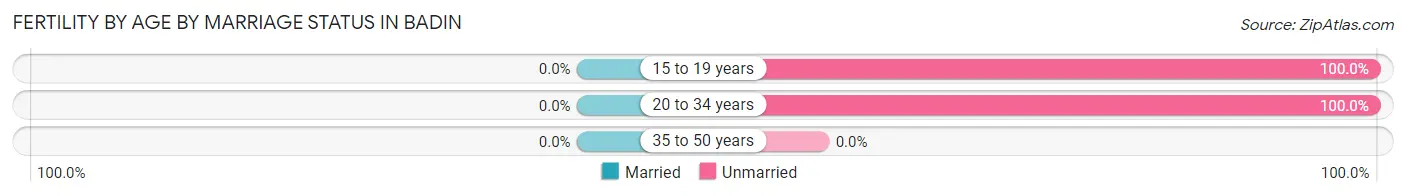
| Age Bracket | Married | Unmarried |
| 15 to 19 years | 0 (0.0%) | 5 (100.0%) |
| 20 to 34 years | 0 (0.0%) | 2 (100.0%) |
| 35 to 50 years | 0 (0.0%) | 0 (0.0%) |
| Total | 0 (0.0%) | 7 (100.0%) |
Fertility by Education in Badin
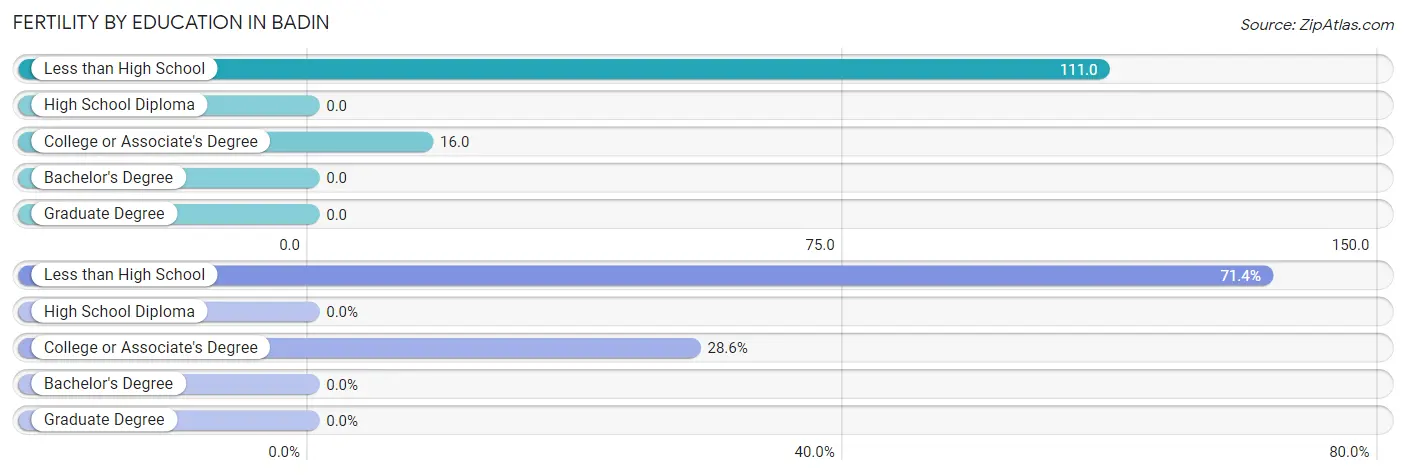
| Educational Attainment | Women with Births | Births / 1,000 Women |
| Less than High School | 5 (71.4%) | 111.0 |
| High School Diploma | 0 (0.0%) | 0.0 |
| College or Associate's Degree | 2 (28.6%) | 16.0 |
| Bachelor's Degree | 0 (0.0%) | 0.0 |
| Graduate Degree | 0 (0.0%) | 0.0 |
| Total | 7 (100.0%) | 25.0 |
Fertility by Education by Marriage Status in Badin
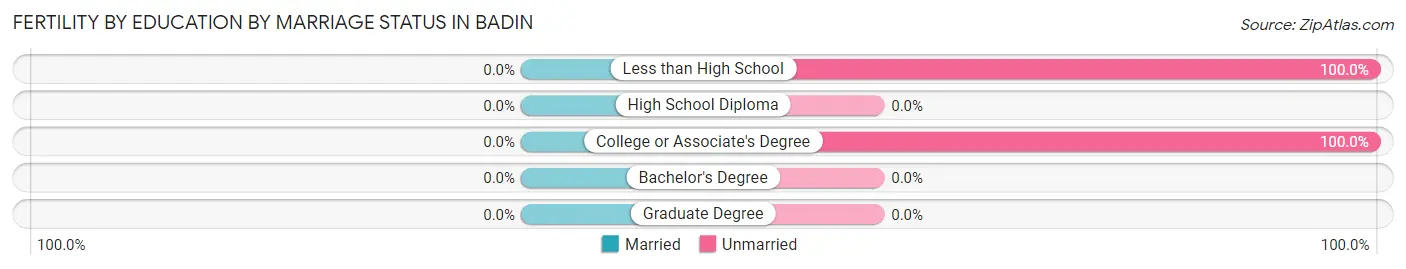
| Educational Attainment | Married | Unmarried |
| Less than High School | 0 (0.0%) | 5 (100.0%) |
| High School Diploma | 0 (0.0%) | 0 (0.0%) |
| College or Associate's Degree | 0 (0.0%) | 2 (100.0%) |
| Bachelor's Degree | 0 (0.0%) | 0 (0.0%) |
| Graduate Degree | 0 (0.0%) | 0 (0.0%) |
| Total | 0 (0.0%) | 7 (100.0%) |
Employment Characteristics in Badin
Employment by Class of Employer in Badin
Among the 415 employed individuals in Badin, private company employees (325 | 78.3%), state government employees (35 | 8.4%), and not-for-profit organizations (22 | 5.3%) make up the most common classes of employment.
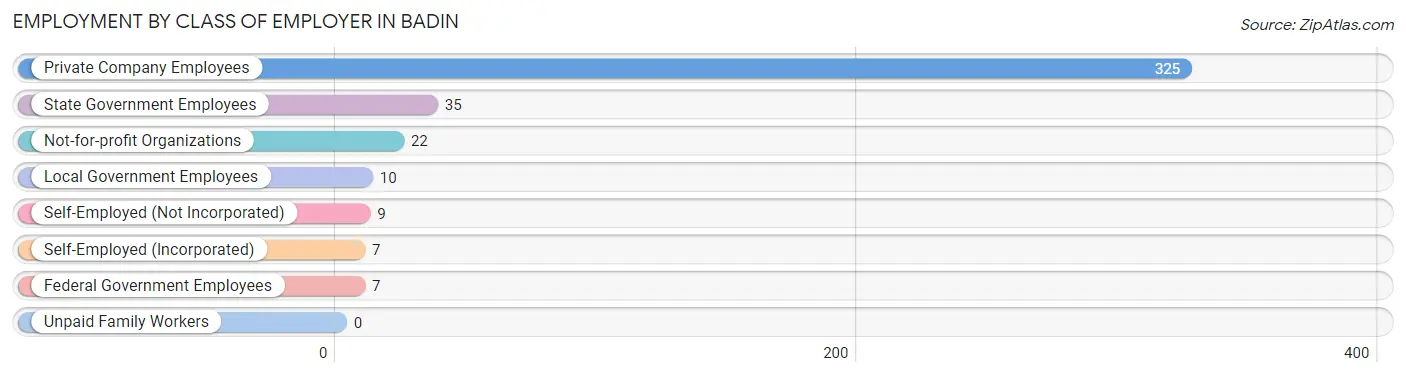
| Employer Class | # Employees | % Employees |
| Private Company Employees | 325 | 78.3% |
| Self-Employed (Incorporated) | 7 | 1.7% |
| Self-Employed (Not Incorporated) | 9 | 2.2% |
| Not-for-profit Organizations | 22 | 5.3% |
| Local Government Employees | 10 | 2.4% |
| State Government Employees | 35 | 8.4% |
| Federal Government Employees | 7 | 1.7% |
| Unpaid Family Workers | 0 | 0.0% |
| Total | 415 | 100.0% |
Employment Status by Age in Badin
According to the labor force statistics for Badin, out of the total population over 16 years of age (1,758), 27.5% or 483 individuals are in the labor force, with 11.3% or 55 of them unemployed. The age group with the highest labor force participation rate is 20 to 24 years, with 53.3% or 32 individuals in the labor force. Within the labor force, the 25 to 29 years age range has the highest percentage of unemployed individuals, with 31.7% or 21 of them being unemployed.
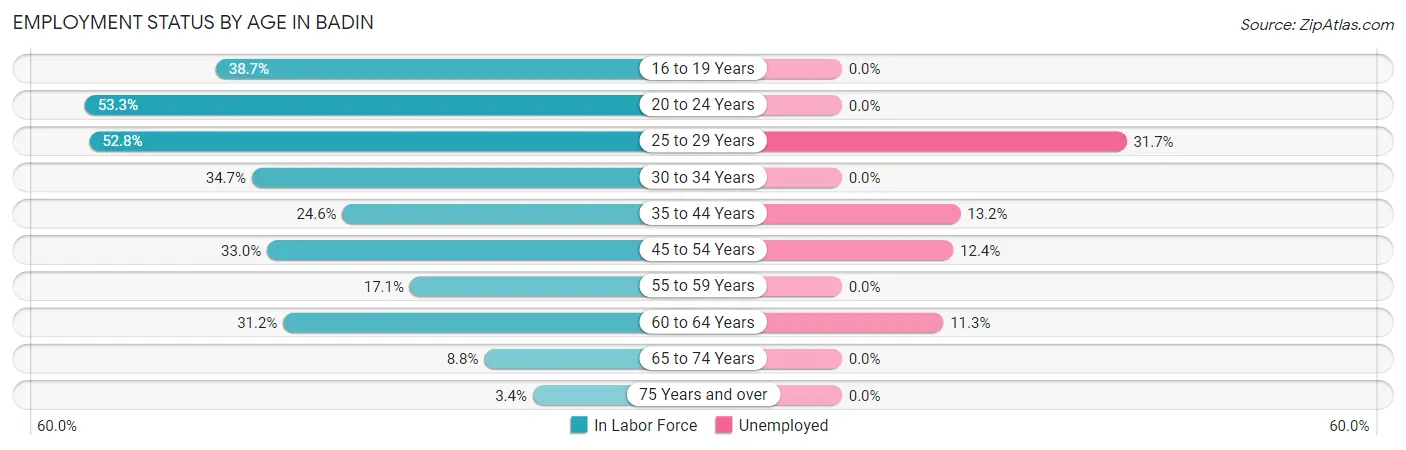
| Age Bracket | In Labor Force | Unemployed |
| 16 to 19 Years | 24 (38.7%) | 0 (0.0%) |
| 20 to 24 Years | 32 (53.3%) | 0 (0.0%) |
| 25 to 29 Years | 67 (52.8%) | 21 (31.7%) |
| 30 to 34 Years | 34 (34.7%) | 0 (0.0%) |
| 35 to 44 Years | 76 (24.6%) | 10 (13.2%) |
| 45 to 54 Years | 153 (33.0%) | 19 (12.4%) |
| 55 to 59 Years | 22 (17.1%) | 0 (0.0%) |
| 60 to 64 Years | 53 (31.2%) | 6 (11.3%) |
| 65 to 74 Years | 17 (8.8%) | 0 (0.0%) |
| 75 Years and over | 5 (3.4%) | 0 (0.0%) |
| Total | 483 (27.5%) | 55 (11.3%) |
Employment Status by Educational Attainment in Badin
According to labor force statistics for Badin, 31.3% of individuals (406) out of the total population between 25 and 64 years of age (1,296) are in the labor force, with 13.6% or 55 of them being unemployed. The group with the highest labor force participation rate are those with the educational attainment of bachelor's degree or higher, with 67.6% or 46 individuals in the labor force. Within the labor force, individuals with high school diploma education have the highest percentage of unemployment, with 18.1% or 35 of them being unemployed.
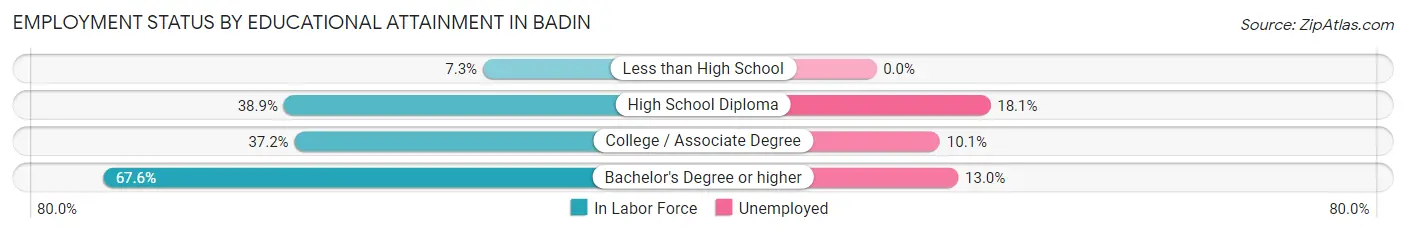
| Educational Attainment | In Labor Force | Unemployed |
| Less than High School | 26 (7.3%) | 0 (0.0%) |
| High School Diploma | 195 (38.9%) | 91 (18.1%) |
| College / Associate Degree | 138 (37.2%) | 37 (10.1%) |
| Bachelor's Degree or higher | 46 (67.6%) | 9 (13.0%) |
| Total | 406 (31.3%) | 176 (13.6%) |
Employment Occupations by Sex in Badin
Management, Business, Science and Arts Occupations
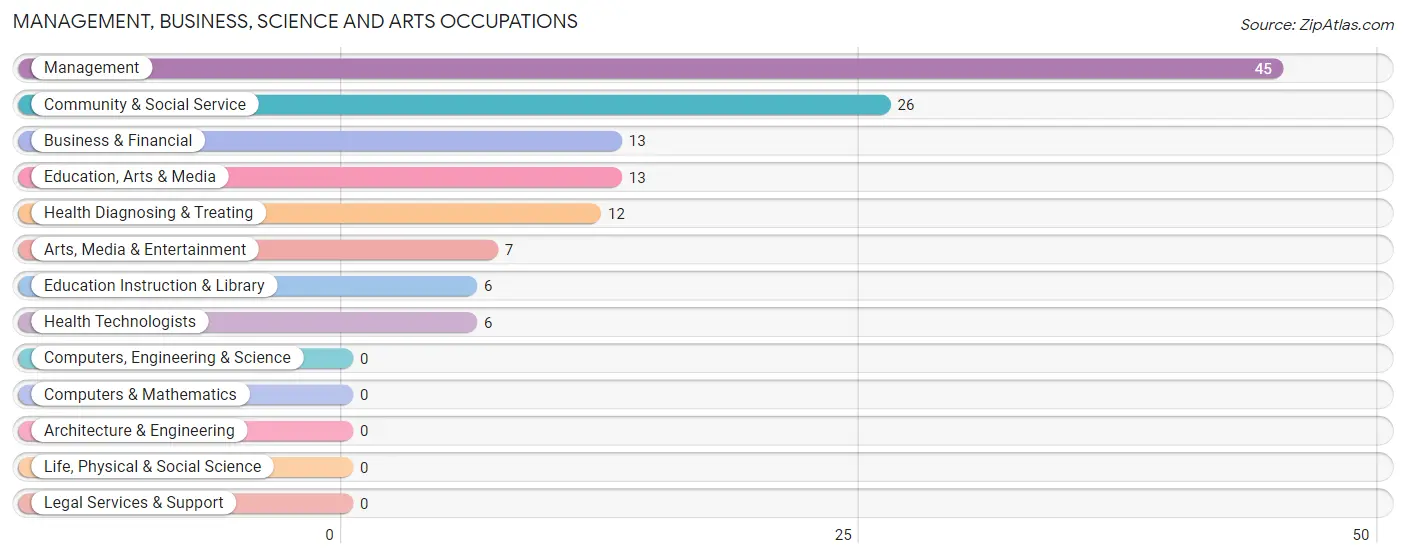
The most common Management, Business, Science and Arts occupations in Badin are Management (45 | 10.7%), Community & Social Service (26 | 6.2%), Business & Financial (13 | 3.1%), Education, Arts & Media (13 | 3.1%), and Health Diagnosing & Treating (12 | 2.8%).
Management, Business, Science and Arts Occupations by Sex
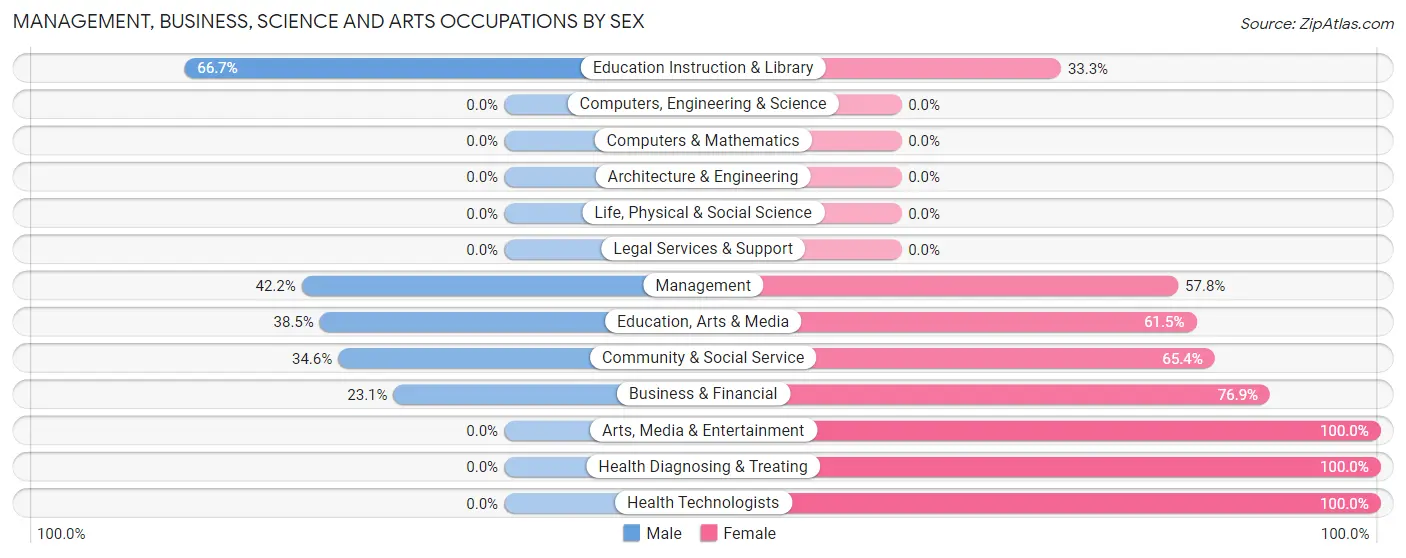
Within the Management, Business, Science and Arts occupations in Badin, the most male-oriented occupations are Education Instruction & Library (66.7%), Management (42.2%), and Education, Arts & Media (38.5%), while the most female-oriented occupations are Arts, Media & Entertainment (100.0%), Health Diagnosing & Treating (100.0%), and Health Technologists (100.0%).
| Occupation | Male | Female |
| Management | 19 (42.2%) | 26 (57.8%) |
| Business & Financial | 3 (23.1%) | 10 (76.9%) |
| Computers, Engineering & Science | 0 (0.0%) | 0 (0.0%) |
| Computers & Mathematics | 0 (0.0%) | 0 (0.0%) |
| Architecture & Engineering | 0 (0.0%) | 0 (0.0%) |
| Life, Physical & Social Science | 0 (0.0%) | 0 (0.0%) |
| Community & Social Service | 9 (34.6%) | 17 (65.4%) |
| Education, Arts & Media | 5 (38.5%) | 8 (61.5%) |
| Legal Services & Support | 0 (0.0%) | 0 (0.0%) |
| Education Instruction & Library | 4 (66.7%) | 2 (33.3%) |
| Arts, Media & Entertainment | 0 (0.0%) | 7 (100.0%) |
| Health Diagnosing & Treating | 0 (0.0%) | 12 (100.0%) |
| Health Technologists | 0 (0.0%) | 6 (100.0%) |
| Total (Category) | 31 (32.3%) | 65 (67.7%) |
| Total (Overall) | 203 (48.1%) | 219 (51.9%) |
Services Occupations
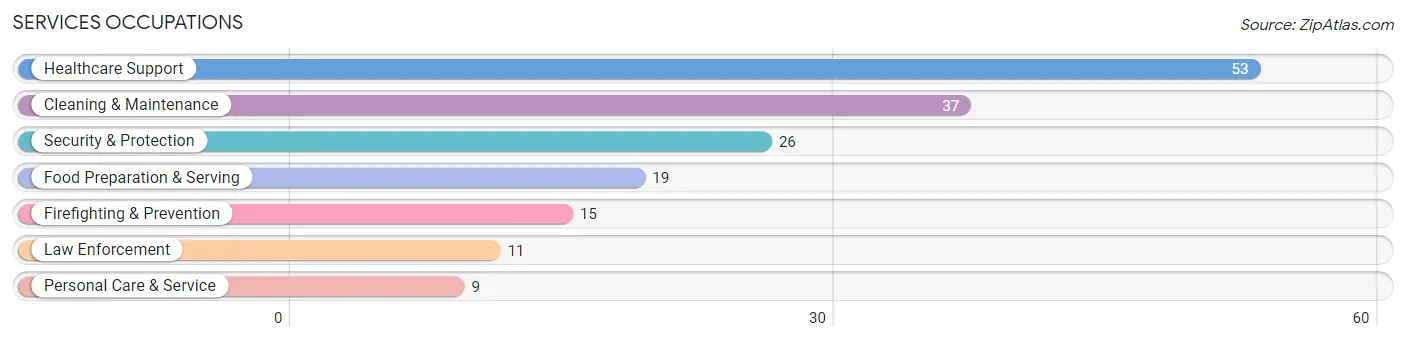
The most common Services occupations in Badin are Healthcare Support (53 | 12.6%), Cleaning & Maintenance (37 | 8.8%), Security & Protection (26 | 6.2%), Food Preparation & Serving (19 | 4.5%), and Firefighting & Prevention (15 | 3.5%).
Services Occupations by Sex
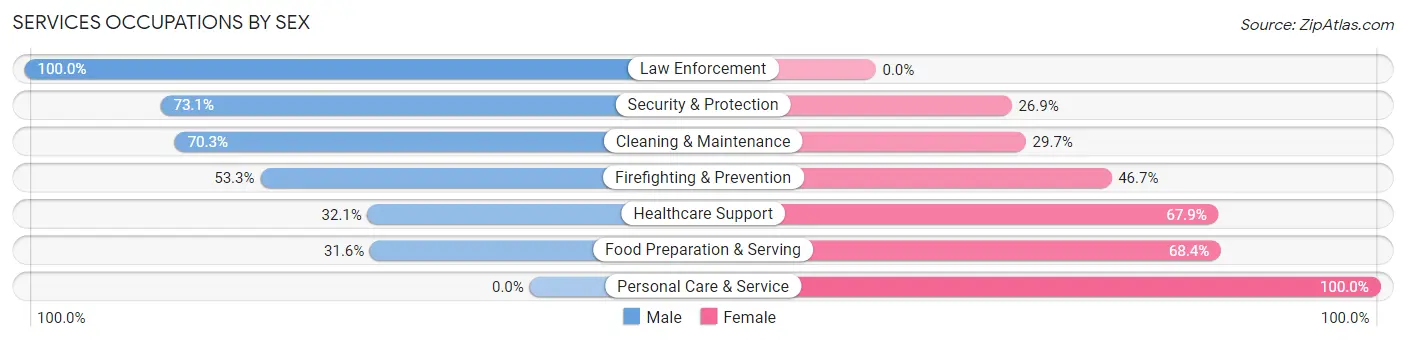
Within the Services occupations in Badin, the most male-oriented occupations are Law Enforcement (100.0%), Security & Protection (73.1%), and Cleaning & Maintenance (70.3%), while the most female-oriented occupations are Personal Care & Service (100.0%), Food Preparation & Serving (68.4%), and Healthcare Support (67.9%).
| Occupation | Male | Female |
| Healthcare Support | 17 (32.1%) | 36 (67.9%) |
| Security & Protection | 19 (73.1%) | 7 (26.9%) |
| Firefighting & Prevention | 8 (53.3%) | 7 (46.7%) |
| Law Enforcement | 11 (100.0%) | 0 (0.0%) |
| Food Preparation & Serving | 6 (31.6%) | 13 (68.4%) |
| Cleaning & Maintenance | 26 (70.3%) | 11 (29.7%) |
| Personal Care & Service | 0 (0.0%) | 9 (100.0%) |
| Total (Category) | 68 (47.2%) | 76 (52.8%) |
| Total (Overall) | 203 (48.1%) | 219 (51.9%) |
Sales and Office Occupations
The most common Sales and Office occupations in Badin are Office & Administration (29 | 6.9%), and Sales & Related (28 | 6.6%).
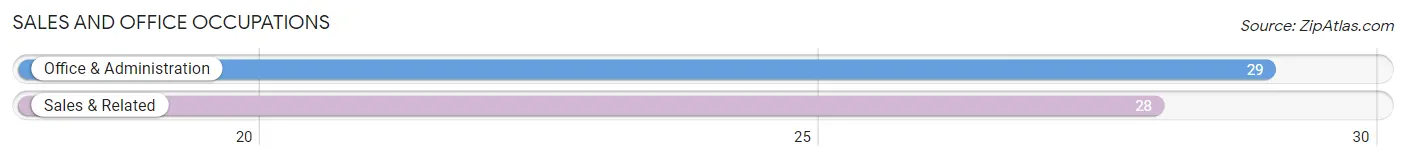
Sales and Office Occupations by Sex
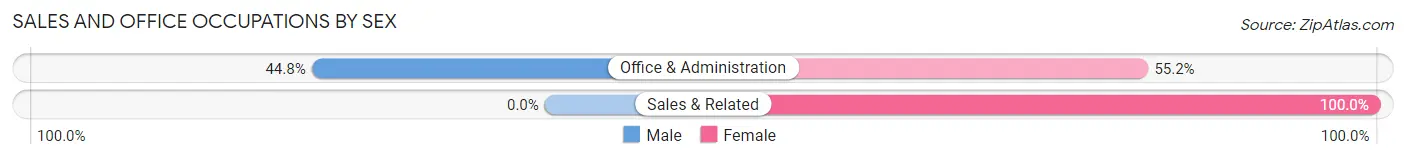
| Occupation | Male | Female |
| Sales & Related | 0 (0.0%) | 28 (100.0%) |
| Office & Administration | 13 (44.8%) | 16 (55.2%) |
| Total (Category) | 13 (22.8%) | 44 (77.2%) |
| Total (Overall) | 203 (48.1%) | 219 (51.9%) |
Natural Resources, Construction and Maintenance Occupations
The most common Natural Resources, Construction and Maintenance occupations in Badin are Construction & Extraction (26 | 6.2%), and Installation, Maintenance & Repair (15 | 3.5%).
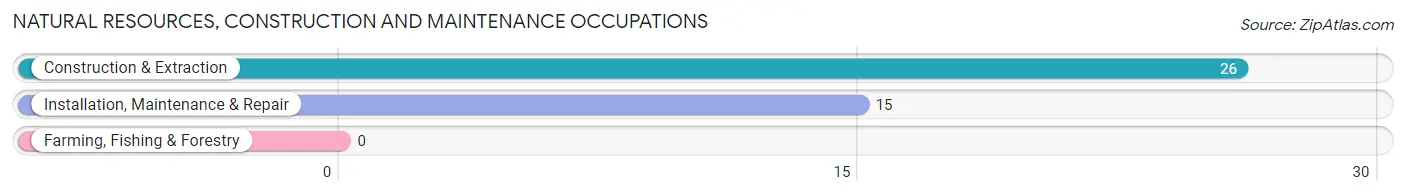
Natural Resources, Construction and Maintenance Occupations by Sex
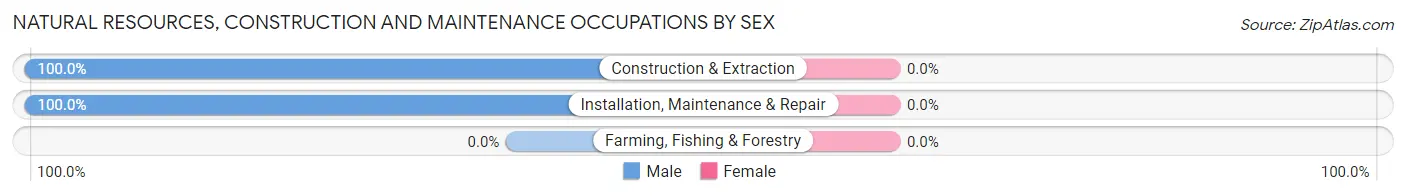
| Occupation | Male | Female |
| Farming, Fishing & Forestry | 0 (0.0%) | 0 (0.0%) |
| Construction & Extraction | 26 (100.0%) | 0 (0.0%) |
| Installation, Maintenance & Repair | 15 (100.0%) | 0 (0.0%) |
| Total (Category) | 41 (100.0%) | 0 (0.0%) |
| Total (Overall) | 203 (48.1%) | 219 (51.9%) |
Production, Transportation and Moving Occupations
The most common Production, Transportation and Moving occupations in Badin are Production (53 | 12.6%), Transportation (25 | 5.9%), and Material Moving (6 | 1.4%).
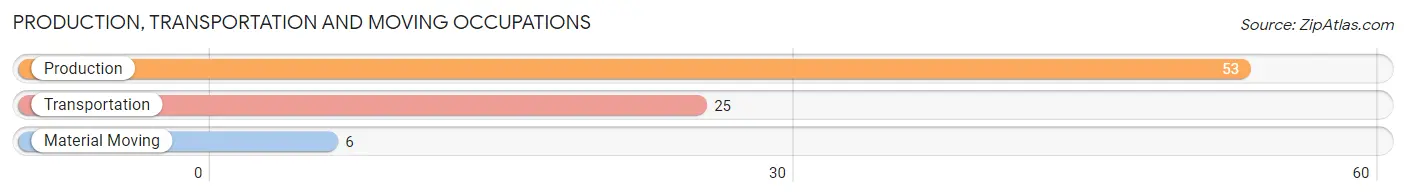
Production, Transportation and Moving Occupations by Sex
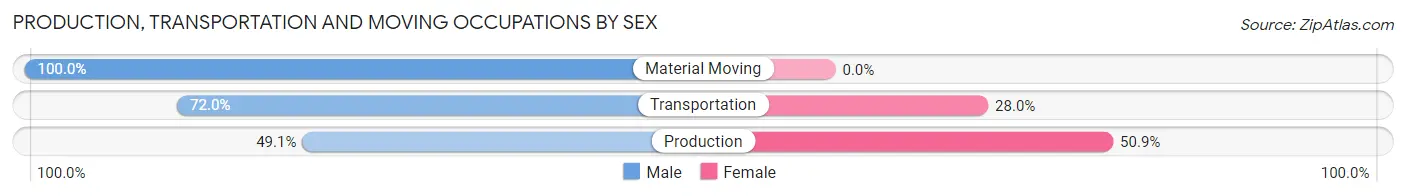
| Occupation | Male | Female |
| Production | 26 (49.1%) | 27 (50.9%) |
| Transportation | 18 (72.0%) | 7 (28.0%) |
| Material Moving | 6 (100.0%) | 0 (0.0%) |
| Total (Category) | 50 (59.5%) | 34 (40.5%) |
| Total (Overall) | 203 (48.1%) | 219 (51.9%) |
Employment Industries by Sex in Badin
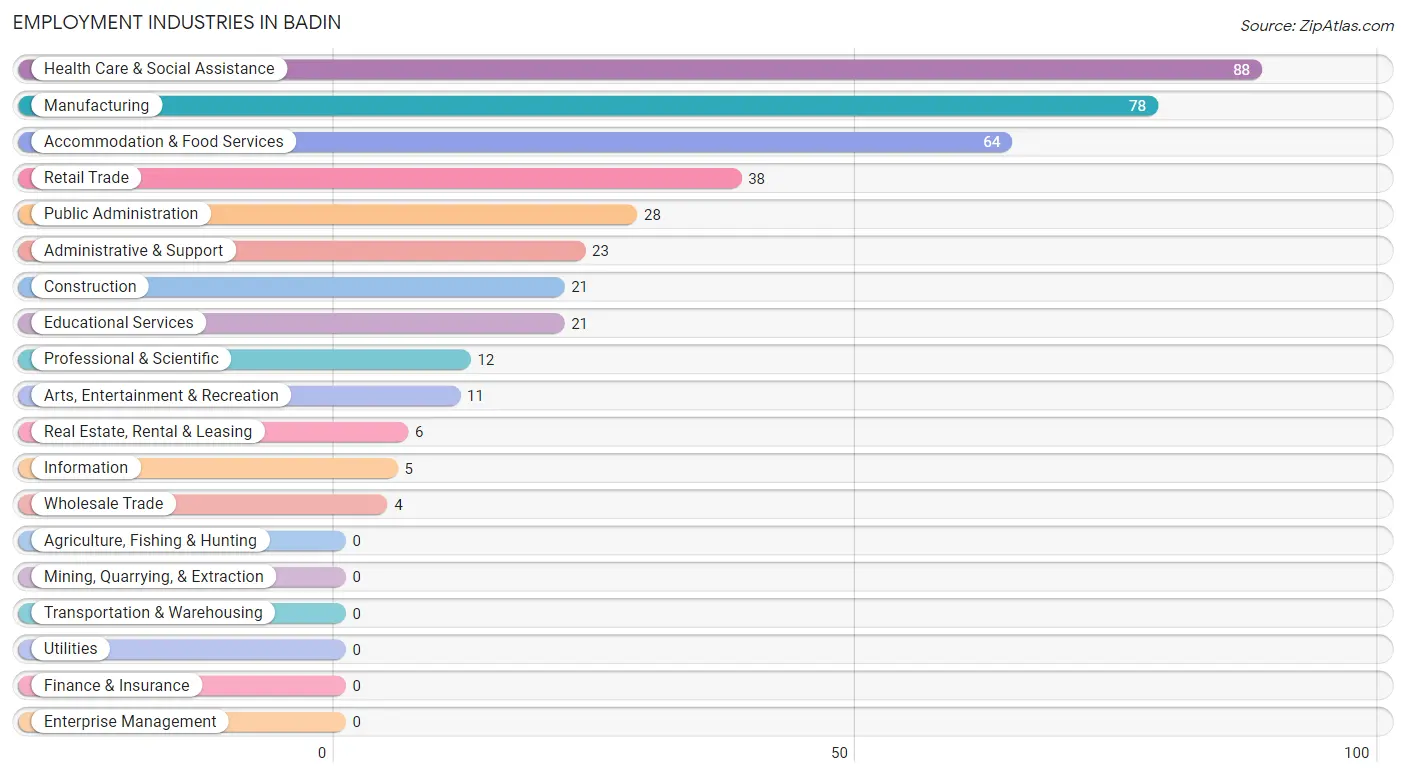
Employment Industries in Badin
The major employment industries in Badin include Health Care & Social Assistance (88 | 20.8%), Manufacturing (78 | 18.5%), Accommodation & Food Services (64 | 15.2%), Retail Trade (38 | 9.0%), and Public Administration (28 | 6.6%).
Employment Industries by Sex in Badin
The Badin industries that see more men than women are Information (100.0%), Arts, Entertainment & Recreation (100.0%), and Manufacturing (78.2%), whereas the industries that tend to have a higher number of women are Wholesale Trade (100.0%), Real Estate, Rental & Leasing (100.0%), and Retail Trade (76.3%).
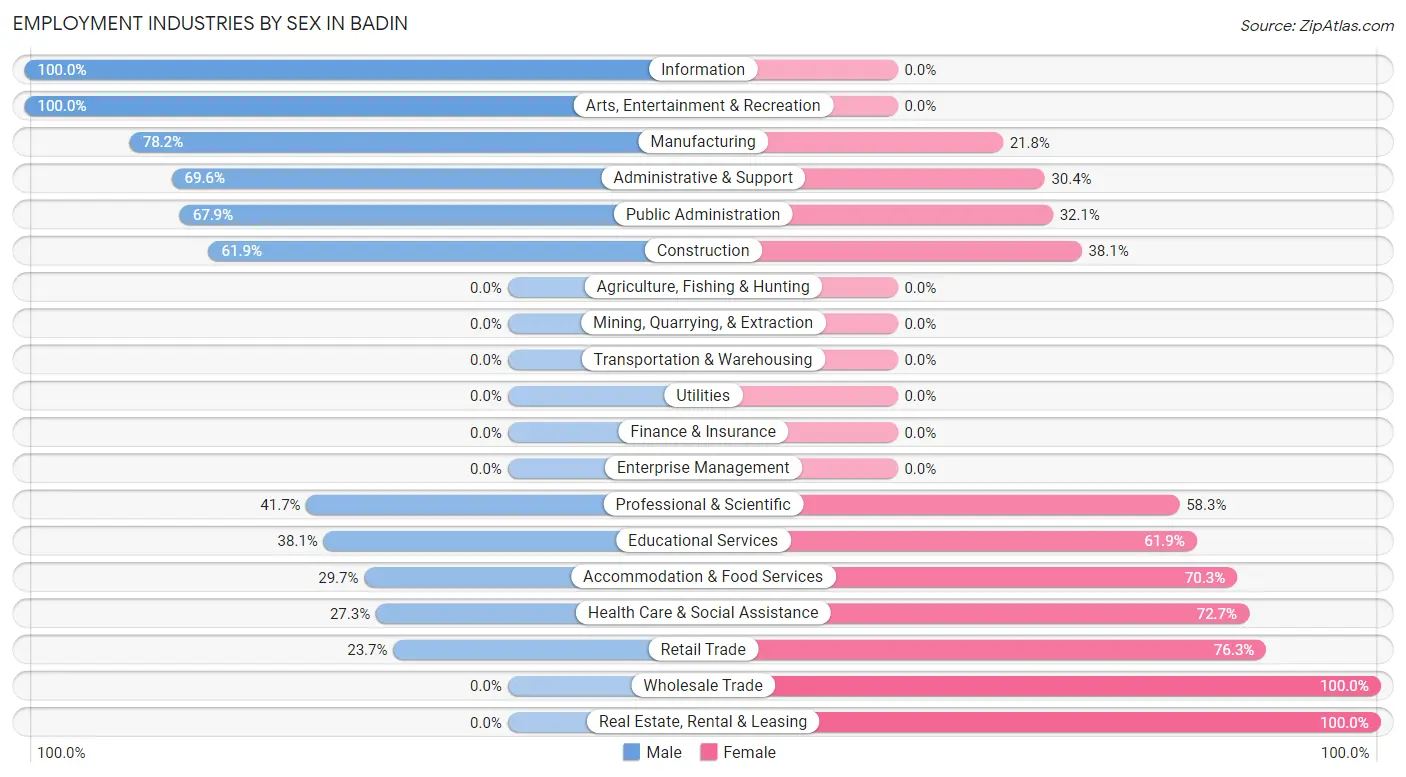
| Industry | Male | Female |
| Agriculture, Fishing & Hunting | 0 (0.0%) | 0 (0.0%) |
| Mining, Quarrying, & Extraction | 0 (0.0%) | 0 (0.0%) |
| Construction | 13 (61.9%) | 8 (38.1%) |
| Manufacturing | 61 (78.2%) | 17 (21.8%) |
| Wholesale Trade | 0 (0.0%) | 4 (100.0%) |
| Retail Trade | 9 (23.7%) | 29 (76.3%) |
| Transportation & Warehousing | 0 (0.0%) | 0 (0.0%) |
| Utilities | 0 (0.0%) | 0 (0.0%) |
| Information | 5 (100.0%) | 0 (0.0%) |
| Finance & Insurance | 0 (0.0%) | 0 (0.0%) |
| Real Estate, Rental & Leasing | 0 (0.0%) | 6 (100.0%) |
| Professional & Scientific | 5 (41.7%) | 7 (58.3%) |
| Enterprise Management | 0 (0.0%) | 0 (0.0%) |
| Administrative & Support | 16 (69.6%) | 7 (30.4%) |
| Educational Services | 8 (38.1%) | 13 (61.9%) |
| Health Care & Social Assistance | 24 (27.3%) | 64 (72.7%) |
| Arts, Entertainment & Recreation | 11 (100.0%) | 0 (0.0%) |
| Accommodation & Food Services | 19 (29.7%) | 45 (70.3%) |
| Public Administration | 19 (67.9%) | 9 (32.1%) |
| Total | 203 (48.1%) | 219 (51.9%) |
Education in Badin
School Enrollment in Badin
The most common levels of schooling among the 381 students in Badin are elementary school (103 | 27.0%), high school (87 | 22.8%), and middle school (79 | 20.7%).
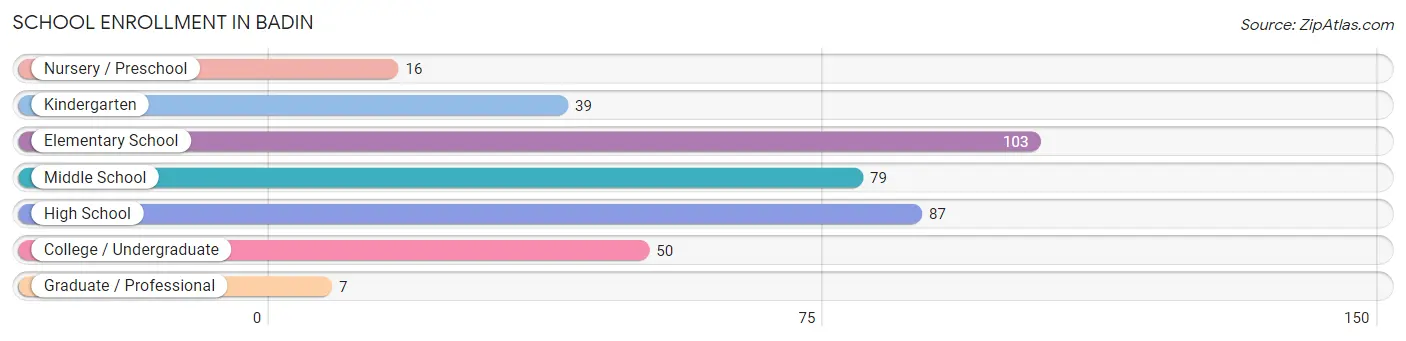
| School Level | # Students | % Students |
| Nursery / Preschool | 16 | 4.2% |
| Kindergarten | 39 | 10.2% |
| Elementary School | 103 | 27.0% |
| Middle School | 79 | 20.7% |
| High School | 87 | 22.8% |
| College / Undergraduate | 50 | 13.1% |
| Graduate / Professional | 7 | 1.8% |
| Total | 381 | 100.0% |
School Enrollment by Age by Funding Source in Badin
Out of a total of 381 students who are enrolled in schools in Badin, 106 (27.8%) attend a private institution, while the remaining 275 (72.2%) are enrolled in public schools. The age group of 25 to 34 year olds has the highest likelihood of being enrolled in private schools, with 21 (80.8% in the age bracket) enrolled. Conversely, the age group of 3 to 4 year olds has the lowest likelihood of being enrolled in a private school, with 5 (100.0% in the age bracket) attending a public institution.
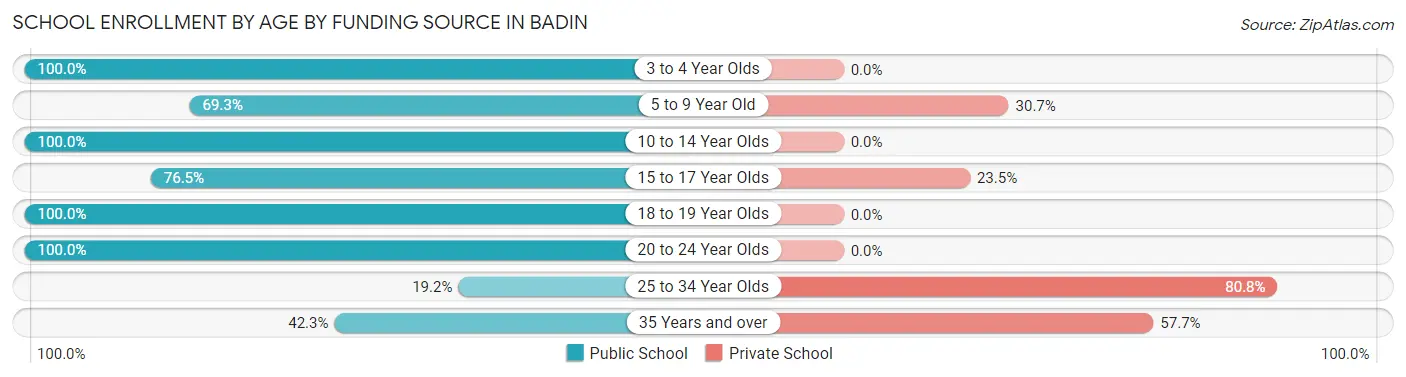
| Age Bracket | Public School | Private School |
| 3 to 4 Year Olds | 5 (100.0%) | 0 (0.0%) |
| 5 to 9 Year Old | 106 (69.3%) | 47 (30.7%) |
| 10 to 14 Year Olds | 83 (100.0%) | 0 (0.0%) |
| 15 to 17 Year Olds | 26 (76.5%) | 8 (23.5%) |
| 18 to 19 Year Olds | 14 (100.0%) | 0 (0.0%) |
| 20 to 24 Year Olds | 14 (100.0%) | 0 (0.0%) |
| 25 to 34 Year Olds | 5 (19.2%) | 21 (80.8%) |
| 35 Years and over | 22 (42.3%) | 30 (57.7%) |
| Total | 275 (72.2%) | 106 (27.8%) |
Educational Attainment by Field of Study in Badin
Education (75 | 46.3%), business (25 | 15.4%), science & technology (15 | 9.3%), psychology (12 | 7.4%), and physical & health sciences (8 | 4.9%) are the most common fields of study among 162 individuals in Badin who have obtained a bachelor's degree or higher.
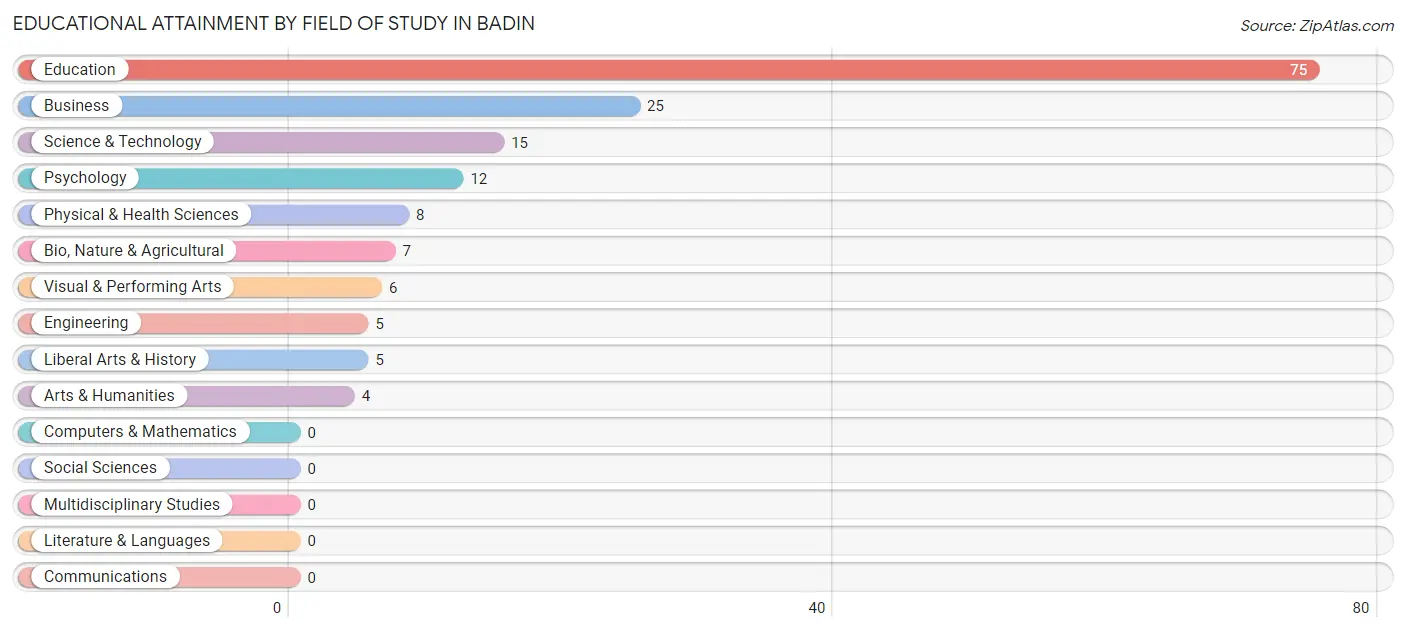
| Field of Study | # Graduates | % Graduates |
| Computers & Mathematics | 0 | 0.0% |
| Bio, Nature & Agricultural | 7 | 4.3% |
| Physical & Health Sciences | 8 | 4.9% |
| Psychology | 12 | 7.4% |
| Social Sciences | 0 | 0.0% |
| Engineering | 5 | 3.1% |
| Multidisciplinary Studies | 0 | 0.0% |
| Science & Technology | 15 | 9.3% |
| Business | 25 | 15.4% |
| Education | 75 | 46.3% |
| Literature & Languages | 0 | 0.0% |
| Liberal Arts & History | 5 | 3.1% |
| Visual & Performing Arts | 6 | 3.7% |
| Communications | 0 | 0.0% |
| Arts & Humanities | 4 | 2.5% |
| Total | 162 | 100.0% |
Transportation & Commute in Badin
Vehicle Availability by Sex in Badin
The most prevalent vehicle ownership categories in Badin are males with 2 vehicles (109, accounting for 54.8%) and females with 2 vehicles (82, making up 50.5%).
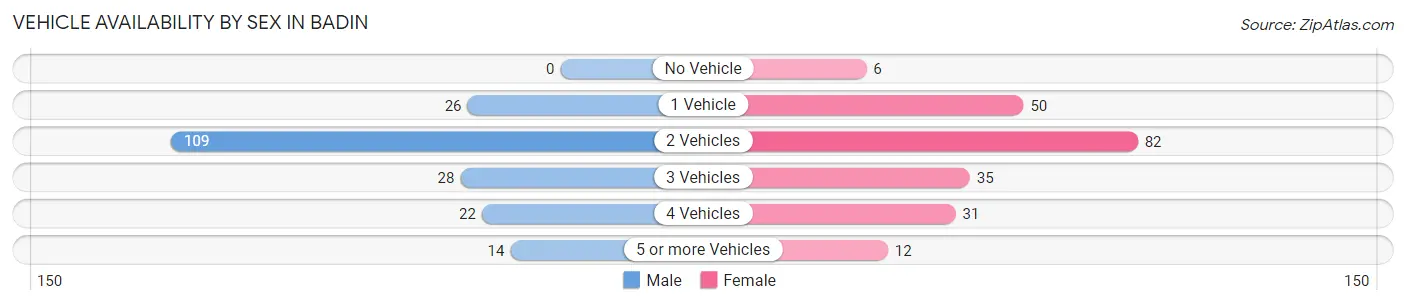
| Vehicles Available | Male | Female |
| No Vehicle | 0 (0.0%) | 6 (2.8%) |
| 1 Vehicle | 26 (13.1%) | 50 (23.2%) |
| 2 Vehicles | 109 (54.8%) | 82 (38.0%) |
| 3 Vehicles | 28 (14.1%) | 35 (16.2%) |
| 4 Vehicles | 22 (11.1%) | 31 (14.3%) |
| 5 or more Vehicles | 14 (7.0%) | 12 (5.6%) |
| Total | 199 (100.0%) | 216 (100.0%) |
Commute Time in Badin
The most frequently occuring commute durations in Badin are 10 to 14 minutes (98 commuters, 24.8%), 15 to 19 minutes (84 commuters, 21.3%), and 45 to 59 minutes (43 commuters, 10.9%).
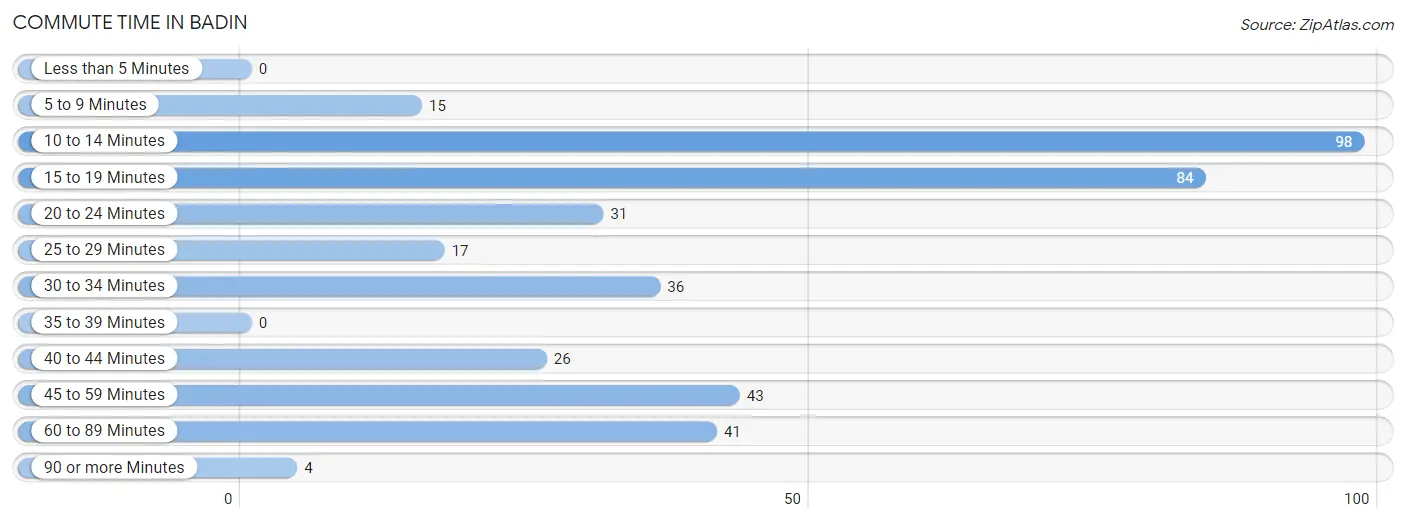
| Commute Time | # Commuters | % Commuters |
| Less than 5 Minutes | 0 | 0.0% |
| 5 to 9 Minutes | 15 | 3.8% |
| 10 to 14 Minutes | 98 | 24.8% |
| 15 to 19 Minutes | 84 | 21.3% |
| 20 to 24 Minutes | 31 | 7.9% |
| 25 to 29 Minutes | 17 | 4.3% |
| 30 to 34 Minutes | 36 | 9.1% |
| 35 to 39 Minutes | 0 | 0.0% |
| 40 to 44 Minutes | 26 | 6.6% |
| 45 to 59 Minutes | 43 | 10.9% |
| 60 to 89 Minutes | 41 | 10.4% |
| 90 or more Minutes | 4 | 1.0% |
Commute Time by Sex in Badin
The most common commute times in Badin are 15 to 19 minutes (51 commuters, 26.3%) for males and 10 to 14 minutes (49 commuters, 24.4%) for females.
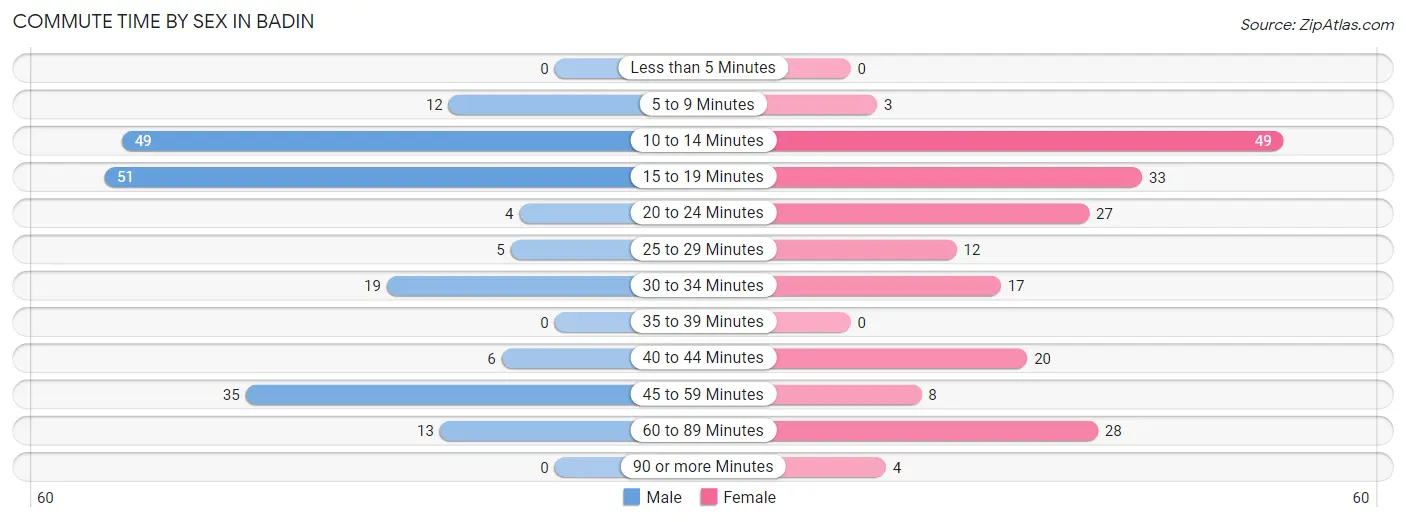
| Commute Time | Male | Female |
| Less than 5 Minutes | 0 (0.0%) | 0 (0.0%) |
| 5 to 9 Minutes | 12 (6.2%) | 3 (1.5%) |
| 10 to 14 Minutes | 49 (25.3%) | 49 (24.4%) |
| 15 to 19 Minutes | 51 (26.3%) | 33 (16.4%) |
| 20 to 24 Minutes | 4 (2.1%) | 27 (13.4%) |
| 25 to 29 Minutes | 5 (2.6%) | 12 (6.0%) |
| 30 to 34 Minutes | 19 (9.8%) | 17 (8.5%) |
| 35 to 39 Minutes | 0 (0.0%) | 0 (0.0%) |
| 40 to 44 Minutes | 6 (3.1%) | 20 (10.0%) |
| 45 to 59 Minutes | 35 (18.0%) | 8 (4.0%) |
| 60 to 89 Minutes | 13 (6.7%) | 28 (13.9%) |
| 90 or more Minutes | 0 (0.0%) | 4 (2.0%) |
Time of Departure to Work by Sex in Badin
The most frequent times of departure to work in Badin are 6:30 AM to 6:59 AM (51, 26.3%) for males and 12:00 PM to 3:59 PM (39, 19.4%) for females.
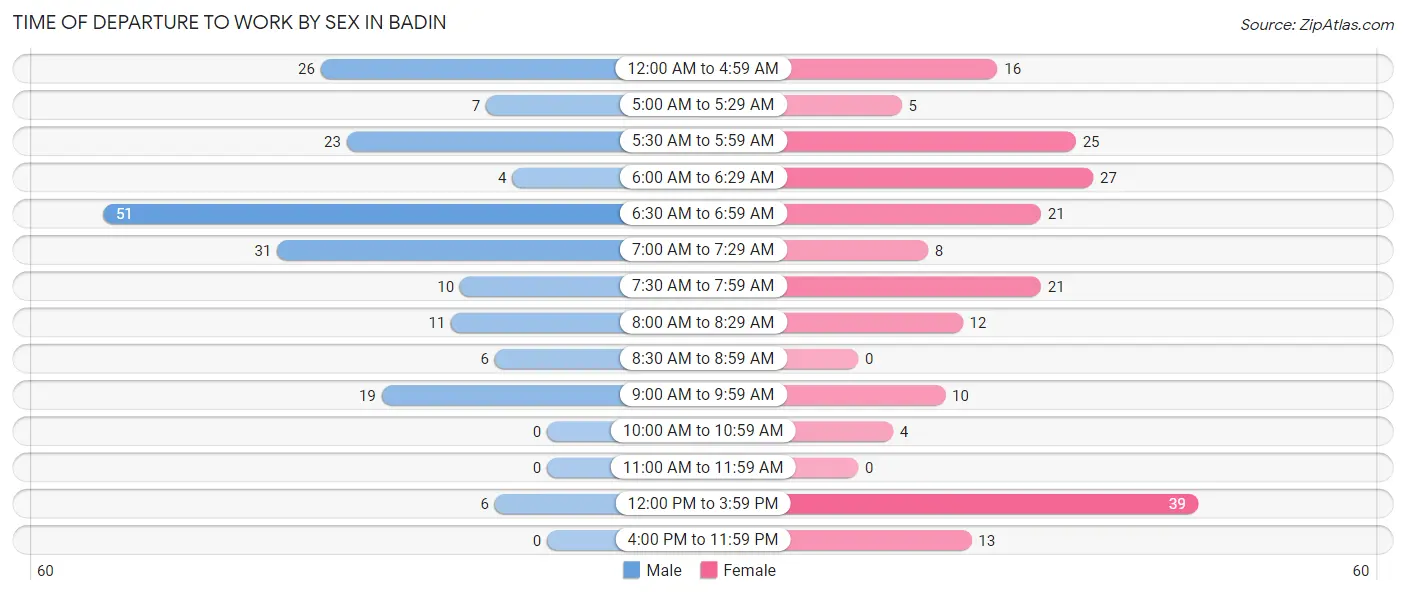
| Time of Departure | Male | Female |
| 12:00 AM to 4:59 AM | 26 (13.4%) | 16 (8.0%) |
| 5:00 AM to 5:29 AM | 7 (3.6%) | 5 (2.5%) |
| 5:30 AM to 5:59 AM | 23 (11.9%) | 25 (12.4%) |
| 6:00 AM to 6:29 AM | 4 (2.1%) | 27 (13.4%) |
| 6:30 AM to 6:59 AM | 51 (26.3%) | 21 (10.4%) |
| 7:00 AM to 7:29 AM | 31 (16.0%) | 8 (4.0%) |
| 7:30 AM to 7:59 AM | 10 (5.1%) | 21 (10.4%) |
| 8:00 AM to 8:29 AM | 11 (5.7%) | 12 (6.0%) |
| 8:30 AM to 8:59 AM | 6 (3.1%) | 0 (0.0%) |
| 9:00 AM to 9:59 AM | 19 (9.8%) | 10 (5.0%) |
| 10:00 AM to 10:59 AM | 0 (0.0%) | 4 (2.0%) |
| 11:00 AM to 11:59 AM | 0 (0.0%) | 0 (0.0%) |
| 12:00 PM to 3:59 PM | 6 (3.1%) | 39 (19.4%) |
| 4:00 PM to 11:59 PM | 0 (0.0%) | 13 (6.5%) |
| Total | 194 (100.0%) | 201 (100.0%) |
Housing Occupancy in Badin
Occupancy by Ownership in Badin
Of the total 424 dwellings in Badin, owner-occupied units account for 297 (70.1%), while renter-occupied units make up 127 (29.9%).
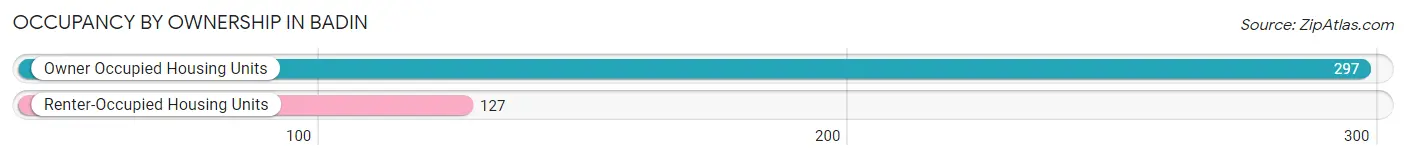
| Occupancy | # Housing Units | % Housing Units |
| Owner Occupied Housing Units | 297 | 70.1% |
| Renter-Occupied Housing Units | 127 | 29.9% |
| Total Occupied Housing Units | 424 | 100.0% |
Occupancy by Household Size in Badin
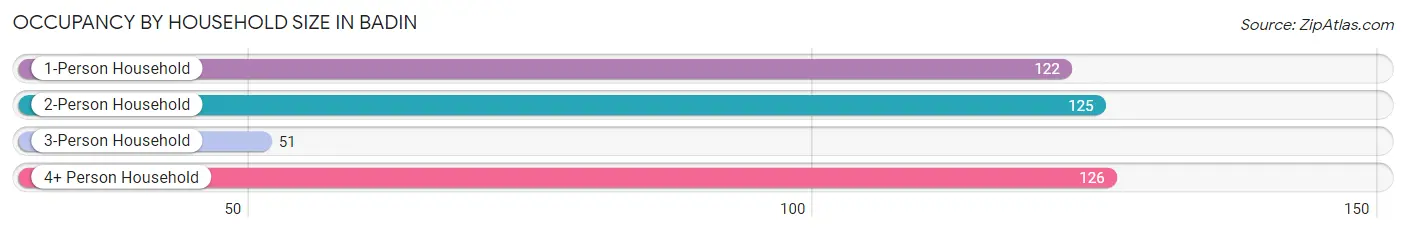
| Household Size | # Housing Units | % Housing Units |
| 1-Person Household | 122 | 28.8% |
| 2-Person Household | 125 | 29.5% |
| 3-Person Household | 51 | 12.0% |
| 4+ Person Household | 126 | 29.7% |
| Total Housing Units | 424 | 100.0% |
Occupancy by Ownership by Household Size in Badin
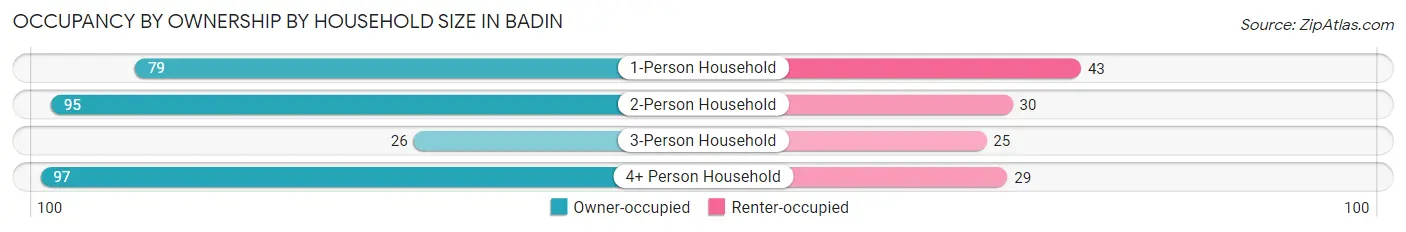
| Household Size | Owner-occupied | Renter-occupied |
| 1-Person Household | 79 (64.7%) | 43 (35.2%) |
| 2-Person Household | 95 (76.0%) | 30 (24.0%) |
| 3-Person Household | 26 (51.0%) | 25 (49.0%) |
| 4+ Person Household | 97 (77.0%) | 29 (23.0%) |
| Total Housing Units | 297 (70.1%) | 127 (29.9%) |
Occupancy by Educational Attainment in Badin
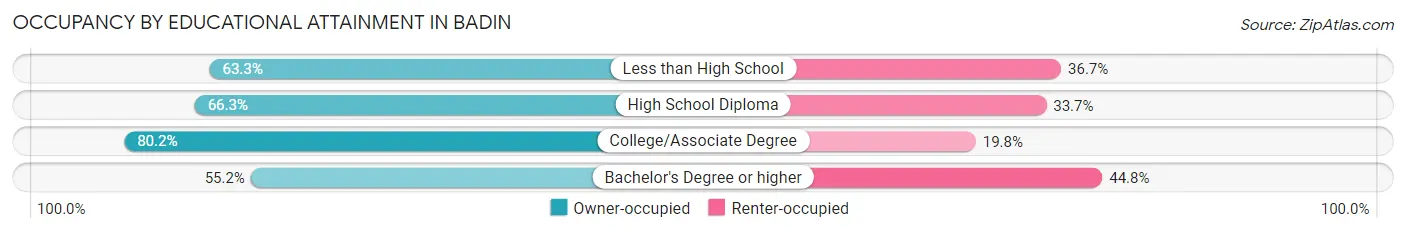
| Household Size | Owner-occupied | Renter-occupied |
| Less than High School | 19 (63.3%) | 11 (36.7%) |
| High School Diploma | 112 (66.3%) | 57 (33.7%) |
| College/Associate Degree | 134 (80.2%) | 33 (19.8%) |
| Bachelor's Degree or higher | 32 (55.2%) | 26 (44.8%) |
Occupancy by Age of Householder in Badin
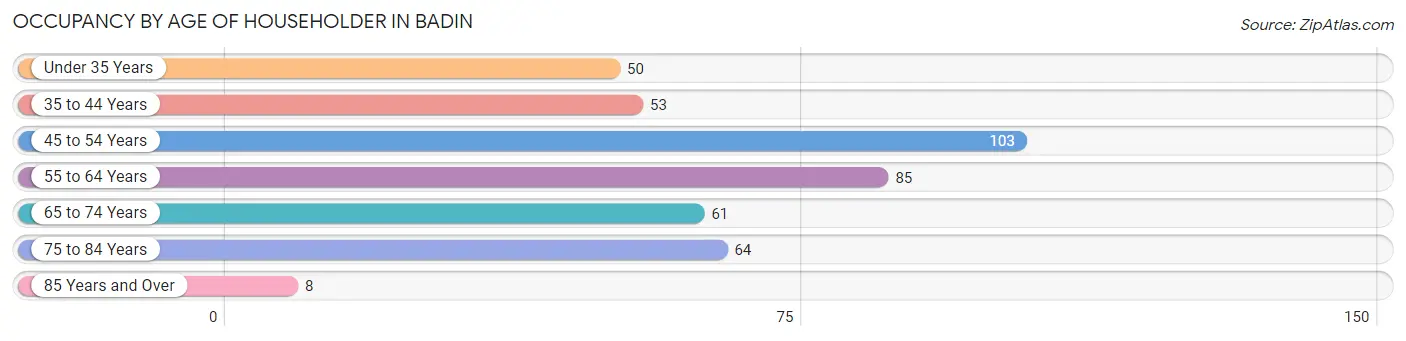
| Age Bracket | # Households | % Households |
| Under 35 Years | 50 | 11.8% |
| 35 to 44 Years | 53 | 12.5% |
| 45 to 54 Years | 103 | 24.3% |
| 55 to 64 Years | 85 | 20.1% |
| 65 to 74 Years | 61 | 14.4% |
| 75 to 84 Years | 64 | 15.1% |
| 85 Years and Over | 8 | 1.9% |
| Total | 424 | 100.0% |
Housing Finances in Badin
Median Income by Occupancy in Badin
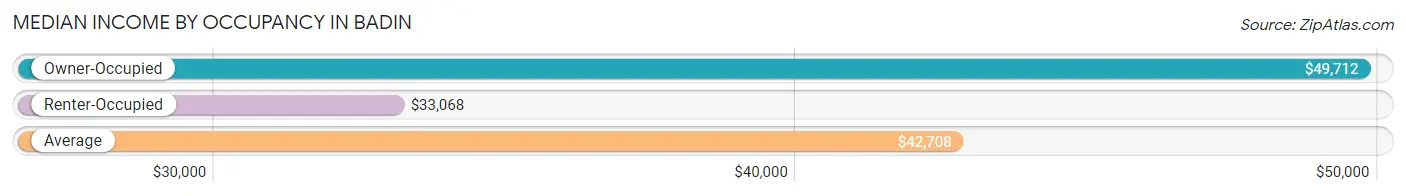
| Occupancy Type | # Households | Median Income |
| Owner-Occupied | 297 (70.1%) | $49,712 |
| Renter-Occupied | 127 (29.9%) | $33,068 |
| Average | 424 (100.0%) | $42,708 |
Occupancy by Householder Income Bracket in Badin
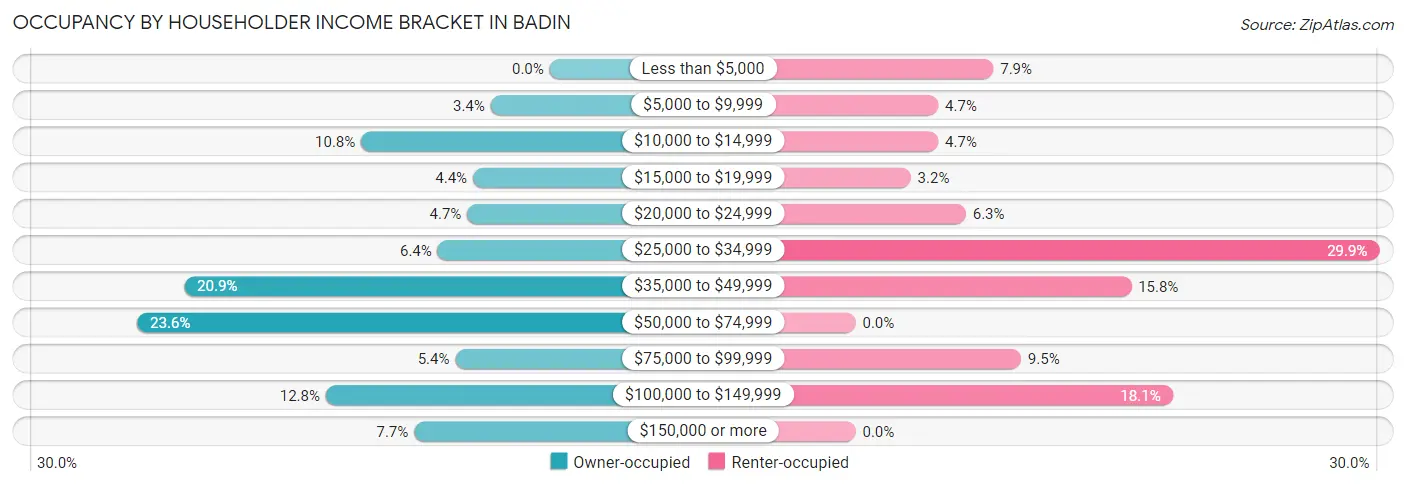
| Income Bracket | Owner-occupied | Renter-occupied |
| Less than $5,000 | 0 (0.0%) | 10 (7.9%) |
| $5,000 to $9,999 | 10 (3.4%) | 6 (4.7%) |
| $10,000 to $14,999 | 32 (10.8%) | 6 (4.7%) |
| $15,000 to $19,999 | 13 (4.4%) | 4 (3.2%) |
| $20,000 to $24,999 | 14 (4.7%) | 8 (6.3%) |
| $25,000 to $34,999 | 19 (6.4%) | 38 (29.9%) |
| $35,000 to $49,999 | 62 (20.9%) | 20 (15.8%) |
| $50,000 to $74,999 | 70 (23.6%) | 0 (0.0%) |
| $75,000 to $99,999 | 16 (5.4%) | 12 (9.5%) |
| $100,000 to $149,999 | 38 (12.8%) | 23 (18.1%) |
| $150,000 or more | 23 (7.7%) | 0 (0.0%) |
| Total | 297 (100.0%) | 127 (100.0%) |
Monthly Housing Cost Tiers in Badin
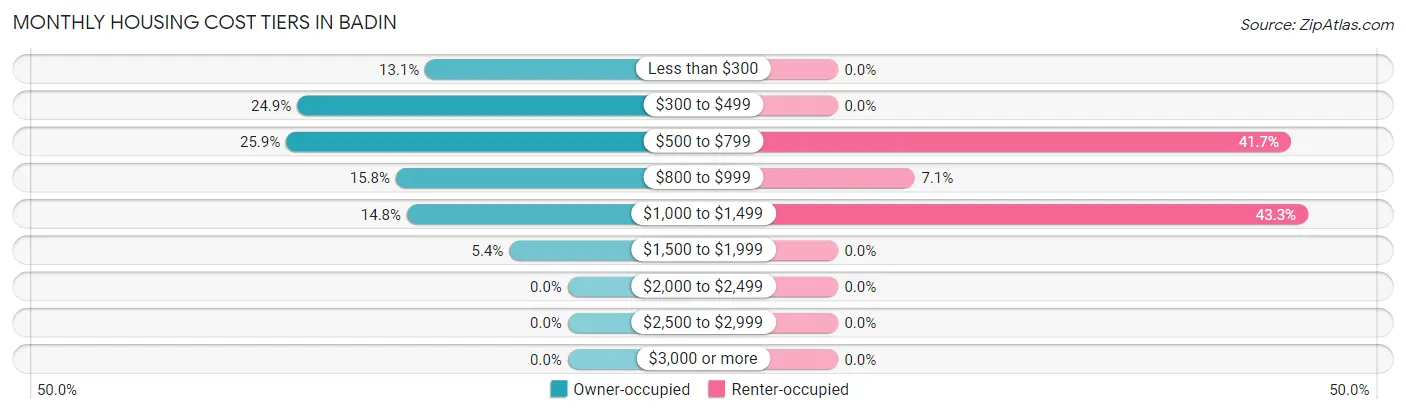
| Monthly Cost | Owner-occupied | Renter-occupied |
| Less than $300 | 39 (13.1%) | 0 (0.0%) |
| $300 to $499 | 74 (24.9%) | 0 (0.0%) |
| $500 to $799 | 77 (25.9%) | 53 (41.7%) |
| $800 to $999 | 47 (15.8%) | 9 (7.1%) |
| $1,000 to $1,499 | 44 (14.8%) | 55 (43.3%) |
| $1,500 to $1,999 | 16 (5.4%) | 0 (0.0%) |
| $2,000 to $2,499 | 0 (0.0%) | 0 (0.0%) |
| $2,500 to $2,999 | 0 (0.0%) | 0 (0.0%) |
| $3,000 or more | 0 (0.0%) | 0 (0.0%) |
| Total | 297 (100.0%) | 127 (100.0%) |
Physical Housing Characteristics in Badin
Housing Structures in Badin
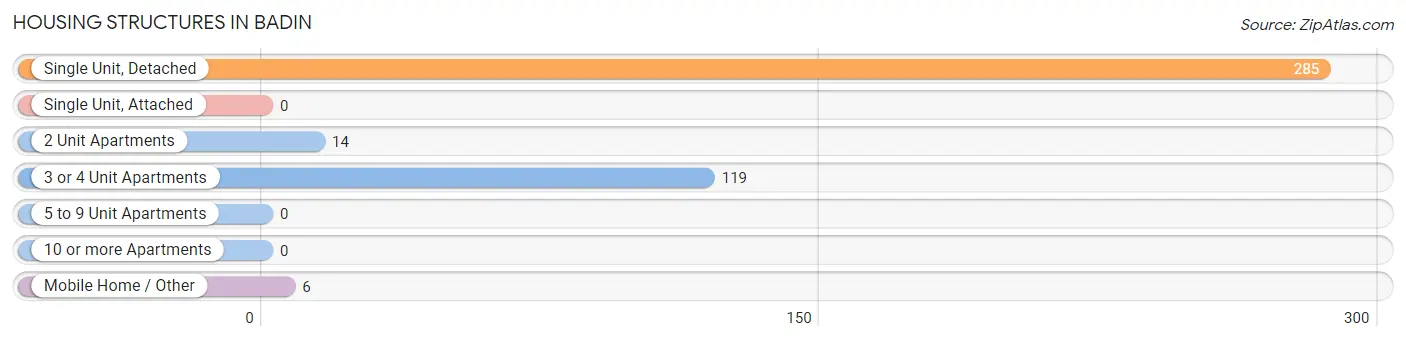
| Structure Type | # Housing Units | % Housing Units |
| Single Unit, Detached | 285 | 67.2% |
| Single Unit, Attached | 0 | 0.0% |
| 2 Unit Apartments | 14 | 3.3% |
| 3 or 4 Unit Apartments | 119 | 28.1% |
| 5 to 9 Unit Apartments | 0 | 0.0% |
| 10 or more Apartments | 0 | 0.0% |
| Mobile Home / Other | 6 | 1.4% |
| Total | 424 | 100.0% |
Housing Structures by Occupancy in Badin
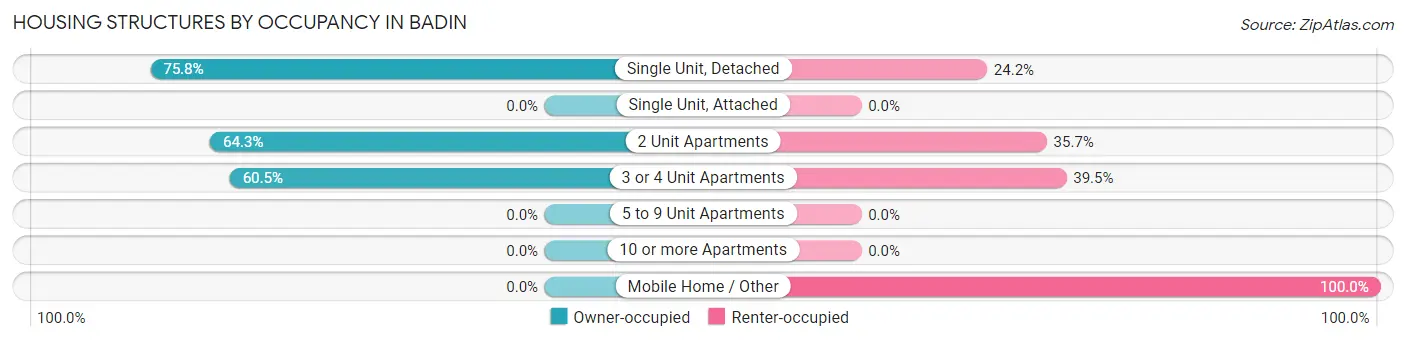
| Structure Type | Owner-occupied | Renter-occupied |
| Single Unit, Detached | 216 (75.8%) | 69 (24.2%) |
| Single Unit, Attached | 0 (0.0%) | 0 (0.0%) |
| 2 Unit Apartments | 9 (64.3%) | 5 (35.7%) |
| 3 or 4 Unit Apartments | 72 (60.5%) | 47 (39.5%) |
| 5 to 9 Unit Apartments | 0 (0.0%) | 0 (0.0%) |
| 10 or more Apartments | 0 (0.0%) | 0 (0.0%) |
| Mobile Home / Other | 0 (0.0%) | 6 (100.0%) |
| Total | 297 (70.1%) | 127 (29.9%) |
Housing Structures by Number of Rooms in Badin
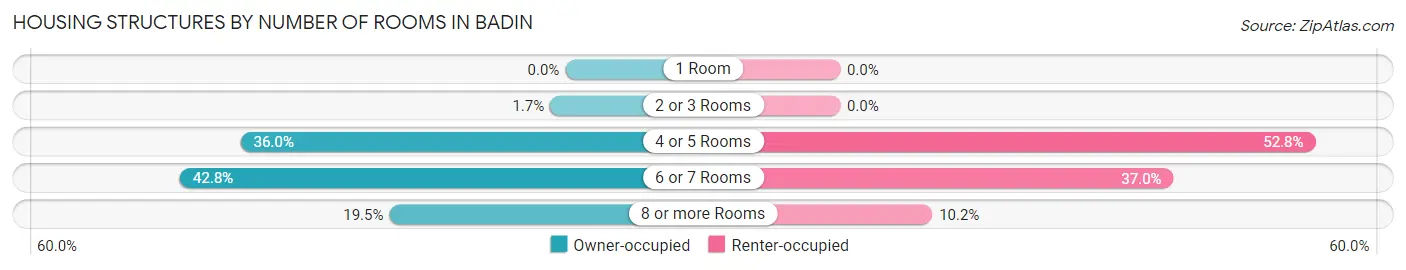
| Number of Rooms | Owner-occupied | Renter-occupied |
| 1 Room | 0 (0.0%) | 0 (0.0%) |
| 2 or 3 Rooms | 5 (1.7%) | 0 (0.0%) |
| 4 or 5 Rooms | 107 (36.0%) | 67 (52.8%) |
| 6 or 7 Rooms | 127 (42.8%) | 47 (37.0%) |
| 8 or more Rooms | 58 (19.5%) | 13 (10.2%) |
| Total | 297 (100.0%) | 127 (100.0%) |
Housing Structure by Heating Type in Badin
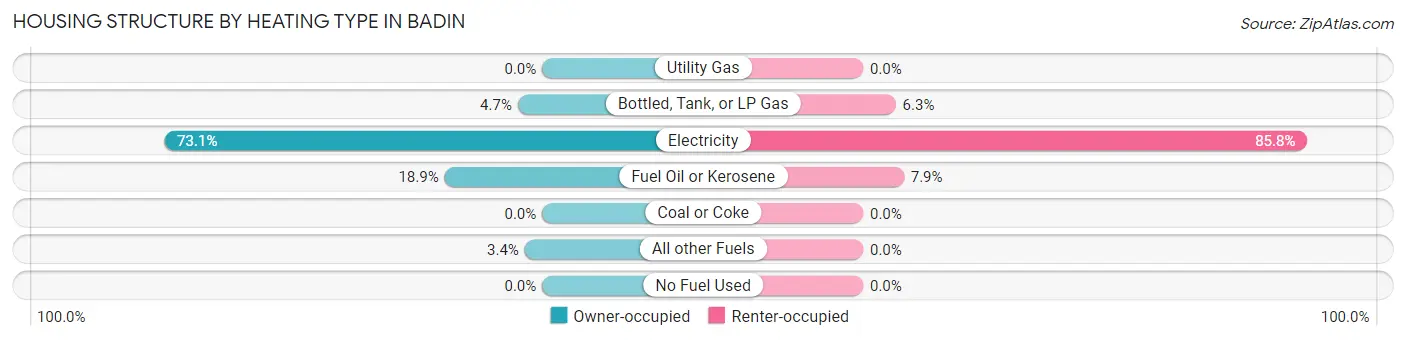
| Heating Type | Owner-occupied | Renter-occupied |
| Utility Gas | 0 (0.0%) | 0 (0.0%) |
| Bottled, Tank, or LP Gas | 14 (4.7%) | 8 (6.3%) |
| Electricity | 217 (73.1%) | 109 (85.8%) |
| Fuel Oil or Kerosene | 56 (18.9%) | 10 (7.9%) |
| Coal or Coke | 0 (0.0%) | 0 (0.0%) |
| All other Fuels | 10 (3.4%) | 0 (0.0%) |
| No Fuel Used | 0 (0.0%) | 0 (0.0%) |
| Total | 297 (100.0%) | 127 (100.0%) |
Household Vehicle Usage in Badin
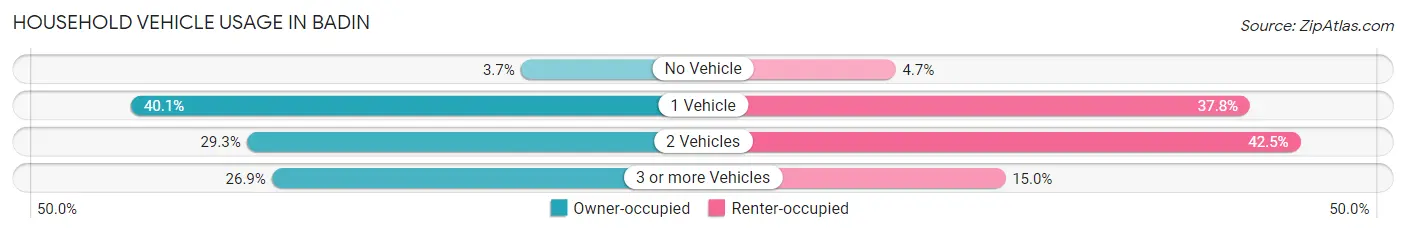
| Vehicles per Household | Owner-occupied | Renter-occupied |
| No Vehicle | 11 (3.7%) | 6 (4.7%) |
| 1 Vehicle | 119 (40.1%) | 48 (37.8%) |
| 2 Vehicles | 87 (29.3%) | 54 (42.5%) |
| 3 or more Vehicles | 80 (26.9%) | 19 (15.0%) |
| Total | 297 (100.0%) | 127 (100.0%) |
Real Estate & Mortgages in Badin
Real Estate and Mortgage Overview in Badin
| Characteristic | Without Mortgage | With Mortgage |
| Housing Units | 135 | 162 |
| Median Property Value | $120,600 | $112,800 |
| Median Household Income | $45,208 | $18 |
| Monthly Housing Costs | $355 | $0 |
| Real Estate Taxes | $907 | $0 |
Property Value by Mortgage Status in Badin
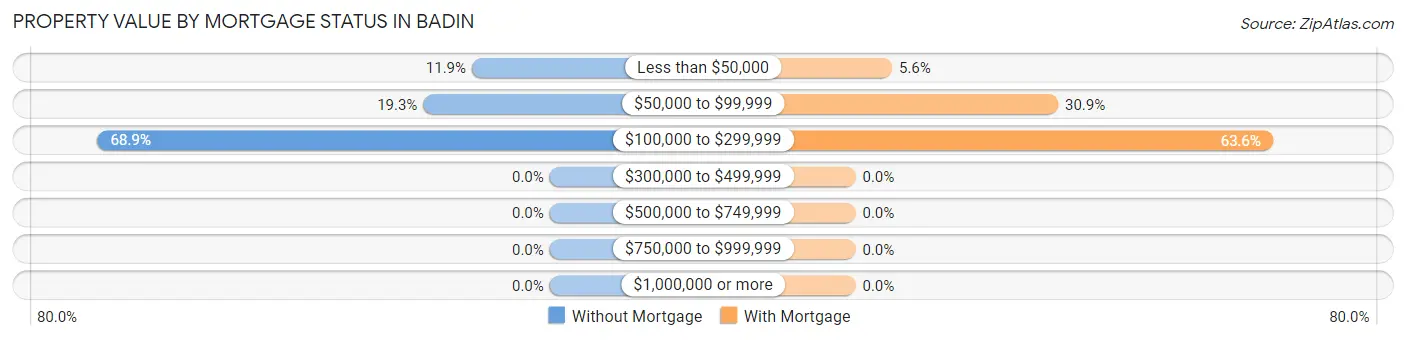
| Property Value | Without Mortgage | With Mortgage |
| Less than $50,000 | 16 (11.8%) | 9 (5.6%) |
| $50,000 to $99,999 | 26 (19.3%) | 50 (30.9%) |
| $100,000 to $299,999 | 93 (68.9%) | 103 (63.6%) |
| $300,000 to $499,999 | 0 (0.0%) | 0 (0.0%) |
| $500,000 to $749,999 | 0 (0.0%) | 0 (0.0%) |
| $750,000 to $999,999 | 0 (0.0%) | 0 (0.0%) |
| $1,000,000 or more | 0 (0.0%) | 0 (0.0%) |
| Total | 135 (100.0%) | 162 (100.0%) |
Household Income by Mortgage Status in Badin
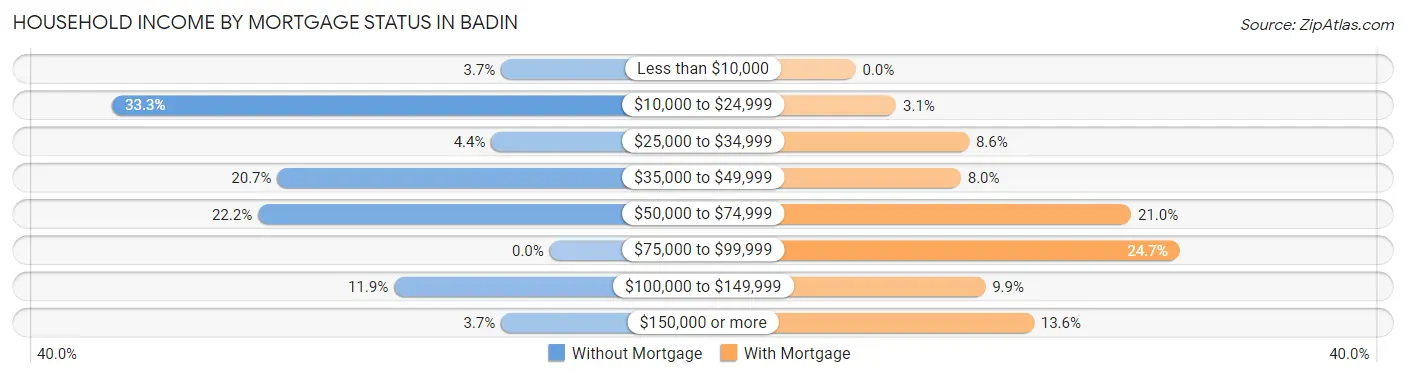
| Household Income | Without Mortgage | With Mortgage |
| Less than $10,000 | 5 (3.7%) | 0 (0.0%) |
| $10,000 to $24,999 | 45 (33.3%) | 5 (3.1%) |
| $25,000 to $34,999 | 6 (4.4%) | 14 (8.6%) |
| $35,000 to $49,999 | 28 (20.7%) | 13 (8.0%) |
| $50,000 to $74,999 | 30 (22.2%) | 34 (21.0%) |
| $75,000 to $99,999 | 0 (0.0%) | 40 (24.7%) |
| $100,000 to $149,999 | 16 (11.8%) | 16 (9.9%) |
| $150,000 or more | 5 (3.7%) | 22 (13.6%) |
| Total | 135 (100.0%) | 162 (100.0%) |
Property Value to Household Income Ratio in Badin
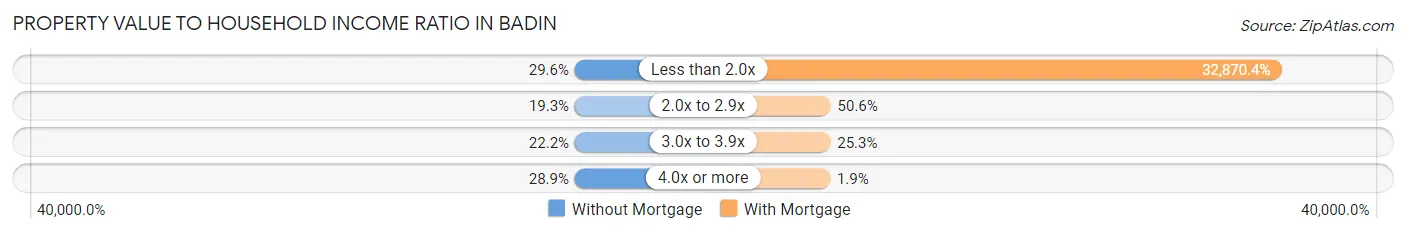
| Value-to-Income Ratio | Without Mortgage | With Mortgage |
| Less than 2.0x | 40 (29.6%) | 53,250 (32,870.4%) |
| 2.0x to 2.9x | 26 (19.3%) | 82 (50.6%) |
| 3.0x to 3.9x | 30 (22.2%) | 41 (25.3%) |
| 4.0x or more | 39 (28.9%) | 3 (1.8%) |
| Total | 135 (100.0%) | 162 (100.0%) |
Real Estate Taxes by Mortgage Status in Badin
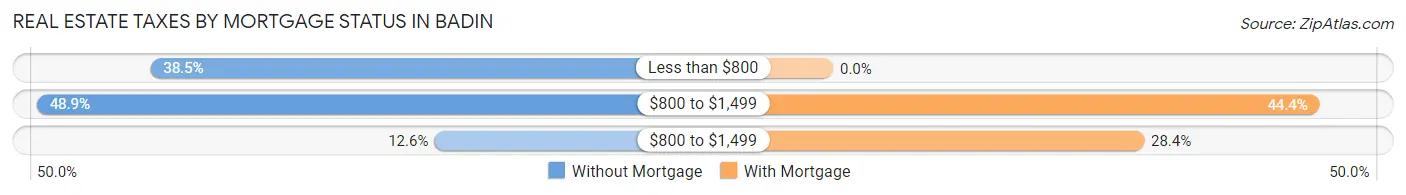
| Property Taxes | Without Mortgage | With Mortgage |
| Less than $800 | 52 (38.5%) | 0 (0.0%) |
| $800 to $1,499 | 66 (48.9%) | 72 (44.4%) |
| $800 to $1,499 | 17 (12.6%) | 46 (28.4%) |
| Total | 135 (100.0%) | 162 (100.0%) |
Health & Disability in Badin
Health Insurance Coverage by Age in Badin
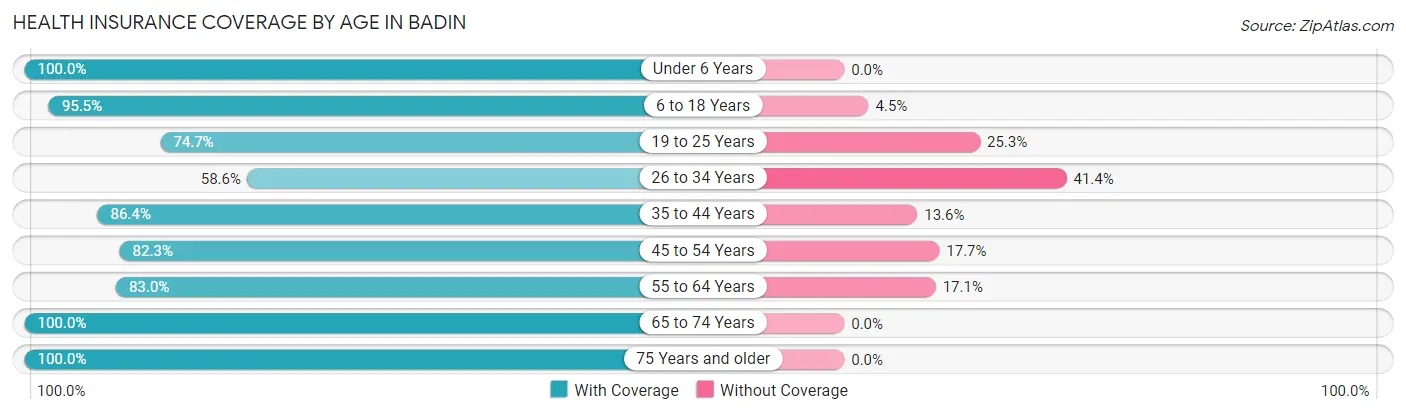
| Age Bracket | With Coverage | Without Coverage |
| Under 6 Years | 114 (100.0%) | 0 (0.0%) |
| 6 to 18 Years | 232 (95.5%) | 11 (4.5%) |
| 19 to 25 Years | 56 (74.7%) | 19 (25.3%) |
| 26 to 34 Years | 65 (58.6%) | 46 (41.4%) |
| 35 to 44 Years | 127 (86.4%) | 20 (13.6%) |
| 45 to 54 Years | 167 (82.3%) | 36 (17.7%) |
| 55 to 64 Years | 107 (83.0%) | 22 (17.1%) |
| 65 to 74 Years | 94 (100.0%) | 0 (0.0%) |
| 75 Years and older | 93 (100.0%) | 0 (0.0%) |
| Total | 1,055 (87.3%) | 154 (12.7%) |
Health Insurance Coverage by Citizenship Status in Badin
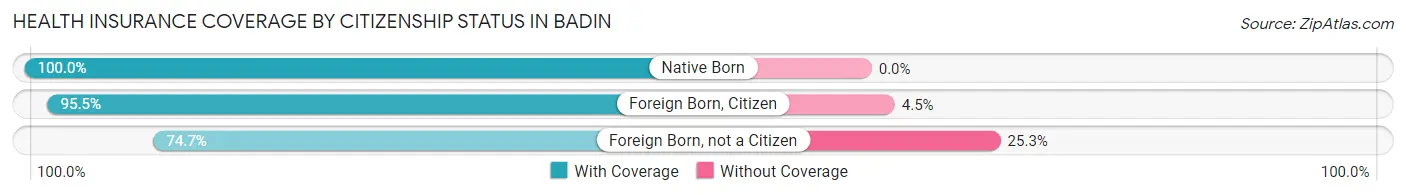
| Citizenship Status | With Coverage | Without Coverage |
| Native Born | 114 (100.0%) | 0 (0.0%) |
| Foreign Born, Citizen | 232 (95.5%) | 11 (4.5%) |
| Foreign Born, not a Citizen | 56 (74.7%) | 19 (25.3%) |
Health Insurance Coverage by Household Income in Badin
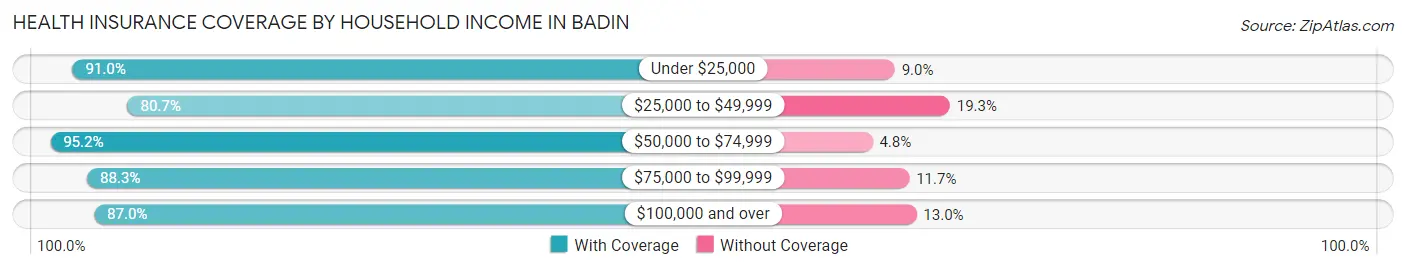
| Household Income | With Coverage | Without Coverage |
| Under $25,000 | 233 (91.0%) | 23 (9.0%) |
| $25,000 to $49,999 | 301 (80.7%) | 72 (19.3%) |
| $50,000 to $74,999 | 178 (95.2%) | 9 (4.8%) |
| $75,000 to $99,999 | 83 (88.3%) | 11 (11.7%) |
| $100,000 and over | 260 (87.0%) | 39 (13.0%) |
Public vs Private Health Insurance Coverage by Age in Badin
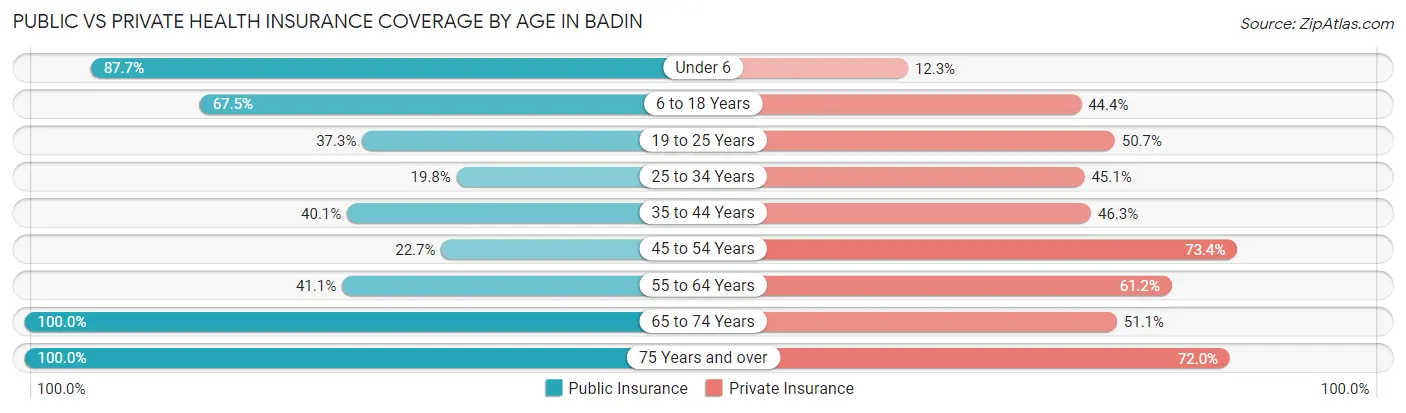
| Age Bracket | Public Insurance | Private Insurance |
| Under 6 | 100 (87.7%) | 14 (12.3%) |
| 6 to 18 Years | 164 (67.5%) | 108 (44.4%) |
| 19 to 25 Years | 28 (37.3%) | 38 (50.7%) |
| 25 to 34 Years | 22 (19.8%) | 50 (45.1%) |
| 35 to 44 Years | 59 (40.1%) | 68 (46.3%) |
| 45 to 54 Years | 46 (22.7%) | 149 (73.4%) |
| 55 to 64 Years | 53 (41.1%) | 79 (61.2%) |
| 65 to 74 Years | 94 (100.0%) | 48 (51.1%) |
| 75 Years and over | 93 (100.0%) | 67 (72.0%) |
| Total | 659 (54.5%) | 621 (51.4%) |
Disability Status by Sex by Age in Badin
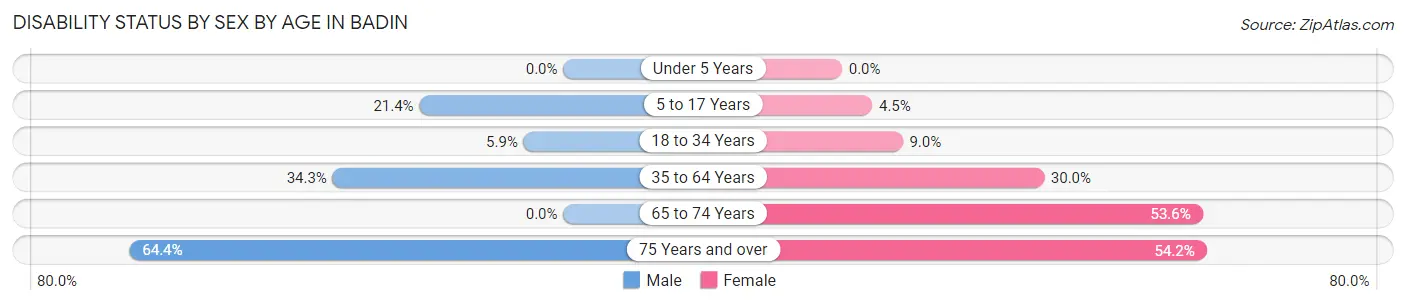
| Age Bracket | Male | Female |
| Under 5 Years | 0 (0.0%) | 0 (0.0%) |
| 5 to 17 Years | 28 (21.4%) | 7 (4.5%) |
| 18 to 34 Years | 5 (5.9%) | 10 (9.0%) |
| 35 to 64 Years | 75 (34.3%) | 78 (30.0%) |
| 65 to 74 Years | 0 (0.0%) | 30 (53.6%) |
| 75 Years and over | 29 (64.4%) | 26 (54.2%) |
Disability Class by Sex by Age in Badin
Disability Class: Hearing Difficulty
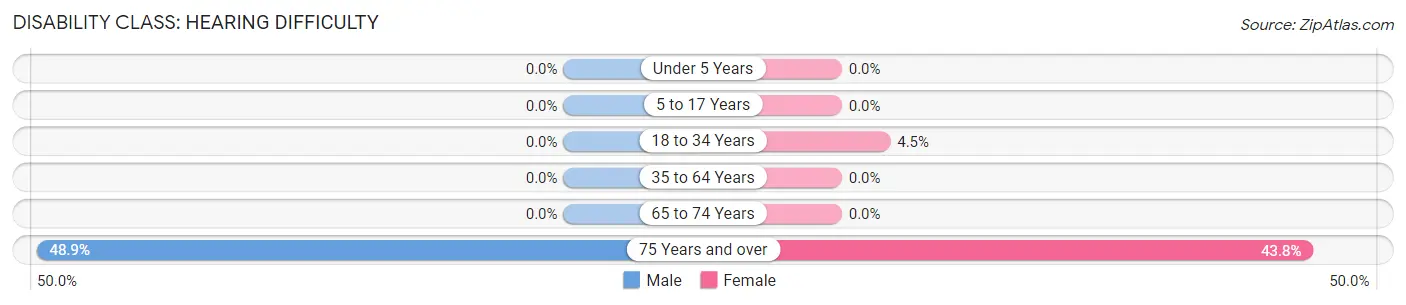
| Age Bracket | Male | Female |
| Under 5 Years | 0 (0.0%) | 0 (0.0%) |
| 5 to 17 Years | 0 (0.0%) | 0 (0.0%) |
| 18 to 34 Years | 0 (0.0%) | 5 (4.5%) |
| 35 to 64 Years | 0 (0.0%) | 0 (0.0%) |
| 65 to 74 Years | 0 (0.0%) | 0 (0.0%) |
| 75 Years and over | 22 (48.9%) | 21 (43.8%) |
Disability Class: Vision Difficulty
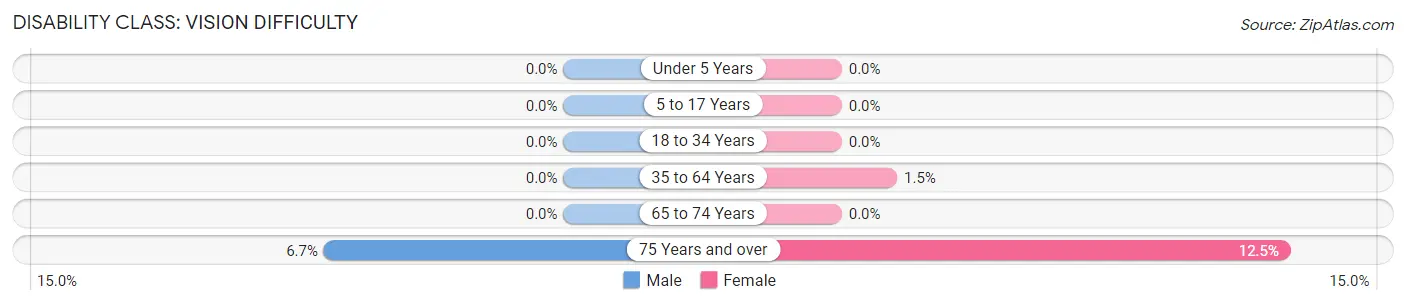
| Age Bracket | Male | Female |
| Under 5 Years | 0 (0.0%) | 0 (0.0%) |
| 5 to 17 Years | 0 (0.0%) | 0 (0.0%) |
| 18 to 34 Years | 0 (0.0%) | 0 (0.0%) |
| 35 to 64 Years | 0 (0.0%) | 4 (1.5%) |
| 65 to 74 Years | 0 (0.0%) | 0 (0.0%) |
| 75 Years and over | 3 (6.7%) | 6 (12.5%) |
Disability Class: Cognitive Difficulty
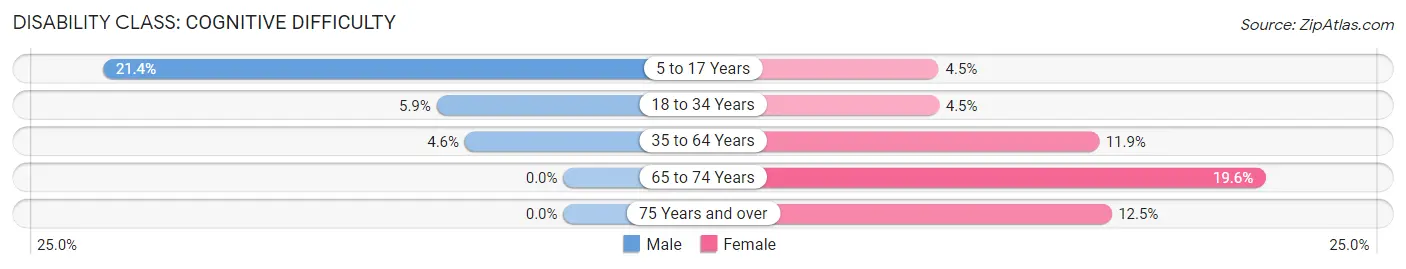
| Age Bracket | Male | Female |
| 5 to 17 Years | 28 (21.4%) | 7 (4.5%) |
| 18 to 34 Years | 5 (5.9%) | 5 (4.5%) |
| 35 to 64 Years | 10 (4.6%) | 31 (11.9%) |
| 65 to 74 Years | 0 (0.0%) | 11 (19.6%) |
| 75 Years and over | 0 (0.0%) | 6 (12.5%) |
Disability Class: Ambulatory Difficulty
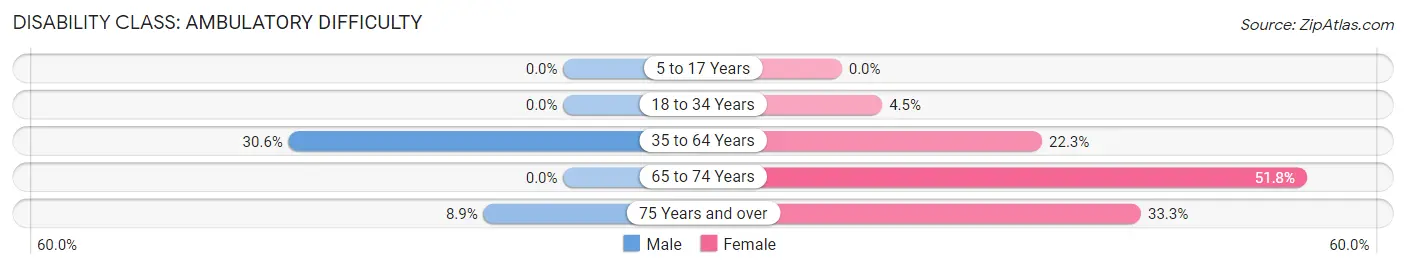
| Age Bracket | Male | Female |
| 5 to 17 Years | 0 (0.0%) | 0 (0.0%) |
| 18 to 34 Years | 0 (0.0%) | 5 (4.5%) |
| 35 to 64 Years | 67 (30.6%) | 58 (22.3%) |
| 65 to 74 Years | 0 (0.0%) | 29 (51.8%) |
| 75 Years and over | 4 (8.9%) | 16 (33.3%) |
Disability Class: Self-Care Difficulty
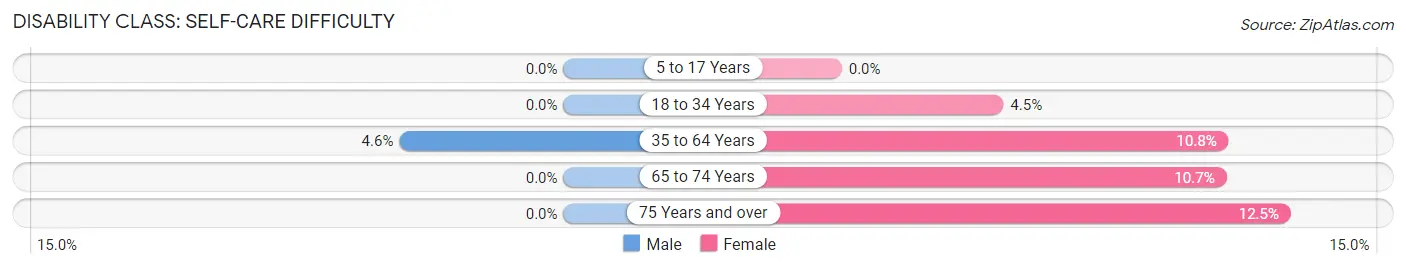
| Age Bracket | Male | Female |
| 5 to 17 Years | 0 (0.0%) | 0 (0.0%) |
| 18 to 34 Years | 0 (0.0%) | 5 (4.5%) |
| 35 to 64 Years | 10 (4.6%) | 28 (10.8%) |
| 65 to 74 Years | 0 (0.0%) | 6 (10.7%) |
| 75 Years and over | 0 (0.0%) | 6 (12.5%) |
Technology Access in Badin
Computing Device Access in Badin
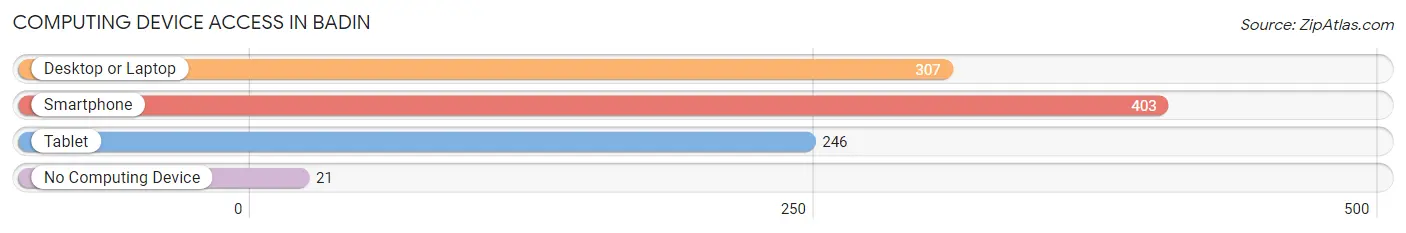
| Device Type | # Households | % Households |
| Desktop or Laptop | 307 | 72.4% |
| Smartphone | 403 | 95.1% |
| Tablet | 246 | 58.0% |
| No Computing Device | 21 | 5.0% |
| Total | 424 | 100.0% |
Internet Access in Badin
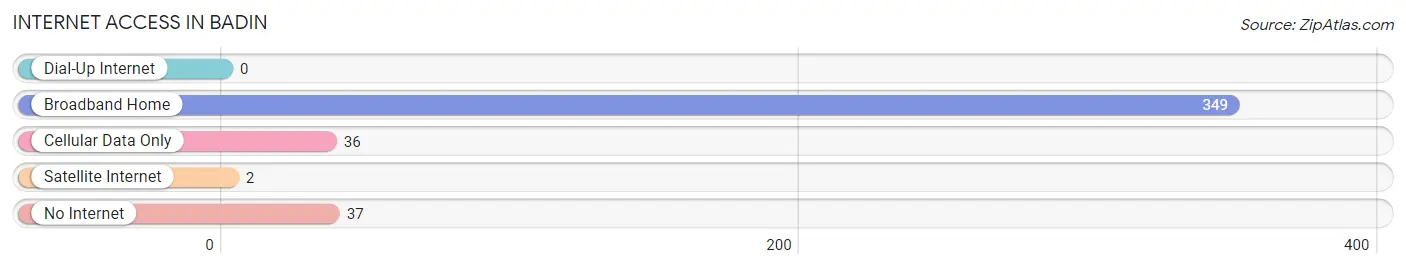
| Internet Type | # Households | % Households |
| Dial-Up Internet | 0 | 0.0% |
| Broadband Home | 349 | 82.3% |
| Cellular Data Only | 36 | 8.5% |
| Satellite Internet | 2 | 0.5% |
| No Internet | 37 | 8.7% |
| Total | 424 | 100.0% |
Badin Summary
Badin, North Carolina is a small town located in Stanly County, North Carolina. It is situated on the banks of the Yadkin River, and is home to a population of approximately 1,400 people. The town was founded in 1842 and has a rich history of industry and agriculture.
Geography
Badin is located in the Piedmont region of North Carolina, and is situated on the banks of the Yadkin River. The town is located in Stanly County, and is approximately 30 miles northeast of Charlotte. The town is surrounded by rolling hills and forests, and is home to a variety of wildlife. The town is also located near Badin Lake, which is a popular destination for fishing and boating.
Economy
Badin has a strong economy that is based on agriculture and industry. The town is home to several large farms, which produce a variety of crops such as corn, soybeans, and tobacco. The town is also home to several manufacturing companies, which produce a variety of products such as furniture, textiles, and automotive parts. The town is also home to several small businesses, which provide services such as restaurants, retail stores, and auto repair shops.
Demographics
As of the 2010 census, the population of Badin was 1,400 people. The town is predominantly white, with approximately 90% of the population being Caucasian. The town is also home to a small African American population, which makes up approximately 5% of the population. The town is also home to a small Hispanic population, which makes up approximately 2% of the population.
History
Badin was founded in 1842 by a group of settlers from Pennsylvania. The town was originally named “Badin’s Mill” after the first mill that was built in the area. The town quickly grew and became a center for industry and agriculture. The town was home to several large farms, which produced a variety of crops such as corn, soybeans, and tobacco. The town was also home to several manufacturing companies, which produced a variety of products such as furniture, textiles, and automotive parts.
In the late 19th century, the town was home to a large number of immigrants from Germany, Italy, and other European countries. These immigrants brought with them a variety of cultural influences, which can still be seen in the town today.
In the early 20th century, the town was home to a large number of African American residents. The town was also home to a large number of textile mills, which provided employment for many of the town’s residents.
In the late 20th century, the town experienced a period of decline as many of the town’s industries moved away. However, the town has since experienced a resurgence in recent years, and is now home to a variety of businesses and industries.
Conclusion
Badin, North Carolina is a small town located in Stanly County, North Carolina. It is situated on the banks of the Yadkin River, and is home to a population of approximately 1,400 people. The town has a rich history of industry and agriculture, and is home to a variety of businesses and industries. The town is predominantly white, with a small African American and Hispanic population. The town is also home to a variety of cultural influences, which can still be seen in the town today.
Common Questions
What is Per Capita Income in Badin?
Per Capita income in Badin is $16,397.
What is the Median Family Income in Badin?
Median Family Income in Badin is $50,625.
What is the Median Household income in Badin?
Median Household Income in Badin is $42,708.
What is Income or Wage Gap in Badin?
Income or Wage Gap in Badin is 36.2%.
Women in Badin earn 63.8 cents for every dollar earned by a man.
What is Inequality or Gini Index in Badin?
Inequality or Gini Index in Badin is 0.43.
What is the Total Population of Badin?
Total Population of Badin is 2,075.
What is the Total Male Population of Badin?
Total Male Population of Badin is 1,416.
What is the Total Female Population of Badin?
Total Female Population of Badin is 659.
What is the Ratio of Males per 100 Females in Badin?
There are 214.87 Males per 100 Females in Badin.
What is the Ratio of Females per 100 Males in Badin?
There are 46.54 Females per 100 Males in Badin.
What is the Median Population Age in Badin?
Median Population Age in Badin is 47.0 Years.
What is the Average Family Size in Badin
Average Family Size in Badin is 3.5 People.
What is the Average Household Size in Badin
Average Household Size in Badin is 2.9 People.
How Large is the Labor Force in Badin?
There are 483 People in the Labor Forcein in Badin.
What is the Percentage of People in the Labor Force in Badin?
27.5% of People are in the Labor Force in Badin.
What is the Unemployment Rate in Badin?
Unemployment Rate in Badin is 11.3%.