Marion, NC Map & Demographics
Marion Map
Marion Overview
$21,109
PER CAPITA INCOME
$56,984
AVG FAMILY INCOME
$48,520
AVG HOUSEHOLD INCOME
2.1%
WAGE / INCOME GAP [ % ]
97.9¢/ $1
WAGE / INCOME GAP [ $ ]
0.46
INEQUALITY / GINI INDEX
7,652
TOTAL POPULATION
4,239
MALE POPULATION
3,413
FEMALE POPULATION
124.20
MALES / 100 FEMALES
80.51
FEMALES / 100 MALES
39.4
MEDIAN AGE
2.8
AVG FAMILY SIZE
2.3
AVG HOUSEHOLD SIZE
2,807
LABOR FORCE [ PEOPLE ]
43.2%
PERCENT IN LABOR FORCE
9.5%
UNEMPLOYMENT RATE
Marion Zip Codes
Marion Area Codes
Income in Marion
Income Overview in Marion
Per Capita Income in Marion is $21,109, while median incomes of families and households are $56,984 and $48,520 respectively.
| Characteristic | Number | Measure |
| Per Capita Income | 7,652 | $21,109 |
| Median Family Income | 1,887 | $56,984 |
| Mean Family Income | 1,887 | $68,143 |
| Median Household Income | 2,800 | $48,520 |
| Mean Household Income | 2,800 | $60,007 |
| Income Deficit | 1,887 | $0 |
| Wage / Income Gap (%) | 7,652 | 2.08% |
| Wage / Income Gap ($) | 7,652 | 97.92¢ per $1 |
| Gini / Inequality Index | 7,652 | 0.46 |
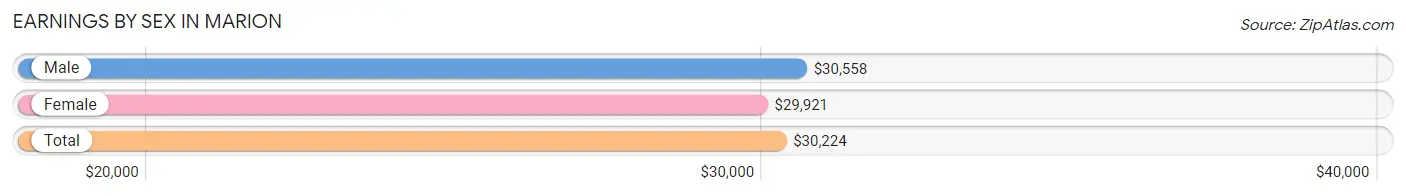
Earnings by Sex in Marion
Average Earnings in Marion are $30,224, $30,558 for men and $29,921 for women, a difference of 2.1%.
| Sex | Number | Average Earnings |
| Male | 1,582 (54.4%) | $30,558 |
| Female | 1,327 (45.6%) | $29,921 |
| Total | 2,909 (100.0%) | $30,224 |
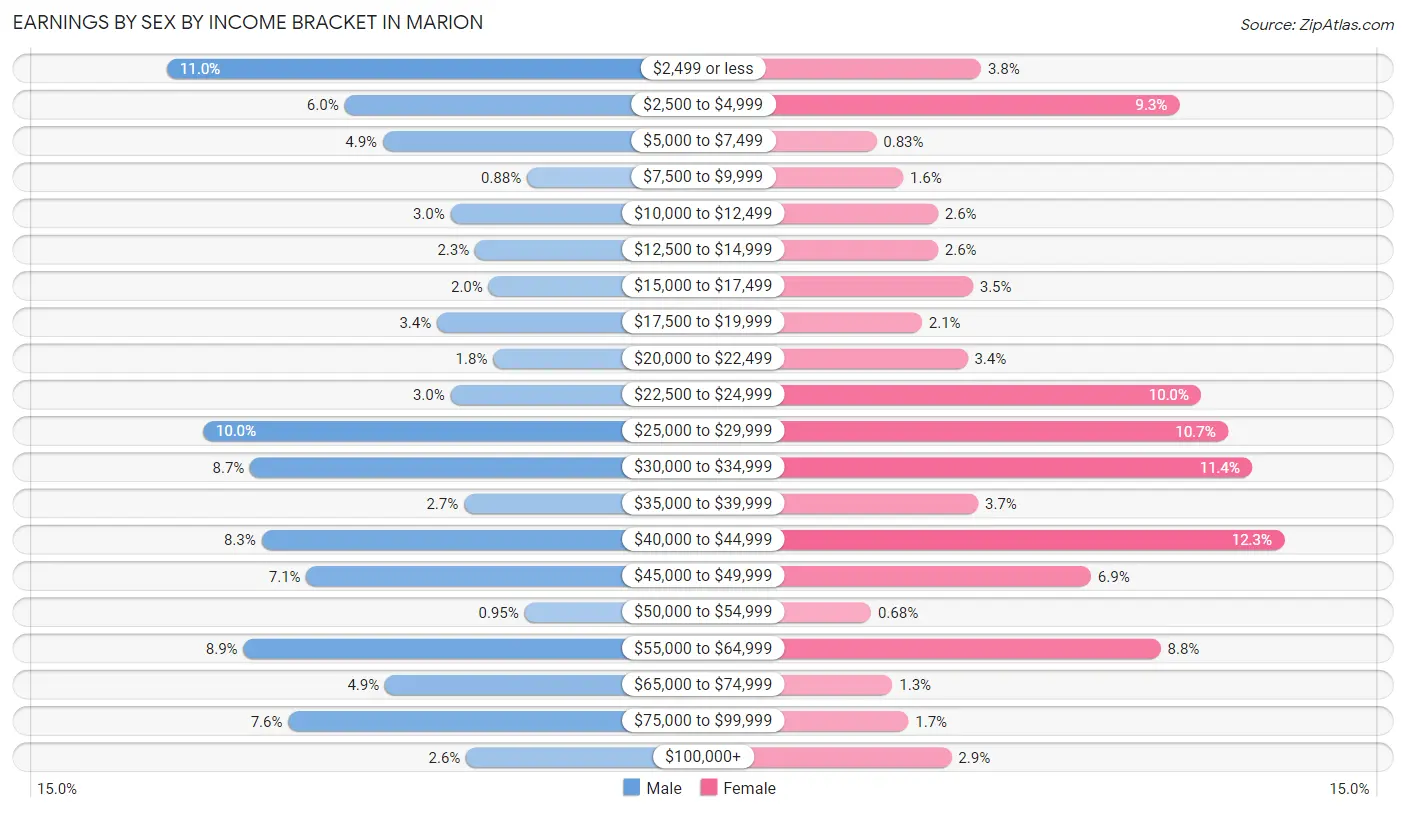
Earnings by Sex by Income Bracket in Marion
The most common earnings brackets in Marion are $2,499 or less for men (174 | 11.0%) and $40,000 to $44,999 for women (163 | 12.3%).
| Income | Male | Female |
| $2,499 or less | 174 (11.0%) | 50 (3.8%) |
| $2,500 to $4,999 | 95 (6.0%) | 124 (9.3%) |
| $5,000 to $7,499 | 78 (4.9%) | 11 (0.8%) |
| $7,500 to $9,999 | 14 (0.9%) | 21 (1.6%) |
| $10,000 to $12,499 | 48 (3.0%) | 34 (2.6%) |
| $12,500 to $14,999 | 37 (2.3%) | 34 (2.6%) |
| $15,000 to $17,499 | 31 (2.0%) | 47 (3.5%) |
| $17,500 to $19,999 | 54 (3.4%) | 28 (2.1%) |
| $20,000 to $22,499 | 29 (1.8%) | 45 (3.4%) |
| $22,500 to $24,999 | 48 (3.0%) | 132 (10.0%) |
| $25,000 to $29,999 | 158 (10.0%) | 142 (10.7%) |
| $30,000 to $34,999 | 137 (8.7%) | 151 (11.4%) |
| $35,000 to $39,999 | 42 (2.6%) | 49 (3.7%) |
| $40,000 to $44,999 | 132 (8.3%) | 163 (12.3%) |
| $45,000 to $49,999 | 112 (7.1%) | 91 (6.9%) |
| $50,000 to $54,999 | 15 (0.9%) | 9 (0.7%) |
| $55,000 to $64,999 | 140 (8.8%) | 117 (8.8%) |
| $65,000 to $74,999 | 77 (4.9%) | 17 (1.3%) |
| $75,000 to $99,999 | 120 (7.6%) | 23 (1.7%) |
| $100,000+ | 41 (2.6%) | 39 (2.9%) |
| Total | 1,582 (100.0%) | 1,327 (100.0%) |
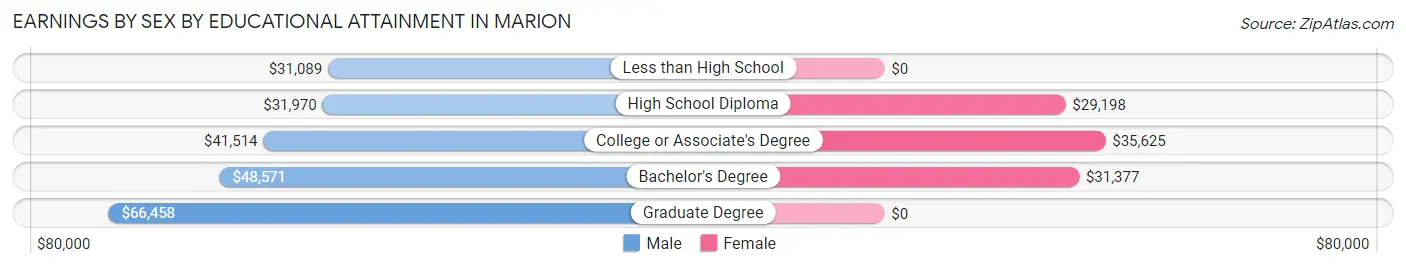
Earnings by Sex by Educational Attainment in Marion
Average earnings in Marion are $36,959 for men and $31,197 for women, a difference of 15.6%. Men with an educational attainment of graduate degree enjoy the highest average annual earnings of $66,458, while those with less than high school education earn the least with $31,089. Women with an educational attainment of college or associate's degree earn the most with the average annual earnings of $35,625, while those with high school diploma education have the smallest earnings of $29,198.
| Educational Attainment | Male Income | Female Income |
| Less than High School | $31,089 | $0 |
| High School Diploma | $31,970 | $29,198 |
| College or Associate's Degree | $41,514 | $35,625 |
| Bachelor's Degree | $48,571 | $31,377 |
| Graduate Degree | $66,458 | $0 |
| Total | $36,959 | $31,197 |
Family Income in Marion
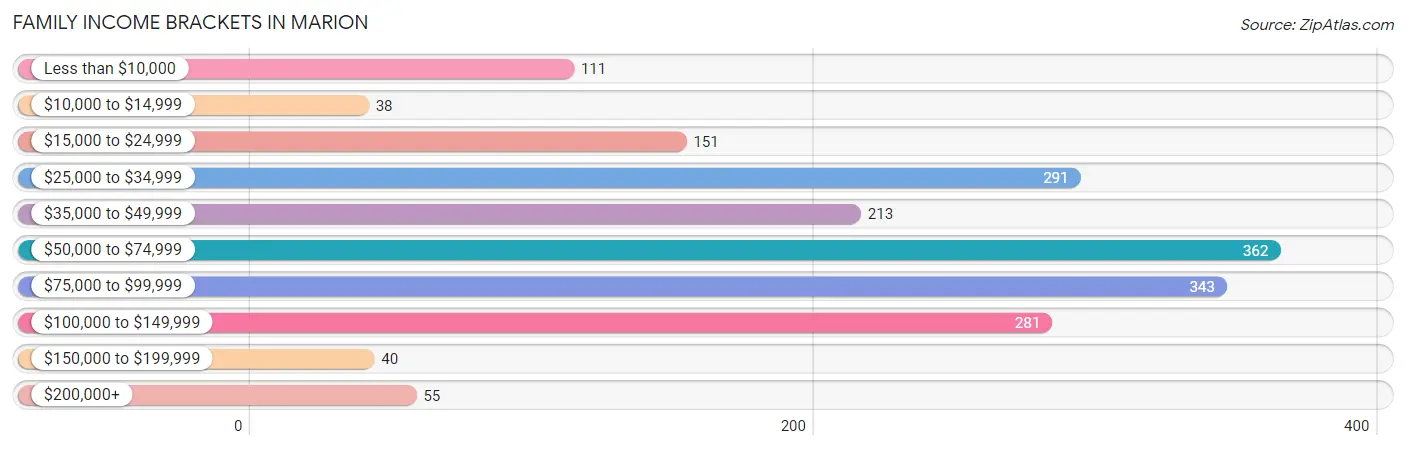
Family Income Brackets in Marion
According to the Marion family income data, there are 362 families falling into the $50,000 to $74,999 income range, which is the most common income bracket and makes up 19.2% of all families. Conversely, the $10,000 to $14,999 income bracket is the least frequent group with only 38 families (2.0%) belonging to this category.
| Income Bracket | # Families | % Families |
| Less than $10,000 | 111 | 5.9% |
| $10,000 to $14,999 | 38 | 2.0% |
| $15,000 to $24,999 | 151 | 8.0% |
| $25,000 to $34,999 | 291 | 15.4% |
| $35,000 to $49,999 | 213 | 11.3% |
| $50,000 to $74,999 | 362 | 19.2% |
| $75,000 to $99,999 | 343 | 18.2% |
| $100,000 to $149,999 | 281 | 14.9% |
| $150,000 to $199,999 | 40 | 2.1% |
| $200,000+ | 55 | 2.9% |
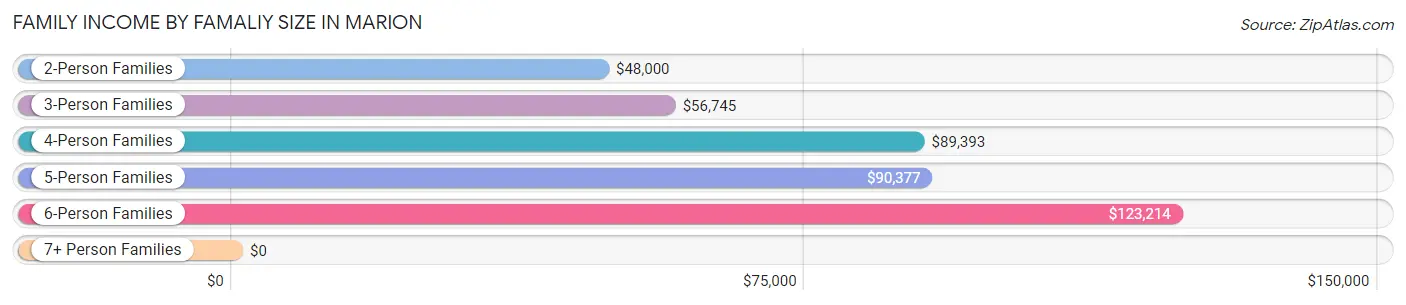
Family Income by Famaliy Size in Marion
6-person families (60 | 3.2%) account for the highest median family income in Marion with $123,214 per family, while 2-person families (718 | 38.1%) have the highest median income of $24,000 per family member.
| Income Bracket | # Families | Median Income |
| 2-Person Families | 718 (38.1%) | $48,000 |
| 3-Person Families | 704 (37.3%) | $56,745 |
| 4-Person Families | 213 (11.3%) | $89,393 |
| 5-Person Families | 165 (8.7%) | $90,377 |
| 6-Person Families | 60 (3.2%) | $123,214 |
| 7+ Person Families | 27 (1.4%) | $0 |
| Total | 1,887 (100.0%) | $56,984 |
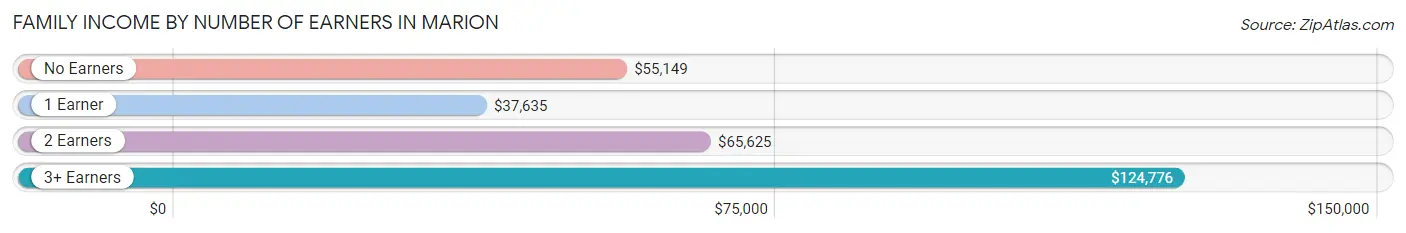
Family Income by Number of Earners in Marion
The median family income in Marion is $56,984, with families comprising 3+ earners (199) having the highest median family income of $124,776, while families with 1 earner (880) have the lowest median family income of $37,635, accounting for 10.5% and 46.6% of families, respectively.
| Number of Earners | # Families | Median Income |
| No Earners | 323 (17.1%) | $55,149 |
| 1 Earner | 880 (46.6%) | $37,635 |
| 2 Earners | 485 (25.7%) | $65,625 |
| 3+ Earners | 199 (10.5%) | $124,776 |
| Total | 1,887 (100.0%) | $56,984 |
Household Income in Marion
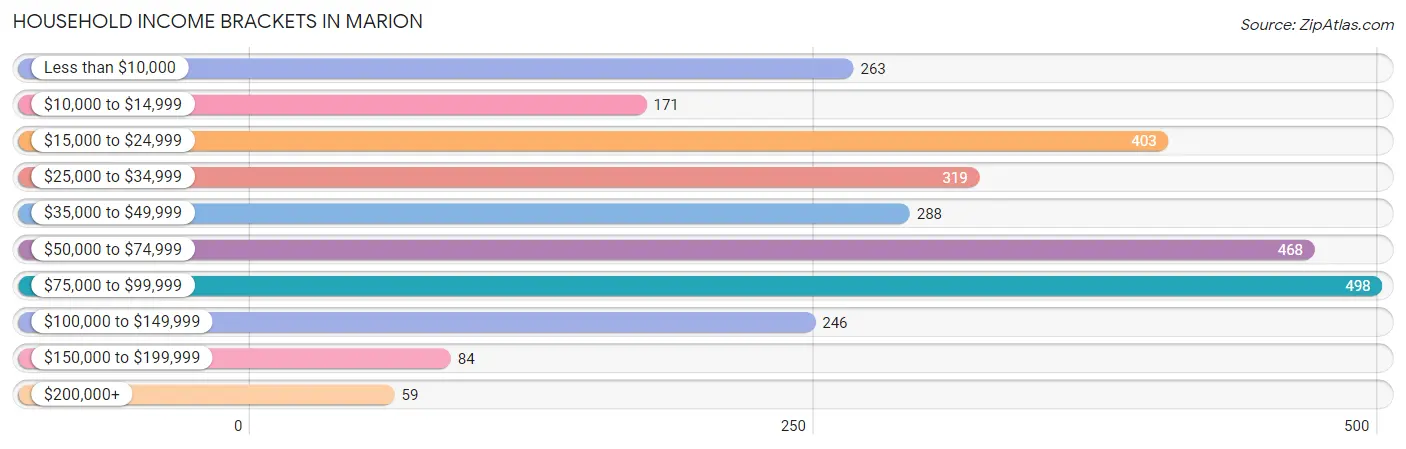
Household Income Brackets in Marion
With 498 households falling in the category, the $75,000 to $99,999 income range is the most frequent in Marion, accounting for 17.8% of all households. In contrast, only 59 households (2.1%) fall into the $200,000+ income bracket, making it the least populous group.
| Income Bracket | # Households | % Households |
| Less than $10,000 | 263 | 9.4% |
| $10,000 to $14,999 | 171 | 6.1% |
| $15,000 to $24,999 | 403 | 14.4% |
| $25,000 to $34,999 | 319 | 11.4% |
| $35,000 to $49,999 | 288 | 10.3% |
| $50,000 to $74,999 | 468 | 16.7% |
| $75,000 to $99,999 | 498 | 17.8% |
| $100,000 to $149,999 | 246 | 8.8% |
| $150,000 to $199,999 | 84 | 3.0% |
| $200,000+ | 59 | 2.1% |
Household Income by Householder Age in Marion
The median household income in Marion is $48,520, with the highest median household income of $53,594 found in the 45 to 64 years age bracket for the primary householder. A total of 1,123 households (40.1%) fall into this category. Meanwhile, the 25 to 44 years age bracket for the primary householder has the lowest median household income of $40,885, with 758 households (27.1%) in this group.
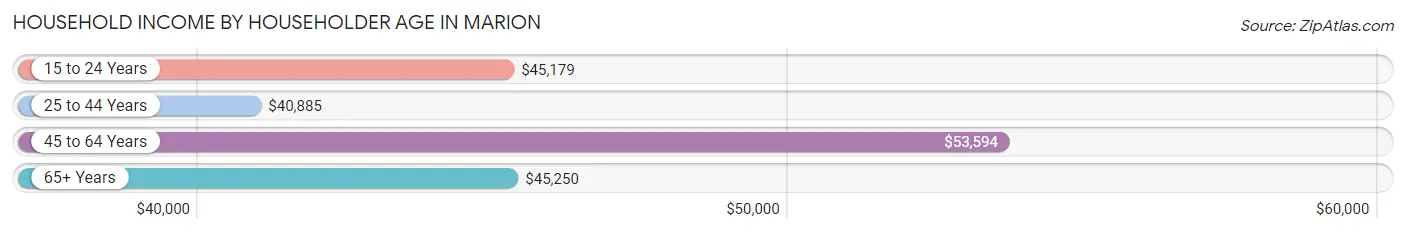
| Income Bracket | # Households | Median Income |
| 15 to 24 Years | 48 (1.7%) | $45,179 |
| 25 to 44 Years | 758 (27.1%) | $40,885 |
| 45 to 64 Years | 1,123 (40.1%) | $53,594 |
| 65+ Years | 871 (31.1%) | $45,250 |
| Total | 2,800 (100.0%) | $48,520 |
Poverty in Marion
Income Below Poverty by Sex and Age in Marion
With 19.4% poverty level for males and 24.1% for females among the residents of Marion, 5 year old males and 15 year old females are the most vulnerable to poverty, with 38 males (82.6%) and 38 females (64.4%) in their respective age groups living below the poverty level.
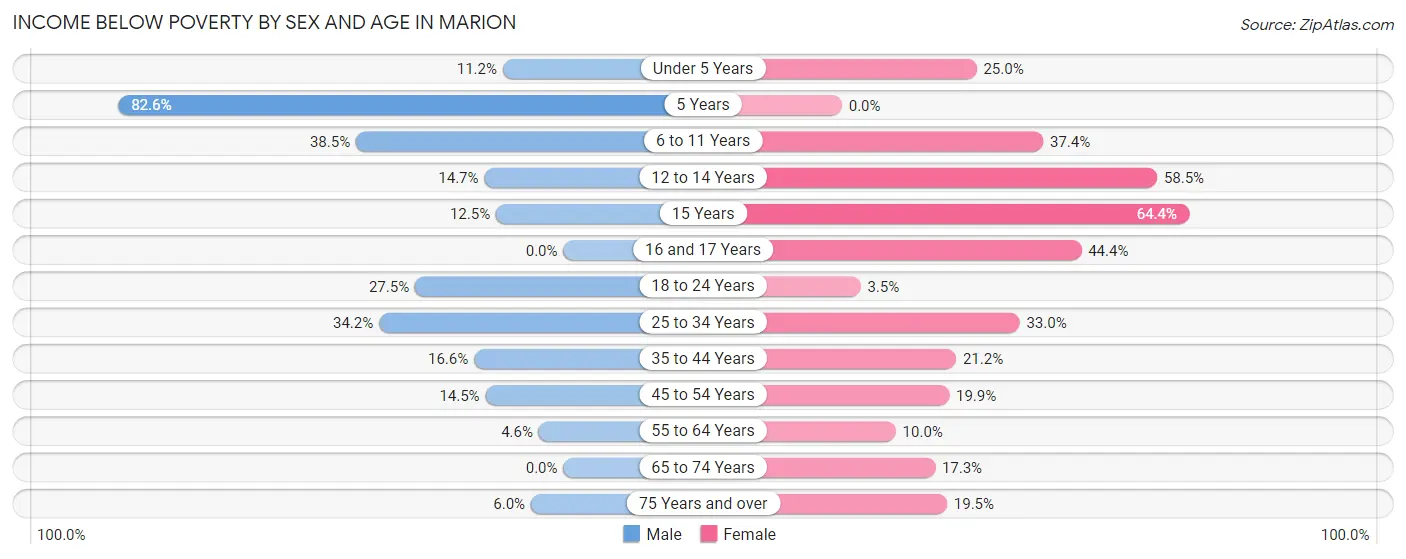
| Age Bracket | Male | Female |
| Under 5 Years | 10 (11.2%) | 17 (25.0%) |
| 5 Years | 38 (82.6%) | 0 (0.0%) |
| 6 to 11 Years | 102 (38.5%) | 99 (37.4%) |
| 12 to 14 Years | 17 (14.7%) | 86 (58.5%) |
| 15 Years | 10 (12.5%) | 38 (64.4%) |
| 16 and 17 Years | 0 (0.0%) | 60 (44.4%) |
| 18 to 24 Years | 111 (27.5%) | 5 (3.5%) |
| 25 to 34 Years | 183 (34.2%) | 126 (33.0%) |
| 35 to 44 Years | 60 (16.6%) | 106 (21.2%) |
| 45 to 54 Years | 70 (14.5%) | 90 (19.9%) |
| 55 to 64 Years | 16 (4.5%) | 47 (10.0%) |
| 65 to 74 Years | 0 (0.0%) | 79 (17.3%) |
| 75 Years and over | 10 (6.0%) | 47 (19.5%) |
| Total | 627 (19.4%) | 800 (24.1%) |
Income Above Poverty by Sex and Age in Marion
According to the poverty statistics in Marion, males aged 16 and 17 years and females aged 18 to 24 years are the age groups that are most secure financially, with 100.0% of males and 96.5% of females in these age groups living above the poverty line.
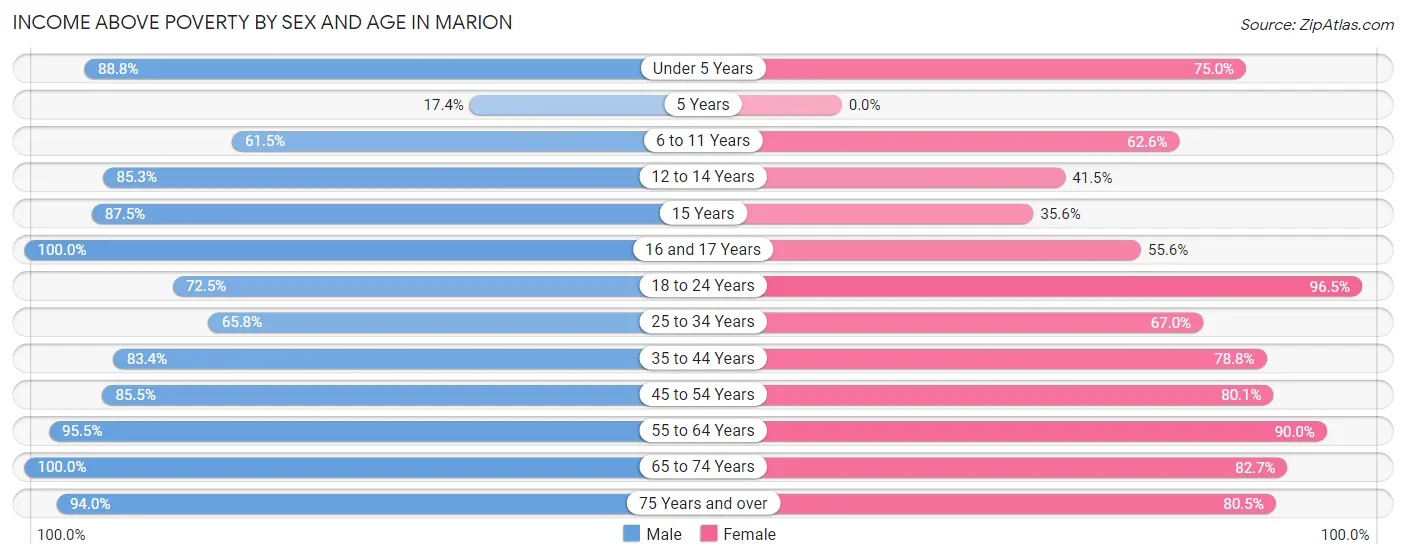
| Age Bracket | Male | Female |
| Under 5 Years | 79 (88.8%) | 51 (75.0%) |
| 5 Years | 8 (17.4%) | 0 (0.0%) |
| 6 to 11 Years | 163 (61.5%) | 166 (62.6%) |
| 12 to 14 Years | 99 (85.3%) | 61 (41.5%) |
| 15 Years | 70 (87.5%) | 21 (35.6%) |
| 16 and 17 Years | 39 (100.0%) | 75 (55.6%) |
| 18 to 24 Years | 292 (72.5%) | 139 (96.5%) |
| 25 to 34 Years | 352 (65.8%) | 256 (67.0%) |
| 35 to 44 Years | 302 (83.4%) | 394 (78.8%) |
| 45 to 54 Years | 414 (85.5%) | 362 (80.1%) |
| 55 to 64 Years | 336 (95.5%) | 423 (90.0%) |
| 65 to 74 Years | 299 (100.0%) | 378 (82.7%) |
| 75 Years and over | 156 (94.0%) | 194 (80.5%) |
| Total | 2,609 (80.6%) | 2,520 (75.9%) |
Income Below Poverty Among Married-Couple Families in Marion
The poverty statistics for married-couple families in Marion show that 17.4% or 205 of the total 1,178 families live below the poverty line. Families with 3 or 4 children have the highest poverty rate of 43.1%, comprising of 50 families. On the other hand, families with no children have the lowest poverty rate of 0.0%, which includes 0 families.
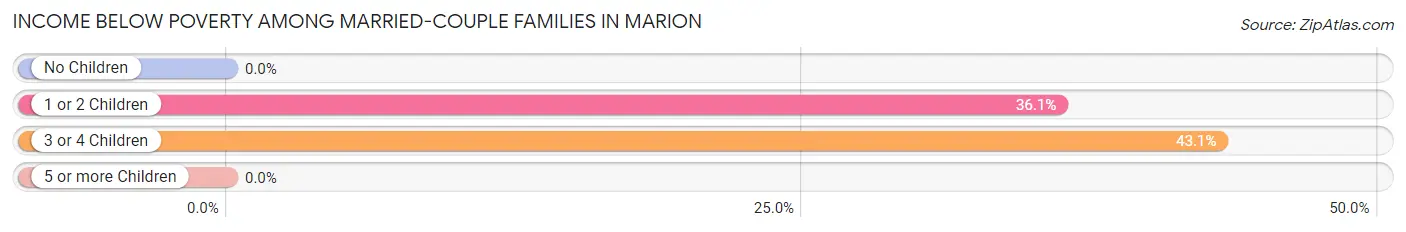
| Children | Above Poverty | Below Poverty |
| No Children | 633 (100.0%) | 0 (0.0%) |
| 1 or 2 Children | 274 (63.9%) | 155 (36.1%) |
| 3 or 4 Children | 66 (56.9%) | 50 (43.1%) |
| 5 or more Children | 0 (0.0%) | 0 (0.0%) |
| Total | 973 (82.6%) | 205 (17.4%) |
Income Below Poverty Among Single-Parent Households in Marion
According to the poverty data in Marion, 8.0% or 13 single-father households and 12.1% or 66 single-mother households are living below the poverty line. Among single-father households, those with 1 or 2 children have the highest poverty rate, with 13 households (44.8%) experiencing poverty. Likewise, among single-mother households, those with 3 or 4 children have the highest poverty rate, with 13 households (100.0%) falling below the poverty line.
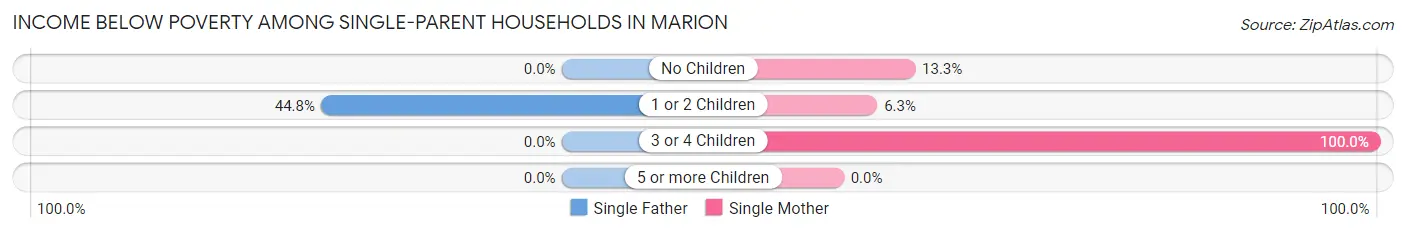
| Children | Single Father | Single Mother |
| No Children | 0 (0.0%) | 37 (13.3%) |
| 1 or 2 Children | 13 (44.8%) | 16 (6.2%) |
| 3 or 4 Children | 0 (0.0%) | 13 (100.0%) |
| 5 or more Children | 0 (0.0%) | 0 (0.0%) |
| Total | 13 (8.0%) | 66 (12.1%) |
Income Below Poverty Among Married-Couple vs Single-Parent Households in Marion
The poverty data for Marion shows that 205 of the married-couple family households (17.4%) and 79 of the single-parent households (11.1%) are living below the poverty level. Within the married-couple family households, those with 3 or 4 children have the highest poverty rate, with 50 households (43.1%) falling below the poverty line. Among the single-parent households, those with 3 or 4 children have the highest poverty rate, with 13 household (31.7%) living below poverty.
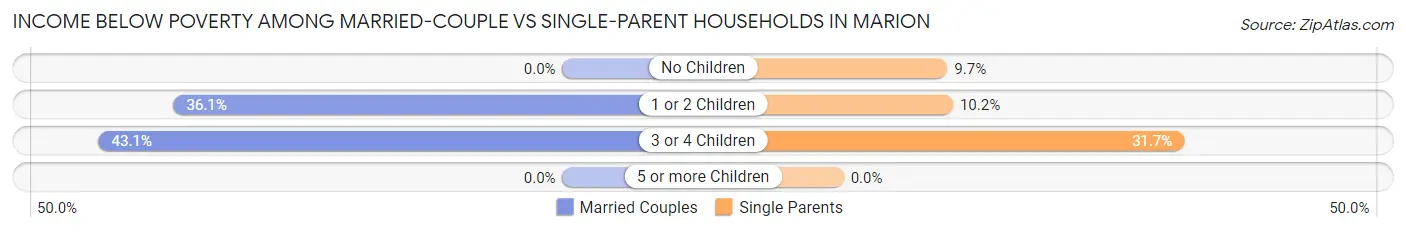
| Children | Married-Couple Families | Single-Parent Households |
| No Children | 0 (0.0%) | 37 (9.7%) |
| 1 or 2 Children | 155 (36.1%) | 29 (10.2%) |
| 3 or 4 Children | 50 (43.1%) | 13 (31.7%) |
| 5 or more Children | 0 (0.0%) | 0 (0.0%) |
| Total | 205 (17.4%) | 79 (11.1%) |
Race in Marion
The most populous races in Marion are White / Caucasian (5,195 | 67.9%), Hispanic or Latino (1,402 | 18.3%), and Black / African American (890 | 11.6%).
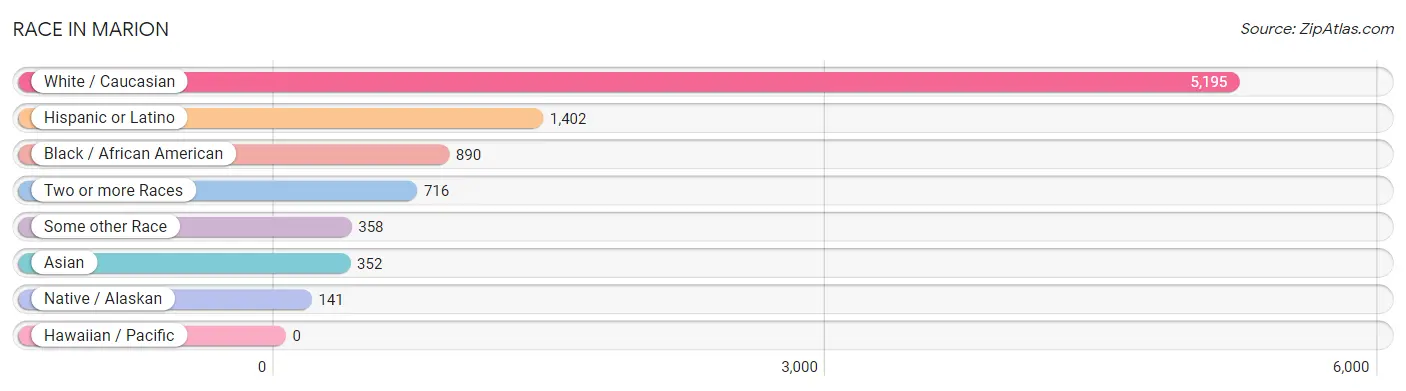
| Race | # Population | % Population |
| Asian | 352 | 4.6% |
| Black / African American | 890 | 11.6% |
| Hawaiian / Pacific | 0 | 0.0% |
| Hispanic or Latino | 1,402 | 18.3% |
| Native / Alaskan | 141 | 1.8% |
| White / Caucasian | 5,195 | 67.9% |
| Two or more Races | 716 | 9.4% |
| Some other Race | 358 | 4.7% |
| Total | 7,652 | 100.0% |
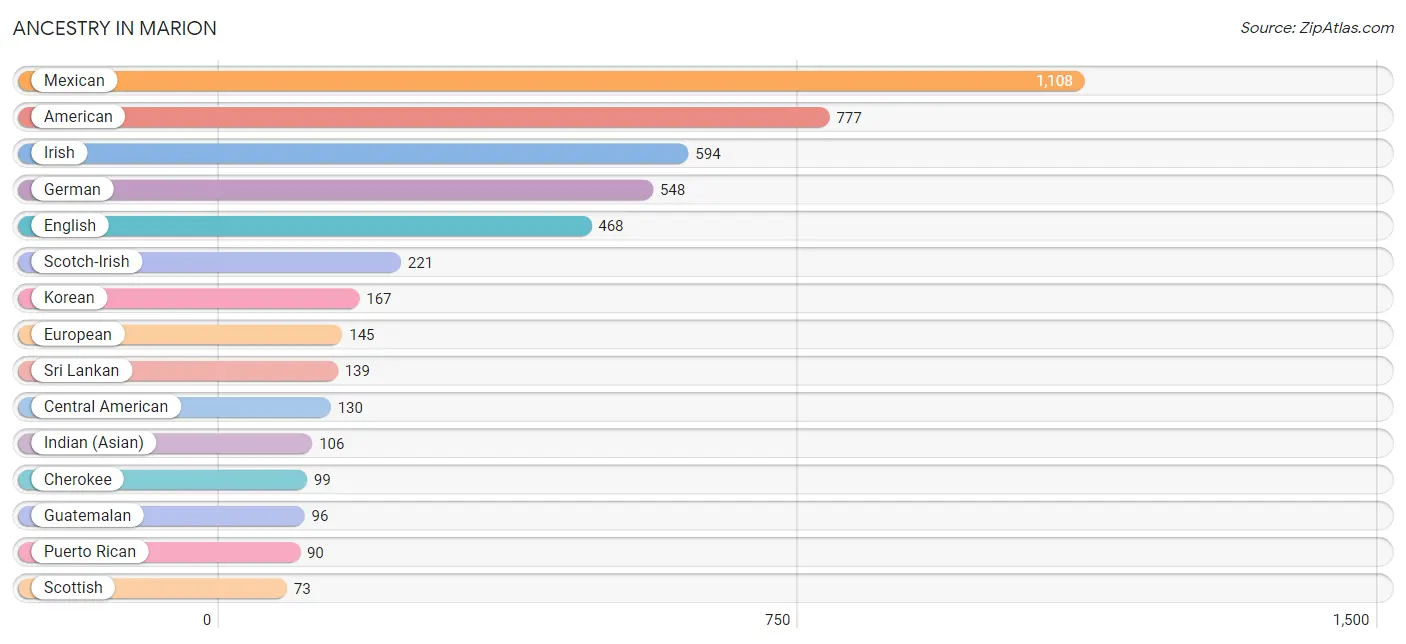
Ancestry in Marion
The most populous ancestries reported in Marion are Mexican (1,108 | 14.5%), American (777 | 10.2%), Irish (594 | 7.8%), German (548 | 7.2%), and English (468 | 6.1%), together accounting for 45.7% of all Marion residents.
| Ancestry | # Population | % Population |
| African | 14 | 0.2% |
| American | 777 | 10.2% |
| Barbadian | 6 | 0.1% |
| Bhutanese | 28 | 0.4% |
| British | 18 | 0.2% |
| Burmese | 28 | 0.4% |
| Canadian | 54 | 0.7% |
| Central American | 130 | 1.7% |
| Cherokee | 99 | 1.3% |
| Costa Rican | 8 | 0.1% |
| Dutch | 12 | 0.2% |
| English | 468 | 6.1% |
| European | 145 | 1.9% |
| French | 68 | 0.9% |
| German | 548 | 7.2% |
| Guatemalan | 96 | 1.3% |
| Indian (Asian) | 106 | 1.4% |
| Inupiat | 9 | 0.1% |
| Irish | 594 | 7.8% |
| Italian | 62 | 0.8% |
| Jamaican | 20 | 0.3% |
| Korean | 167 | 2.2% |
| Lumbee | 36 | 0.5% |
| Mexican | 1,108 | 14.5% |
| Mexican American Indian | 29 | 0.4% |
| Northern European | 8 | 0.1% |
| Polish | 38 | 0.5% |
| Puerto Rican | 90 | 1.2% |
| Russian | 14 | 0.2% |
| Salvadoran | 26 | 0.3% |
| Scandinavian | 20 | 0.3% |
| Scotch-Irish | 221 | 2.9% |
| Scottish | 73 | 0.9% |
| South American | 19 | 0.3% |
| Sri Lankan | 139 | 1.8% |
| Subsaharan African | 14 | 0.2% |
| Thai | 41 | 0.5% |
| Venezuelan | 19 | 0.3% |
| Welsh | 9 | 0.1% | View All 39 Rows |
Immigrants in Marion
The most numerous immigrant groups reported in Marion came from Latin America (812 | 10.6%), Central America (773 | 10.1%), Mexico (681 | 8.9%), Asia (276 | 3.6%), and South Eastern Asia (254 | 3.3%), together accounting for 36.5% of all Marion residents.
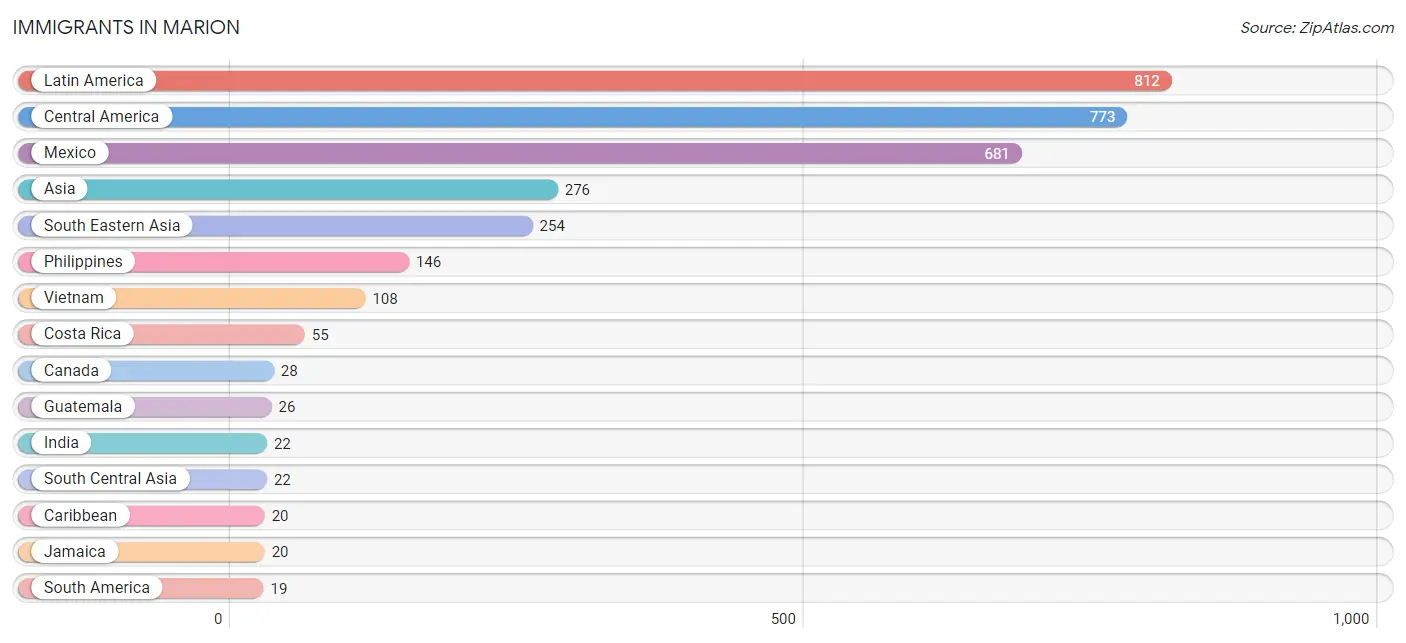
| Immigration Origin | # Population | % Population |
| Asia | 276 | 3.6% |
| Canada | 28 | 0.4% |
| Caribbean | 20 | 0.3% |
| Central America | 773 | 10.1% |
| Costa Rica | 55 | 0.7% |
| El Salvador | 11 | 0.1% |
| Guatemala | 26 | 0.3% |
| India | 22 | 0.3% |
| Jamaica | 20 | 0.3% |
| Latin America | 812 | 10.6% |
| Mexico | 681 | 8.9% |
| Philippines | 146 | 1.9% |
| South America | 19 | 0.3% |
| South Central Asia | 22 | 0.3% |
| South Eastern Asia | 254 | 3.3% |
| Venezuela | 19 | 0.3% |
| Vietnam | 108 | 1.4% | View All 17 Rows |
Sex and Age in Marion
Sex and Age in Marion
The most populous age groups in Marion are 25 to 29 Years (542 | 12.8%) for men and 45 to 49 Years (357 | 10.5%) for women.
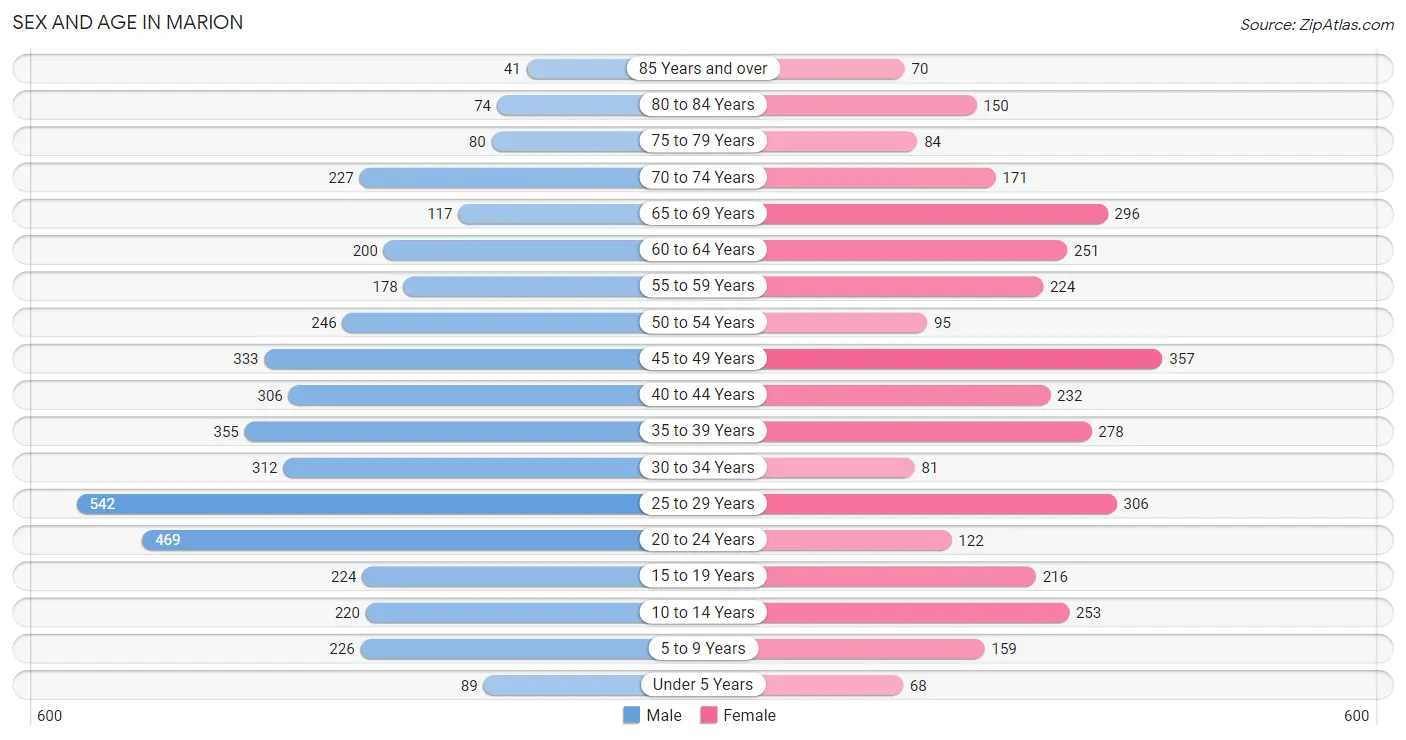
| Age Bracket | Male | Female |
| Under 5 Years | 89 (2.1%) | 68 (2.0%) |
| 5 to 9 Years | 226 (5.3%) | 159 (4.7%) |
| 10 to 14 Years | 220 (5.2%) | 253 (7.4%) |
| 15 to 19 Years | 224 (5.3%) | 216 (6.3%) |
| 20 to 24 Years | 469 (11.1%) | 122 (3.6%) |
| 25 to 29 Years | 542 (12.8%) | 306 (9.0%) |
| 30 to 34 Years | 312 (7.4%) | 81 (2.4%) |
| 35 to 39 Years | 355 (8.4%) | 278 (8.2%) |
| 40 to 44 Years | 306 (7.2%) | 232 (6.8%) |
| 45 to 49 Years | 333 (7.9%) | 357 (10.5%) |
| 50 to 54 Years | 246 (5.8%) | 95 (2.8%) |
| 55 to 59 Years | 178 (4.2%) | 224 (6.6%) |
| 60 to 64 Years | 200 (4.7%) | 251 (7.3%) |
| 65 to 69 Years | 117 (2.8%) | 296 (8.7%) |
| 70 to 74 Years | 227 (5.4%) | 171 (5.0%) |
| 75 to 79 Years | 80 (1.9%) | 84 (2.5%) |
| 80 to 84 Years | 74 (1.8%) | 150 (4.4%) |
| 85 Years and over | 41 (1.0%) | 70 (2.1%) |
| Total | 4,239 (100.0%) | 3,413 (100.0%) |
Families and Households in Marion
Median Family Size in Marion
The median family size in Marion is 2.84 persons per family, with married-couple families (1,178 | 62.4%) accounting for the largest median family size of 3.05 persons per family. On the other hand, single female/mother families (547 | 29.0%) represent the smallest median family size with 2.46 persons per family.
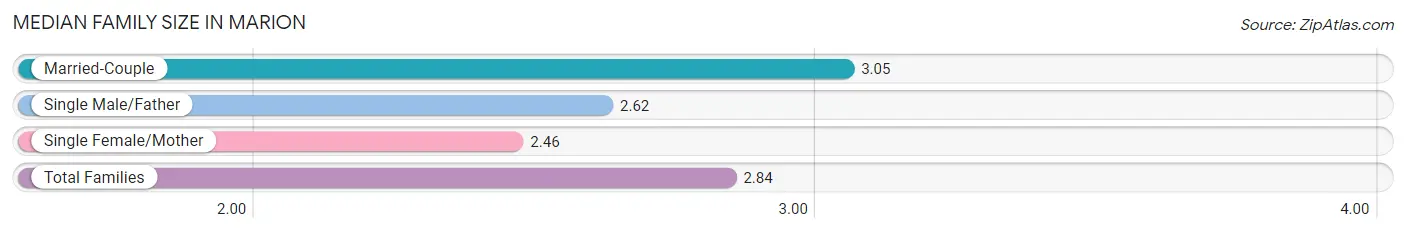
| Family Type | # Families | Family Size |
| Married-Couple | 1,178 (62.4%) | 3.05 |
| Single Male/Father | 162 (8.6%) | 2.62 |
| Single Female/Mother | 547 (29.0%) | 2.46 |
| Total Families | 1,887 (100.0%) | 2.84 |
Median Household Size in Marion
The median household size in Marion is 2.33 persons per household, with married-couple households (1,178 | 42.1%) accounting for the largest median household size of 3.05 persons per household. non-family households (913 | 32.6%) represent the smallest median household size with 1.03 persons per household.
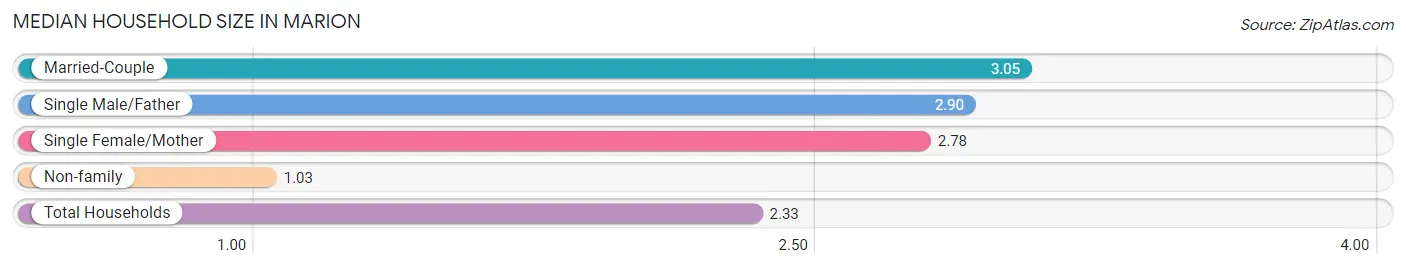
| Household Type | # Households | Household Size |
| Married-Couple | 1,178 (42.1%) | 3.05 |
| Single Male/Father | 162 (5.8%) | 2.90 |
| Single Female/Mother | 547 (19.5%) | 2.78 |
| Non-family | 913 (32.6%) | 1.03 |
| Total Households | 2,800 (100.0%) | 2.33 |
Household Size by Marriage Status in Marion
Out of a total of 2,800 households in Marion, 1,887 (67.4%) are family households, while 913 (32.6%) are nonfamily households. The most numerous type of family households are 2-person households, comprising 669, and the most common type of nonfamily households are 1-person households, comprising 895.
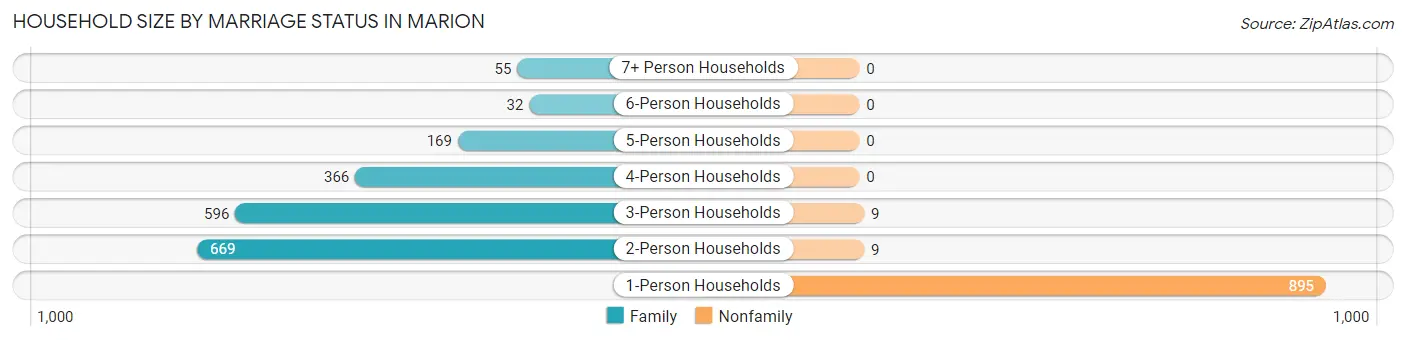
| Household Size | Family Households | Nonfamily Households |
| 1-Person Households | - | 895 (32.0%) |
| 2-Person Households | 669 (23.9%) | 9 (0.3%) |
| 3-Person Households | 596 (21.3%) | 9 (0.3%) |
| 4-Person Households | 366 (13.1%) | 0 (0.0%) |
| 5-Person Households | 169 (6.0%) | 0 (0.0%) |
| 6-Person Households | 32 (1.1%) | 0 (0.0%) |
| 7+ Person Households | 55 (2.0%) | 0 (0.0%) |
| Total | 1,887 (67.4%) | 913 (32.6%) |
Female Fertility in Marion
Fertility by Age in Marion
Average fertility rate in Marion is 31.0 births per 1,000 women. Women in the age bracket of 20 to 34 years have the highest fertility rate with 96.0 births per 1,000 women. Women in the age bracket of 20 to 34 years acount for 100.0% of all women with births.
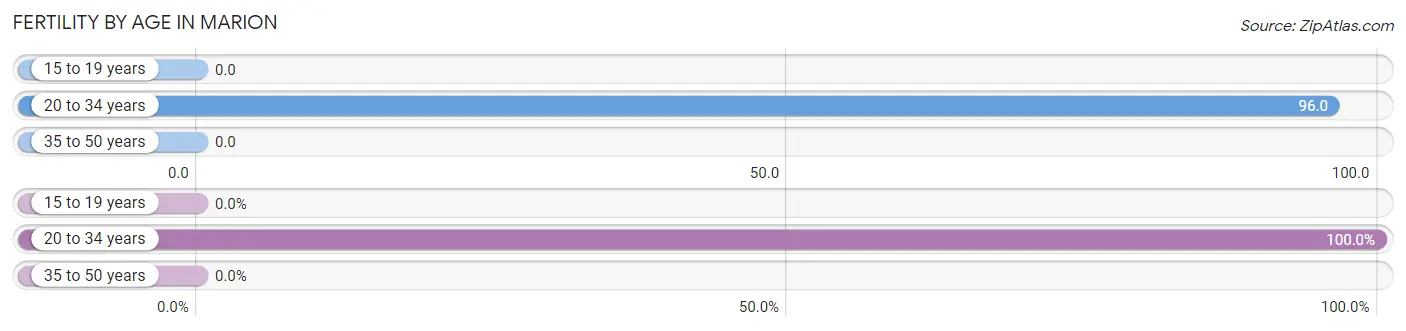
| Age Bracket | Women with Births | Births / 1,000 Women |
| 15 to 19 years | 0 (0.0%) | 0.0 |
| 20 to 34 years | 49 (100.0%) | 96.0 |
| 35 to 50 years | 0 (0.0%) | 0.0 |
| Total | 49 (100.0%) | 31.0 |
Fertility by Age by Marriage Status in Marion
89.8% of women with births (49) in Marion are married. The highest percentage of unmarried women with births falls into 20 to 34 years age bracket with 10.2% of them unmarried at the time of birth, while the lowest percentage of unmarried women with births belong to 20 to 34 years age bracket with 10.2% of them unmarried.
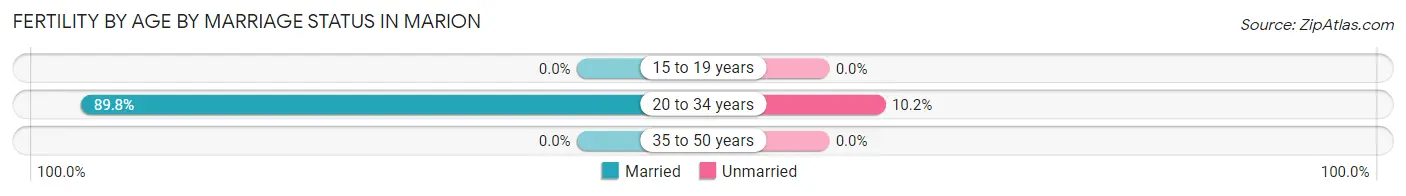
| Age Bracket | Married | Unmarried |
| 15 to 19 years | 0 (0.0%) | 0 (0.0%) |
| 20 to 34 years | 44 (89.8%) | 5 (10.2%) |
| 35 to 50 years | 0 (0.0%) | 0 (0.0%) |
| Total | 44 (89.8%) | 5 (10.2%) |
Fertility by Education in Marion
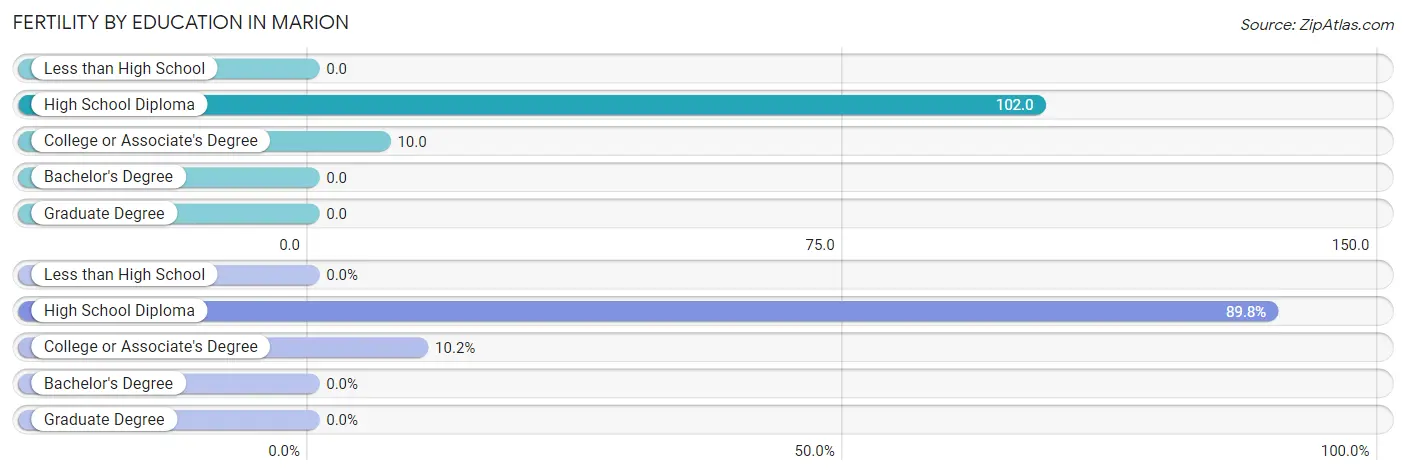
| Educational Attainment | Women with Births | Births / 1,000 Women |
| Less than High School | 0 (0.0%) | 0.0 |
| High School Diploma | 44 (89.8%) | 102.0 |
| College or Associate's Degree | 5 (10.2%) | 10.0 |
| Bachelor's Degree | 0 (0.0%) | 0.0 |
| Graduate Degree | 0 (0.0%) | 0.0 |
| Total | 49 (100.0%) | 31.0 |
Fertility by Education by Marriage Status in Marion
10.2% of women with births in Marion are unmarried. Women with the educational attainment of high school diploma are most likely to be married with 100.0% of them married at childbirth, while women with the educational attainment of college or associate's degree are least likely to be married with 100.0% of them unmarried at childbirth.
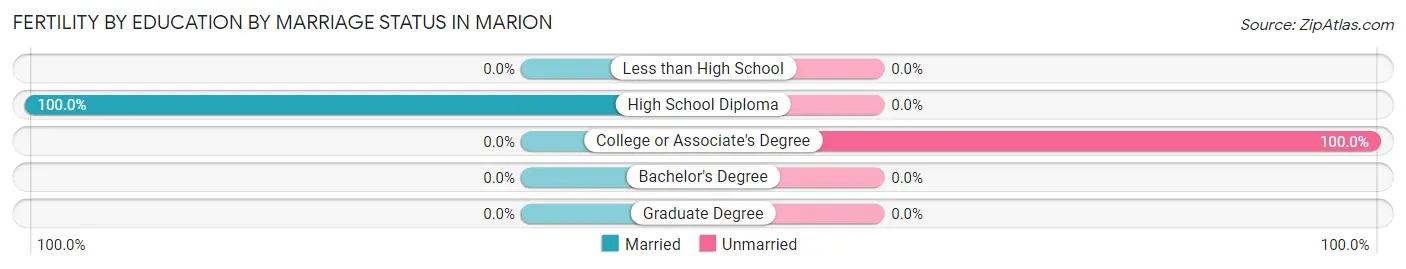
| Educational Attainment | Married | Unmarried |
| Less than High School | 0 (0.0%) | 0 (0.0%) |
| High School Diploma | 44 (100.0%) | 0 (0.0%) |
| College or Associate's Degree | 0 (0.0%) | 5 (100.0%) |
| Bachelor's Degree | 0 (0.0%) | 0 (0.0%) |
| Graduate Degree | 0 (0.0%) | 0 (0.0%) |
| Total | 44 (89.8%) | 5 (10.2%) |
Employment Characteristics in Marion
Employment by Class of Employer in Marion
Among the 2,426 employed individuals in Marion, private company employees (1,917 | 79.0%), local government employees (172 | 7.1%), and self-employed (not incorporated) (104 | 4.3%) make up the most common classes of employment.
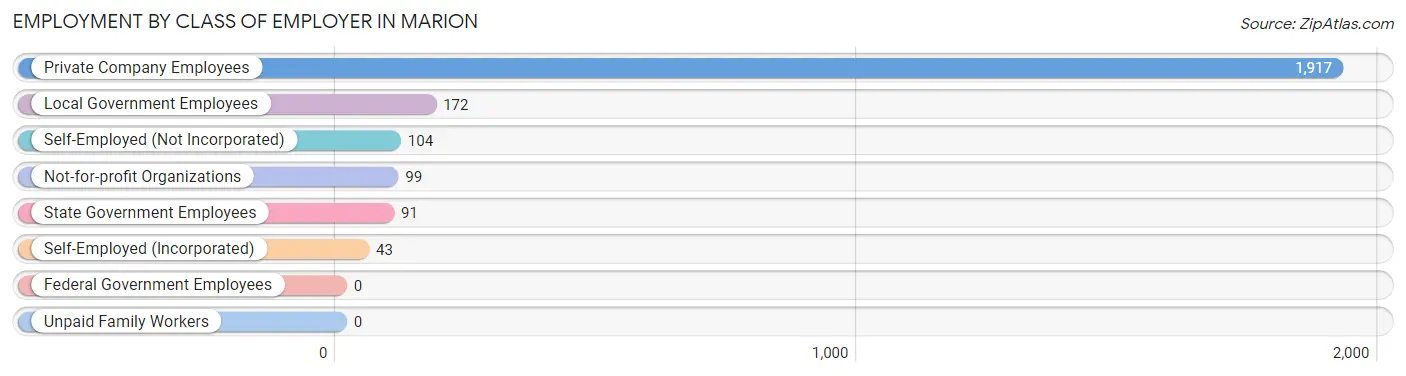
| Employer Class | # Employees | % Employees |
| Private Company Employees | 1,917 | 79.0% |
| Self-Employed (Incorporated) | 43 | 1.8% |
| Self-Employed (Not Incorporated) | 104 | 4.3% |
| Not-for-profit Organizations | 99 | 4.1% |
| Local Government Employees | 172 | 7.1% |
| State Government Employees | 91 | 3.7% |
| Federal Government Employees | 0 | 0.0% |
| Unpaid Family Workers | 0 | 0.0% |
| Total | 2,426 | 100.0% |
Employment Status by Age in Marion
According to the labor force statistics for Marion, out of the total population over 16 years of age (6,498), 43.2% or 2,807 individuals are in the labor force, with 9.5% or 267 of them unemployed. The age group with the highest labor force participation rate is 30 to 34 years, with 59.5% or 234 individuals in the labor force. Within the labor force, the 30 to 34 years age range has the highest percentage of unemployed individuals, with 23.1% or 54 of them being unemployed.
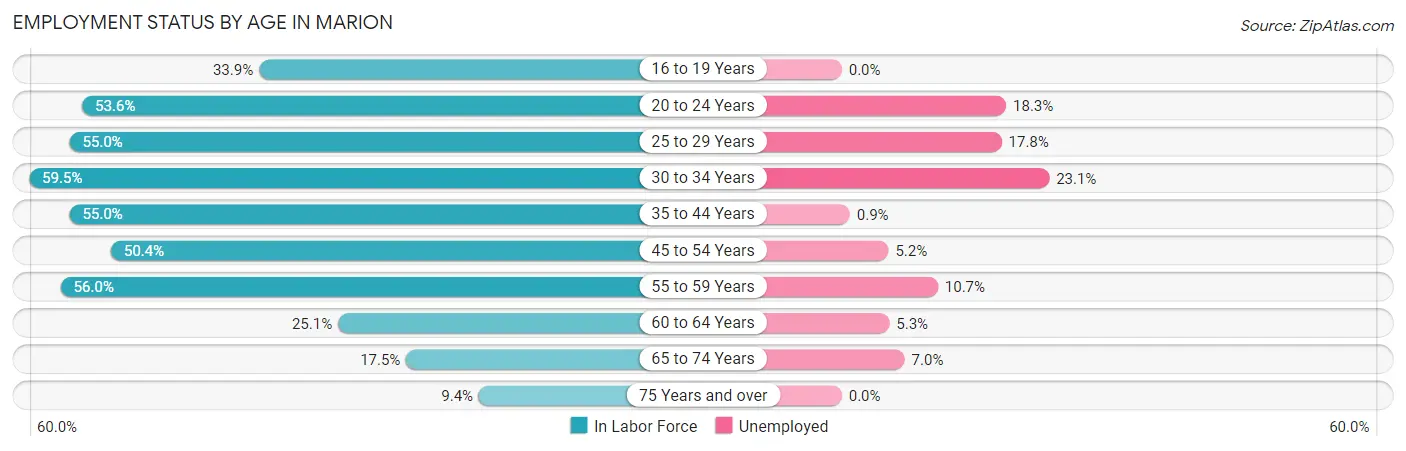
| Age Bracket | In Labor Force | Unemployed |
| 16 to 19 Years | 102 (33.9%) | 0 (0.0%) |
| 20 to 24 Years | 317 (53.6%) | 58 (18.3%) |
| 25 to 29 Years | 466 (55.0%) | 83 (17.8%) |
| 30 to 34 Years | 234 (59.5%) | 54 (23.1%) |
| 35 to 44 Years | 644 (55.0%) | 6 (0.9%) |
| 45 to 54 Years | 520 (50.4%) | 27 (5.2%) |
| 55 to 59 Years | 225 (56.0%) | 24 (10.7%) |
| 60 to 64 Years | 113 (25.1%) | 6 (5.3%) |
| 65 to 74 Years | 142 (17.5%) | 10 (7.0%) |
| 75 Years and over | 47 (9.4%) | 0 (0.0%) |
| Total | 2,807 (43.2%) | 267 (9.5%) |
Employment Status by Educational Attainment in Marion
According to labor force statistics for Marion, 51.3% of individuals (2,204) out of the total population between 25 and 64 years of age (4,296) are in the labor force, with 9.1% or 201 of them being unemployed. The group with the highest labor force participation rate are those with the educational attainment of bachelor's degree or higher, with 76.0% or 447 individuals in the labor force. Within the labor force, individuals with less than high school education have the highest percentage of unemployment, with 37.6% or 103 of them being unemployed.
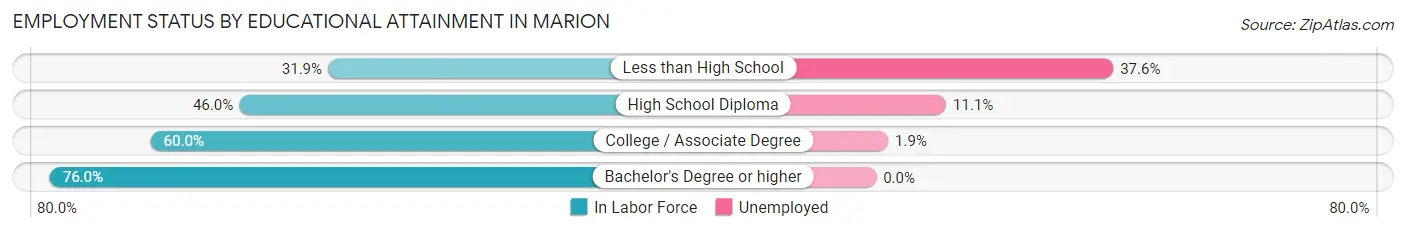
| Educational Attainment | In Labor Force | Unemployed |
| Less than High School | 274 (31.9%) | 323 (37.6%) |
| High School Diploma | 750 (46.0%) | 181 (11.1%) |
| College / Associate Degree | 731 (60.0%) | 23 (1.9%) |
| Bachelor's Degree or higher | 447 (76.0%) | 0 (0.0%) |
| Total | 2,204 (51.3%) | 391 (9.1%) |
Employment Occupations by Sex in Marion
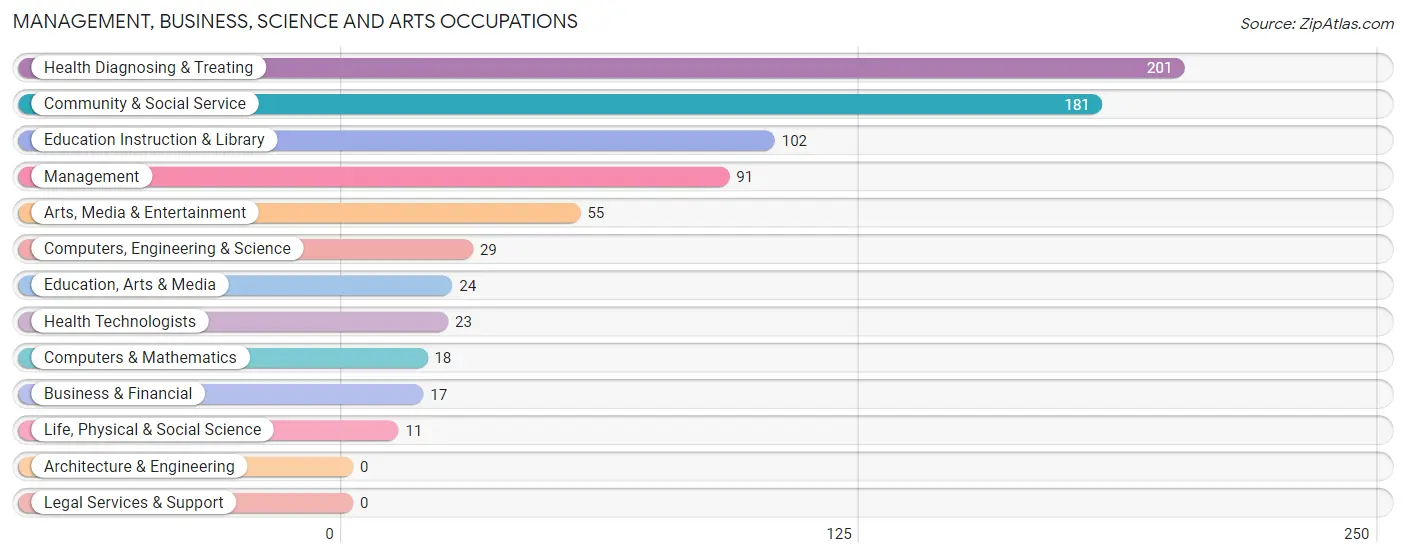
Management, Business, Science and Arts Occupations
The most common Management, Business, Science and Arts occupations in Marion are Health Diagnosing & Treating (201 | 7.9%), Community & Social Service (181 | 7.1%), Education Instruction & Library (102 | 4.0%), Management (91 | 3.6%), and Arts, Media & Entertainment (55 | 2.2%).
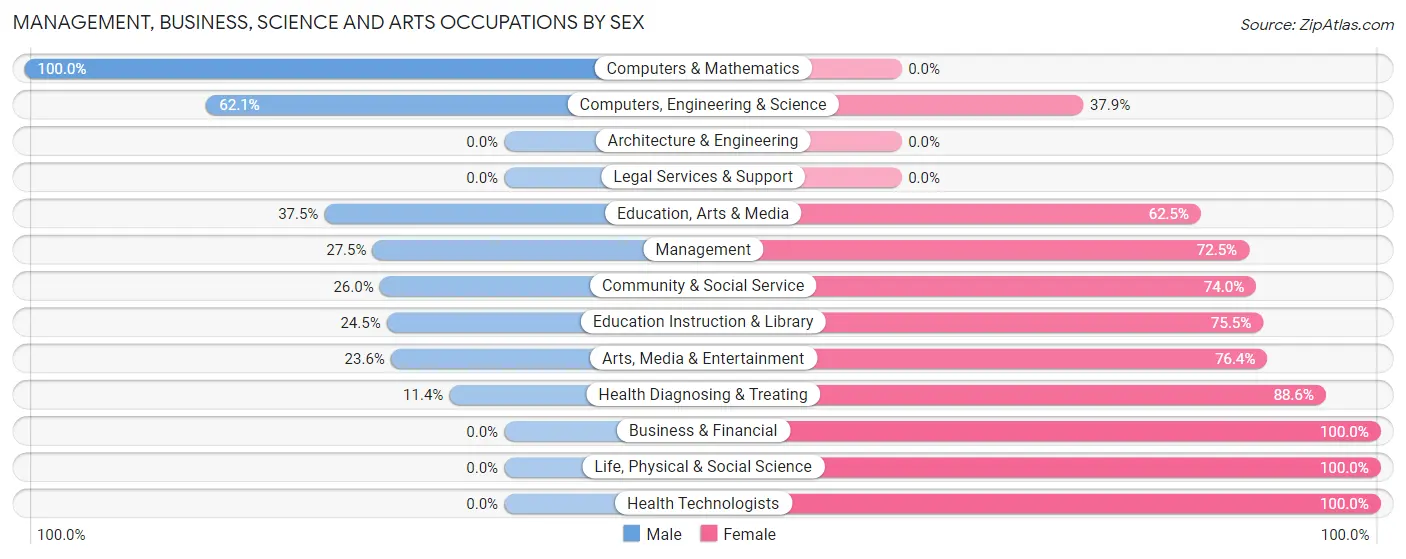
Management, Business, Science and Arts Occupations by Sex
Within the Management, Business, Science and Arts occupations in Marion, the most male-oriented occupations are Computers & Mathematics (100.0%), Computers, Engineering & Science (62.1%), and Education, Arts & Media (37.5%), while the most female-oriented occupations are Business & Financial (100.0%), Life, Physical & Social Science (100.0%), and Health Technologists (100.0%).
| Occupation | Male | Female |
| Management | 25 (27.5%) | 66 (72.5%) |
| Business & Financial | 0 (0.0%) | 17 (100.0%) |
| Computers, Engineering & Science | 18 (62.1%) | 11 (37.9%) |
| Computers & Mathematics | 18 (100.0%) | 0 (0.0%) |
| Architecture & Engineering | 0 (0.0%) | 0 (0.0%) |
| Life, Physical & Social Science | 0 (0.0%) | 11 (100.0%) |
| Community & Social Service | 47 (26.0%) | 134 (74.0%) |
| Education, Arts & Media | 9 (37.5%) | 15 (62.5%) |
| Legal Services & Support | 0 (0.0%) | 0 (0.0%) |
| Education Instruction & Library | 25 (24.5%) | 77 (75.5%) |
| Arts, Media & Entertainment | 13 (23.6%) | 42 (76.4%) |
| Health Diagnosing & Treating | 23 (11.4%) | 178 (88.6%) |
| Health Technologists | 0 (0.0%) | 23 (100.0%) |
| Total (Category) | 113 (21.8%) | 406 (78.2%) |
| Total (Overall) | 1,326 (52.2%) | 1,216 (47.8%) |
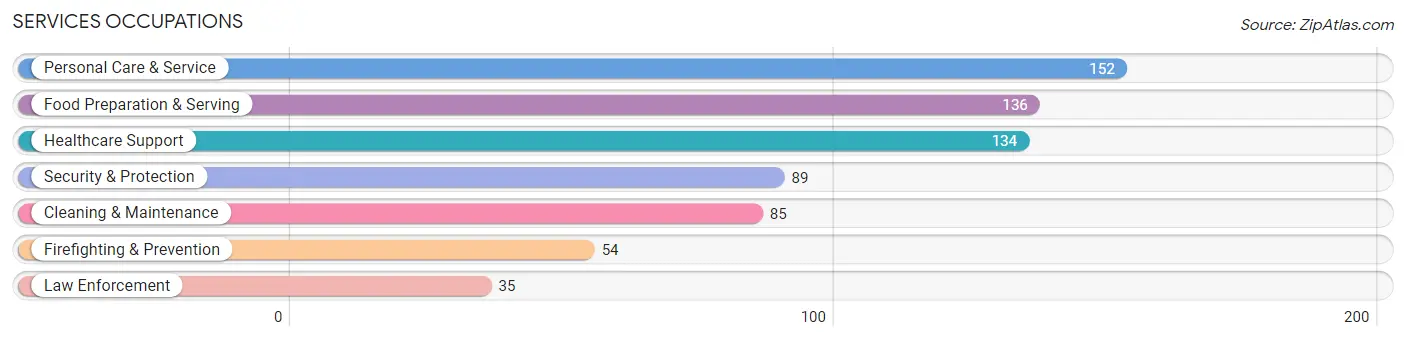
Services Occupations
The most common Services occupations in Marion are Personal Care & Service (152 | 6.0%), Food Preparation & Serving (136 | 5.3%), Healthcare Support (134 | 5.3%), Security & Protection (89 | 3.5%), and Cleaning & Maintenance (85 | 3.3%).
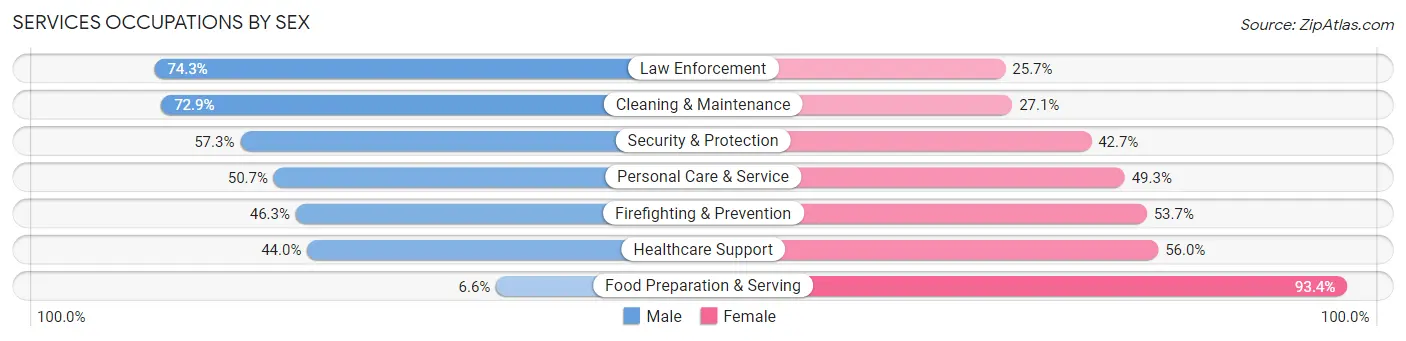
Services Occupations by Sex
Within the Services occupations in Marion, the most male-oriented occupations are Law Enforcement (74.3%), Cleaning & Maintenance (72.9%), and Security & Protection (57.3%), while the most female-oriented occupations are Food Preparation & Serving (93.4%), Healthcare Support (56.0%), and Firefighting & Prevention (53.7%).
| Occupation | Male | Female |
| Healthcare Support | 59 (44.0%) | 75 (56.0%) |
| Security & Protection | 51 (57.3%) | 38 (42.7%) |
| Firefighting & Prevention | 25 (46.3%) | 29 (53.7%) |
| Law Enforcement | 26 (74.3%) | 9 (25.7%) |
| Food Preparation & Serving | 9 (6.6%) | 127 (93.4%) |
| Cleaning & Maintenance | 62 (72.9%) | 23 (27.1%) |
| Personal Care & Service | 77 (50.7%) | 75 (49.3%) |
| Total (Category) | 258 (43.3%) | 338 (56.7%) |
| Total (Overall) | 1,326 (52.2%) | 1,216 (47.8%) |
Sales and Office Occupations
The most common Sales and Office occupations in Marion are Sales & Related (258 | 10.2%), and Office & Administration (181 | 7.1%).
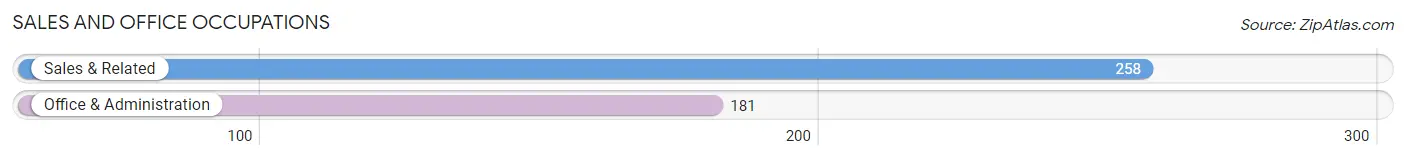
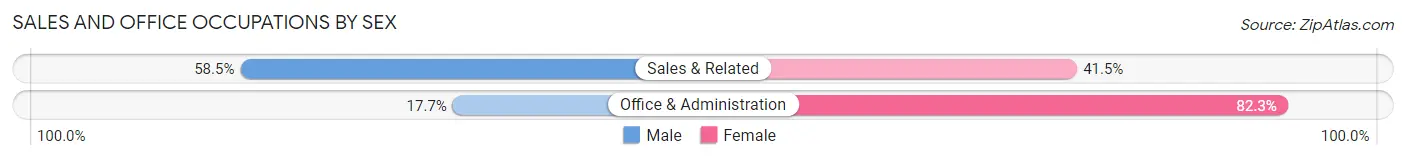
Sales and Office Occupations by Sex
| Occupation | Male | Female |
| Sales & Related | 151 (58.5%) | 107 (41.5%) |
| Office & Administration | 32 (17.7%) | 149 (82.3%) |
| Total (Category) | 183 (41.7%) | 256 (58.3%) |
| Total (Overall) | 1,326 (52.2%) | 1,216 (47.8%) |
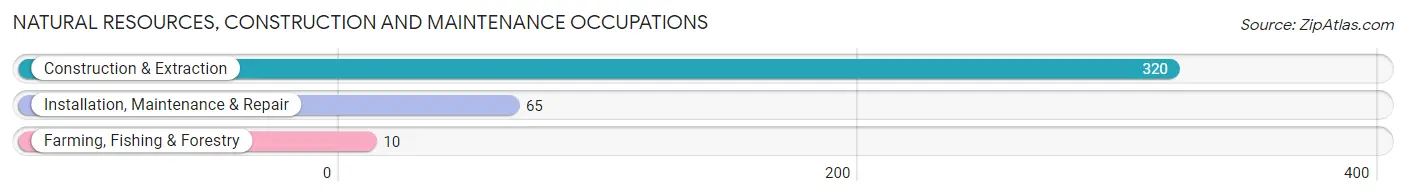
Natural Resources, Construction and Maintenance Occupations
The most common Natural Resources, Construction and Maintenance occupations in Marion are Construction & Extraction (320 | 12.6%), Installation, Maintenance & Repair (65 | 2.6%), and Farming, Fishing & Forestry (10 | 0.4%).
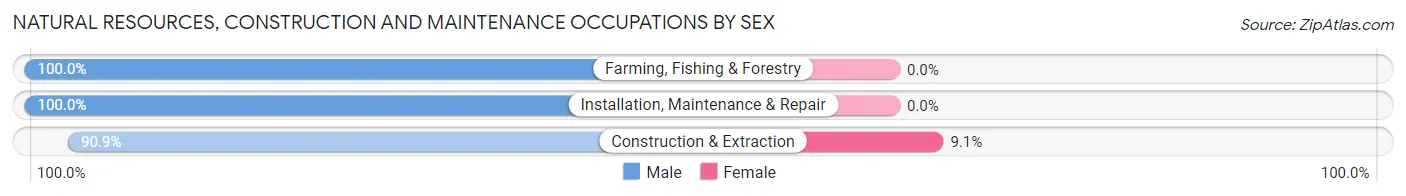
Natural Resources, Construction and Maintenance Occupations by Sex
| Occupation | Male | Female |
| Farming, Fishing & Forestry | 10 (100.0%) | 0 (0.0%) |
| Construction & Extraction | 291 (90.9%) | 29 (9.1%) |
| Installation, Maintenance & Repair | 65 (100.0%) | 0 (0.0%) |
| Total (Category) | 366 (92.7%) | 29 (7.3%) |
| Total (Overall) | 1,326 (52.2%) | 1,216 (47.8%) |
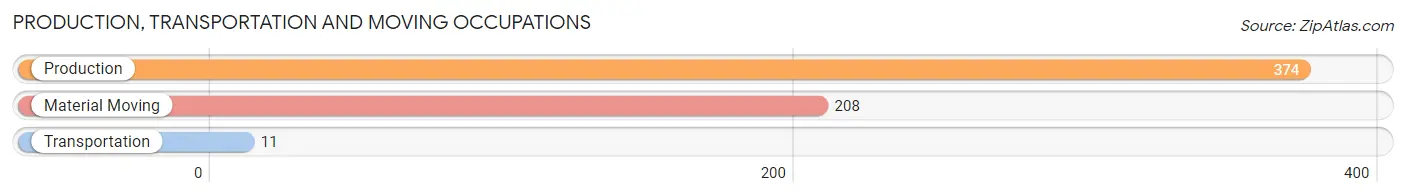
Production, Transportation and Moving Occupations
The most common Production, Transportation and Moving occupations in Marion are Production (374 | 14.7%), Material Moving (208 | 8.2%), and Transportation (11 | 0.4%).
Production, Transportation and Moving Occupations by Sex
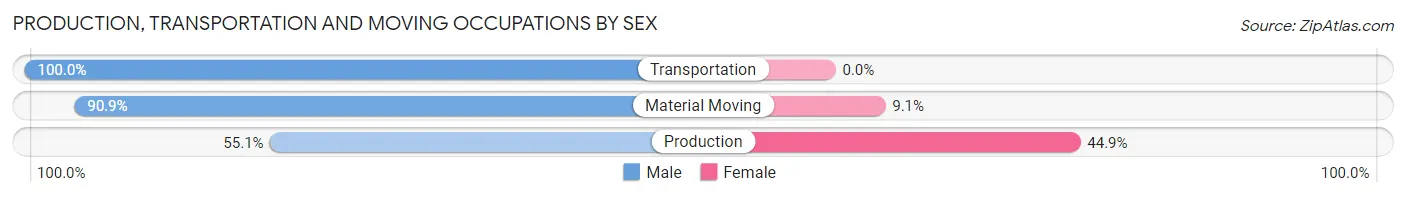
| Occupation | Male | Female |
| Production | 206 (55.1%) | 168 (44.9%) |
| Transportation | 11 (100.0%) | 0 (0.0%) |
| Material Moving | 189 (90.9%) | 19 (9.1%) |
| Total (Category) | 406 (68.5%) | 187 (31.5%) |
| Total (Overall) | 1,326 (52.2%) | 1,216 (47.8%) |
Employment Industries by Sex in Marion
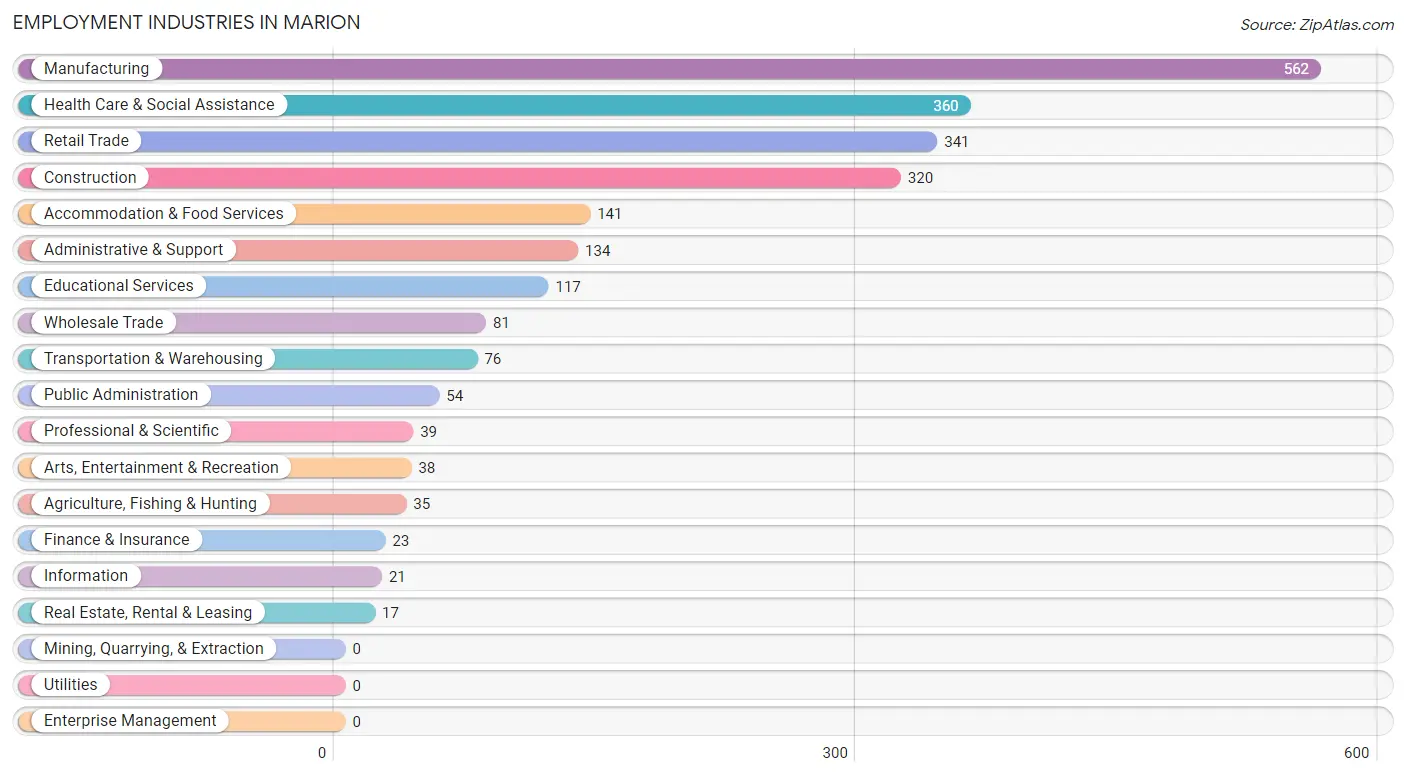
Employment Industries in Marion
The major employment industries in Marion include Manufacturing (562 | 22.1%), Health Care & Social Assistance (360 | 14.2%), Retail Trade (341 | 13.4%), Construction (320 | 12.6%), and Accommodation & Food Services (141 | 5.6%).
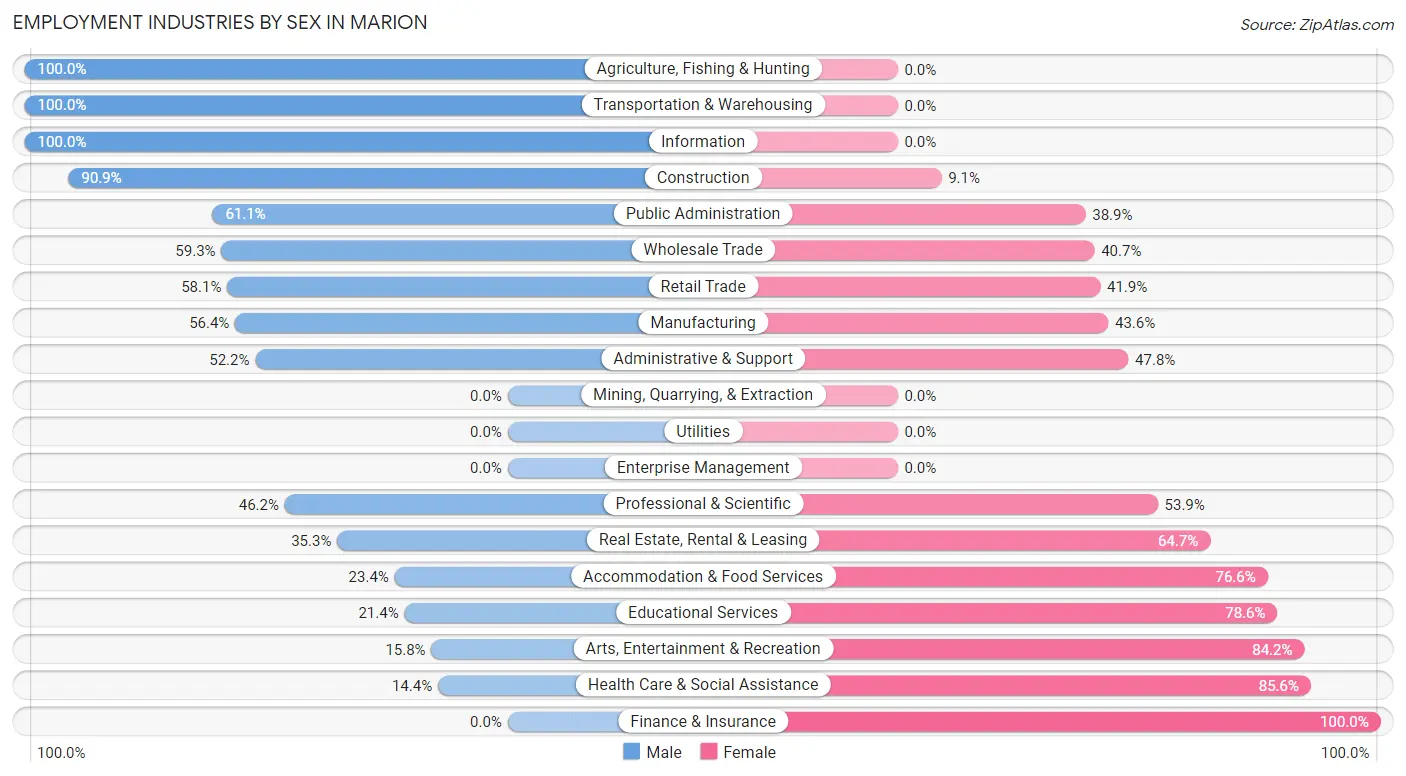
Employment Industries by Sex in Marion
The Marion industries that see more men than women are Agriculture, Fishing & Hunting (100.0%), Transportation & Warehousing (100.0%), and Information (100.0%), whereas the industries that tend to have a higher number of women are Finance & Insurance (100.0%), Health Care & Social Assistance (85.6%), and Arts, Entertainment & Recreation (84.2%).
| Industry | Male | Female |
| Agriculture, Fishing & Hunting | 35 (100.0%) | 0 (0.0%) |
| Mining, Quarrying, & Extraction | 0 (0.0%) | 0 (0.0%) |
| Construction | 291 (90.9%) | 29 (9.1%) |
| Manufacturing | 317 (56.4%) | 245 (43.6%) |
| Wholesale Trade | 48 (59.3%) | 33 (40.7%) |
| Retail Trade | 198 (58.1%) | 143 (41.9%) |
| Transportation & Warehousing | 76 (100.0%) | 0 (0.0%) |
| Utilities | 0 (0.0%) | 0 (0.0%) |
| Information | 21 (100.0%) | 0 (0.0%) |
| Finance & Insurance | 0 (0.0%) | 23 (100.0%) |
| Real Estate, Rental & Leasing | 6 (35.3%) | 11 (64.7%) |
| Professional & Scientific | 18 (46.2%) | 21 (53.8%) |
| Enterprise Management | 0 (0.0%) | 0 (0.0%) |
| Administrative & Support | 70 (52.2%) | 64 (47.8%) |
| Educational Services | 25 (21.4%) | 92 (78.6%) |
| Health Care & Social Assistance | 52 (14.4%) | 308 (85.6%) |
| Arts, Entertainment & Recreation | 6 (15.8%) | 32 (84.2%) |
| Accommodation & Food Services | 33 (23.4%) | 108 (76.6%) |
| Public Administration | 33 (61.1%) | 21 (38.9%) |
| Total | 1,326 (52.2%) | 1,216 (47.8%) |
Education in Marion
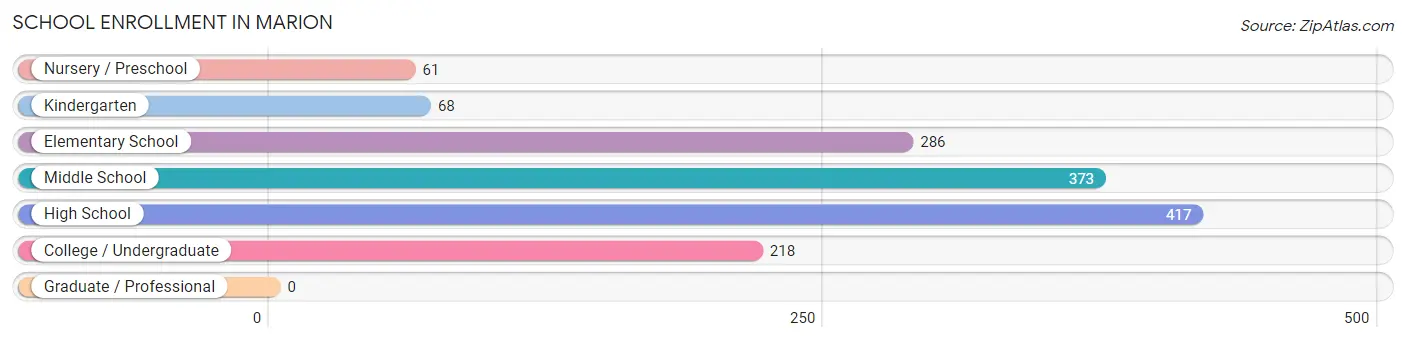
School Enrollment in Marion
The most common levels of schooling among the 1,423 students in Marion are high school (417 | 29.3%), middle school (373 | 26.2%), and elementary school (286 | 20.1%).
| School Level | # Students | % Students |
| Nursery / Preschool | 61 | 4.3% |
| Kindergarten | 68 | 4.8% |
| Elementary School | 286 | 20.1% |
| Middle School | 373 | 26.2% |
| High School | 417 | 29.3% |
| College / Undergraduate | 218 | 15.3% |
| Graduate / Professional | 0 | 0.0% |
| Total | 1,423 | 100.0% |
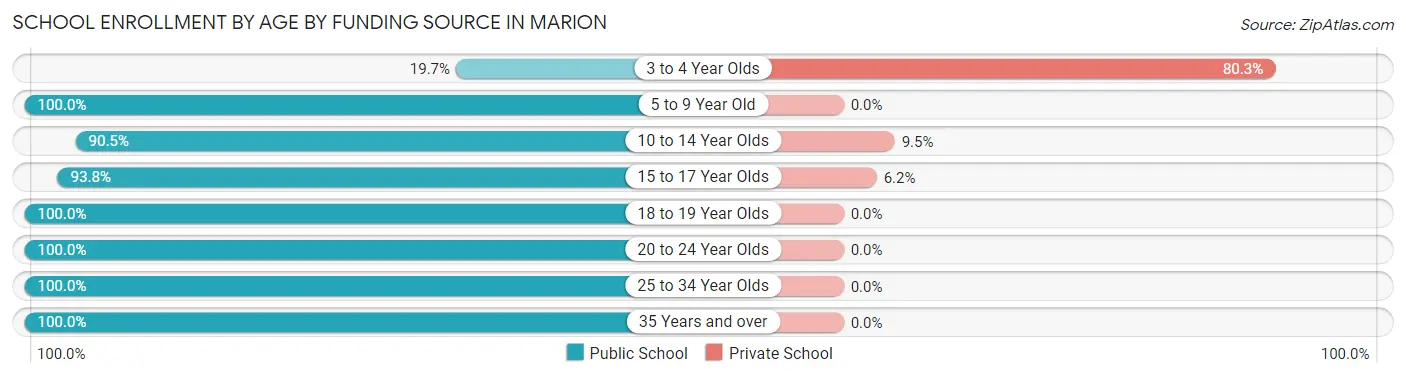
School Enrollment by Age by Funding Source in Marion
Out of a total of 1,423 students who are enrolled in schools in Marion, 112 (7.9%) attend a private institution, while the remaining 1,311 (92.1%) are enrolled in public schools. The age group of 3 to 4 year olds has the highest likelihood of being enrolled in private schools, with 49 (80.3% in the age bracket) enrolled. Conversely, the age group of 5 to 9 year old has the lowest likelihood of being enrolled in a private school, with 305 (100.0% in the age bracket) attending a public institution.
| Age Bracket | Public School | Private School |
| 3 to 4 Year Olds | 12 (19.7%) | 49 (80.3%) |
| 5 to 9 Year Old | 305 (100.0%) | 0 (0.0%) |
| 10 to 14 Year Olds | 428 (90.5%) | 45 (9.5%) |
| 15 to 17 Year Olds | 274 (93.8%) | 18 (6.2%) |
| 18 to 19 Year Olds | 88 (100.0%) | 0 (0.0%) |
| 20 to 24 Year Olds | 125 (100.0%) | 0 (0.0%) |
| 25 to 34 Year Olds | 61 (100.0%) | 0 (0.0%) |
| 35 Years and over | 18 (100.0%) | 0 (0.0%) |
| Total | 1,311 (92.1%) | 112 (7.9%) |
Educational Attainment by Field of Study in Marion
Business (240 | 25.6%), education (201 | 21.5%), arts & humanities (105 | 11.2%), bio, nature & agricultural (83 | 8.9%), and social sciences (62 | 6.6%) are the most common fields of study among 936 individuals in Marion who have obtained a bachelor's degree or higher.
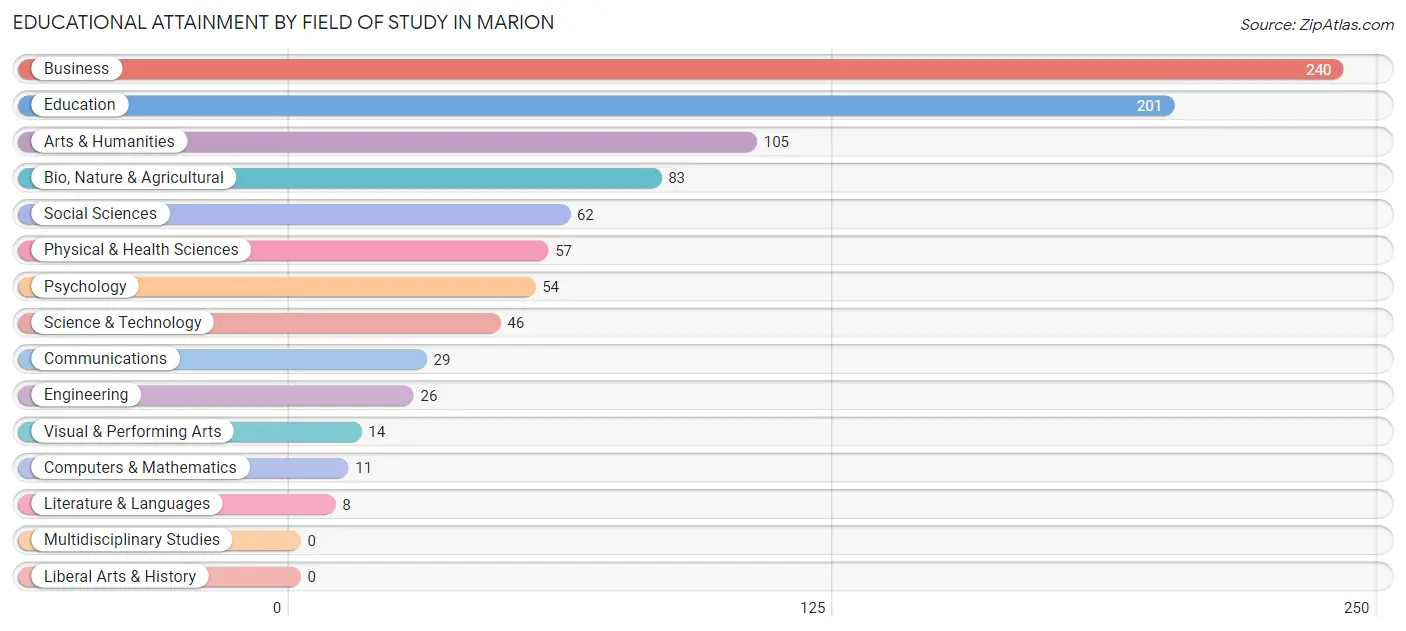
| Field of Study | # Graduates | % Graduates |
| Computers & Mathematics | 11 | 1.2% |
| Bio, Nature & Agricultural | 83 | 8.9% |
| Physical & Health Sciences | 57 | 6.1% |
| Psychology | 54 | 5.8% |
| Social Sciences | 62 | 6.6% |
| Engineering | 26 | 2.8% |
| Multidisciplinary Studies | 0 | 0.0% |
| Science & Technology | 46 | 4.9% |
| Business | 240 | 25.6% |
| Education | 201 | 21.5% |
| Literature & Languages | 8 | 0.9% |
| Liberal Arts & History | 0 | 0.0% |
| Visual & Performing Arts | 14 | 1.5% |
| Communications | 29 | 3.1% |
| Arts & Humanities | 105 | 11.2% |
| Total | 936 | 100.0% |
Transportation & Commute in Marion
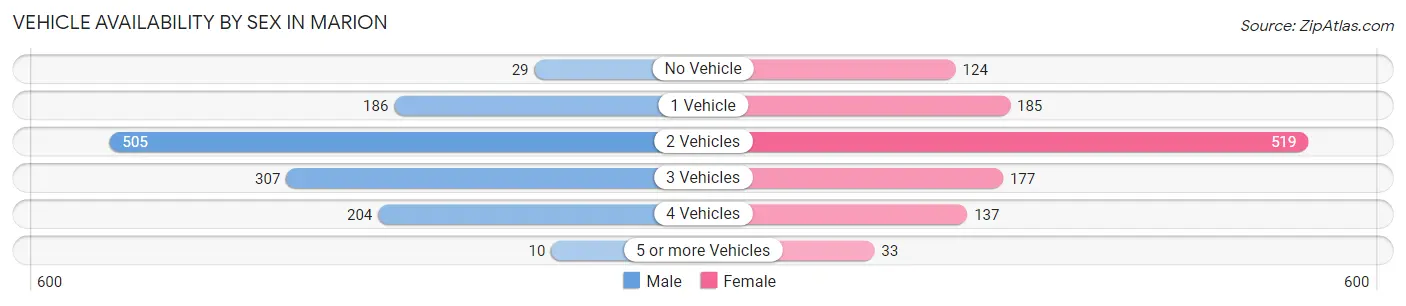
Vehicle Availability by Sex in Marion
The most prevalent vehicle ownership categories in Marion are males with 2 vehicles (505, accounting for 40.7%) and females with 2 vehicles (519, making up 43.0%).
| Vehicles Available | Male | Female |
| No Vehicle | 29 (2.3%) | 124 (10.5%) |
| 1 Vehicle | 186 (15.0%) | 185 (15.7%) |
| 2 Vehicles | 505 (40.7%) | 519 (44.2%) |
| 3 Vehicles | 307 (24.7%) | 177 (15.1%) |
| 4 Vehicles | 204 (16.4%) | 137 (11.7%) |
| 5 or more Vehicles | 10 (0.8%) | 33 (2.8%) |
| Total | 1,241 (100.0%) | 1,175 (100.0%) |
Commute Time in Marion
The most frequently occuring commute durations in Marion are 10 to 14 minutes (485 commuters, 20.2%), 30 to 34 minutes (341 commuters, 14.2%), and 5 to 9 minutes (270 commuters, 11.2%).
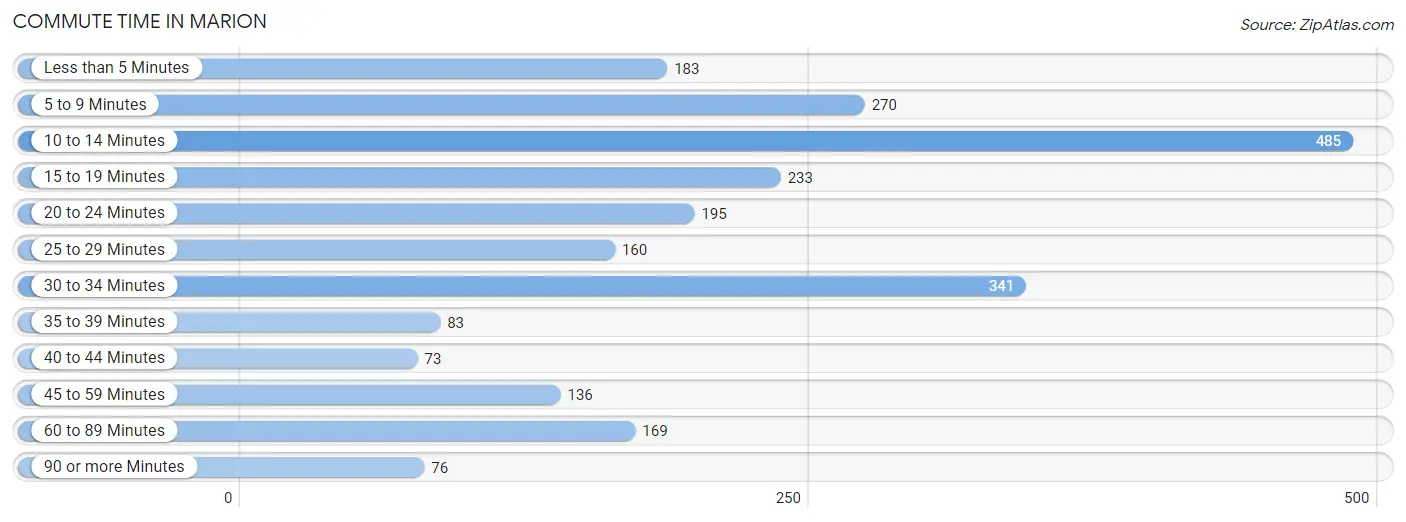
| Commute Time | # Commuters | % Commuters |
| Less than 5 Minutes | 183 | 7.6% |
| 5 to 9 Minutes | 270 | 11.2% |
| 10 to 14 Minutes | 485 | 20.2% |
| 15 to 19 Minutes | 233 | 9.7% |
| 20 to 24 Minutes | 195 | 8.1% |
| 25 to 29 Minutes | 160 | 6.7% |
| 30 to 34 Minutes | 341 | 14.2% |
| 35 to 39 Minutes | 83 | 3.5% |
| 40 to 44 Minutes | 73 | 3.0% |
| 45 to 59 Minutes | 136 | 5.7% |
| 60 to 89 Minutes | 169 | 7.0% |
| 90 or more Minutes | 76 | 3.2% |
Commute Time by Sex in Marion
The most common commute times in Marion are 10 to 14 minutes (285 commuters, 23.0%) for males and 10 to 14 minutes (200 commuters, 17.2%) for females.
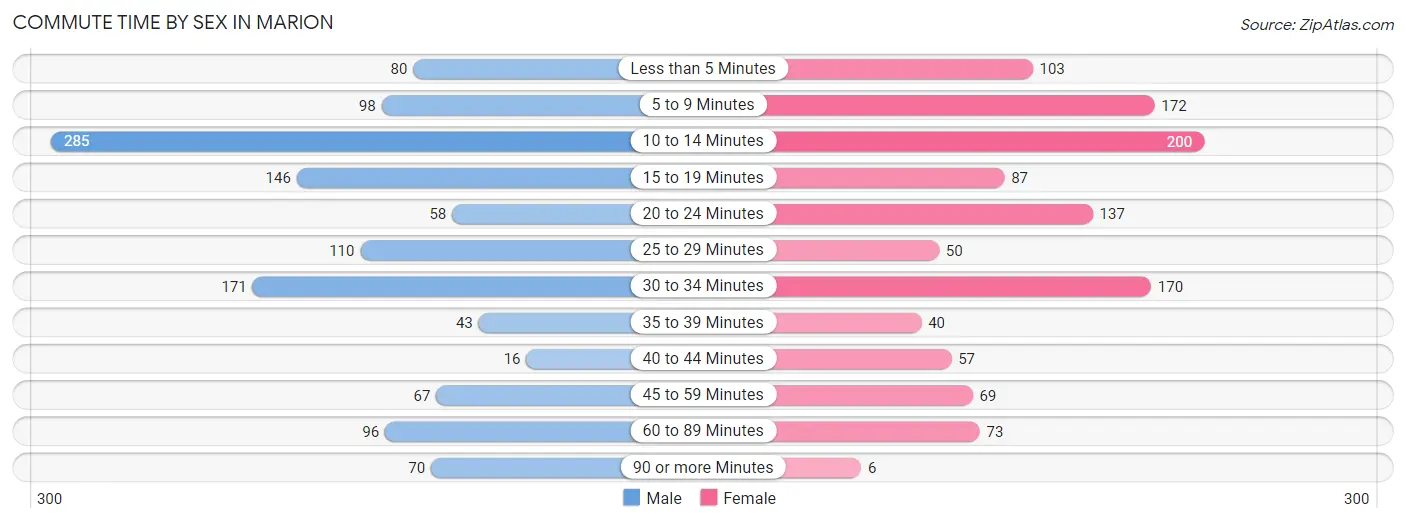
| Commute Time | Male | Female |
| Less than 5 Minutes | 80 (6.5%) | 103 (8.8%) |
| 5 to 9 Minutes | 98 (7.9%) | 172 (14.8%) |
| 10 to 14 Minutes | 285 (23.0%) | 200 (17.2%) |
| 15 to 19 Minutes | 146 (11.8%) | 87 (7.5%) |
| 20 to 24 Minutes | 58 (4.7%) | 137 (11.8%) |
| 25 to 29 Minutes | 110 (8.9%) | 50 (4.3%) |
| 30 to 34 Minutes | 171 (13.8%) | 170 (14.6%) |
| 35 to 39 Minutes | 43 (3.5%) | 40 (3.4%) |
| 40 to 44 Minutes | 16 (1.3%) | 57 (4.9%) |
| 45 to 59 Minutes | 67 (5.4%) | 69 (5.9%) |
| 60 to 89 Minutes | 96 (7.7%) | 73 (6.3%) |
| 90 or more Minutes | 70 (5.7%) | 6 (0.5%) |
Time of Departure to Work by Sex in Marion
The most frequent times of departure to work in Marion are 6:00 AM to 6:29 AM (245, 19.8%) for males and 4:00 PM to 11:59 PM (248, 21.3%) for females.
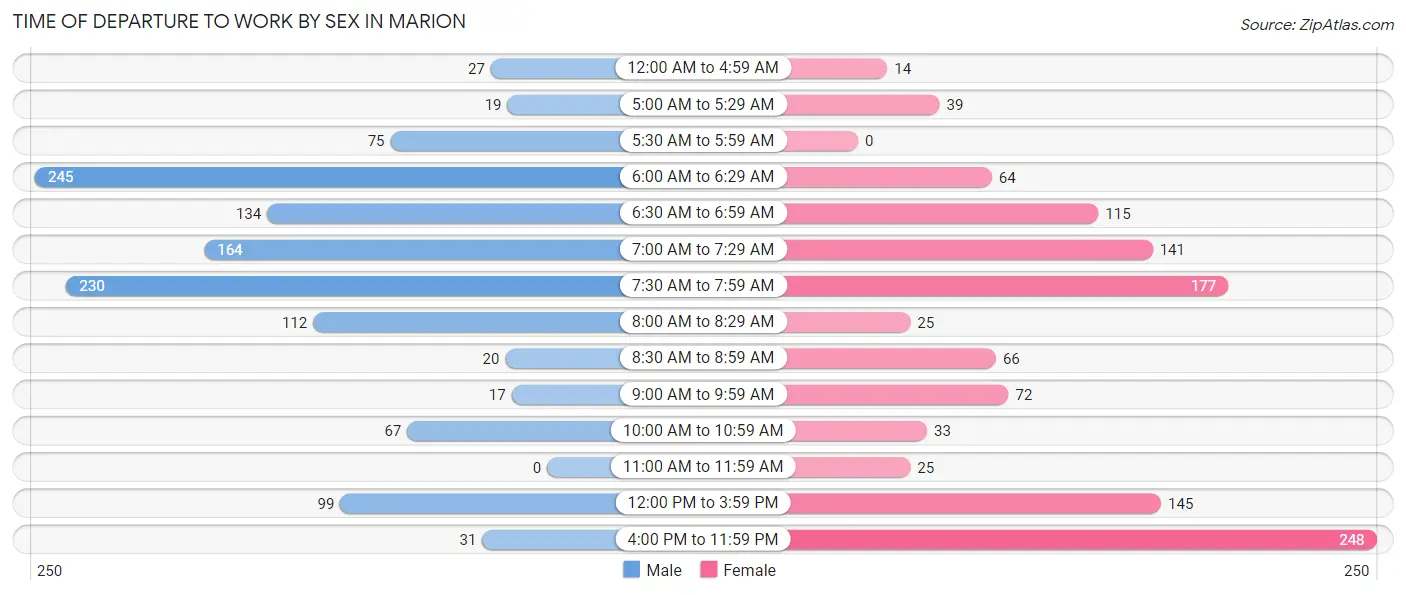
| Time of Departure | Male | Female |
| 12:00 AM to 4:59 AM | 27 (2.2%) | 14 (1.2%) |
| 5:00 AM to 5:29 AM | 19 (1.5%) | 39 (3.4%) |
| 5:30 AM to 5:59 AM | 75 (6.0%) | 0 (0.0%) |
| 6:00 AM to 6:29 AM | 245 (19.8%) | 64 (5.5%) |
| 6:30 AM to 6:59 AM | 134 (10.8%) | 115 (9.9%) |
| 7:00 AM to 7:29 AM | 164 (13.2%) | 141 (12.1%) |
| 7:30 AM to 7:59 AM | 230 (18.5%) | 177 (15.2%) |
| 8:00 AM to 8:29 AM | 112 (9.0%) | 25 (2.1%) |
| 8:30 AM to 8:59 AM | 20 (1.6%) | 66 (5.7%) |
| 9:00 AM to 9:59 AM | 17 (1.4%) | 72 (6.2%) |
| 10:00 AM to 10:59 AM | 67 (5.4%) | 33 (2.8%) |
| 11:00 AM to 11:59 AM | 0 (0.0%) | 25 (2.1%) |
| 12:00 PM to 3:59 PM | 99 (8.0%) | 145 (12.5%) |
| 4:00 PM to 11:59 PM | 31 (2.5%) | 248 (21.3%) |
| Total | 1,240 (100.0%) | 1,164 (100.0%) |
Housing Occupancy in Marion
Occupancy by Ownership in Marion
Of the total 2,800 dwellings in Marion, owner-occupied units account for 1,409 (50.3%), while renter-occupied units make up 1,391 (49.7%).
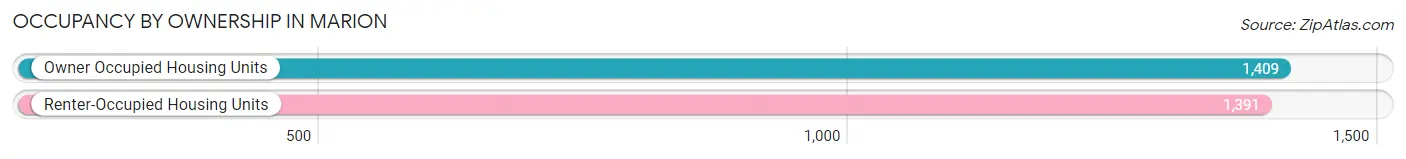
| Occupancy | # Housing Units | % Housing Units |
| Owner Occupied Housing Units | 1,409 | 50.3% |
| Renter-Occupied Housing Units | 1,391 | 49.7% |
| Total Occupied Housing Units | 2,800 | 100.0% |
Occupancy by Household Size in Marion
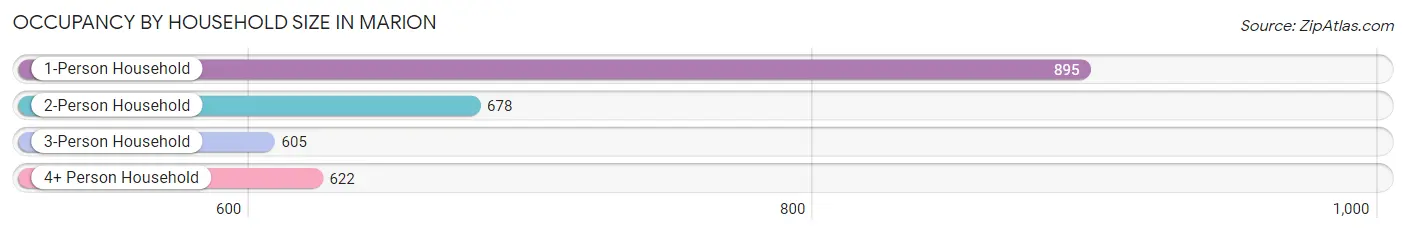
| Household Size | # Housing Units | % Housing Units |
| 1-Person Household | 895 | 32.0% |
| 2-Person Household | 678 | 24.2% |
| 3-Person Household | 605 | 21.6% |
| 4+ Person Household | 622 | 22.2% |
| Total Housing Units | 2,800 | 100.0% |
Occupancy by Ownership by Household Size in Marion
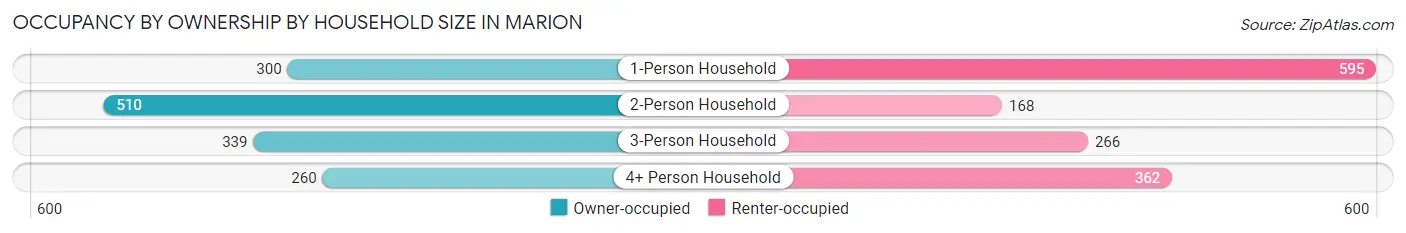
| Household Size | Owner-occupied | Renter-occupied |
| 1-Person Household | 300 (33.5%) | 595 (66.5%) |
| 2-Person Household | 510 (75.2%) | 168 (24.8%) |
| 3-Person Household | 339 (56.0%) | 266 (44.0%) |
| 4+ Person Household | 260 (41.8%) | 362 (58.2%) |
| Total Housing Units | 1,409 (50.3%) | 1,391 (49.7%) |
Occupancy by Educational Attainment in Marion
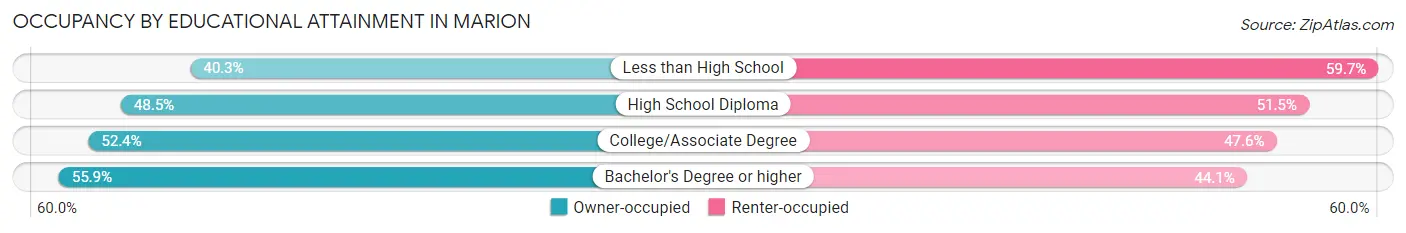
| Household Size | Owner-occupied | Renter-occupied |
| Less than High School | 166 (40.3%) | 246 (59.7%) |
| High School Diploma | 382 (48.5%) | 405 (51.5%) |
| College/Associate Degree | 512 (52.4%) | 465 (47.6%) |
| Bachelor's Degree or higher | 349 (55.9%) | 275 (44.1%) |
Occupancy by Age of Householder in Marion
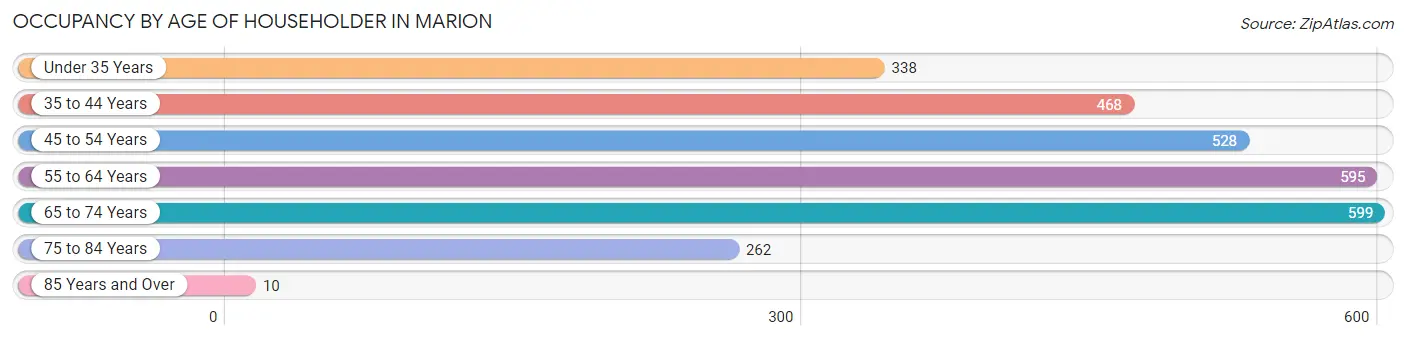
| Age Bracket | # Households | % Households |
| Under 35 Years | 338 | 12.1% |
| 35 to 44 Years | 468 | 16.7% |
| 45 to 54 Years | 528 | 18.9% |
| 55 to 64 Years | 595 | 21.2% |
| 65 to 74 Years | 599 | 21.4% |
| 75 to 84 Years | 262 | 9.4% |
| 85 Years and Over | 10 | 0.4% |
| Total | 2,800 | 100.0% |
Housing Finances in Marion
Median Income by Occupancy in Marion
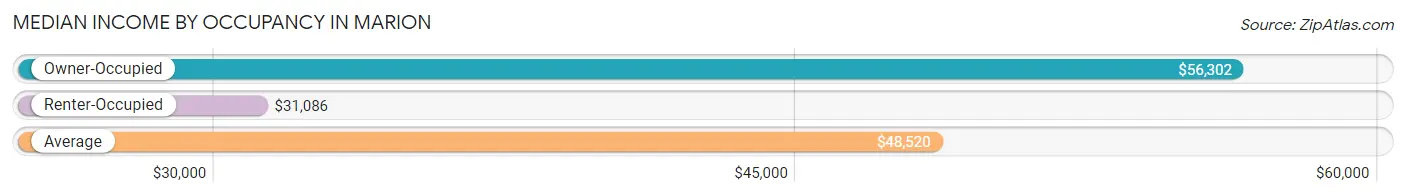
| Occupancy Type | # Households | Median Income |
| Owner-Occupied | 1,409 (50.3%) | $56,302 |
| Renter-Occupied | 1,391 (49.7%) | $31,086 |
| Average | 2,800 (100.0%) | $48,520 |
Occupancy by Householder Income Bracket in Marion
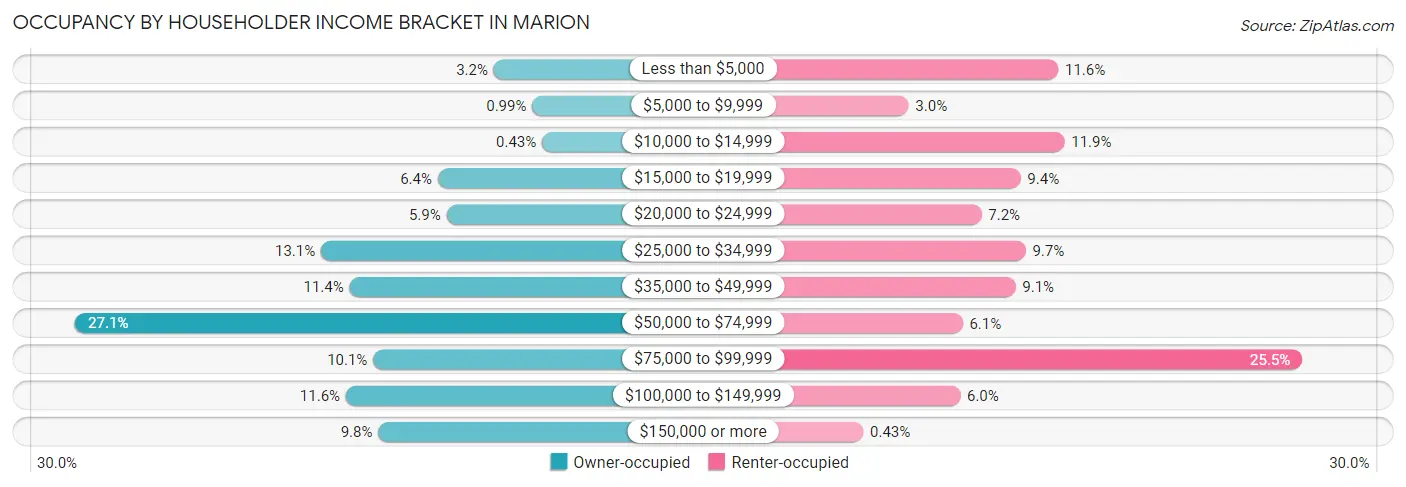
| Income Bracket | Owner-occupied | Renter-occupied |
| Less than $5,000 | 45 (3.2%) | 161 (11.6%) |
| $5,000 to $9,999 | 14 (1.0%) | 42 (3.0%) |
| $10,000 to $14,999 | 6 (0.4%) | 166 (11.9%) |
| $15,000 to $19,999 | 90 (6.4%) | 131 (9.4%) |
| $20,000 to $24,999 | 83 (5.9%) | 100 (7.2%) |
| $25,000 to $34,999 | 184 (13.1%) | 135 (9.7%) |
| $35,000 to $49,999 | 161 (11.4%) | 127 (9.1%) |
| $50,000 to $74,999 | 382 (27.1%) | 85 (6.1%) |
| $75,000 to $99,999 | 142 (10.1%) | 355 (25.5%) |
| $100,000 to $149,999 | 164 (11.6%) | 83 (6.0%) |
| $150,000 or more | 138 (9.8%) | 6 (0.4%) |
| Total | 1,409 (100.0%) | 1,391 (100.0%) |
Monthly Housing Cost Tiers in Marion
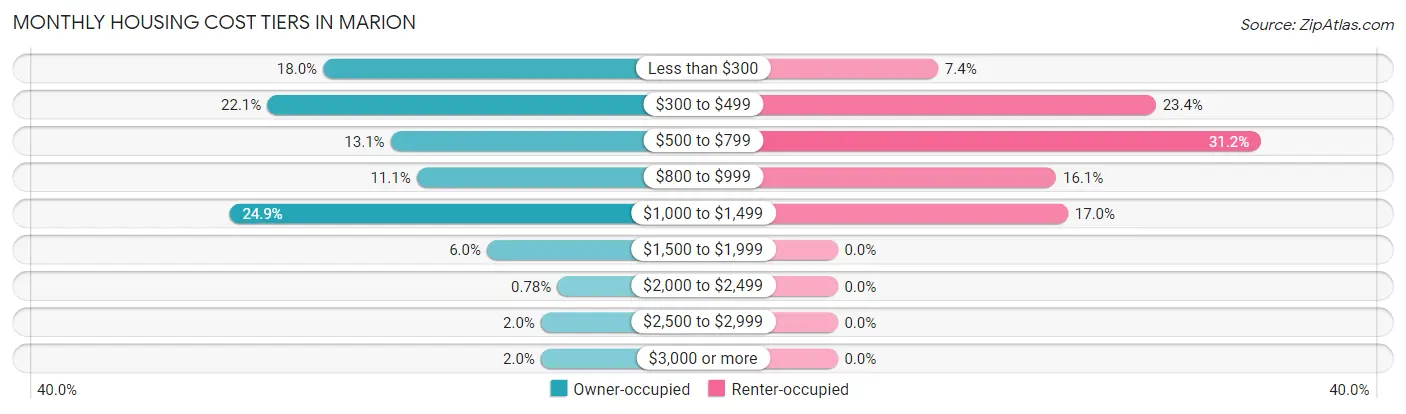
| Monthly Cost | Owner-occupied | Renter-occupied |
| Less than $300 | 254 (18.0%) | 103 (7.4%) |
| $300 to $499 | 312 (22.1%) | 326 (23.4%) |
| $500 to $799 | 184 (13.1%) | 434 (31.2%) |
| $800 to $999 | 157 (11.1%) | 224 (16.1%) |
| $1,000 to $1,499 | 351 (24.9%) | 236 (17.0%) |
| $1,500 to $1,999 | 84 (6.0%) | 0 (0.0%) |
| $2,000 to $2,499 | 11 (0.8%) | 0 (0.0%) |
| $2,500 to $2,999 | 28 (2.0%) | 0 (0.0%) |
| $3,000 or more | 28 (2.0%) | 0 (0.0%) |
| Total | 1,409 (100.0%) | 1,391 (100.0%) |
Physical Housing Characteristics in Marion
Housing Structures in Marion
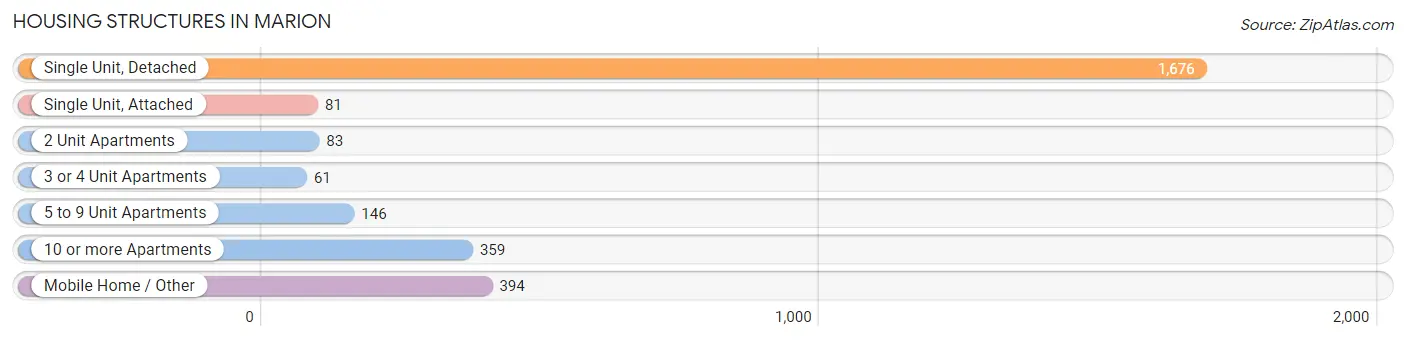
| Structure Type | # Housing Units | % Housing Units |
| Single Unit, Detached | 1,676 | 59.9% |
| Single Unit, Attached | 81 | 2.9% |
| 2 Unit Apartments | 83 | 3.0% |
| 3 or 4 Unit Apartments | 61 | 2.2% |
| 5 to 9 Unit Apartments | 146 | 5.2% |
| 10 or more Apartments | 359 | 12.8% |
| Mobile Home / Other | 394 | 14.1% |
| Total | 2,800 | 100.0% |
Housing Structures by Occupancy in Marion
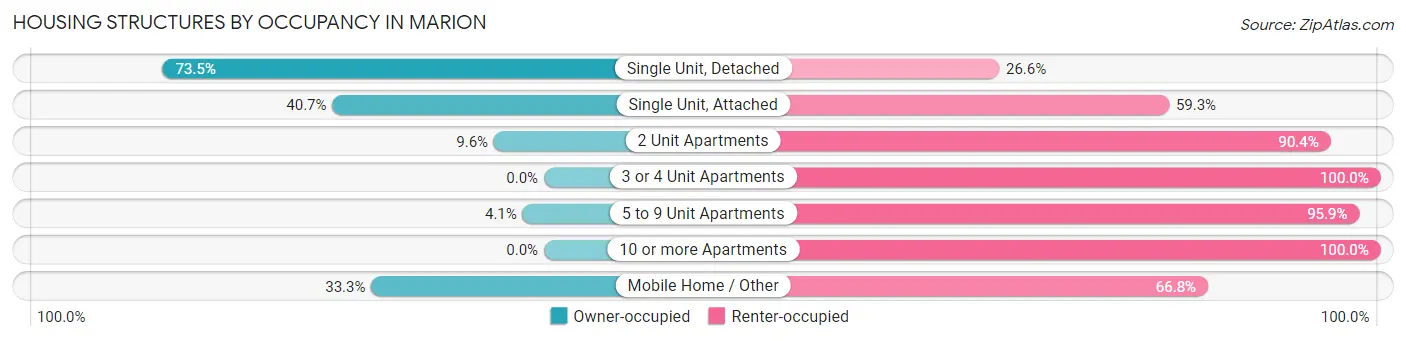
| Structure Type | Owner-occupied | Renter-occupied |
| Single Unit, Detached | 1,231 (73.5%) | 445 (26.6%) |
| Single Unit, Attached | 33 (40.7%) | 48 (59.3%) |
| 2 Unit Apartments | 8 (9.6%) | 75 (90.4%) |
| 3 or 4 Unit Apartments | 0 (0.0%) | 61 (100.0%) |
| 5 to 9 Unit Apartments | 6 (4.1%) | 140 (95.9%) |
| 10 or more Apartments | 0 (0.0%) | 359 (100.0%) |
| Mobile Home / Other | 131 (33.3%) | 263 (66.7%) |
| Total | 1,409 (50.3%) | 1,391 (49.7%) |
Housing Structures by Number of Rooms in Marion
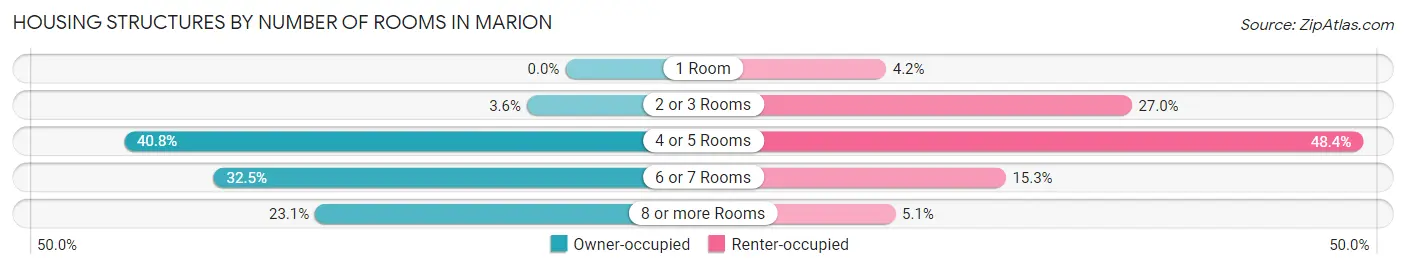
| Number of Rooms | Owner-occupied | Renter-occupied |
| 1 Room | 0 (0.0%) | 59 (4.2%) |
| 2 or 3 Rooms | 50 (3.5%) | 375 (27.0%) |
| 4 or 5 Rooms | 575 (40.8%) | 673 (48.4%) |
| 6 or 7 Rooms | 458 (32.5%) | 213 (15.3%) |
| 8 or more Rooms | 326 (23.1%) | 71 (5.1%) |
| Total | 1,409 (100.0%) | 1,391 (100.0%) |
Housing Structure by Heating Type in Marion
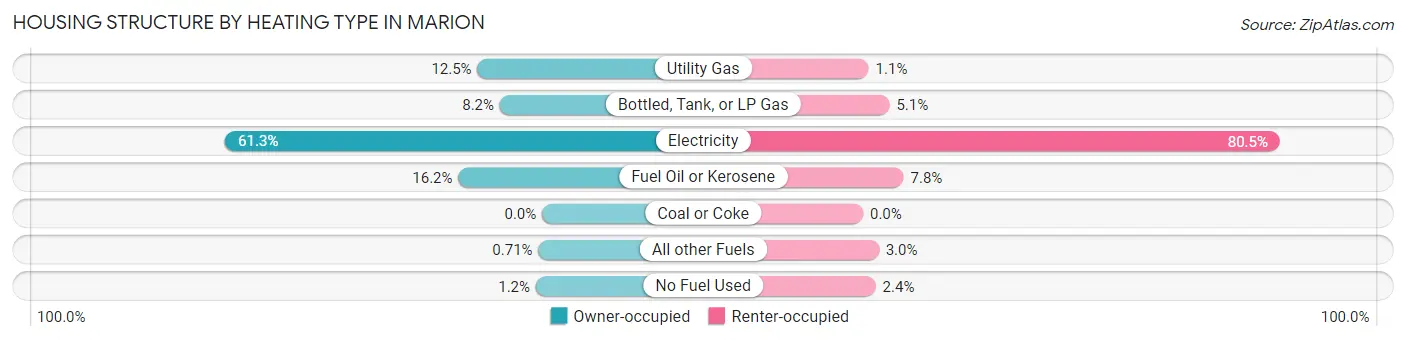
| Heating Type | Owner-occupied | Renter-occupied |
| Utility Gas | 176 (12.5%) | 15 (1.1%) |
| Bottled, Tank, or LP Gas | 115 (8.2%) | 71 (5.1%) |
| Electricity | 863 (61.3%) | 1,120 (80.5%) |
| Fuel Oil or Kerosene | 228 (16.2%) | 109 (7.8%) |
| Coal or Coke | 0 (0.0%) | 0 (0.0%) |
| All other Fuels | 10 (0.7%) | 42 (3.0%) |
| No Fuel Used | 17 (1.2%) | 34 (2.4%) |
| Total | 1,409 (100.0%) | 1,391 (100.0%) |
Household Vehicle Usage in Marion
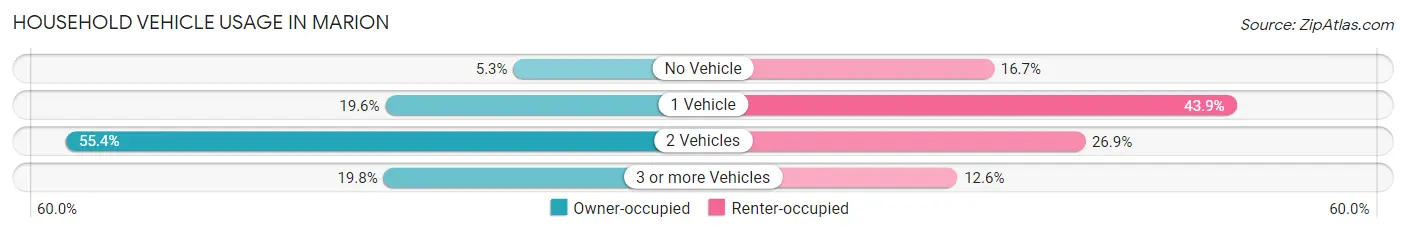
| Vehicles per Household | Owner-occupied | Renter-occupied |
| No Vehicle | 74 (5.2%) | 232 (16.7%) |
| 1 Vehicle | 276 (19.6%) | 610 (43.9%) |
| 2 Vehicles | 780 (55.4%) | 374 (26.9%) |
| 3 or more Vehicles | 279 (19.8%) | 175 (12.6%) |
| Total | 1,409 (100.0%) | 1,391 (100.0%) |
Real Estate & Mortgages in Marion
Real Estate and Mortgage Overview in Marion
| Characteristic | Without Mortgage | With Mortgage |
| Housing Units | 567 | 842 |
| Median Property Value | $101,500 | $136,800 |
| Median Household Income | $48,984 | $131 |
| Monthly Housing Costs | $318 | $28 |
| Real Estate Taxes | $746 | $0 |
Property Value by Mortgage Status in Marion
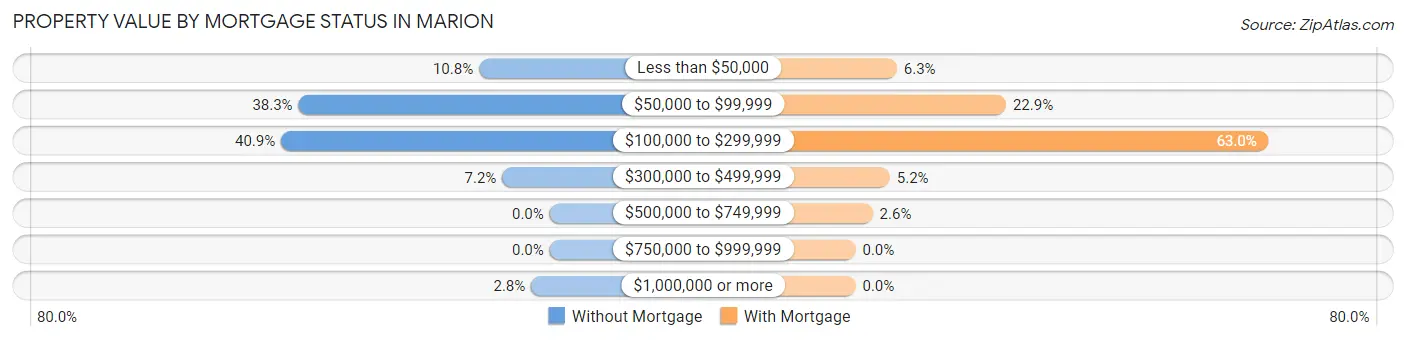
| Property Value | Without Mortgage | With Mortgage |
| Less than $50,000 | 61 (10.8%) | 53 (6.3%) |
| $50,000 to $99,999 | 217 (38.3%) | 193 (22.9%) |
| $100,000 to $299,999 | 232 (40.9%) | 530 (62.9%) |
| $300,000 to $499,999 | 41 (7.2%) | 44 (5.2%) |
| $500,000 to $749,999 | 0 (0.0%) | 22 (2.6%) |
| $750,000 to $999,999 | 0 (0.0%) | 0 (0.0%) |
| $1,000,000 or more | 16 (2.8%) | 0 (0.0%) |
| Total | 567 (100.0%) | 842 (100.0%) |
Household Income by Mortgage Status in Marion
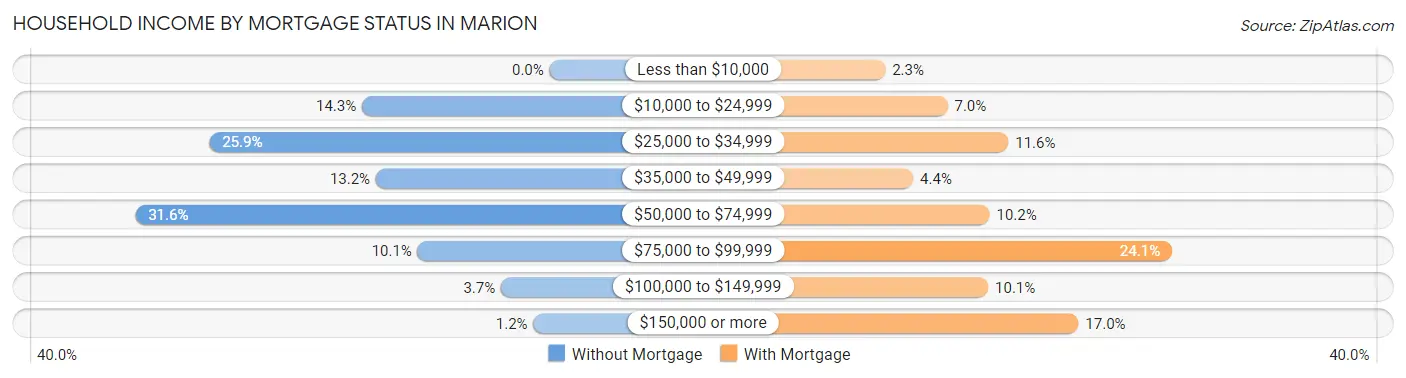
| Household Income | Without Mortgage | With Mortgage |
| Less than $10,000 | 0 (0.0%) | 19 (2.3%) |
| $10,000 to $24,999 | 81 (14.3%) | 59 (7.0%) |
| $25,000 to $34,999 | 147 (25.9%) | 98 (11.6%) |
| $35,000 to $49,999 | 75 (13.2%) | 37 (4.4%) |
| $50,000 to $74,999 | 179 (31.6%) | 86 (10.2%) |
| $75,000 to $99,999 | 57 (10.1%) | 203 (24.1%) |
| $100,000 to $149,999 | 21 (3.7%) | 85 (10.1%) |
| $150,000 or more | 7 (1.2%) | 143 (17.0%) |
| Total | 567 (100.0%) | 842 (100.0%) |
Property Value to Household Income Ratio in Marion
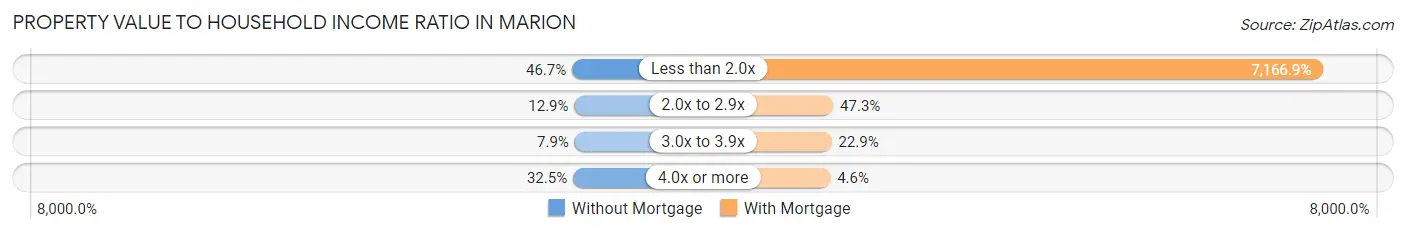
| Value-to-Income Ratio | Without Mortgage | With Mortgage |
| Less than 2.0x | 265 (46.7%) | 60,345 (7,166.9%) |
| 2.0x to 2.9x | 73 (12.9%) | 398 (47.3%) |
| 3.0x to 3.9x | 45 (7.9%) | 193 (22.9%) |
| 4.0x or more | 184 (32.5%) | 39 (4.6%) |
| Total | 567 (100.0%) | 842 (100.0%) |
Real Estate Taxes by Mortgage Status in Marion
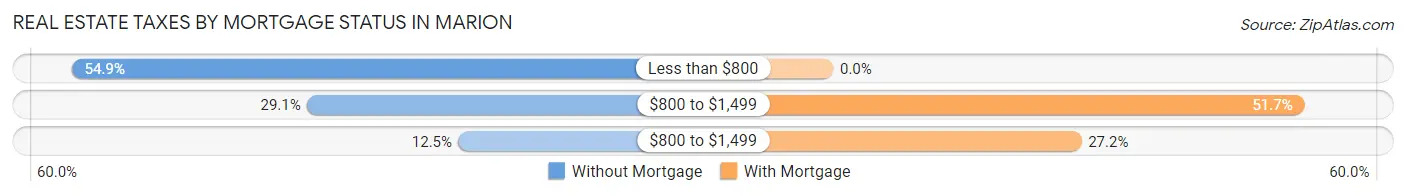
| Property Taxes | Without Mortgage | With Mortgage |
| Less than $800 | 311 (54.8%) | 0 (0.0%) |
| $800 to $1,499 | 165 (29.1%) | 435 (51.7%) |
| $800 to $1,499 | 71 (12.5%) | 229 (27.2%) |
| Total | 567 (100.0%) | 842 (100.0%) |
Health & Disability in Marion
Health Insurance Coverage by Age in Marion
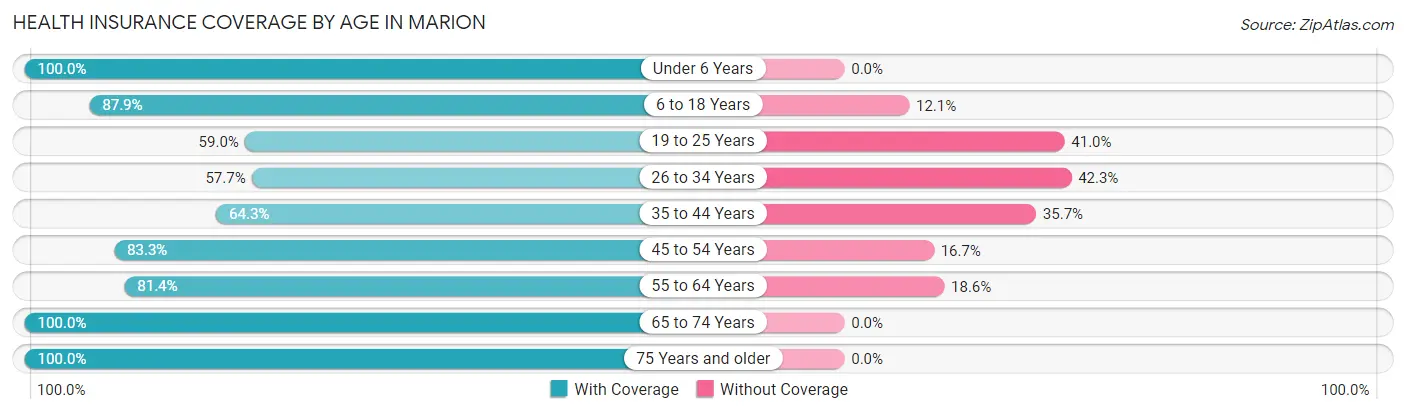
| Age Bracket | With Coverage | Without Coverage |
| Under 6 Years | 203 (100.0%) | 0 (0.0%) |
| 6 to 18 Years | 1,084 (87.9%) | 149 (12.1%) |
| 19 to 25 Years | 319 (59.0%) | 222 (41.0%) |
| 26 to 34 Years | 469 (57.7%) | 344 (42.3%) |
| 35 to 44 Years | 554 (64.3%) | 308 (35.7%) |
| 45 to 54 Years | 780 (83.3%) | 156 (16.7%) |
| 55 to 64 Years | 669 (81.4%) | 153 (18.6%) |
| 65 to 74 Years | 756 (100.0%) | 0 (0.0%) |
| 75 Years and older | 407 (100.0%) | 0 (0.0%) |
| Total | 5,241 (79.7%) | 1,332 (20.3%) |
Health Insurance Coverage by Citizenship Status in Marion
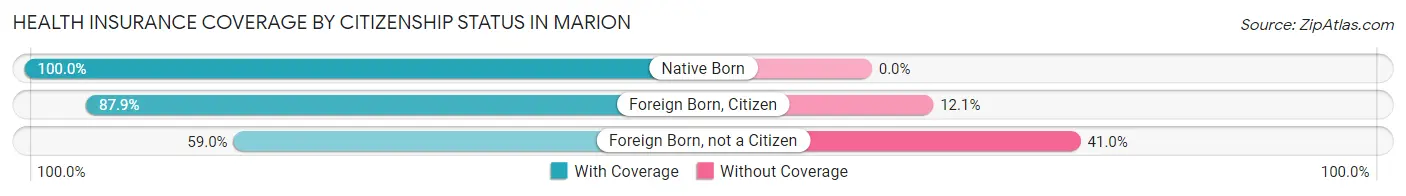
| Citizenship Status | With Coverage | Without Coverage |
| Native Born | 203 (100.0%) | 0 (0.0%) |
| Foreign Born, Citizen | 1,084 (87.9%) | 149 (12.1%) |
| Foreign Born, not a Citizen | 319 (59.0%) | 222 (41.0%) |
Health Insurance Coverage by Household Income in Marion
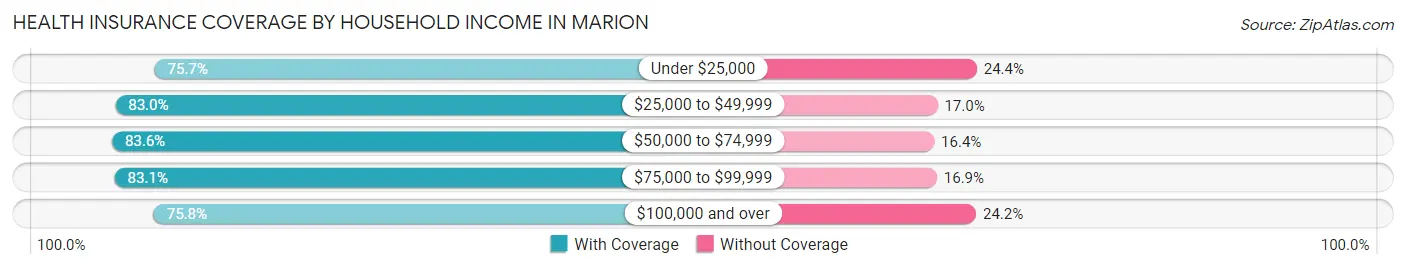
| Household Income | With Coverage | Without Coverage |
| Under $25,000 | 1,109 (75.6%) | 357 (24.3%) |
| $25,000 to $49,999 | 1,060 (83.0%) | 217 (17.0%) |
| $50,000 to $74,999 | 899 (83.6%) | 176 (16.4%) |
| $75,000 to $99,999 | 1,098 (83.1%) | 223 (16.9%) |
| $100,000 and over | 1,048 (75.8%) | 335 (24.2%) |
Public vs Private Health Insurance Coverage by Age in Marion
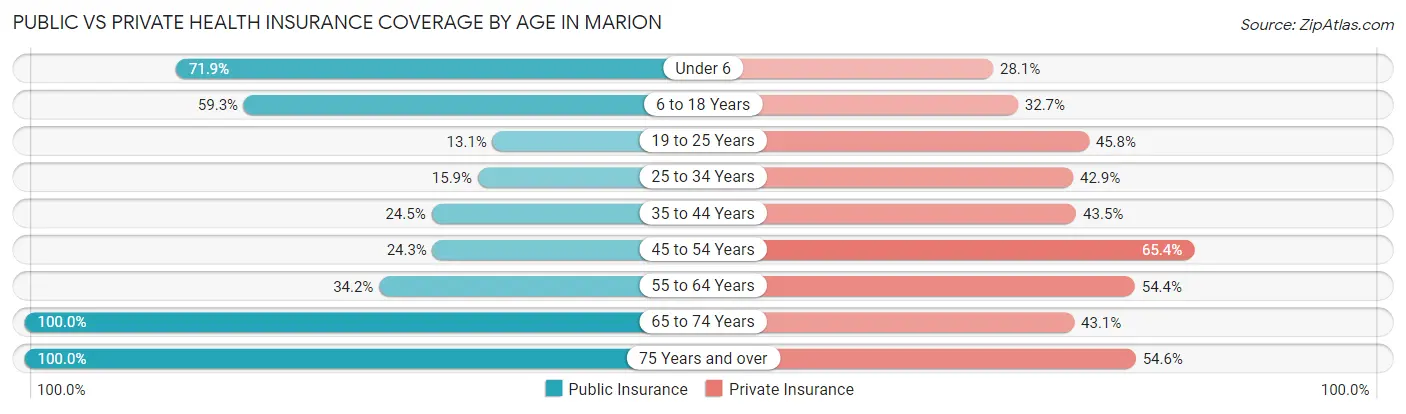
| Age Bracket | Public Insurance | Private Insurance |
| Under 6 | 146 (71.9%) | 57 (28.1%) |
| 6 to 18 Years | 731 (59.3%) | 403 (32.7%) |
| 19 to 25 Years | 71 (13.1%) | 248 (45.8%) |
| 25 to 34 Years | 129 (15.9%) | 349 (42.9%) |
| 35 to 44 Years | 211 (24.5%) | 375 (43.5%) |
| 45 to 54 Years | 227 (24.2%) | 612 (65.4%) |
| 55 to 64 Years | 281 (34.2%) | 447 (54.4%) |
| 65 to 74 Years | 756 (100.0%) | 326 (43.1%) |
| 75 Years and over | 407 (100.0%) | 222 (54.5%) |
| Total | 2,959 (45.0%) | 3,039 (46.2%) |
Disability Status by Sex by Age in Marion
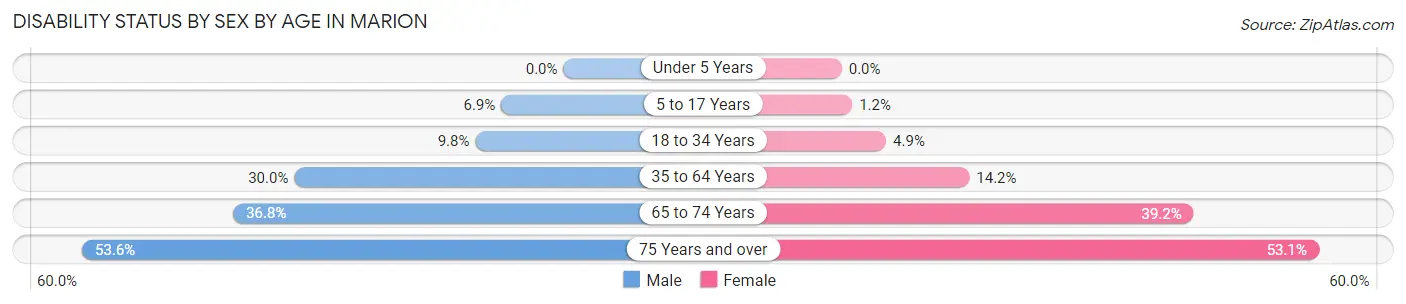
| Age Bracket | Male | Female |
| Under 5 Years | 0 (0.0%) | 0 (0.0%) |
| 5 to 17 Years | 39 (6.9%) | 7 (1.2%) |
| 18 to 34 Years | 92 (9.8%) | 26 (4.9%) |
| 35 to 64 Years | 359 (30.0%) | 202 (14.2%) |
| 65 to 74 Years | 110 (36.8%) | 179 (39.2%) |
| 75 Years and over | 89 (53.6%) | 128 (53.1%) |
Disability Class by Sex by Age in Marion
Disability Class: Hearing Difficulty
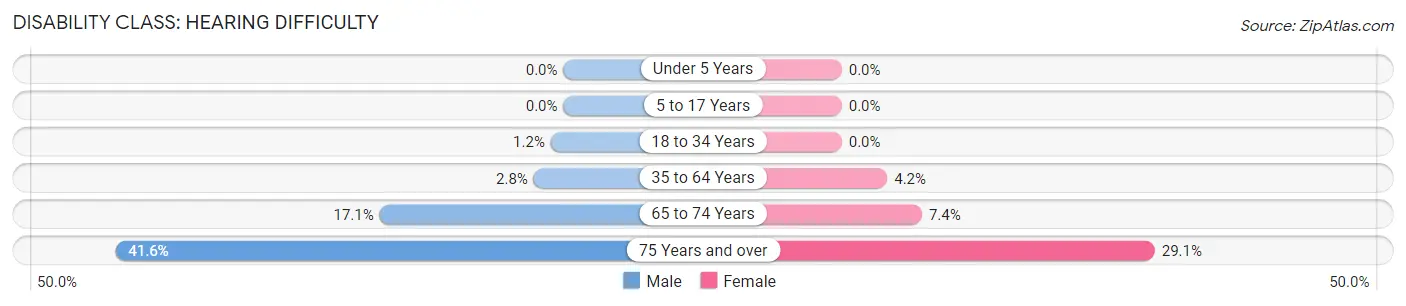
| Age Bracket | Male | Female |
| Under 5 Years | 0 (0.0%) | 0 (0.0%) |
| 5 to 17 Years | 0 (0.0%) | 0 (0.0%) |
| 18 to 34 Years | 11 (1.2%) | 0 (0.0%) |
| 35 to 64 Years | 33 (2.8%) | 60 (4.2%) |
| 65 to 74 Years | 51 (17.1%) | 34 (7.4%) |
| 75 Years and over | 69 (41.6%) | 70 (29.0%) |
Disability Class: Vision Difficulty
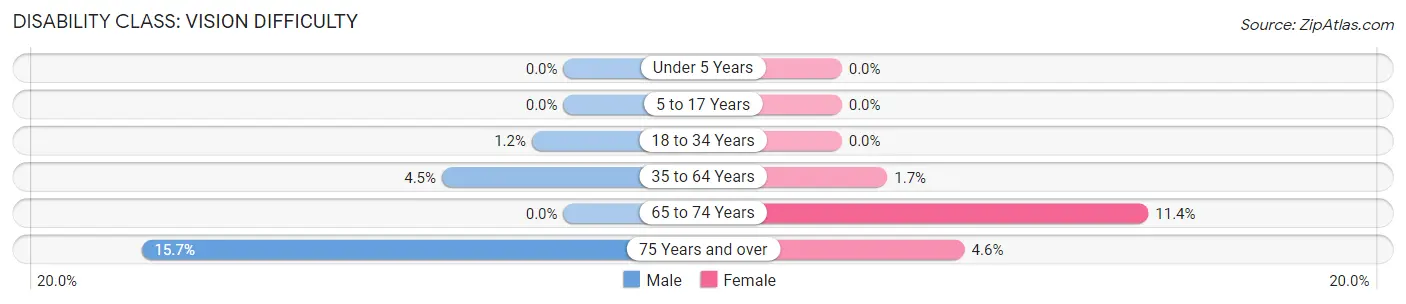
| Age Bracket | Male | Female |
| Under 5 Years | 0 (0.0%) | 0 (0.0%) |
| 5 to 17 Years | 0 (0.0%) | 0 (0.0%) |
| 18 to 34 Years | 11 (1.2%) | 0 (0.0%) |
| 35 to 64 Years | 54 (4.5%) | 24 (1.7%) |
| 65 to 74 Years | 0 (0.0%) | 52 (11.4%) |
| 75 Years and over | 26 (15.7%) | 11 (4.6%) |
Disability Class: Cognitive Difficulty
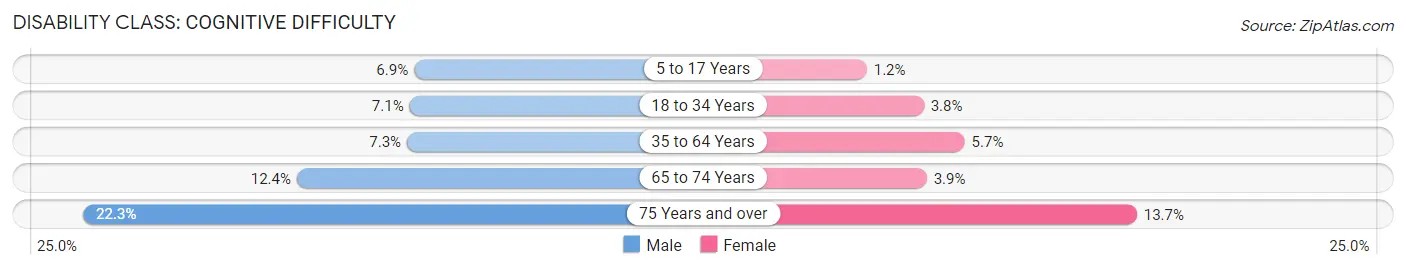
| Age Bracket | Male | Female |
| 5 to 17 Years | 39 (6.9%) | 7 (1.2%) |
| 18 to 34 Years | 67 (7.1%) | 20 (3.8%) |
| 35 to 64 Years | 87 (7.3%) | 81 (5.7%) |
| 65 to 74 Years | 37 (12.4%) | 18 (3.9%) |
| 75 Years and over | 37 (22.3%) | 33 (13.7%) |
Disability Class: Ambulatory Difficulty
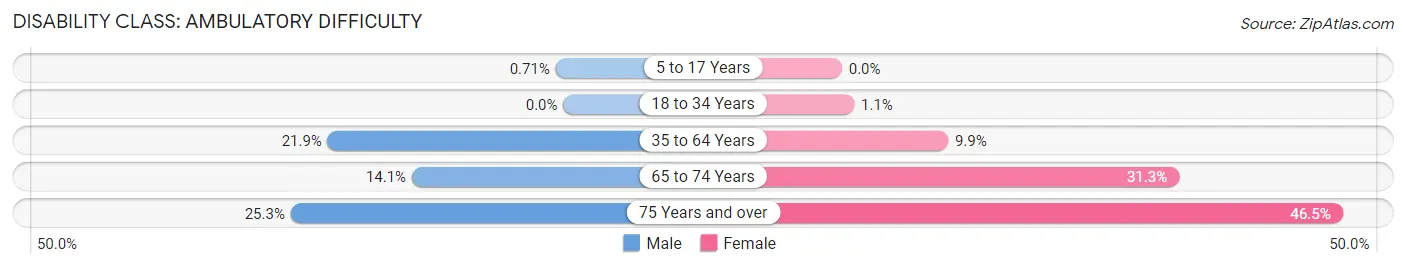
| Age Bracket | Male | Female |
| 5 to 17 Years | 4 (0.7%) | 0 (0.0%) |
| 18 to 34 Years | 0 (0.0%) | 6 (1.1%) |
| 35 to 64 Years | 262 (21.9%) | 140 (9.9%) |
| 65 to 74 Years | 42 (14.1%) | 143 (31.3%) |
| 75 Years and over | 42 (25.3%) | 112 (46.5%) |
Disability Class: Self-Care Difficulty
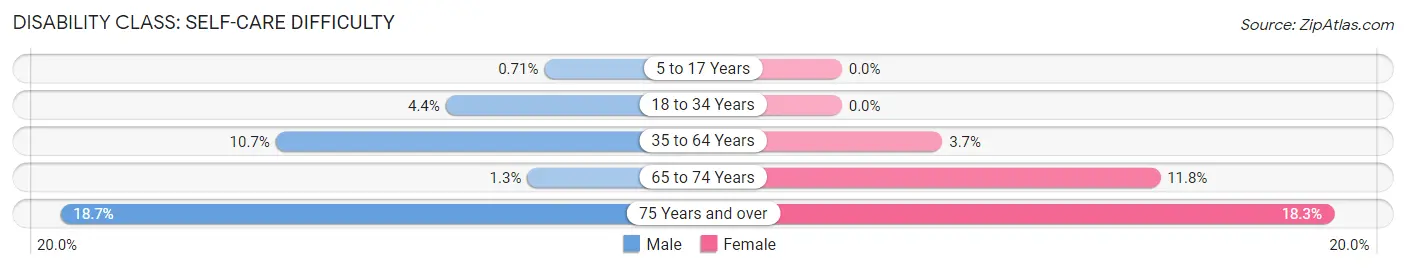
| Age Bracket | Male | Female |
| 5 to 17 Years | 4 (0.7%) | 0 (0.0%) |
| 18 to 34 Years | 41 (4.4%) | 0 (0.0%) |
| 35 to 64 Years | 128 (10.7%) | 53 (3.7%) |
| 65 to 74 Years | 4 (1.3%) | 54 (11.8%) |
| 75 Years and over | 31 (18.7%) | 44 (18.3%) |
Technology Access in Marion
Computing Device Access in Marion
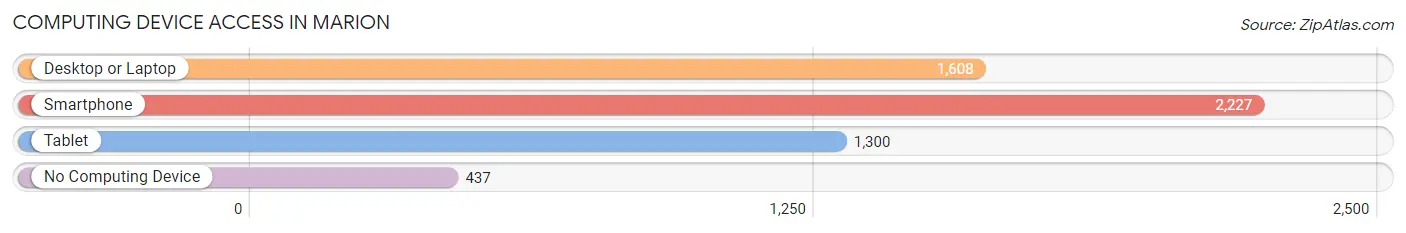
| Device Type | # Households | % Households |
| Desktop or Laptop | 1,608 | 57.4% |
| Smartphone | 2,227 | 79.5% |
| Tablet | 1,300 | 46.4% |
| No Computing Device | 437 | 15.6% |
| Total | 2,800 | 100.0% |
Internet Access in Marion
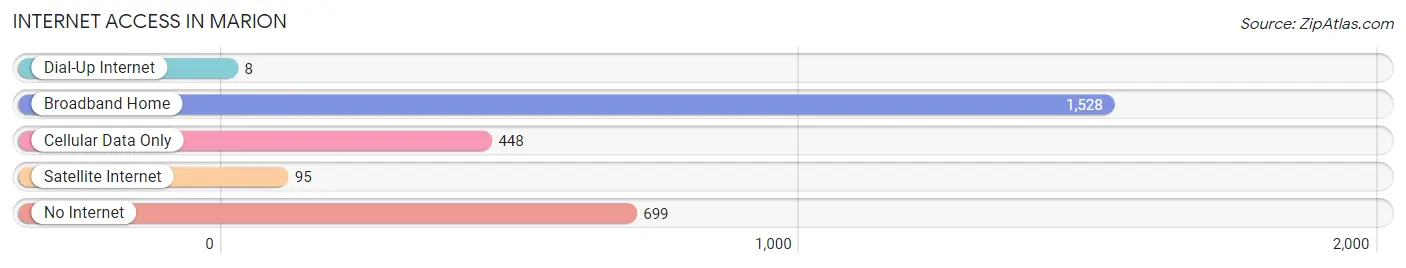
| Internet Type | # Households | % Households |
| Dial-Up Internet | 8 | 0.3% |
| Broadband Home | 1,528 | 54.6% |
| Cellular Data Only | 448 | 16.0% |
| Satellite Internet | 95 | 3.4% |
| No Internet | 699 | 25.0% |
| Total | 2,800 | 100.0% |
Marion Summary
Marion, North Carolina is a small town located in the foothills of the Blue Ridge Mountains in McDowell County. It is situated in the western part of the state, about an hour’s drive from Asheville. The town was founded in 1844 and has a population of approximately 7,000 people.
History
Marion was founded in 1844 by a group of settlers from the nearby town of Old Fort. The town was named after Francis Marion, a Revolutionary War hero. The town was originally a farming community, but it soon developed into a center for the production of furniture and textiles. In the late 19th century, the town was home to several large furniture factories, which employed hundreds of people.
In the early 20th century, the town experienced a period of growth and prosperity. The population increased from 1,000 in 1900 to over 5,000 by 1930. During this time, the town was home to several banks, a movie theater, and a variety of stores and businesses.
In the 1950s, the town began to decline as the furniture industry moved away. The population decreased to around 4,000 by the 1970s. In recent years, the town has experienced a resurgence, with the population increasing to over 7,000 in 2020.
Geography
Marion is located in the foothills of the Blue Ridge Mountains in western North Carolina. The town is situated in McDowell County, about an hour’s drive from Asheville. The town is surrounded by the Catawba River to the north, the Linville River to the east, and the South Toe River to the south.
The town is located at an elevation of 1,400 feet above sea level. The climate is mild, with temperatures ranging from the low 30s in the winter to the mid-80s in the summer. The town receives an average of 45 inches of rain per year.
Economy
Marion’s economy is largely based on tourism and manufacturing. The town is home to several furniture factories, which employ hundreds of people. The town is also home to several small businesses, including restaurants, shops, and hotels.
The town is also home to several educational institutions, including McDowell Technical Community College and the McDowell County Public Library.
Demographics
As of 2020, the population of Marion was estimated to be 7,000 people. The town is predominantly white, with approximately 90% of the population identifying as such. The remaining 10% of the population is made up of African Americans, Hispanics, and other ethnicities.
The median household income in Marion is $35,000, and the median home value is $125,000. The town has a poverty rate of 17%, which is slightly higher than the national average.
Marion is a small town with a rich history and a bright future. The town is home to a diverse population and a variety of businesses and industries. The town is a great place to live, work, and raise a family.
Common Questions
What is Per Capita Income in Marion?
Per Capita income in Marion is $21,109.
What is the Median Family Income in Marion?
Median Family Income in Marion is $56,984.
What is the Median Household income in Marion?
Median Household Income in Marion is $48,520.
What is Income or Wage Gap in Marion?
Income or Wage Gap in Marion is 2.1%.
Women in Marion earn 97.9 cents for every dollar earned by a man.
What is Inequality or Gini Index in Marion?
Inequality or Gini Index in Marion is 0.46.
What is the Total Population of Marion?
Total Population of Marion is 7,652.
What is the Total Male Population of Marion?
Total Male Population of Marion is 4,239.
What is the Total Female Population of Marion?
Total Female Population of Marion is 3,413.
What is the Ratio of Males per 100 Females in Marion?
There are 124.20 Males per 100 Females in Marion.
What is the Ratio of Females per 100 Males in Marion?
There are 80.51 Females per 100 Males in Marion.
What is the Median Population Age in Marion?
Median Population Age in Marion is 39.4 Years.
What is the Average Family Size in Marion
Average Family Size in Marion is 2.8 People.
What is the Average Household Size in Marion
Average Household Size in Marion is 2.3 People.
How Large is the Labor Force in Marion?
There are 2,807 People in the Labor Forcein in Marion.
What is the Percentage of People in the Labor Force in Marion?
43.2% of People are in the Labor Force in Marion.
What is the Unemployment Rate in Marion?
Unemployment Rate in Marion is 9.5%.