Sparta, NC Map & Demographics
Sparta Map
Sparta Overview
$21,537
PER CAPITA INCOME
$41,304
AVG FAMILY INCOME
$38,045
AVG HOUSEHOLD INCOME
26.3%
WAGE / INCOME GAP [ % ]
73.7¢/ $1
WAGE / INCOME GAP [ $ ]
0.40
INEQUALITY / GINI INDEX
1,795
TOTAL POPULATION
858
MALE POPULATION
937
FEMALE POPULATION
91.57
MALES / 100 FEMALES
109.21
FEMALES / 100 MALES
47.4
MEDIAN AGE
2.6
AVG FAMILY SIZE
2.1
AVG HOUSEHOLD SIZE
716
LABOR FORCE [ PEOPLE ]
46.4%
PERCENT IN LABOR FORCE
4.5%
UNEMPLOYMENT RATE
Sparta Zip Codes
Sparta Area Codes
Income in Sparta
Income Overview in Sparta
Per Capita Income in Sparta is $21,537, while median incomes of families and households are $41,304 and $38,045 respectively.
| Characteristic | Number | Measure |
| Per Capita Income | 1,795 | $21,537 |
| Median Family Income | 498 | $41,304 |
| Mean Family Income | 498 | $52,844 |
| Median Household Income | 801 | $38,045 |
| Mean Household Income | 801 | $45,375 |
| Income Deficit | 498 | $0 |
| Wage / Income Gap (%) | 1,795 | 26.30% |
| Wage / Income Gap ($) | 1,795 | 73.70¢ per $1 |
| Gini / Inequality Index | 1,795 | 0.40 |
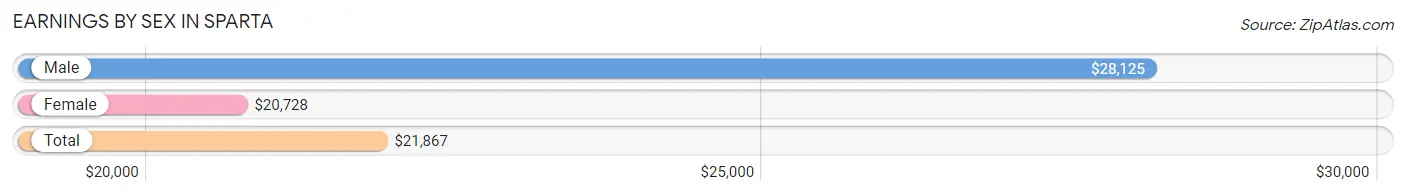
Earnings by Sex in Sparta
Average Earnings in Sparta are $21,867, $28,125 for men and $20,728 for women, a difference of 26.3%.
| Sex | Number | Average Earnings |
| Male | 327 (43.3%) | $28,125 |
| Female | 428 (56.7%) | $20,728 |
| Total | 755 (100.0%) | $21,867 |
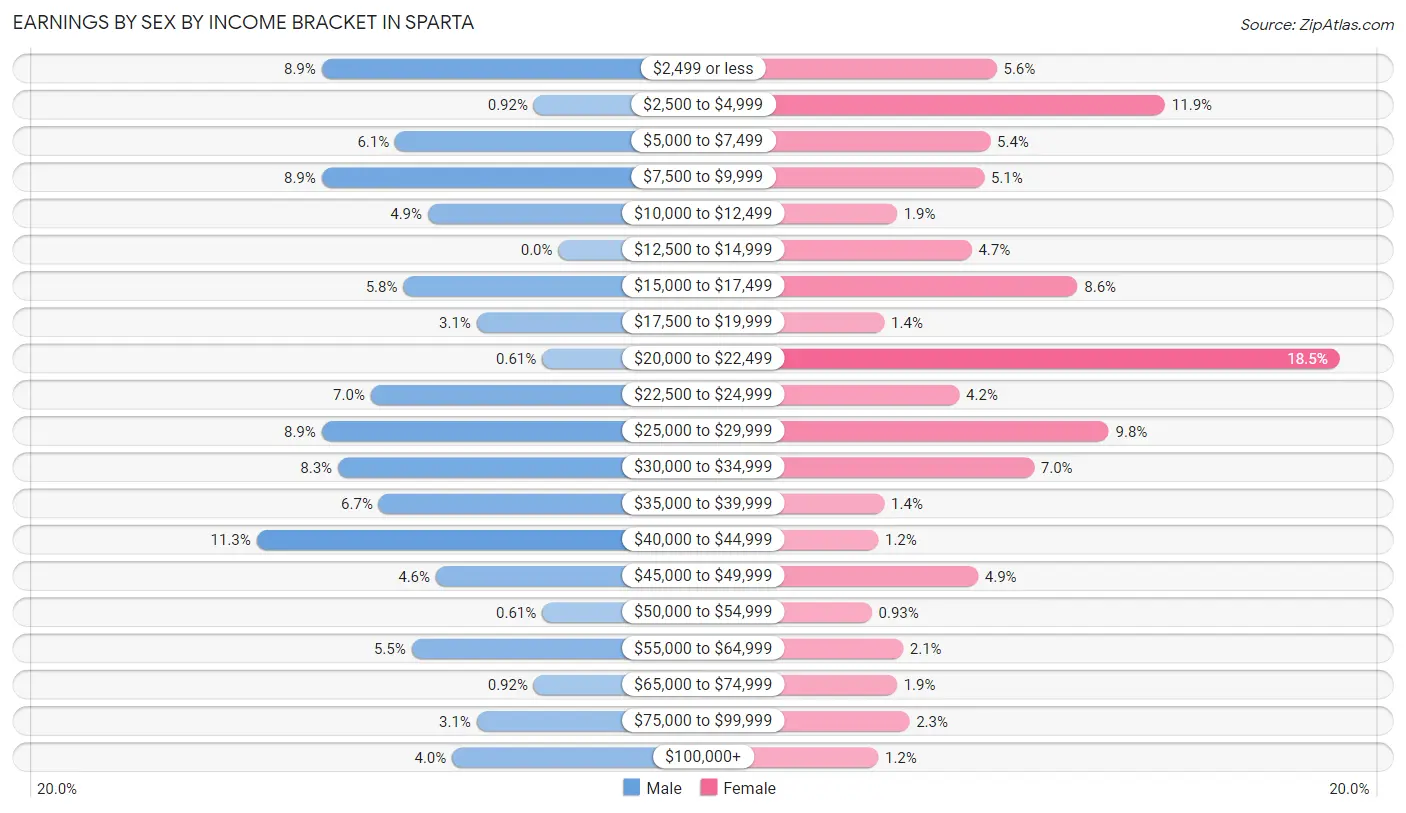
Earnings by Sex by Income Bracket in Sparta
The most common earnings brackets in Sparta are $40,000 to $44,999 for men (37 | 11.3%) and $20,000 to $22,499 for women (79 | 18.5%).
| Income | Male | Female |
| $2,499 or less | 29 (8.9%) | 24 (5.6%) |
| $2,500 to $4,999 | 3 (0.9%) | 51 (11.9%) |
| $5,000 to $7,499 | 20 (6.1%) | 23 (5.4%) |
| $7,500 to $9,999 | 29 (8.9%) | 22 (5.1%) |
| $10,000 to $12,499 | 16 (4.9%) | 8 (1.9%) |
| $12,500 to $14,999 | 0 (0.0%) | 20 (4.7%) |
| $15,000 to $17,499 | 19 (5.8%) | 37 (8.6%) |
| $17,500 to $19,999 | 10 (3.1%) | 6 (1.4%) |
| $20,000 to $22,499 | 2 (0.6%) | 79 (18.5%) |
| $22,500 to $24,999 | 23 (7.0%) | 18 (4.2%) |
| $25,000 to $29,999 | 29 (8.9%) | 42 (9.8%) |
| $30,000 to $34,999 | 27 (8.3%) | 30 (7.0%) |
| $35,000 to $39,999 | 22 (6.7%) | 6 (1.4%) |
| $40,000 to $44,999 | 37 (11.3%) | 5 (1.2%) |
| $45,000 to $49,999 | 15 (4.6%) | 21 (4.9%) |
| $50,000 to $54,999 | 2 (0.6%) | 4 (0.9%) |
| $55,000 to $64,999 | 18 (5.5%) | 9 (2.1%) |
| $65,000 to $74,999 | 3 (0.9%) | 8 (1.9%) |
| $75,000 to $99,999 | 10 (3.1%) | 10 (2.3%) |
| $100,000+ | 13 (4.0%) | 5 (1.2%) |
| Total | 327 (100.0%) | 428 (100.0%) |
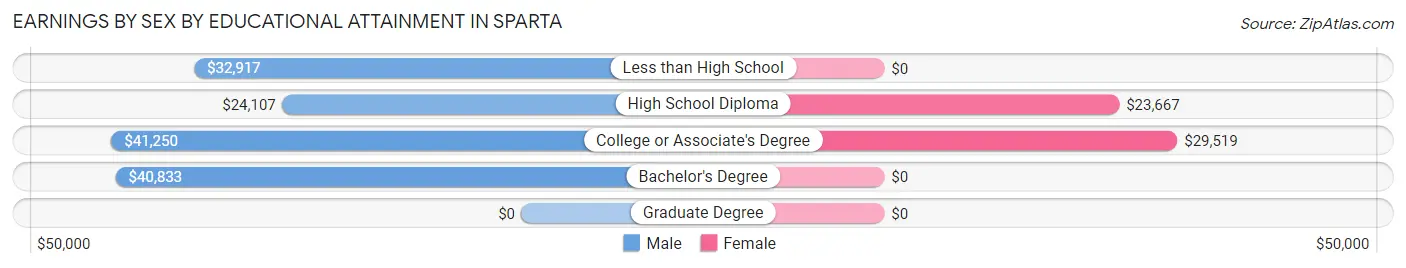
Earnings by Sex by Educational Attainment in Sparta
Average earnings in Sparta are $31,641 for men and $22,281 for women, a difference of 29.6%. Men with an educational attainment of college or associate's degree enjoy the highest average annual earnings of $41,250, while those with high school diploma education earn the least with $24,107. Women with an educational attainment of college or associate's degree earn the most with the average annual earnings of $29,519, while those with high school diploma education have the smallest earnings of $23,667.
| Educational Attainment | Male Income | Female Income |
| Less than High School | $32,917 | $0 |
| High School Diploma | $24,107 | $23,667 |
| College or Associate's Degree | $41,250 | $29,519 |
| Bachelor's Degree | $40,833 | $0 |
| Graduate Degree | - | - |
| Total | $31,641 | $22,281 |
Family Income in Sparta
Family Income Brackets in Sparta
According to the Sparta family income data, there are 115 families falling into the $35,000 to $49,999 income range, which is the most common income bracket and makes up 23.1% of all families. Conversely, the $200,000+ income bracket is the least frequent group with only 3 families (0.6%) belonging to this category.
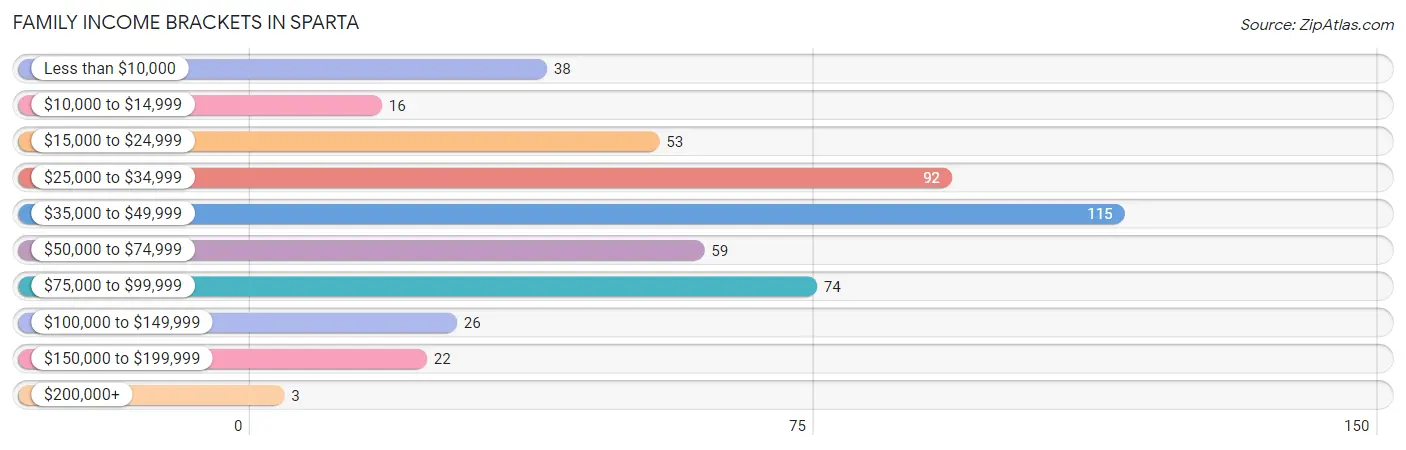
| Income Bracket | # Families | % Families |
| Less than $10,000 | 38 | 7.6% |
| $10,000 to $14,999 | 16 | 3.2% |
| $15,000 to $24,999 | 53 | 10.6% |
| $25,000 to $34,999 | 92 | 18.5% |
| $35,000 to $49,999 | 115 | 23.1% |
| $50,000 to $74,999 | 59 | 11.8% |
| $75,000 to $99,999 | 74 | 14.9% |
| $100,000 to $149,999 | 26 | 5.2% |
| $150,000 to $199,999 | 22 | 4.4% |
| $200,000+ | 3 | 0.6% |
Family Income by Famaliy Size in Sparta
5-person families (14 | 2.8%) account for the highest median family income in Sparta with $79,250 per family, while 2-person families (275 | 55.2%) have the highest median income of $21,771 per family member.
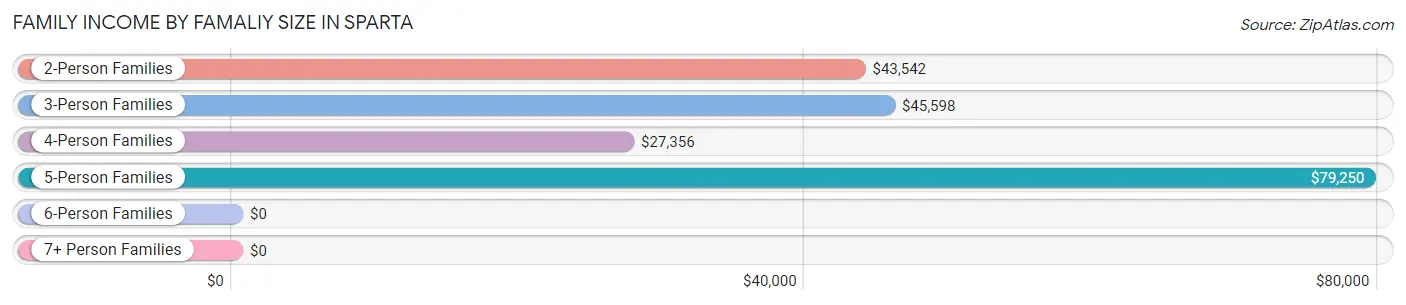
| Income Bracket | # Families | Median Income |
| 2-Person Families | 275 (55.2%) | $43,542 |
| 3-Person Families | 127 (25.5%) | $45,598 |
| 4-Person Families | 69 (13.9%) | $27,356 |
| 5-Person Families | 14 (2.8%) | $79,250 |
| 6-Person Families | 8 (1.6%) | $0 |
| 7+ Person Families | 5 (1.0%) | $0 |
| Total | 498 (100.0%) | $41,304 |
Family Income by Number of Earners in Sparta
The median family income in Sparta is $41,304, with families comprising 3+ earners (19) having the highest median family income of $78,750, while families with 1 earner (214) have the lowest median family income of $31,833, accounting for 3.8% and 43.0% of families, respectively.
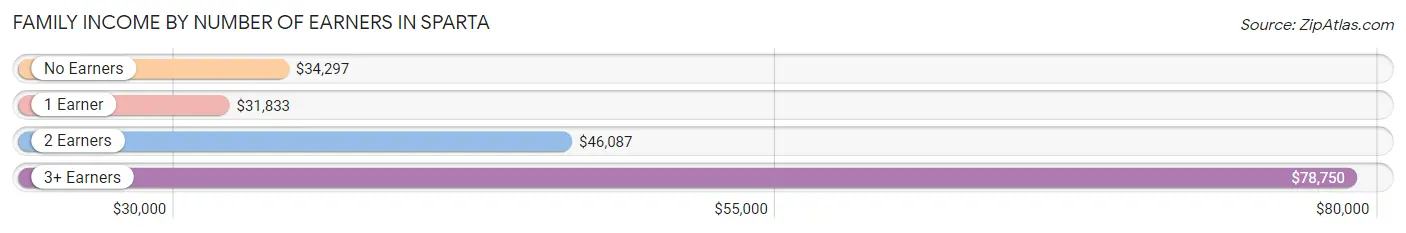
| Number of Earners | # Families | Median Income |
| No Earners | 105 (21.1%) | $34,297 |
| 1 Earner | 214 (43.0%) | $31,833 |
| 2 Earners | 160 (32.1%) | $46,087 |
| 3+ Earners | 19 (3.8%) | $78,750 |
| Total | 498 (100.0%) | $41,304 |
Household Income in Sparta
Household Income Brackets in Sparta
With 220 households falling in the category, the $35,000 to $49,999 income range is the most frequent in Sparta, accounting for 27.5% of all households. In contrast, only 3 households (0.4%) fall into the $200,000+ income bracket, making it the least populous group.
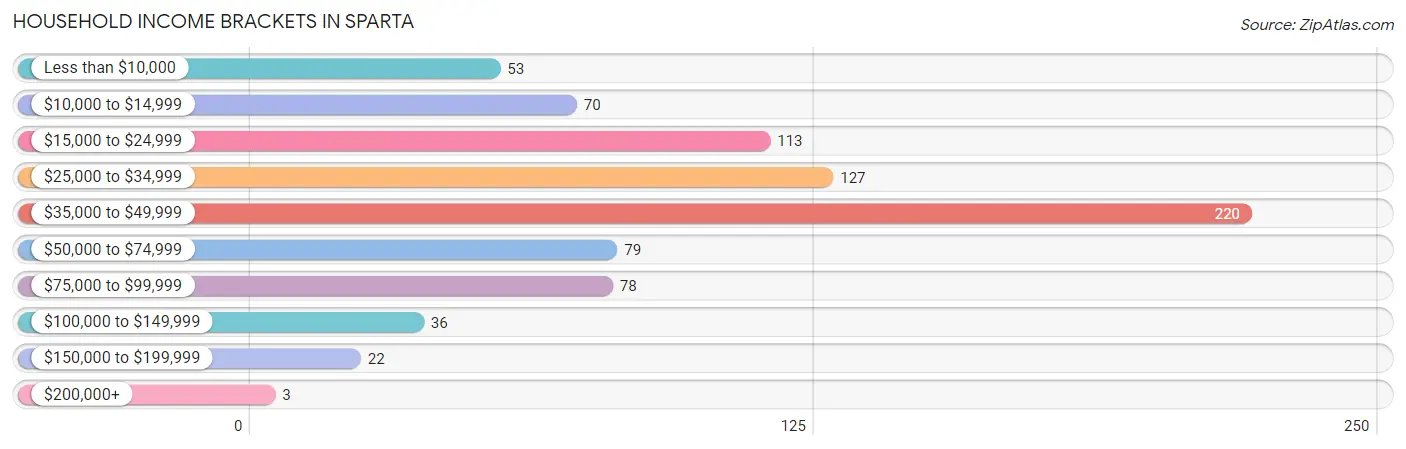
| Income Bracket | # Households | % Households |
| Less than $10,000 | 53 | 6.6% |
| $10,000 to $14,999 | 70 | 8.7% |
| $15,000 to $24,999 | 113 | 14.1% |
| $25,000 to $34,999 | 127 | 15.9% |
| $35,000 to $49,999 | 220 | 27.5% |
| $50,000 to $74,999 | 79 | 9.9% |
| $75,000 to $99,999 | 78 | 9.7% |
| $100,000 to $149,999 | 36 | 4.5% |
| $150,000 to $199,999 | 22 | 2.7% |
| $200,000+ | 3 | 0.4% |
Household Income by Householder Age in Sparta
The median household income in Sparta is $38,045, with the highest median household income of $40,096 found in the 45 to 64 years age bracket for the primary householder. A total of 266 households (33.2%) fall into this category. Meanwhile, the 25 to 44 years age bracket for the primary householder has the lowest median household income of $33,088, with 204 households (25.5%) in this group.
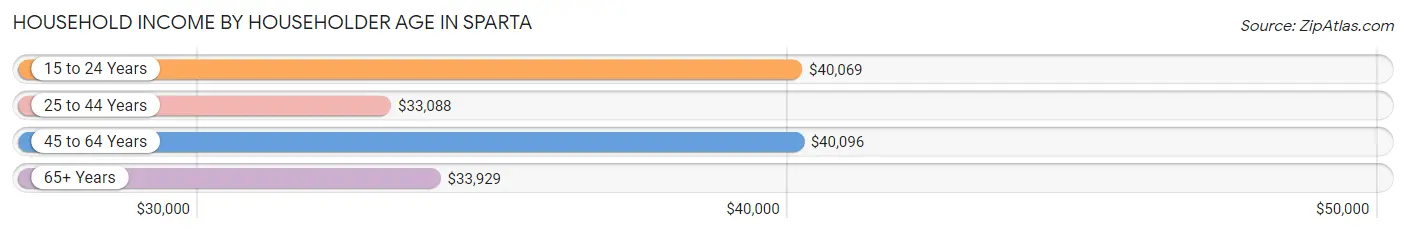
| Income Bracket | # Households | Median Income |
| 15 to 24 Years | 43 (5.4%) | $40,069 |
| 25 to 44 Years | 204 (25.5%) | $33,088 |
| 45 to 64 Years | 266 (33.2%) | $40,096 |
| 65+ Years | 288 (36.0%) | $33,929 |
| Total | 801 (100.0%) | $38,045 |
Poverty in Sparta
Income Below Poverty by Sex and Age in Sparta
With 24.3% poverty level for males and 21.8% for females among the residents of Sparta, under 5 year old males and 5 year old females are the most vulnerable to poverty, with 21 males (70.0%) and 2 females (100.0%) in their respective age groups living below the poverty level.
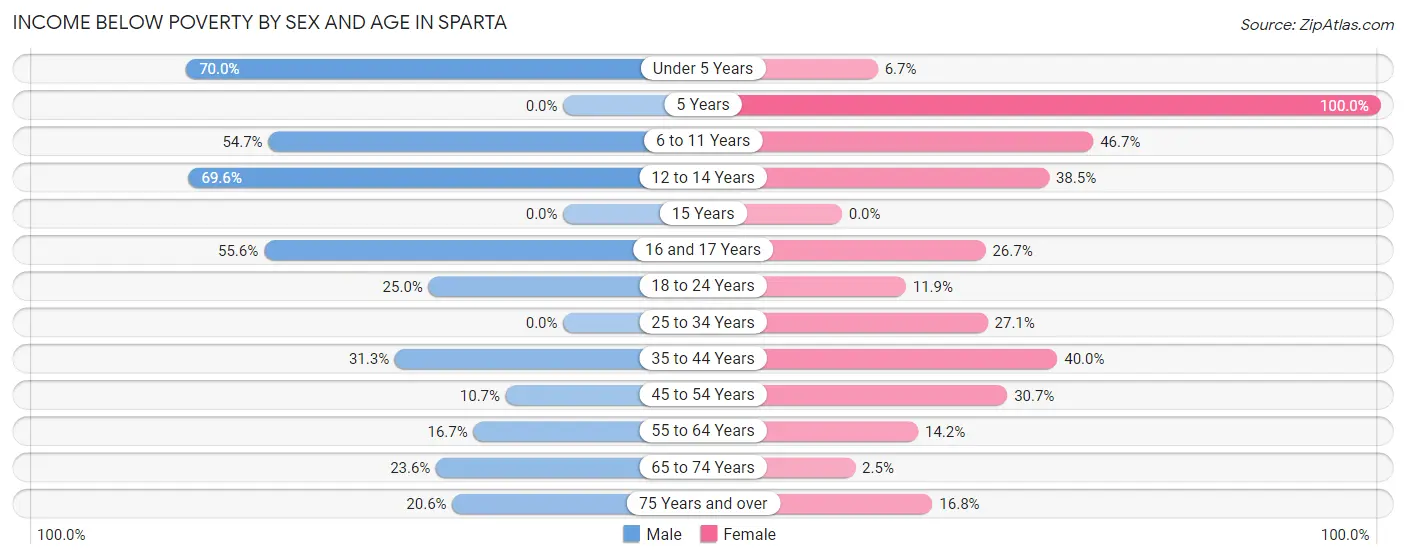
| Age Bracket | Male | Female |
| Under 5 Years | 21 (70.0%) | 2 (6.7%) |
| 5 Years | 0 (0.0%) | 2 (100.0%) |
| 6 to 11 Years | 52 (54.7%) | 21 (46.7%) |
| 12 to 14 Years | 16 (69.6%) | 5 (38.5%) |
| 15 Years | 0 (0.0%) | 0 (0.0%) |
| 16 and 17 Years | 5 (55.6%) | 12 (26.7%) |
| 18 to 24 Years | 16 (25.0%) | 12 (11.9%) |
| 25 to 34 Years | 0 (0.0%) | 23 (27.1%) |
| 35 to 44 Years | 15 (31.2%) | 46 (40.0%) |
| 45 to 54 Years | 8 (10.7%) | 35 (30.7%) |
| 55 to 64 Years | 24 (16.7%) | 16 (14.2%) |
| 65 to 74 Years | 21 (23.6%) | 3 (2.5%) |
| 75 Years and over | 14 (20.6%) | 18 (16.8%) |
| Total | 192 (24.3%) | 195 (21.8%) |
Income Above Poverty by Sex and Age in Sparta
According to the poverty statistics in Sparta, males aged 5 years and females aged 15 years are the age groups that are most secure financially, with 100.0% of males and 100.0% of females in these age groups living above the poverty line.
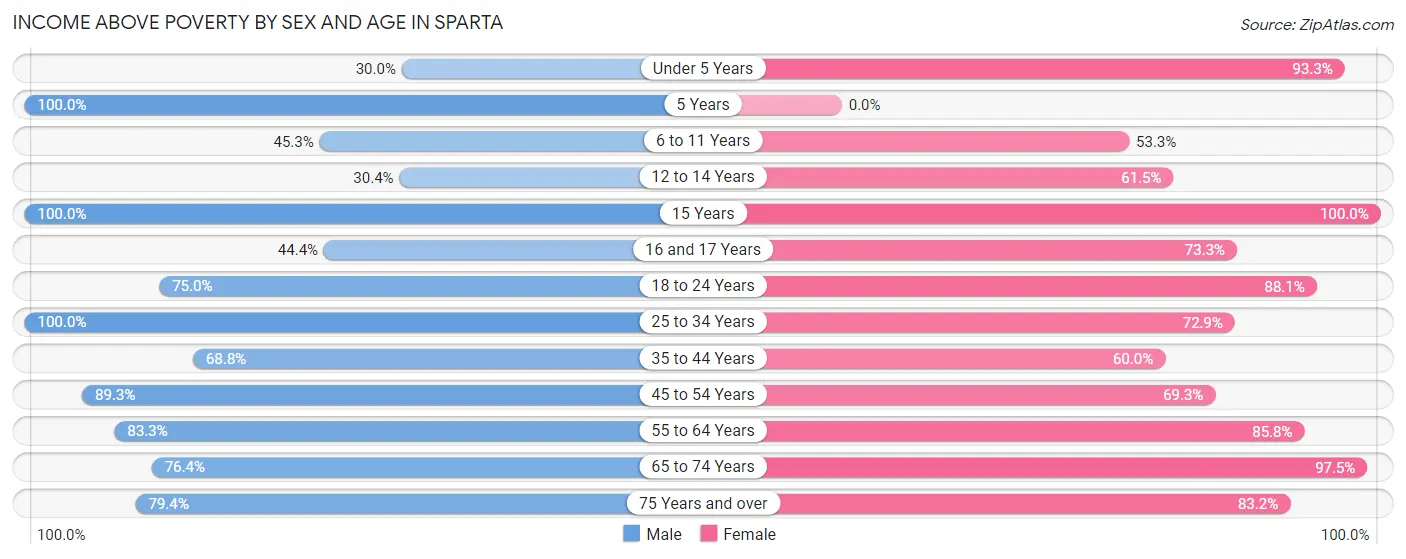
| Age Bracket | Male | Female |
| Under 5 Years | 9 (30.0%) | 28 (93.3%) |
| 5 Years | 6 (100.0%) | 0 (0.0%) |
| 6 to 11 Years | 43 (45.3%) | 24 (53.3%) |
| 12 to 14 Years | 7 (30.4%) | 8 (61.5%) |
| 15 Years | 2 (100.0%) | 5 (100.0%) |
| 16 and 17 Years | 4 (44.4%) | 33 (73.3%) |
| 18 to 24 Years | 48 (75.0%) | 89 (88.1%) |
| 25 to 34 Years | 137 (100.0%) | 62 (72.9%) |
| 35 to 44 Years | 33 (68.8%) | 69 (60.0%) |
| 45 to 54 Years | 67 (89.3%) | 79 (69.3%) |
| 55 to 64 Years | 120 (83.3%) | 97 (85.8%) |
| 65 to 74 Years | 68 (76.4%) | 118 (97.5%) |
| 75 Years and over | 54 (79.4%) | 89 (83.2%) |
| Total | 598 (75.7%) | 701 (78.2%) |
Income Below Poverty Among Married-Couple Families in Sparta
The poverty statistics for married-couple families in Sparta show that 6.3% or 16 of the total 255 families live below the poverty line. Families with 5 or more children have the highest poverty rate of 100.0%, comprising of 5 families. On the other hand, families with 1 or 2 children have the lowest poverty rate of 0.0%, which includes 0 families.
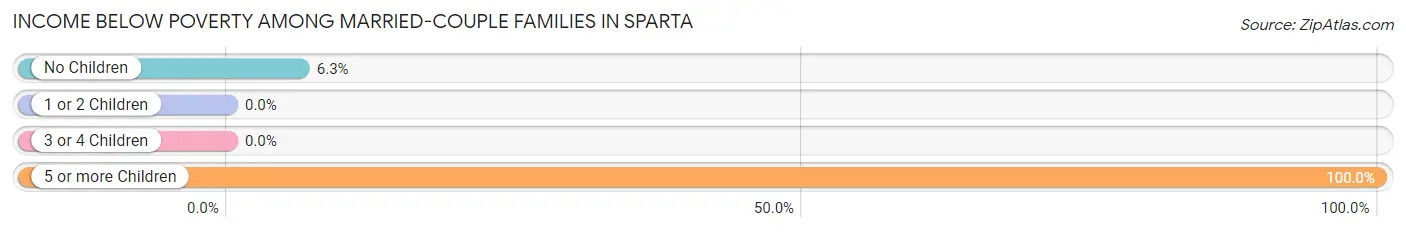
| Children | Above Poverty | Below Poverty |
| No Children | 165 (93.8%) | 11 (6.2%) |
| 1 or 2 Children | 70 (100.0%) | 0 (0.0%) |
| 3 or 4 Children | 4 (100.0%) | 0 (0.0%) |
| 5 or more Children | 0 (0.0%) | 5 (100.0%) |
| Total | 239 (93.7%) | 16 (6.3%) |
Income Below Poverty Among Single-Parent Households in Sparta
According to the poverty data in Sparta, 14.0% or 6 single-father households and 38.5% or 77 single-mother households are living below the poverty line. Among single-father households, those with 1 or 2 children have the highest poverty rate, with 2 households (18.2%) experiencing poverty. Likewise, among single-mother households, those with 3 or 4 children have the highest poverty rate, with 44 households (100.0%) falling below the poverty line.
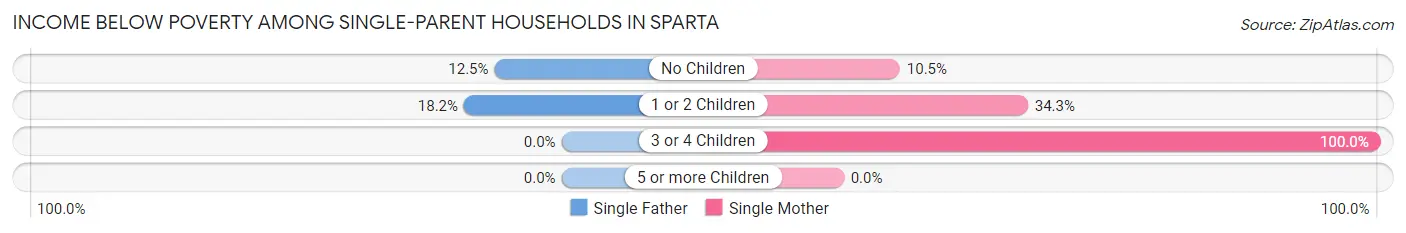
| Children | Single Father | Single Mother |
| No Children | 4 (12.5%) | 9 (10.5%) |
| 1 or 2 Children | 2 (18.2%) | 24 (34.3%) |
| 3 or 4 Children | 0 (0.0%) | 44 (100.0%) |
| 5 or more Children | 0 (0.0%) | 0 (0.0%) |
| Total | 6 (14.0%) | 77 (38.5%) |
Income Below Poverty Among Married-Couple vs Single-Parent Households in Sparta
The poverty data for Sparta shows that 16 of the married-couple family households (6.3%) and 83 of the single-parent households (34.2%) are living below the poverty level. Within the married-couple family households, those with 5 or more children have the highest poverty rate, with 5 households (100.0%) falling below the poverty line. Among the single-parent households, those with 3 or 4 children have the highest poverty rate, with 44 household (100.0%) living below poverty.
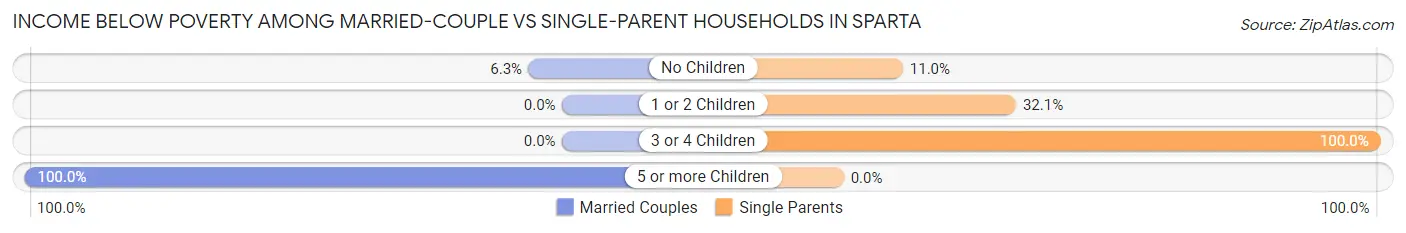
| Children | Married-Couple Families | Single-Parent Households |
| No Children | 11 (6.2%) | 13 (11.0%) |
| 1 or 2 Children | 0 (0.0%) | 26 (32.1%) |
| 3 or 4 Children | 0 (0.0%) | 44 (100.0%) |
| 5 or more Children | 5 (100.0%) | 0 (0.0%) |
| Total | 16 (6.3%) | 83 (34.2%) |
Race in Sparta
The most populous races in Sparta are White / Caucasian (1,579 | 88.0%), Hispanic or Latino (258 | 14.4%), and Two or more Races (132 | 7.3%).
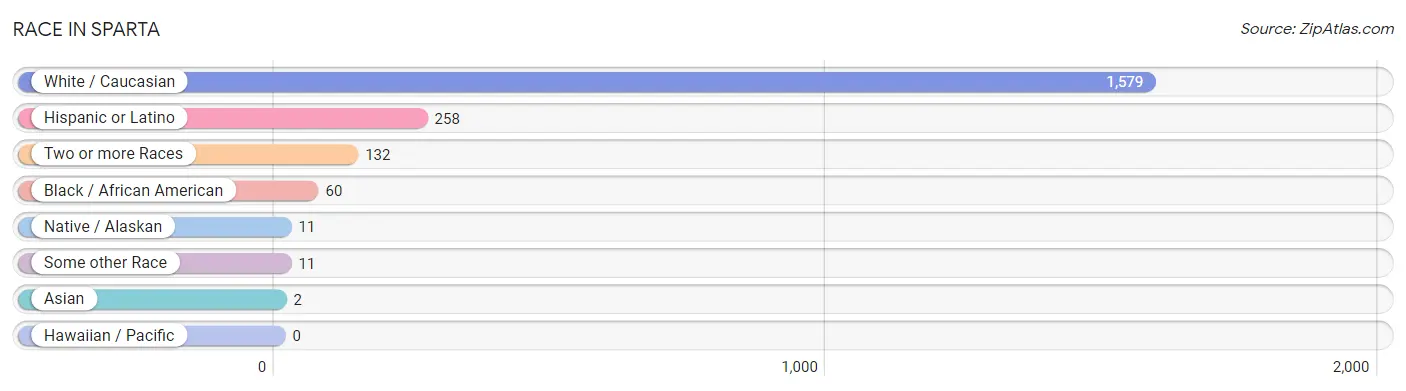
| Race | # Population | % Population |
| Asian | 2 | 0.1% |
| Black / African American | 60 | 3.3% |
| Hawaiian / Pacific | 0 | 0.0% |
| Hispanic or Latino | 258 | 14.4% |
| Native / Alaskan | 11 | 0.6% |
| White / Caucasian | 1,579 | 88.0% |
| Two or more Races | 132 | 7.3% |
| Some other Race | 11 | 0.6% |
| Total | 1,795 | 100.0% |
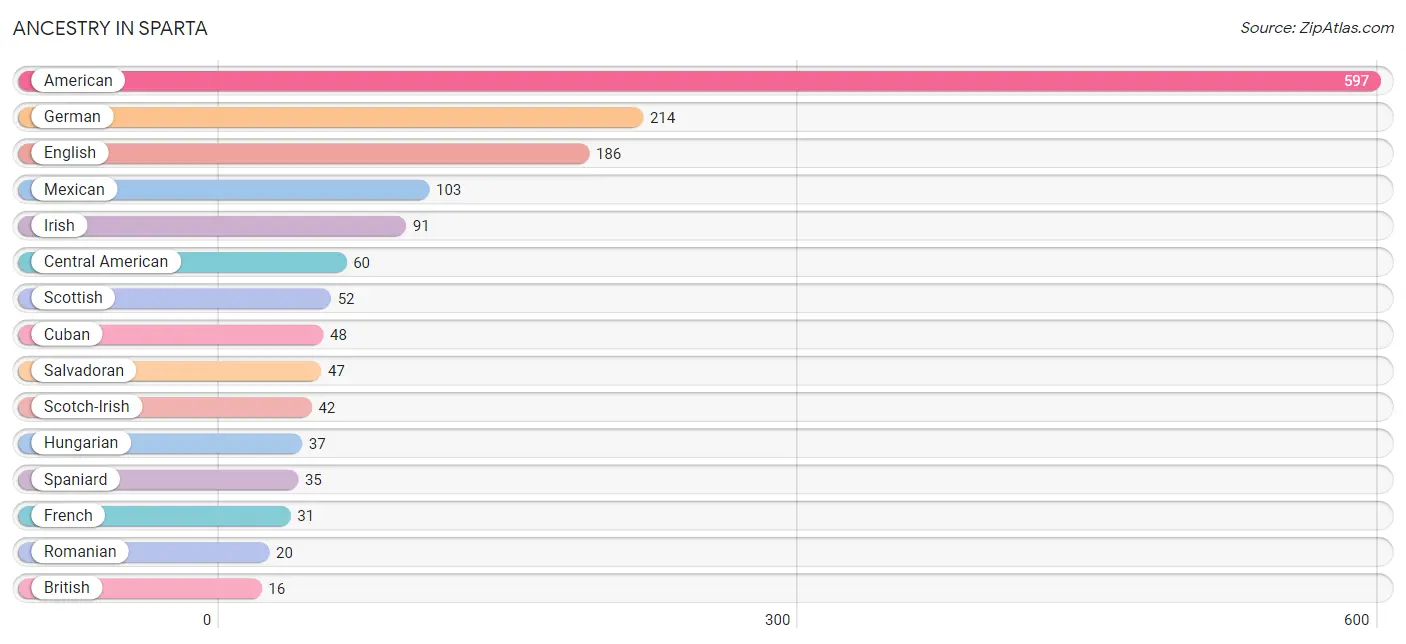
Ancestry in Sparta
The most populous ancestries reported in Sparta are American (597 | 33.3%), German (214 | 11.9%), English (186 | 10.4%), Mexican (103 | 5.7%), and Irish (91 | 5.1%), together accounting for 66.3% of all Sparta residents.
| Ancestry | # Population | % Population |
| African | 9 | 0.5% |
| American | 597 | 33.3% |
| Blackfeet | 9 | 0.5% |
| British | 16 | 0.9% |
| Central American | 60 | 3.3% |
| Cherokee | 5 | 0.3% |
| Colombian | 5 | 0.3% |
| Cuban | 48 | 2.7% |
| Dutch | 4 | 0.2% |
| Eastern European | 4 | 0.2% |
| English | 186 | 10.4% |
| European | 7 | 0.4% |
| French | 31 | 1.7% |
| German | 214 | 11.9% |
| Guatemalan | 13 | 0.7% |
| Hungarian | 37 | 2.1% |
| Irish | 91 | 5.1% |
| Italian | 10 | 0.6% |
| Mexican | 103 | 5.7% |
| Polish | 13 | 0.7% |
| Puerto Rican | 7 | 0.4% |
| Romanian | 20 | 1.1% |
| Salvadoran | 47 | 2.6% |
| Scotch-Irish | 42 | 2.3% |
| Scottish | 52 | 2.9% |
| Sioux | 12 | 0.7% |
| South American | 5 | 0.3% |
| Spaniard | 35 | 1.9% |
| Sri Lankan | 2 | 0.1% |
| Subsaharan African | 9 | 0.5% |
| Swedish | 15 | 0.8% |
| Welsh | 3 | 0.2% | View All 32 Rows |
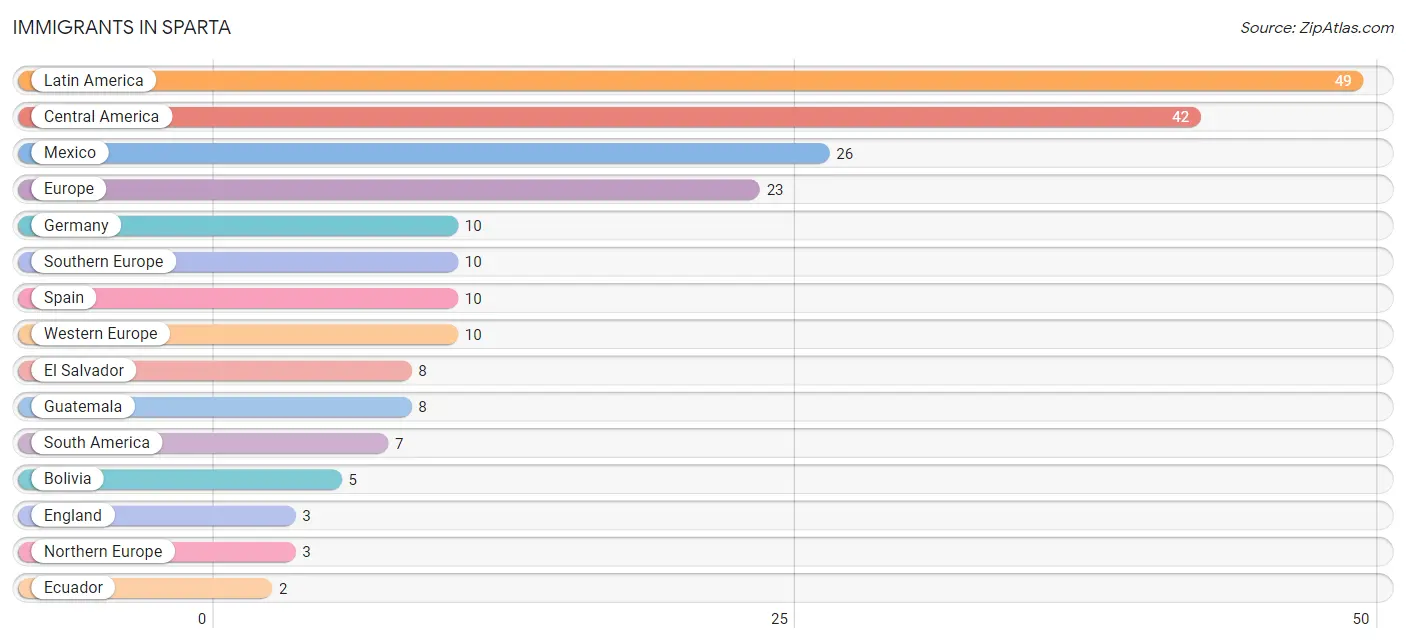
Immigrants in Sparta
The most numerous immigrant groups reported in Sparta came from Latin America (49 | 2.7%), Central America (42 | 2.3%), Mexico (26 | 1.5%), Europe (23 | 1.3%), and Germany (10 | 0.6%), together accounting for 8.4% of all Sparta residents.
| Immigration Origin | # Population | % Population |
| Bolivia | 5 | 0.3% |
| Central America | 42 | 2.3% |
| Ecuador | 2 | 0.1% |
| El Salvador | 8 | 0.4% |
| England | 3 | 0.2% |
| Europe | 23 | 1.3% |
| Germany | 10 | 0.6% |
| Guatemala | 8 | 0.4% |
| Latin America | 49 | 2.7% |
| Mexico | 26 | 1.5% |
| Northern Europe | 3 | 0.2% |
| South America | 7 | 0.4% |
| Southern Europe | 10 | 0.6% |
| Spain | 10 | 0.6% |
| Western Europe | 10 | 0.6% | View All 15 Rows |
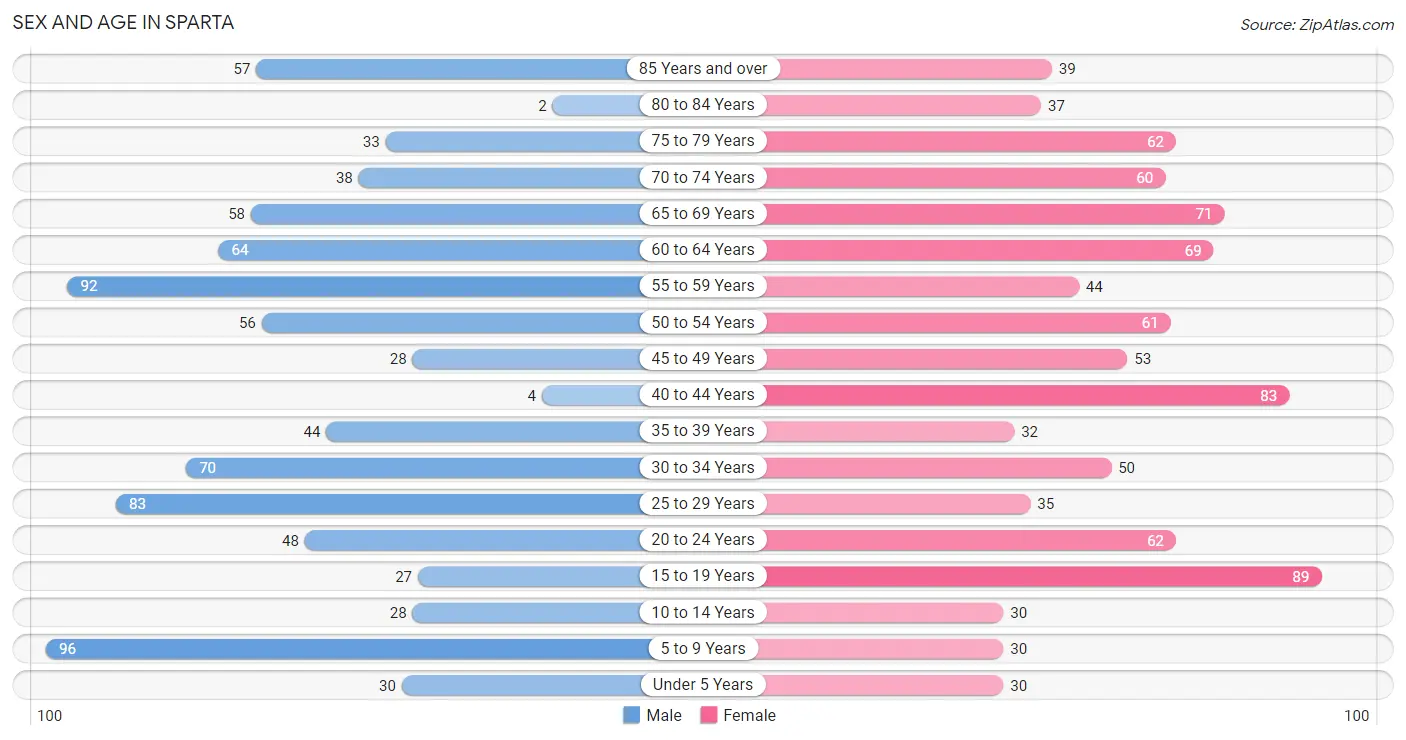
Sex and Age in Sparta
Sex and Age in Sparta
The most populous age groups in Sparta are 5 to 9 Years (96 | 11.2%) for men and 15 to 19 Years (89 | 9.5%) for women.
| Age Bracket | Male | Female |
| Under 5 Years | 30 (3.5%) | 30 (3.2%) |
| 5 to 9 Years | 96 (11.2%) | 30 (3.2%) |
| 10 to 14 Years | 28 (3.3%) | 30 (3.2%) |
| 15 to 19 Years | 27 (3.2%) | 89 (9.5%) |
| 20 to 24 Years | 48 (5.6%) | 62 (6.6%) |
| 25 to 29 Years | 83 (9.7%) | 35 (3.7%) |
| 30 to 34 Years | 70 (8.2%) | 50 (5.3%) |
| 35 to 39 Years | 44 (5.1%) | 32 (3.4%) |
| 40 to 44 Years | 4 (0.5%) | 83 (8.9%) |
| 45 to 49 Years | 28 (3.3%) | 53 (5.7%) |
| 50 to 54 Years | 56 (6.5%) | 61 (6.5%) |
| 55 to 59 Years | 92 (10.7%) | 44 (4.7%) |
| 60 to 64 Years | 64 (7.5%) | 69 (7.4%) |
| 65 to 69 Years | 58 (6.8%) | 71 (7.6%) |
| 70 to 74 Years | 38 (4.4%) | 60 (6.4%) |
| 75 to 79 Years | 33 (3.8%) | 62 (6.6%) |
| 80 to 84 Years | 2 (0.2%) | 37 (4.0%) |
| 85 Years and over | 57 (6.6%) | 39 (4.2%) |
| Total | 858 (100.0%) | 937 (100.0%) |
Families and Households in Sparta
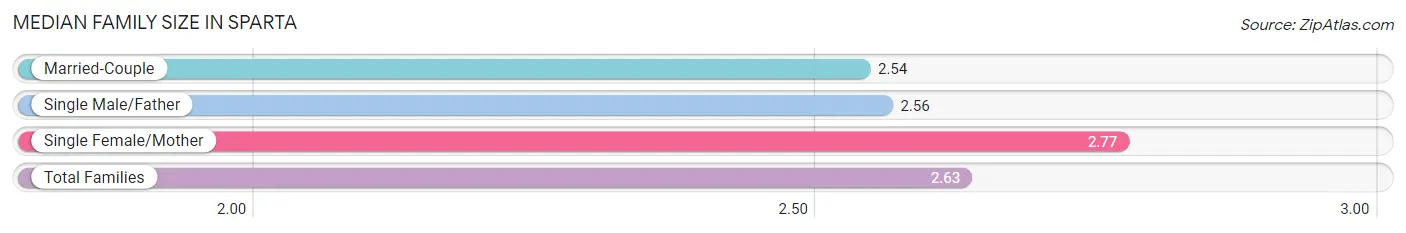
Median Family Size in Sparta
The median family size in Sparta is 2.63 persons per family, with single female/mother families (200 | 40.2%) accounting for the largest median family size of 2.77 persons per family. On the other hand, married-couple families (255 | 51.2%) represent the smallest median family size with 2.54 persons per family.
| Family Type | # Families | Family Size |
| Married-Couple | 255 (51.2%) | 2.54 |
| Single Male/Father | 43 (8.6%) | 2.56 |
| Single Female/Mother | 200 (40.2%) | 2.77 |
| Total Families | 498 (100.0%) | 2.63 |
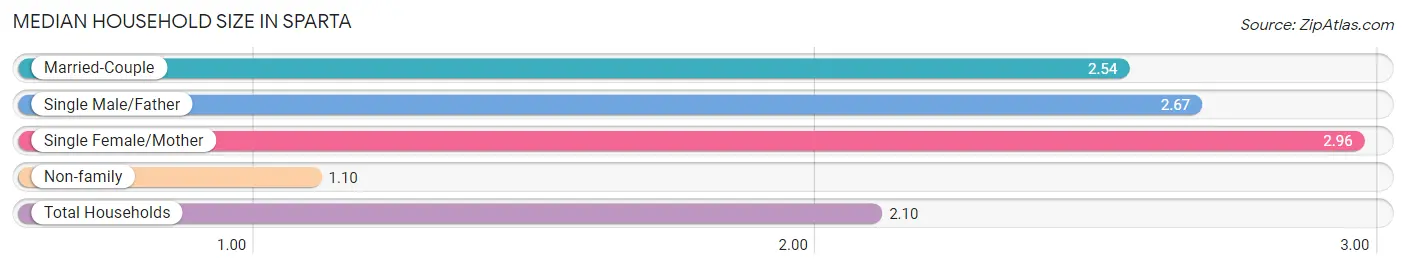
Median Household Size in Sparta
The median household size in Sparta is 2.10 persons per household, with single female/mother households (200 | 25.0%) accounting for the largest median household size of 2.96 persons per household. non-family households (303 | 37.8%) represent the smallest median household size with 1.10 persons per household.
| Household Type | # Households | Household Size |
| Married-Couple | 255 (31.8%) | 2.54 |
| Single Male/Father | 43 (5.4%) | 2.67 |
| Single Female/Mother | 200 (25.0%) | 2.96 |
| Non-family | 303 (37.8%) | 1.10 |
| Total Households | 801 (100.0%) | 2.10 |
Household Size by Marriage Status in Sparta
Out of a total of 801 households in Sparta, 498 (62.2%) are family households, while 303 (37.8%) are nonfamily households. The most numerous type of family households are 2-person households, comprising 264, and the most common type of nonfamily households are 1-person households, comprising 278.
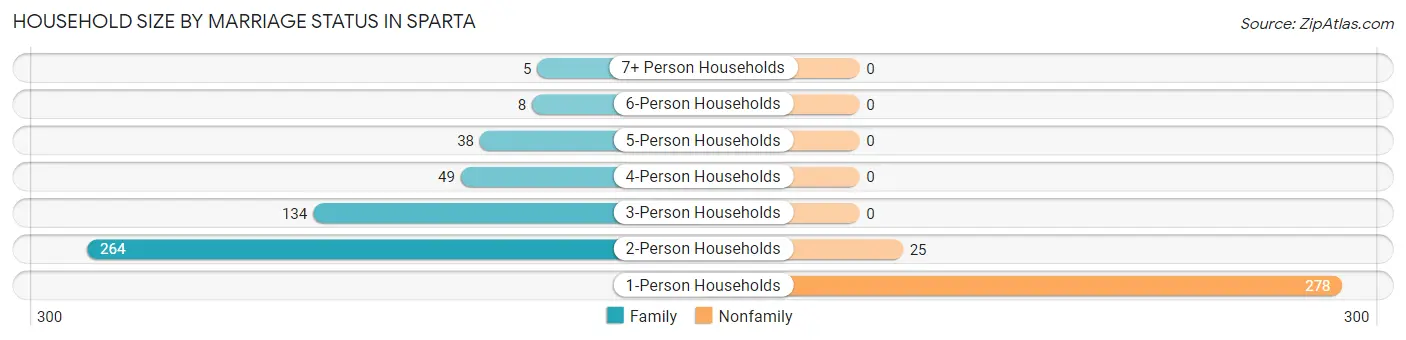
| Household Size | Family Households | Nonfamily Households |
| 1-Person Households | - | 278 (34.7%) |
| 2-Person Households | 264 (33.0%) | 25 (3.1%) |
| 3-Person Households | 134 (16.7%) | 0 (0.0%) |
| 4-Person Households | 49 (6.1%) | 0 (0.0%) |
| 5-Person Households | 38 (4.7%) | 0 (0.0%) |
| 6-Person Households | 8 (1.0%) | 0 (0.0%) |
| 7+ Person Households | 5 (0.6%) | 0 (0.0%) |
| Total | 498 (62.2%) | 303 (37.8%) |
Female Fertility in Sparta
Fertility by Age in Sparta
Average fertility rate in Sparta is 55.0 births per 1,000 women. Women in the age bracket of 20 to 34 years have the highest fertility rate with 156.0 births per 1,000 women. Women in the age bracket of 20 to 34 years acount for 100.0% of all women with births.
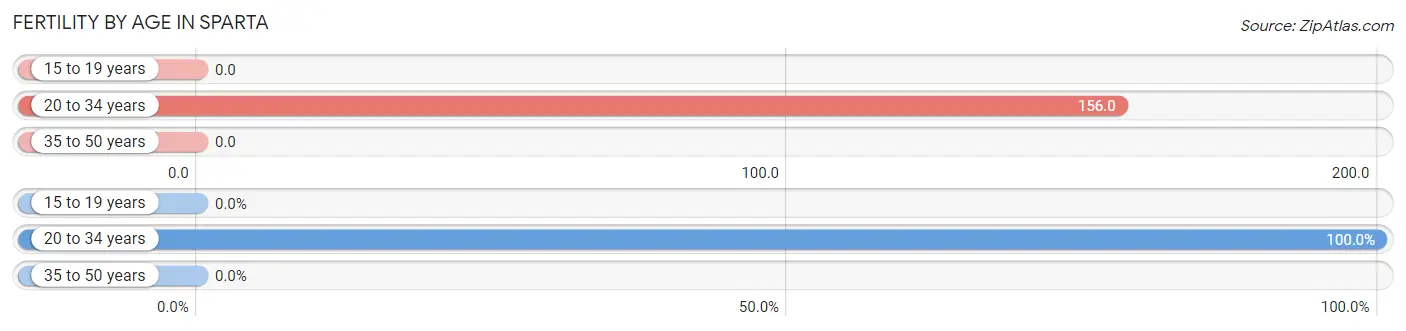
| Age Bracket | Women with Births | Births / 1,000 Women |
| 15 to 19 years | 0 (0.0%) | 0.0 |
| 20 to 34 years | 23 (100.0%) | 156.0 |
| 35 to 50 years | 0 (0.0%) | 0.0 |
| Total | 23 (100.0%) | 55.0 |
Fertility by Age by Marriage Status in Sparta
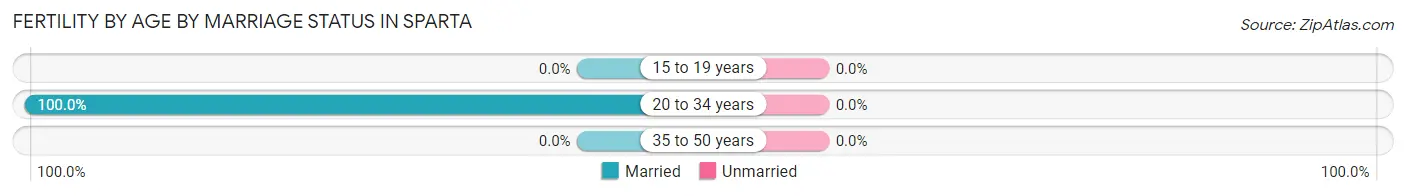
| Age Bracket | Married | Unmarried |
| 15 to 19 years | 0 (0.0%) | 0 (0.0%) |
| 20 to 34 years | 23 (100.0%) | 0 (0.0%) |
| 35 to 50 years | 0 (0.0%) | 0 (0.0%) |
| Total | 23 (100.0%) | 0 (0.0%) |
Fertility by Education in Sparta
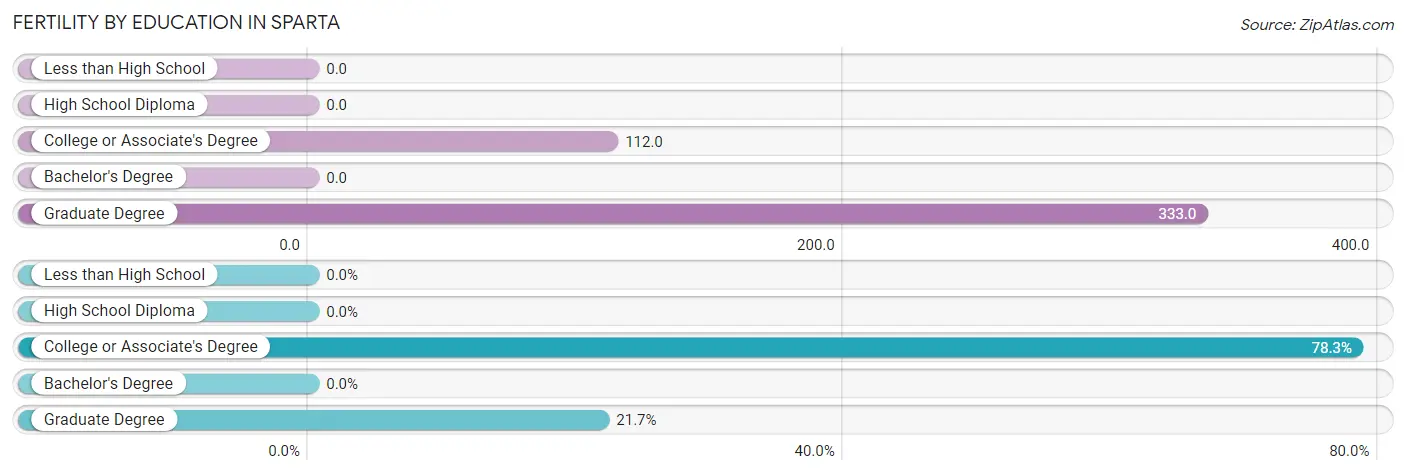
| Educational Attainment | Women with Births | Births / 1,000 Women |
| Less than High School | 0 (0.0%) | 0.0 |
| High School Diploma | 0 (0.0%) | 0.0 |
| College or Associate's Degree | 18 (78.3%) | 112.0 |
| Bachelor's Degree | 0 (0.0%) | 0.0 |
| Graduate Degree | 5 (21.7%) | 333.0 |
| Total | 23 (100.0%) | 55.0 |
Fertility by Education by Marriage Status in Sparta
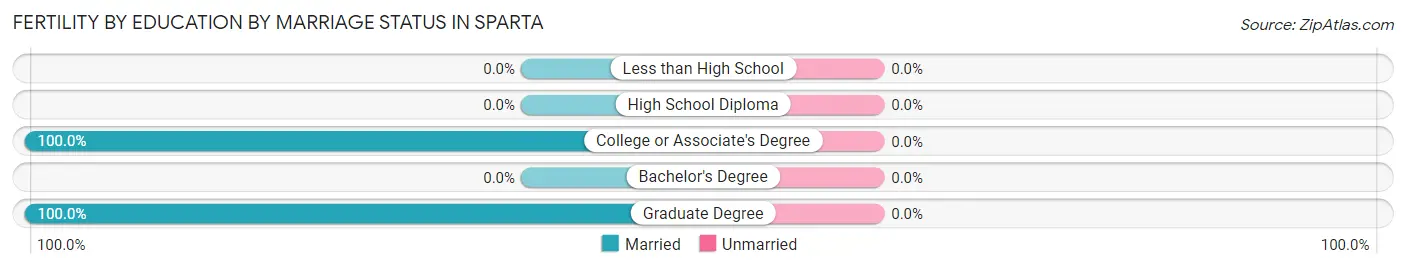
| Educational Attainment | Married | Unmarried |
| Less than High School | 0 (0.0%) | 0 (0.0%) |
| High School Diploma | 0 (0.0%) | 0 (0.0%) |
| College or Associate's Degree | 18 (100.0%) | 0 (0.0%) |
| Bachelor's Degree | 0 (0.0%) | 0 (0.0%) |
| Graduate Degree | 5 (100.0%) | 0 (0.0%) |
| Total | 23 (100.0%) | 0 (0.0%) |
Employment Characteristics in Sparta
Employment by Class of Employer in Sparta
Among the 675 employed individuals in Sparta, private company employees (448 | 66.4%), self-employed (not incorporated) (50 | 7.4%), and state government employees (48 | 7.1%) make up the most common classes of employment.
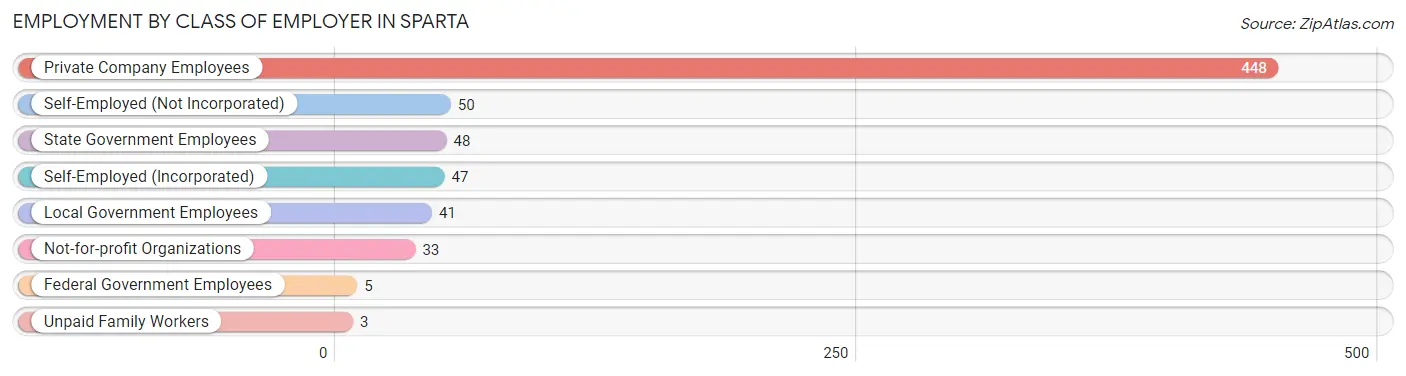
| Employer Class | # Employees | % Employees |
| Private Company Employees | 448 | 66.4% |
| Self-Employed (Incorporated) | 47 | 7.0% |
| Self-Employed (Not Incorporated) | 50 | 7.4% |
| Not-for-profit Organizations | 33 | 4.9% |
| Local Government Employees | 41 | 6.1% |
| State Government Employees | 48 | 7.1% |
| Federal Government Employees | 5 | 0.7% |
| Unpaid Family Workers | 3 | 0.4% |
| Total | 675 | 100.0% |
Employment Status by Age in Sparta
According to the labor force statistics for Sparta, out of the total population over 16 years of age (1,544), 46.4% or 716 individuals are in the labor force, with 4.5% or 32 of them unemployed. The age group with the highest labor force participation rate is 35 to 44 years, with 88.3% or 144 individuals in the labor force. Within the labor force, the 25 to 29 years age range has the highest percentage of unemployed individuals, with 14.3% or 10 of them being unemployed.
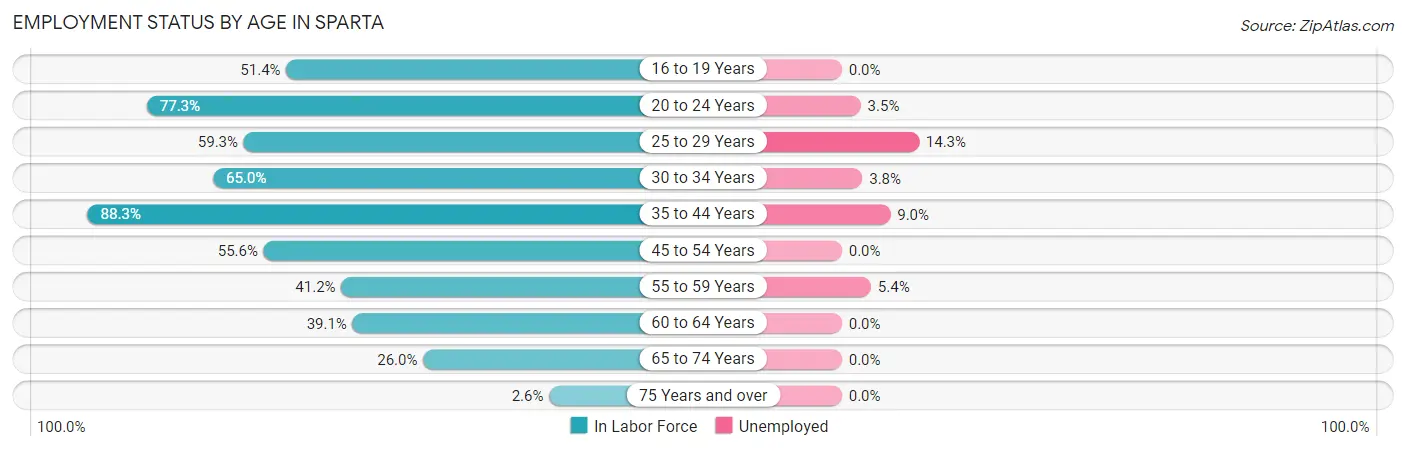
| Age Bracket | In Labor Force | Unemployed |
| 16 to 19 Years | 56 (51.4%) | 0 (0.0%) |
| 20 to 24 Years | 85 (77.3%) | 3 (3.5%) |
| 25 to 29 Years | 70 (59.3%) | 10 (14.3%) |
| 30 to 34 Years | 78 (65.0%) | 3 (3.8%) |
| 35 to 44 Years | 144 (88.3%) | 13 (9.0%) |
| 45 to 54 Years | 110 (55.6%) | 0 (0.0%) |
| 55 to 59 Years | 56 (41.2%) | 3 (5.4%) |
| 60 to 64 Years | 52 (39.1%) | 0 (0.0%) |
| 65 to 74 Years | 59 (26.0%) | 0 (0.0%) |
| 75 Years and over | 6 (2.6%) | 0 (0.0%) |
| Total | 716 (46.4%) | 32 (4.5%) |
Employment Status by Educational Attainment in Sparta
According to labor force statistics for Sparta, 58.8% of individuals (510) out of the total population between 25 and 64 years of age (868) are in the labor force, with 5.7% or 29 of them being unemployed. The group with the highest labor force participation rate are those with the educational attainment of bachelor's degree or higher, with 74.4% or 64 individuals in the labor force. Within the labor force, individuals with less than high school education have the highest percentage of unemployment, with 15.2% or 10 of them being unemployed.
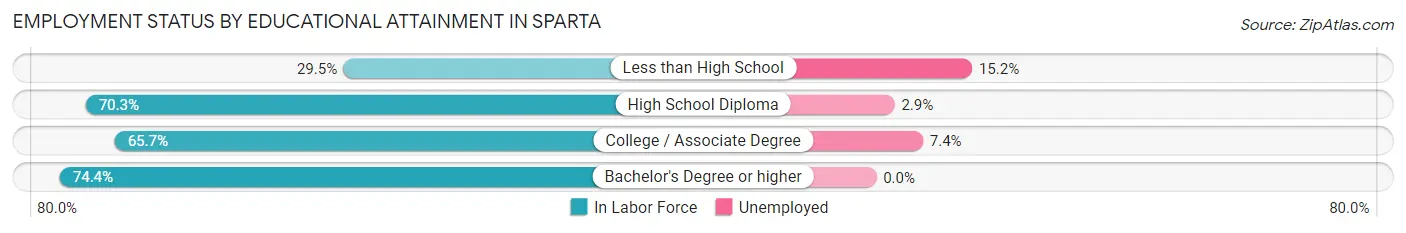
| Educational Attainment | In Labor Force | Unemployed |
| Less than High School | 66 (29.5%) | 34 (15.2%) |
| High School Diploma | 204 (70.3%) | 8 (2.9%) |
| College / Associate Degree | 176 (65.7%) | 20 (7.4%) |
| Bachelor's Degree or higher | 64 (74.4%) | 0 (0.0%) |
| Total | 510 (58.8%) | 49 (5.7%) |
Employment Occupations by Sex in Sparta
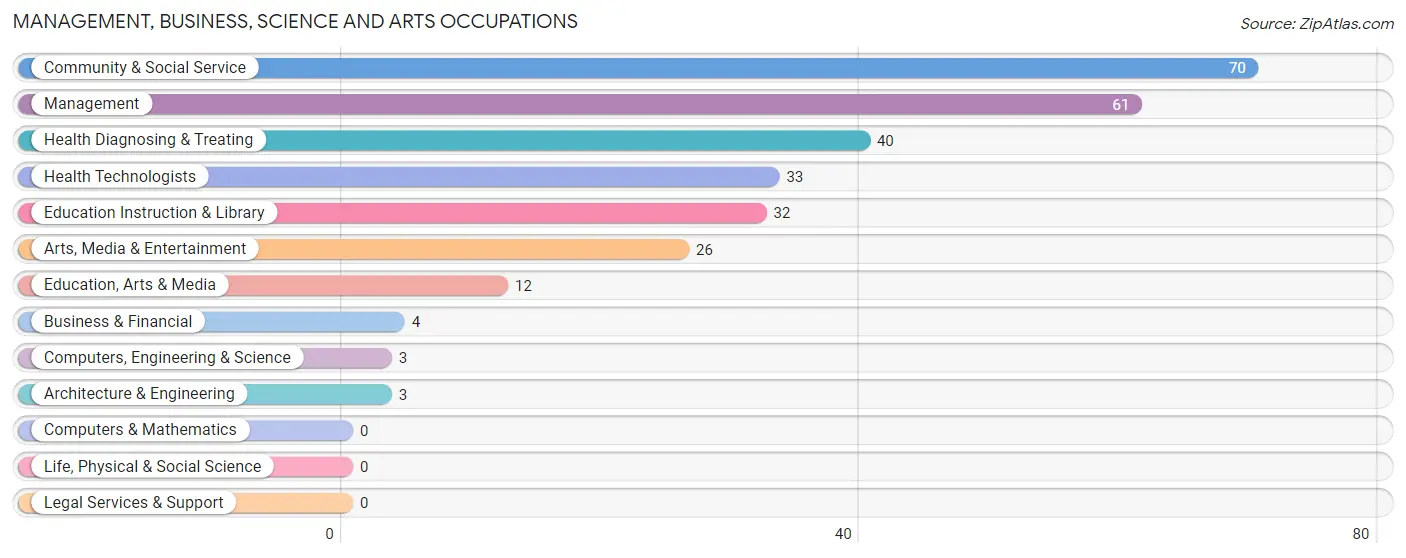
Management, Business, Science and Arts Occupations
The most common Management, Business, Science and Arts occupations in Sparta are Community & Social Service (70 | 10.2%), Management (61 | 8.9%), Health Diagnosing & Treating (40 | 5.9%), Health Technologists (33 | 4.8%), and Education Instruction & Library (32 | 4.7%).
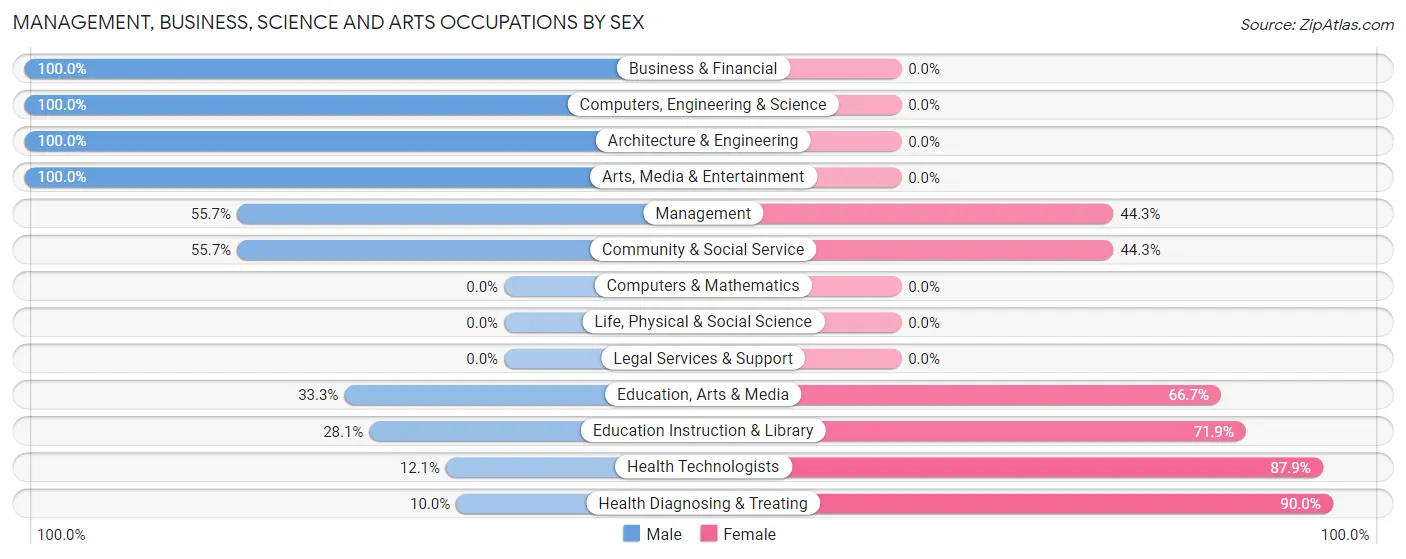
Management, Business, Science and Arts Occupations by Sex
Within the Management, Business, Science and Arts occupations in Sparta, the most male-oriented occupations are Business & Financial (100.0%), Computers, Engineering & Science (100.0%), and Architecture & Engineering (100.0%), while the most female-oriented occupations are Health Diagnosing & Treating (90.0%), Health Technologists (87.9%), and Education Instruction & Library (71.9%).
| Occupation | Male | Female |
| Management | 34 (55.7%) | 27 (44.3%) |
| Business & Financial | 4 (100.0%) | 0 (0.0%) |
| Computers, Engineering & Science | 3 (100.0%) | 0 (0.0%) |
| Computers & Mathematics | 0 (0.0%) | 0 (0.0%) |
| Architecture & Engineering | 3 (100.0%) | 0 (0.0%) |
| Life, Physical & Social Science | 0 (0.0%) | 0 (0.0%) |
| Community & Social Service | 39 (55.7%) | 31 (44.3%) |
| Education, Arts & Media | 4 (33.3%) | 8 (66.7%) |
| Legal Services & Support | 0 (0.0%) | 0 (0.0%) |
| Education Instruction & Library | 9 (28.1%) | 23 (71.9%) |
| Arts, Media & Entertainment | 26 (100.0%) | 0 (0.0%) |
| Health Diagnosing & Treating | 4 (10.0%) | 36 (90.0%) |
| Health Technologists | 4 (12.1%) | 29 (87.9%) |
| Total (Category) | 84 (47.2%) | 94 (52.8%) |
| Total (Overall) | 290 (42.4%) | 394 (57.6%) |
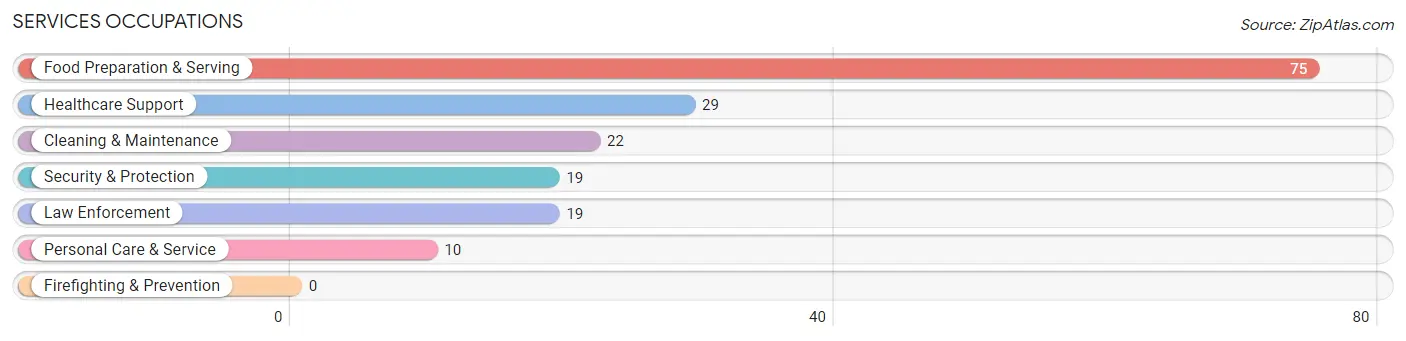
Services Occupations
The most common Services occupations in Sparta are Food Preparation & Serving (75 | 11.0%), Healthcare Support (29 | 4.2%), Cleaning & Maintenance (22 | 3.2%), Security & Protection (19 | 2.8%), and Law Enforcement (19 | 2.8%).
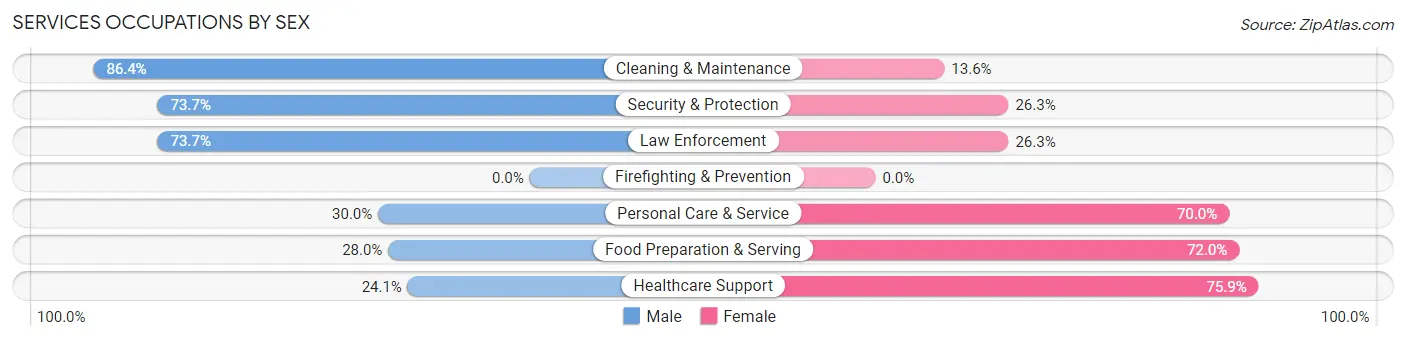
Services Occupations by Sex
Within the Services occupations in Sparta, the most male-oriented occupations are Cleaning & Maintenance (86.4%), Security & Protection (73.7%), and Law Enforcement (73.7%), while the most female-oriented occupations are Healthcare Support (75.9%), Food Preparation & Serving (72.0%), and Personal Care & Service (70.0%).
| Occupation | Male | Female |
| Healthcare Support | 7 (24.1%) | 22 (75.9%) |
| Security & Protection | 14 (73.7%) | 5 (26.3%) |
| Firefighting & Prevention | 0 (0.0%) | 0 (0.0%) |
| Law Enforcement | 14 (73.7%) | 5 (26.3%) |
| Food Preparation & Serving | 21 (28.0%) | 54 (72.0%) |
| Cleaning & Maintenance | 19 (86.4%) | 3 (13.6%) |
| Personal Care & Service | 3 (30.0%) | 7 (70.0%) |
| Total (Category) | 64 (41.3%) | 91 (58.7%) |
| Total (Overall) | 290 (42.4%) | 394 (57.6%) |
Sales and Office Occupations
The most common Sales and Office occupations in Sparta are Sales & Related (123 | 18.0%), and Office & Administration (108 | 15.8%).
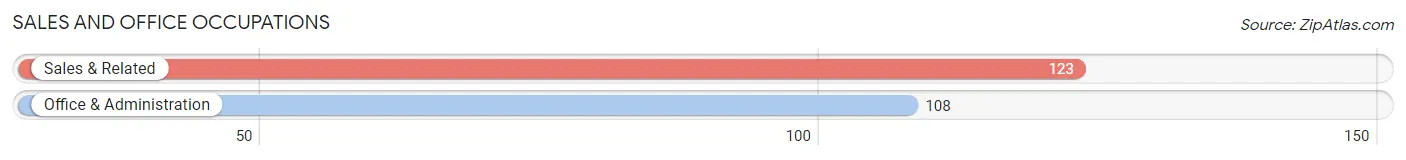
Sales and Office Occupations by Sex
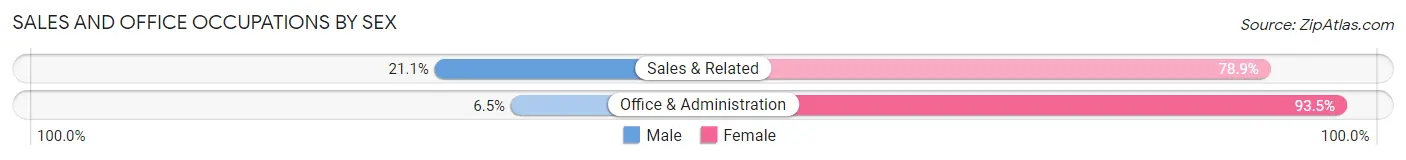
| Occupation | Male | Female |
| Sales & Related | 26 (21.1%) | 97 (78.9%) |
| Office & Administration | 7 (6.5%) | 101 (93.5%) |
| Total (Category) | 33 (14.3%) | 198 (85.7%) |
| Total (Overall) | 290 (42.4%) | 394 (57.6%) |
Natural Resources, Construction and Maintenance Occupations
The most common Natural Resources, Construction and Maintenance occupations in Sparta are Construction & Extraction (42 | 6.1%), and Installation, Maintenance & Repair (15 | 2.2%).
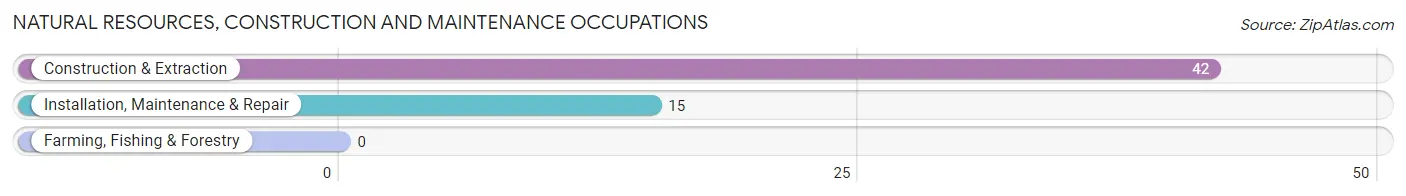
Natural Resources, Construction and Maintenance Occupations by Sex
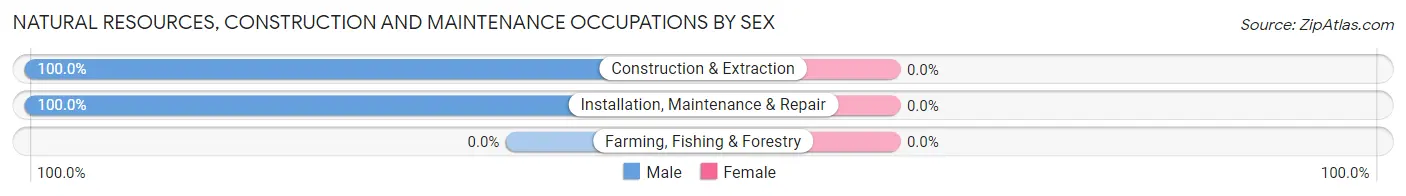
| Occupation | Male | Female |
| Farming, Fishing & Forestry | 0 (0.0%) | 0 (0.0%) |
| Construction & Extraction | 42 (100.0%) | 0 (0.0%) |
| Installation, Maintenance & Repair | 15 (100.0%) | 0 (0.0%) |
| Total (Category) | 57 (100.0%) | 0 (0.0%) |
| Total (Overall) | 290 (42.4%) | 394 (57.6%) |
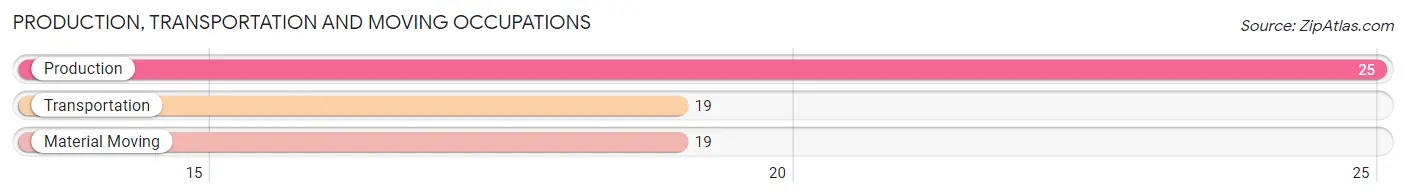
Production, Transportation and Moving Occupations
The most common Production, Transportation and Moving occupations in Sparta are Production (25 | 3.6%), Transportation (19 | 2.8%), and Material Moving (19 | 2.8%).
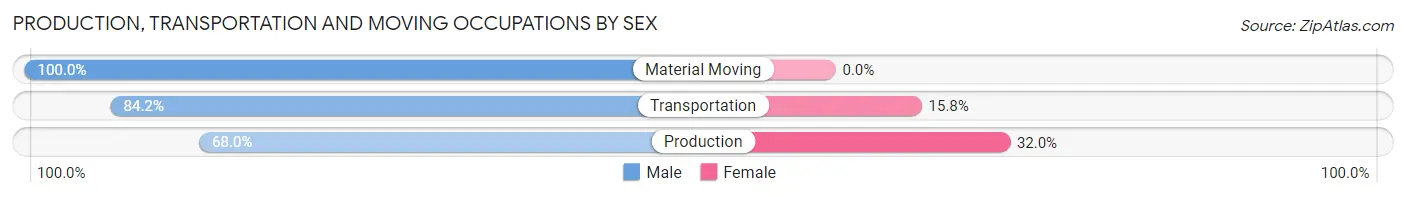
Production, Transportation and Moving Occupations by Sex
| Occupation | Male | Female |
| Production | 17 (68.0%) | 8 (32.0%) |
| Transportation | 16 (84.2%) | 3 (15.8%) |
| Material Moving | 19 (100.0%) | 0 (0.0%) |
| Total (Category) | 52 (82.5%) | 11 (17.5%) |
| Total (Overall) | 290 (42.4%) | 394 (57.6%) |
Employment Industries by Sex in Sparta
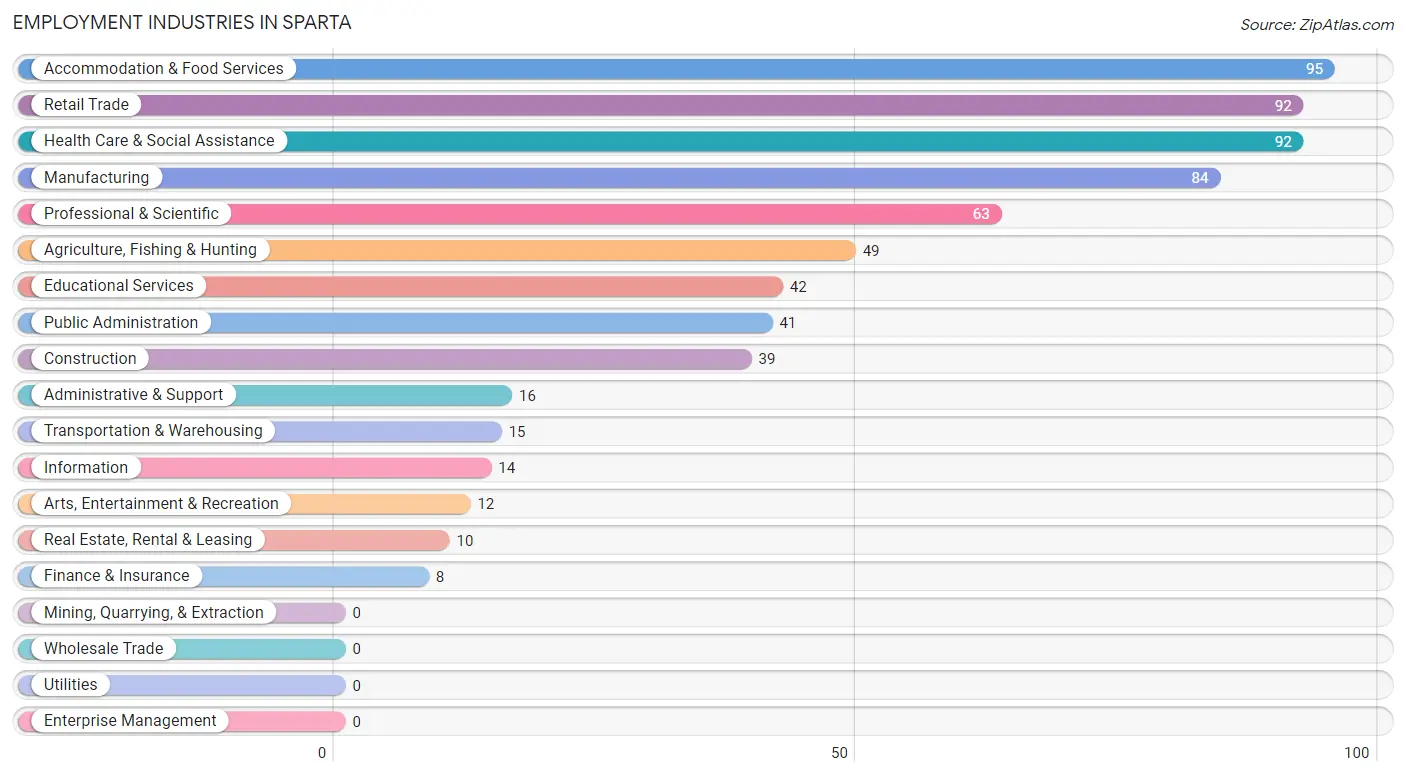
Employment Industries in Sparta
The major employment industries in Sparta include Accommodation & Food Services (95 | 13.9%), Retail Trade (92 | 13.5%), Health Care & Social Assistance (92 | 13.5%), Manufacturing (84 | 12.3%), and Professional & Scientific (63 | 9.2%).
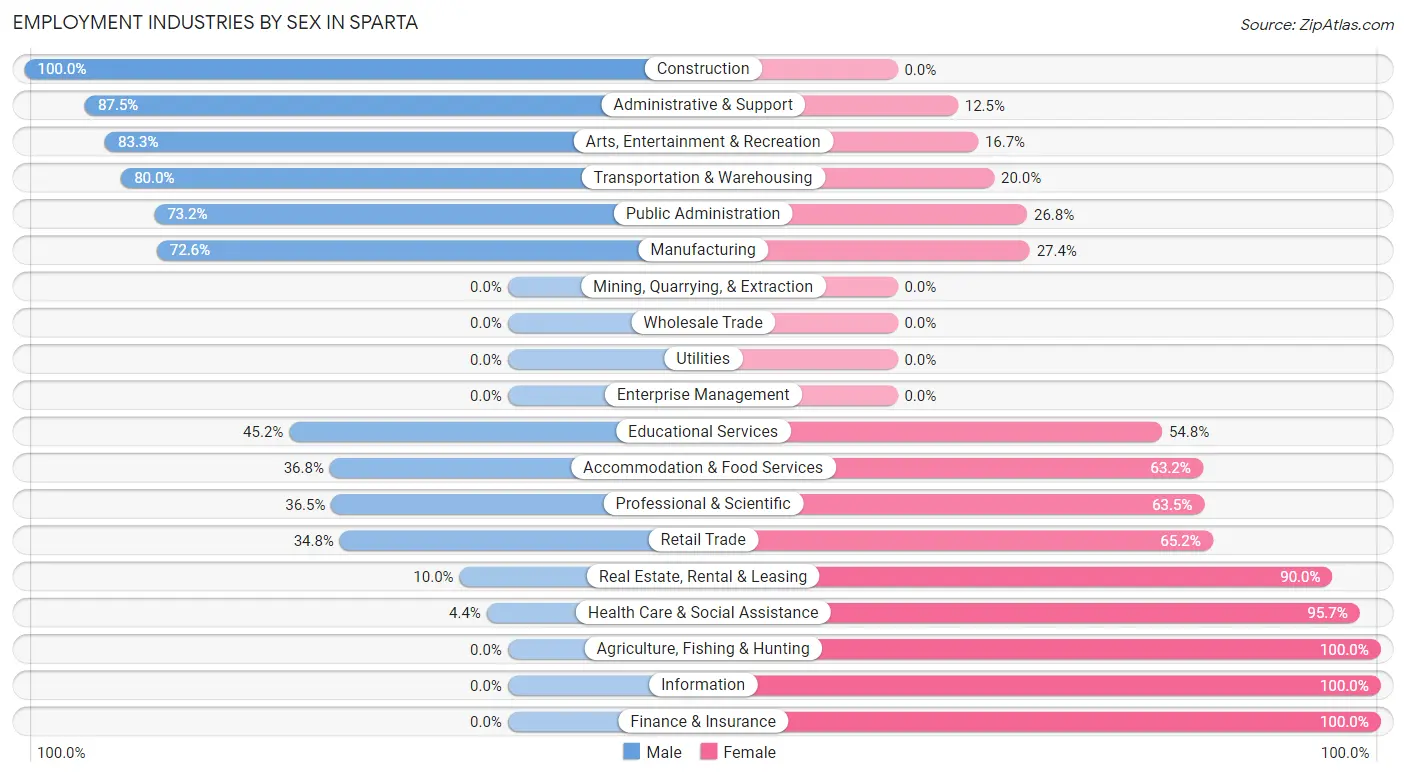
Employment Industries by Sex in Sparta
The Sparta industries that see more men than women are Construction (100.0%), Administrative & Support (87.5%), and Arts, Entertainment & Recreation (83.3%), whereas the industries that tend to have a higher number of women are Agriculture, Fishing & Hunting (100.0%), Information (100.0%), and Finance & Insurance (100.0%).
| Industry | Male | Female |
| Agriculture, Fishing & Hunting | 0 (0.0%) | 49 (100.0%) |
| Mining, Quarrying, & Extraction | 0 (0.0%) | 0 (0.0%) |
| Construction | 39 (100.0%) | 0 (0.0%) |
| Manufacturing | 61 (72.6%) | 23 (27.4%) |
| Wholesale Trade | 0 (0.0%) | 0 (0.0%) |
| Retail Trade | 32 (34.8%) | 60 (65.2%) |
| Transportation & Warehousing | 12 (80.0%) | 3 (20.0%) |
| Utilities | 0 (0.0%) | 0 (0.0%) |
| Information | 0 (0.0%) | 14 (100.0%) |
| Finance & Insurance | 0 (0.0%) | 8 (100.0%) |
| Real Estate, Rental & Leasing | 1 (10.0%) | 9 (90.0%) |
| Professional & Scientific | 23 (36.5%) | 40 (63.5%) |
| Enterprise Management | 0 (0.0%) | 0 (0.0%) |
| Administrative & Support | 14 (87.5%) | 2 (12.5%) |
| Educational Services | 19 (45.2%) | 23 (54.8%) |
| Health Care & Social Assistance | 4 (4.3%) | 88 (95.7%) |
| Arts, Entertainment & Recreation | 10 (83.3%) | 2 (16.7%) |
| Accommodation & Food Services | 35 (36.8%) | 60 (63.2%) |
| Public Administration | 30 (73.2%) | 11 (26.8%) |
| Total | 290 (42.4%) | 394 (57.6%) |
Education in Sparta
School Enrollment in Sparta
The most common levels of schooling among the 334 students in Sparta are elementary school (92 | 27.5%), college / undergraduate (86 | 25.8%), and high school (67 | 20.1%).
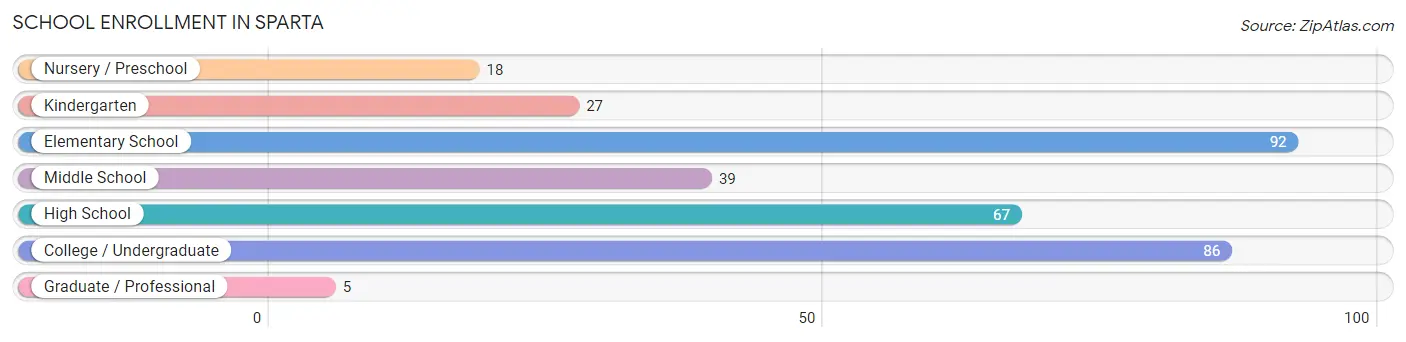
| School Level | # Students | % Students |
| Nursery / Preschool | 18 | 5.4% |
| Kindergarten | 27 | 8.1% |
| Elementary School | 92 | 27.5% |
| Middle School | 39 | 11.7% |
| High School | 67 | 20.1% |
| College / Undergraduate | 86 | 25.8% |
| Graduate / Professional | 5 | 1.5% |
| Total | 334 | 100.0% |
School Enrollment by Age by Funding Source in Sparta
Out of a total of 334 students who are enrolled in schools in Sparta, 16 (4.8%) attend a private institution, while the remaining 318 (95.2%) are enrolled in public schools. The age group of 35 years and over has the highest likelihood of being enrolled in private schools, with 3 (15.0% in the age bracket) enrolled. Conversely, the age group of 3 to 4 year olds has the lowest likelihood of being enrolled in a private school, with 18 (100.0% in the age bracket) attending a public institution.
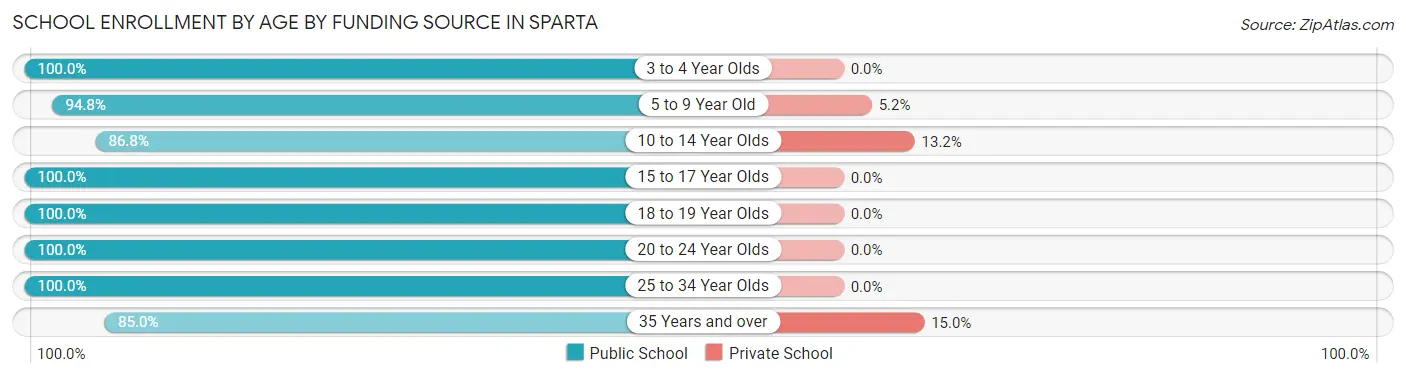
| Age Bracket | Public School | Private School |
| 3 to 4 Year Olds | 18 (100.0%) | 0 (0.0%) |
| 5 to 9 Year Old | 109 (94.8%) | 6 (5.2%) |
| 10 to 14 Year Olds | 46 (86.8%) | 7 (13.2%) |
| 15 to 17 Year Olds | 57 (100.0%) | 0 (0.0%) |
| 18 to 19 Year Olds | 30 (100.0%) | 0 (0.0%) |
| 20 to 24 Year Olds | 20 (100.0%) | 0 (0.0%) |
| 25 to 34 Year Olds | 21 (100.0%) | 0 (0.0%) |
| 35 Years and over | 17 (85.0%) | 3 (15.0%) |
| Total | 318 (95.2%) | 16 (4.8%) |
Educational Attainment by Field of Study in Sparta
Education (96 | 46.4%), bio, nature & agricultural (24 | 11.6%), social sciences (24 | 11.6%), arts & humanities (16 | 7.7%), and science & technology (10 | 4.8%) are the most common fields of study among 207 individuals in Sparta who have obtained a bachelor's degree or higher.
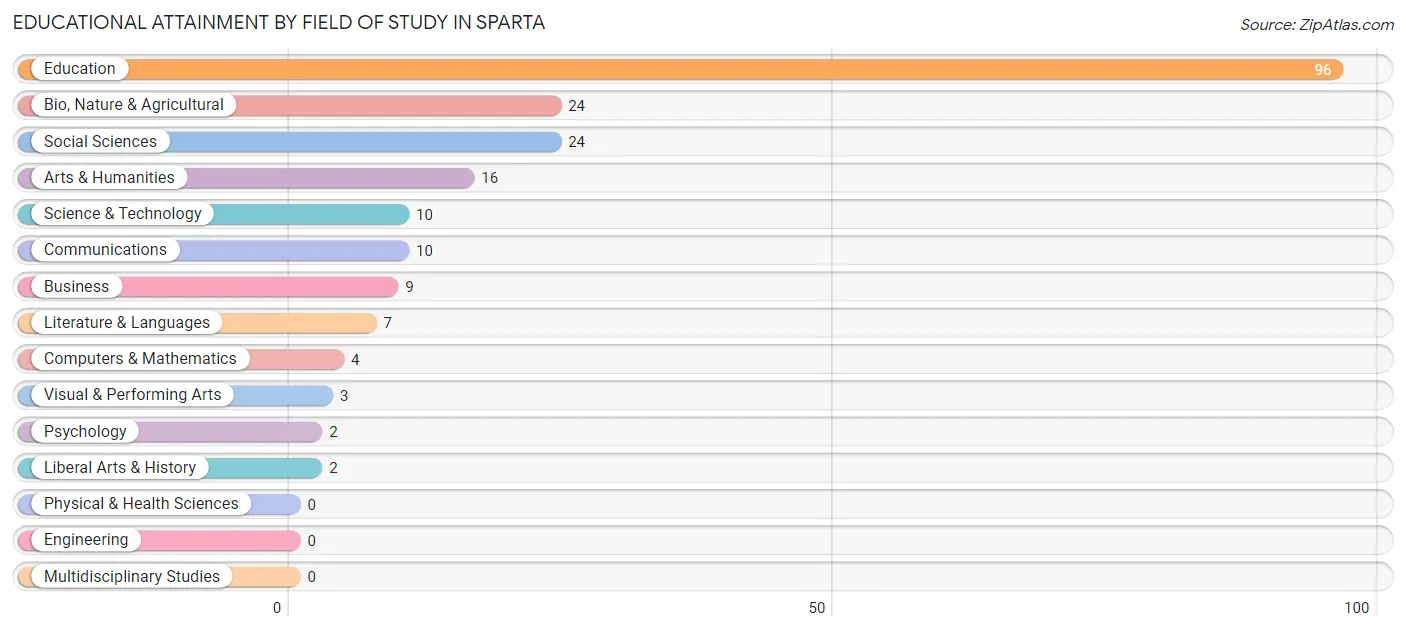
| Field of Study | # Graduates | % Graduates |
| Computers & Mathematics | 4 | 1.9% |
| Bio, Nature & Agricultural | 24 | 11.6% |
| Physical & Health Sciences | 0 | 0.0% |
| Psychology | 2 | 1.0% |
| Social Sciences | 24 | 11.6% |
| Engineering | 0 | 0.0% |
| Multidisciplinary Studies | 0 | 0.0% |
| Science & Technology | 10 | 4.8% |
| Business | 9 | 4.3% |
| Education | 96 | 46.4% |
| Literature & Languages | 7 | 3.4% |
| Liberal Arts & History | 2 | 1.0% |
| Visual & Performing Arts | 3 | 1.5% |
| Communications | 10 | 4.8% |
| Arts & Humanities | 16 | 7.7% |
| Total | 207 | 100.0% |
Transportation & Commute in Sparta
Vehicle Availability by Sex in Sparta
The most prevalent vehicle ownership categories in Sparta are males with 2 vehicles (113, accounting for 39.4%) and females with 2 vehicles (140, making up 29.1%).
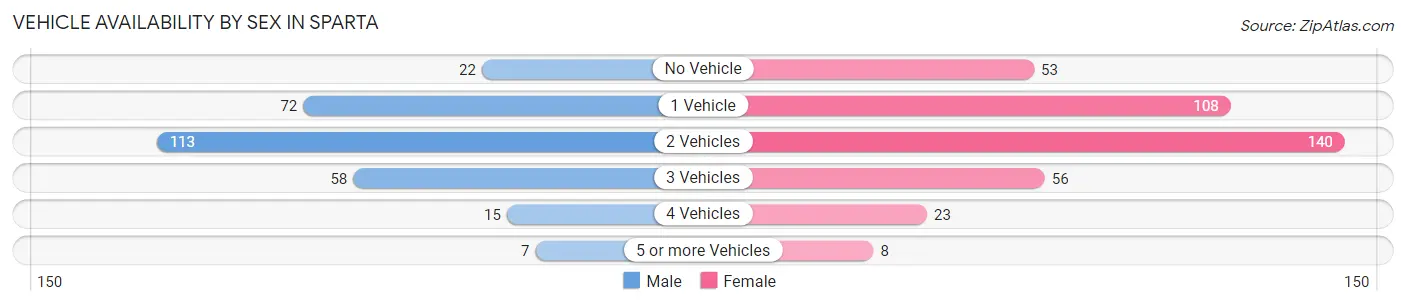
| Vehicles Available | Male | Female |
| No Vehicle | 22 (7.7%) | 53 (13.7%) |
| 1 Vehicle | 72 (25.1%) | 108 (27.8%) |
| 2 Vehicles | 113 (39.4%) | 140 (36.1%) |
| 3 Vehicles | 58 (20.2%) | 56 (14.4%) |
| 4 Vehicles | 15 (5.2%) | 23 (5.9%) |
| 5 or more Vehicles | 7 (2.4%) | 8 (2.1%) |
| Total | 287 (100.0%) | 388 (100.0%) |
Commute Time in Sparta
The most frequently occuring commute durations in Sparta are 5 to 9 minutes (212 commuters, 36.9%), less than 5 minutes (108 commuters, 18.8%), and 15 to 19 minutes (69 commuters, 12.0%).
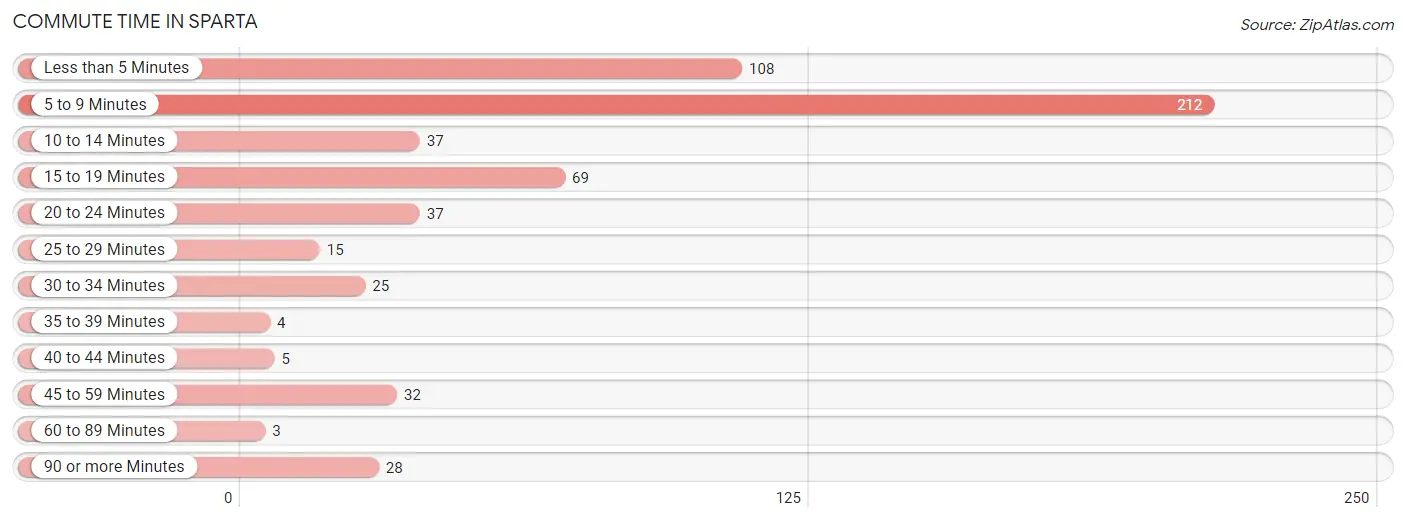
| Commute Time | # Commuters | % Commuters |
| Less than 5 Minutes | 108 | 18.8% |
| 5 to 9 Minutes | 212 | 36.9% |
| 10 to 14 Minutes | 37 | 6.4% |
| 15 to 19 Minutes | 69 | 12.0% |
| 20 to 24 Minutes | 37 | 6.4% |
| 25 to 29 Minutes | 15 | 2.6% |
| 30 to 34 Minutes | 25 | 4.3% |
| 35 to 39 Minutes | 4 | 0.7% |
| 40 to 44 Minutes | 5 | 0.9% |
| 45 to 59 Minutes | 32 | 5.6% |
| 60 to 89 Minutes | 3 | 0.5% |
| 90 or more Minutes | 28 | 4.9% |
Commute Time by Sex in Sparta
The most common commute times in Sparta are 5 to 9 minutes (79 commuters, 29.6%) for males and 5 to 9 minutes (133 commuters, 43.2%) for females.
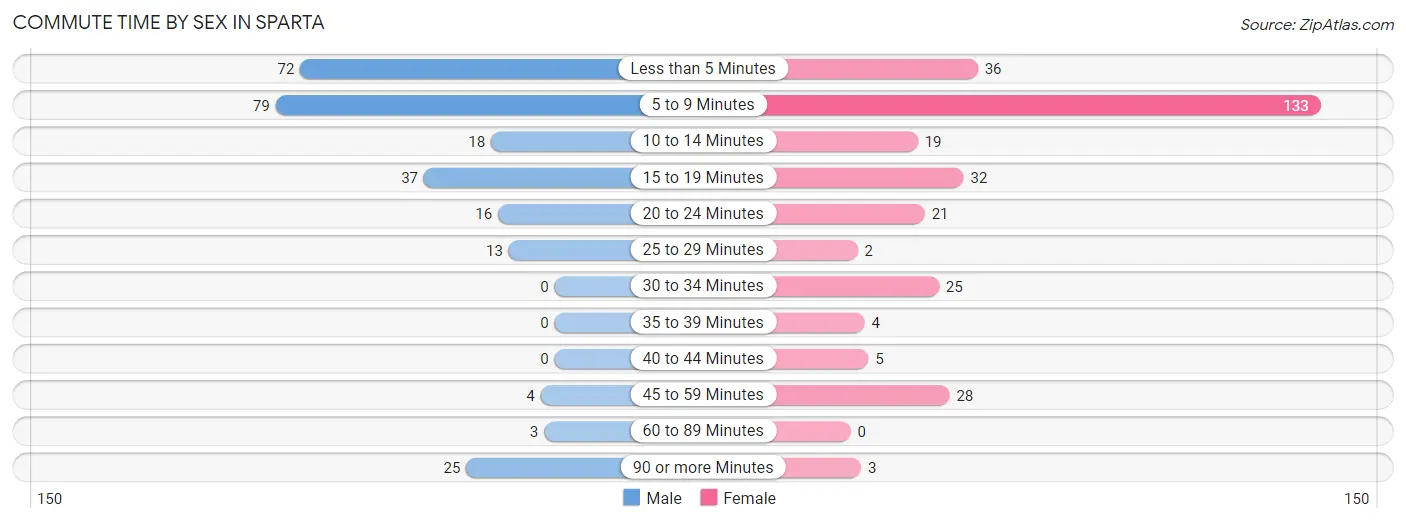
| Commute Time | Male | Female |
| Less than 5 Minutes | 72 (27.0%) | 36 (11.7%) |
| 5 to 9 Minutes | 79 (29.6%) | 133 (43.2%) |
| 10 to 14 Minutes | 18 (6.7%) | 19 (6.2%) |
| 15 to 19 Minutes | 37 (13.9%) | 32 (10.4%) |
| 20 to 24 Minutes | 16 (6.0%) | 21 (6.8%) |
| 25 to 29 Minutes | 13 (4.9%) | 2 (0.6%) |
| 30 to 34 Minutes | 0 (0.0%) | 25 (8.1%) |
| 35 to 39 Minutes | 0 (0.0%) | 4 (1.3%) |
| 40 to 44 Minutes | 0 (0.0%) | 5 (1.6%) |
| 45 to 59 Minutes | 4 (1.5%) | 28 (9.1%) |
| 60 to 89 Minutes | 3 (1.1%) | 0 (0.0%) |
| 90 or more Minutes | 25 (9.4%) | 3 (1.0%) |
Time of Departure to Work by Sex in Sparta
The most frequent times of departure to work in Sparta are 6:30 AM to 6:59 AM (48, 18.0%) for males and 7:00 AM to 7:29 AM (63, 20.4%) for females.
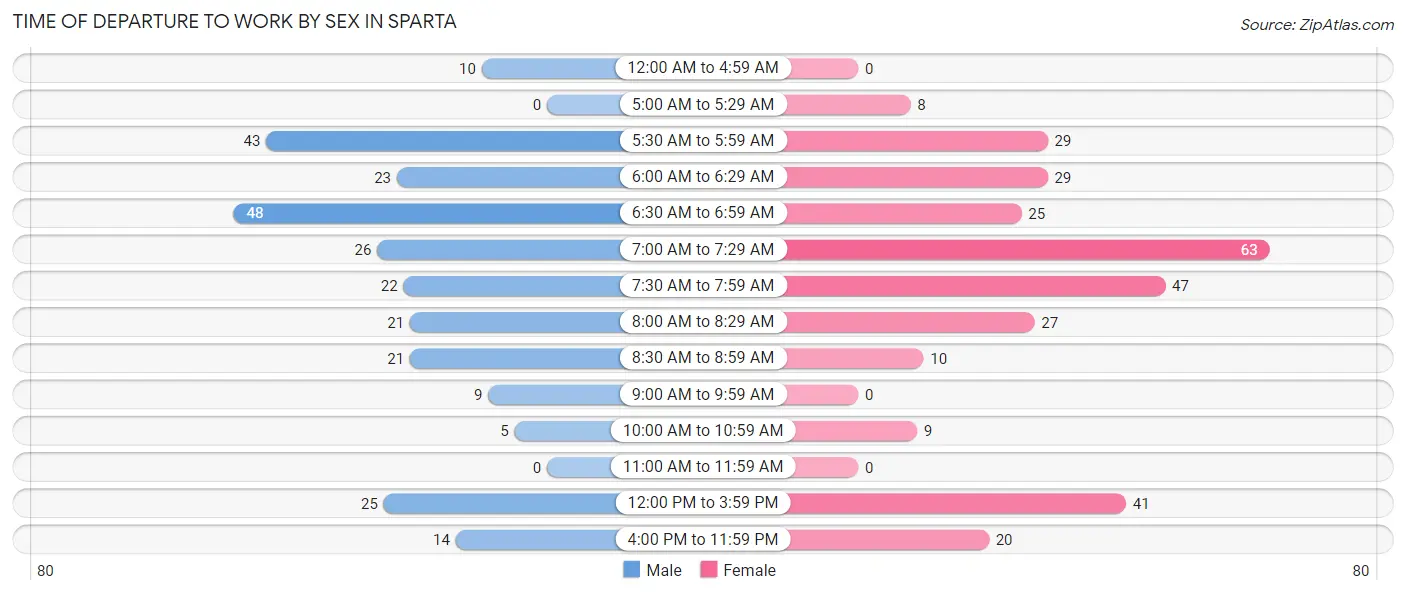
| Time of Departure | Male | Female |
| 12:00 AM to 4:59 AM | 10 (3.7%) | 0 (0.0%) |
| 5:00 AM to 5:29 AM | 0 (0.0%) | 8 (2.6%) |
| 5:30 AM to 5:59 AM | 43 (16.1%) | 29 (9.4%) |
| 6:00 AM to 6:29 AM | 23 (8.6%) | 29 (9.4%) |
| 6:30 AM to 6:59 AM | 48 (18.0%) | 25 (8.1%) |
| 7:00 AM to 7:29 AM | 26 (9.7%) | 63 (20.4%) |
| 7:30 AM to 7:59 AM | 22 (8.2%) | 47 (15.3%) |
| 8:00 AM to 8:29 AM | 21 (7.9%) | 27 (8.8%) |
| 8:30 AM to 8:59 AM | 21 (7.9%) | 10 (3.3%) |
| 9:00 AM to 9:59 AM | 9 (3.4%) | 0 (0.0%) |
| 10:00 AM to 10:59 AM | 5 (1.9%) | 9 (2.9%) |
| 11:00 AM to 11:59 AM | 0 (0.0%) | 0 (0.0%) |
| 12:00 PM to 3:59 PM | 25 (9.4%) | 41 (13.3%) |
| 4:00 PM to 11:59 PM | 14 (5.2%) | 20 (6.5%) |
| Total | 267 (100.0%) | 308 (100.0%) |
Housing Occupancy in Sparta
Occupancy by Ownership in Sparta
Of the total 801 dwellings in Sparta, owner-occupied units account for 497 (62.1%), while renter-occupied units make up 304 (38.0%).
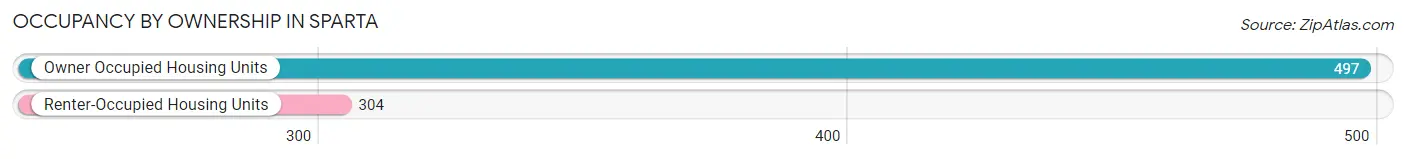
| Occupancy | # Housing Units | % Housing Units |
| Owner Occupied Housing Units | 497 | 62.1% |
| Renter-Occupied Housing Units | 304 | 38.0% |
| Total Occupied Housing Units | 801 | 100.0% |
Occupancy by Household Size in Sparta
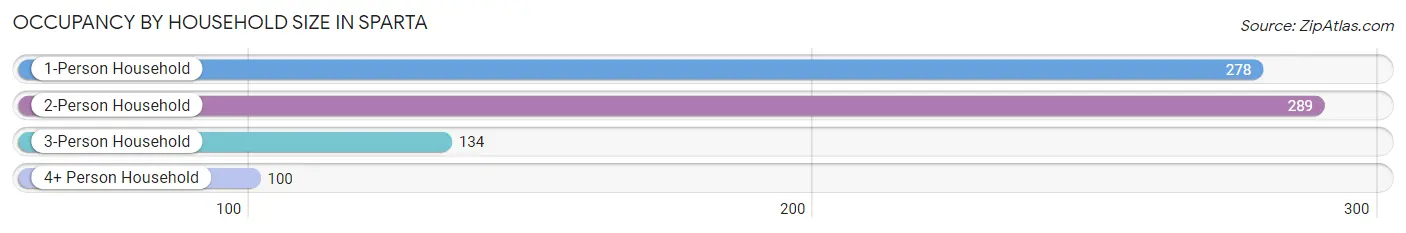
| Household Size | # Housing Units | % Housing Units |
| 1-Person Household | 278 | 34.7% |
| 2-Person Household | 289 | 36.1% |
| 3-Person Household | 134 | 16.7% |
| 4+ Person Household | 100 | 12.5% |
| Total Housing Units | 801 | 100.0% |
Occupancy by Ownership by Household Size in Sparta
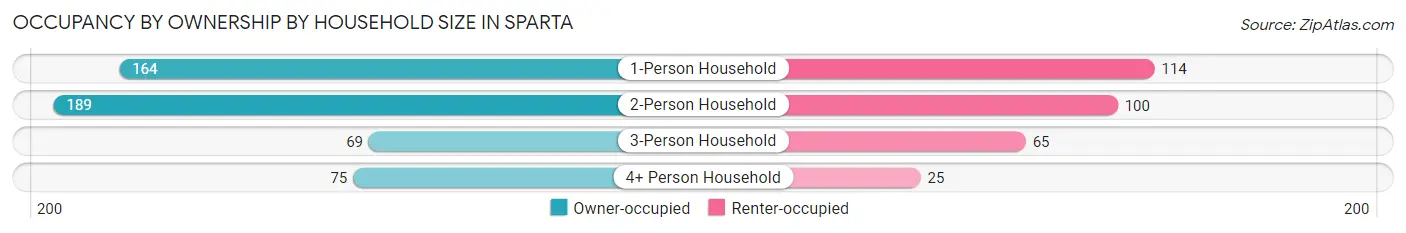
| Household Size | Owner-occupied | Renter-occupied |
| 1-Person Household | 164 (59.0%) | 114 (41.0%) |
| 2-Person Household | 189 (65.4%) | 100 (34.6%) |
| 3-Person Household | 69 (51.5%) | 65 (48.5%) |
| 4+ Person Household | 75 (75.0%) | 25 (25.0%) |
| Total Housing Units | 497 (62.1%) | 304 (38.0%) |
Occupancy by Educational Attainment in Sparta
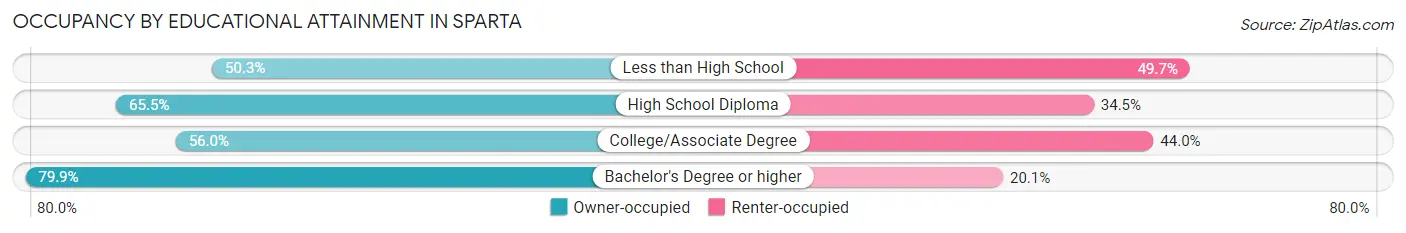
| Household Size | Owner-occupied | Renter-occupied |
| Less than High School | 94 (50.3%) | 93 (49.7%) |
| High School Diploma | 146 (65.5%) | 77 (34.5%) |
| College/Associate Degree | 130 (56.0%) | 102 (44.0%) |
| Bachelor's Degree or higher | 127 (79.9%) | 32 (20.1%) |
Occupancy by Age of Householder in Sparta
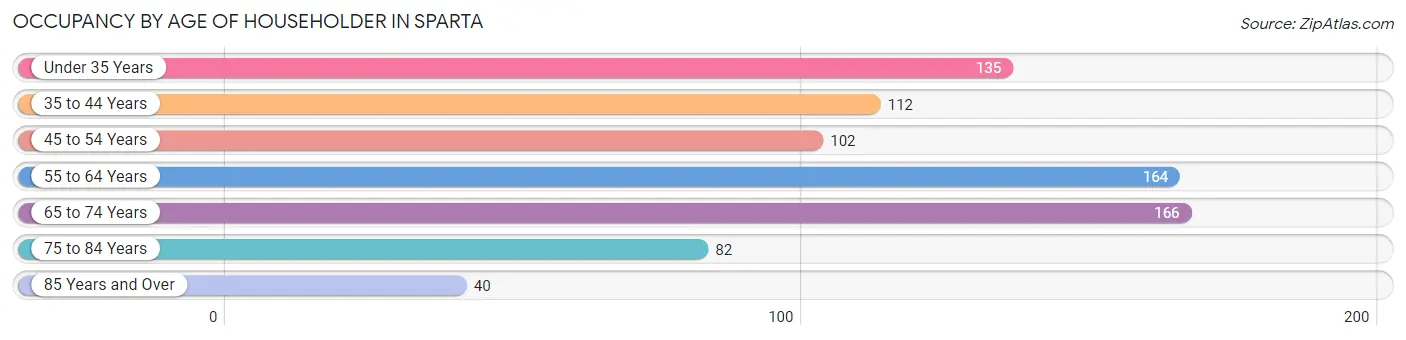
| Age Bracket | # Households | % Households |
| Under 35 Years | 135 | 16.9% |
| 35 to 44 Years | 112 | 14.0% |
| 45 to 54 Years | 102 | 12.7% |
| 55 to 64 Years | 164 | 20.5% |
| 65 to 74 Years | 166 | 20.7% |
| 75 to 84 Years | 82 | 10.2% |
| 85 Years and Over | 40 | 5.0% |
| Total | 801 | 100.0% |
Housing Finances in Sparta
Median Income by Occupancy in Sparta
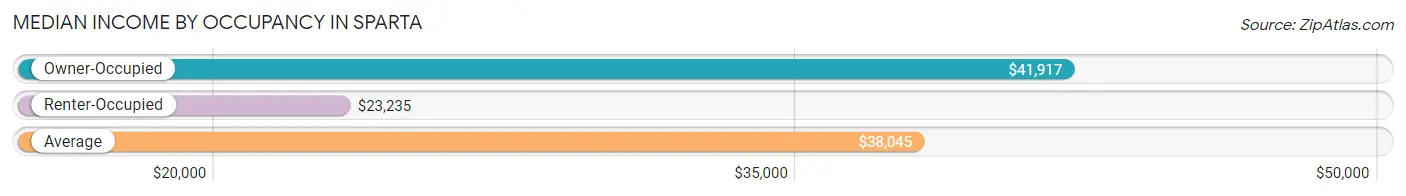
| Occupancy Type | # Households | Median Income |
| Owner-Occupied | 497 (62.1%) | $41,917 |
| Renter-Occupied | 304 (38.0%) | $23,235 |
| Average | 801 (100.0%) | $38,045 |
Occupancy by Householder Income Bracket in Sparta
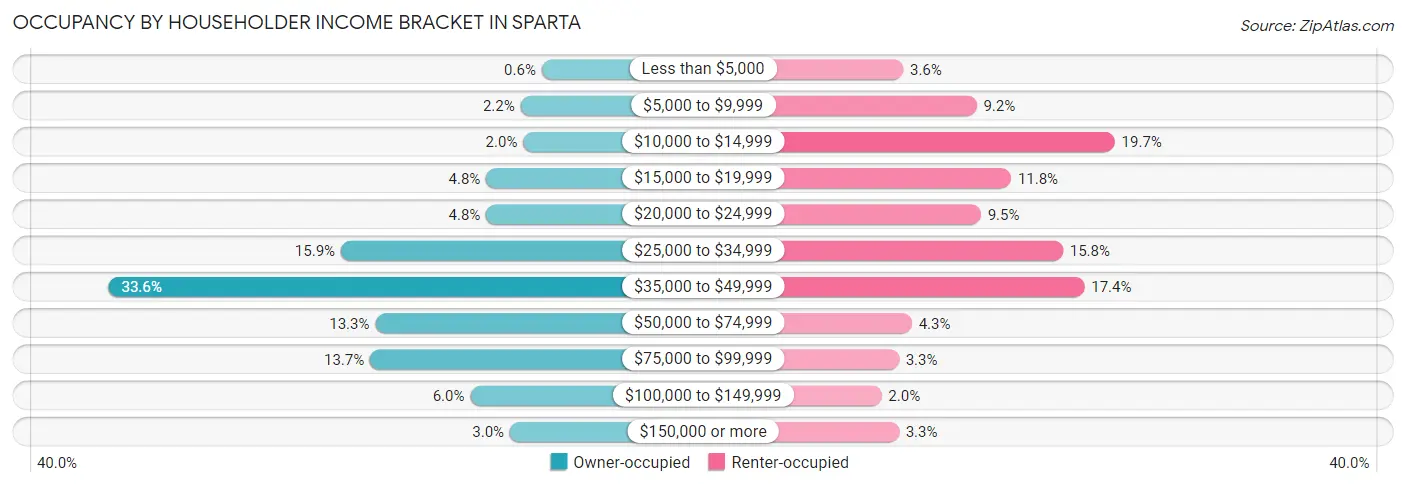
| Income Bracket | Owner-occupied | Renter-occupied |
| Less than $5,000 | 3 (0.6%) | 11 (3.6%) |
| $5,000 to $9,999 | 11 (2.2%) | 28 (9.2%) |
| $10,000 to $14,999 | 10 (2.0%) | 60 (19.7%) |
| $15,000 to $19,999 | 24 (4.8%) | 36 (11.8%) |
| $20,000 to $24,999 | 24 (4.8%) | 29 (9.5%) |
| $25,000 to $34,999 | 79 (15.9%) | 48 (15.8%) |
| $35,000 to $49,999 | 167 (33.6%) | 53 (17.4%) |
| $50,000 to $74,999 | 66 (13.3%) | 13 (4.3%) |
| $75,000 to $99,999 | 68 (13.7%) | 10 (3.3%) |
| $100,000 to $149,999 | 30 (6.0%) | 6 (2.0%) |
| $150,000 or more | 15 (3.0%) | 10 (3.3%) |
| Total | 497 (100.0%) | 304 (100.0%) |
Monthly Housing Cost Tiers in Sparta
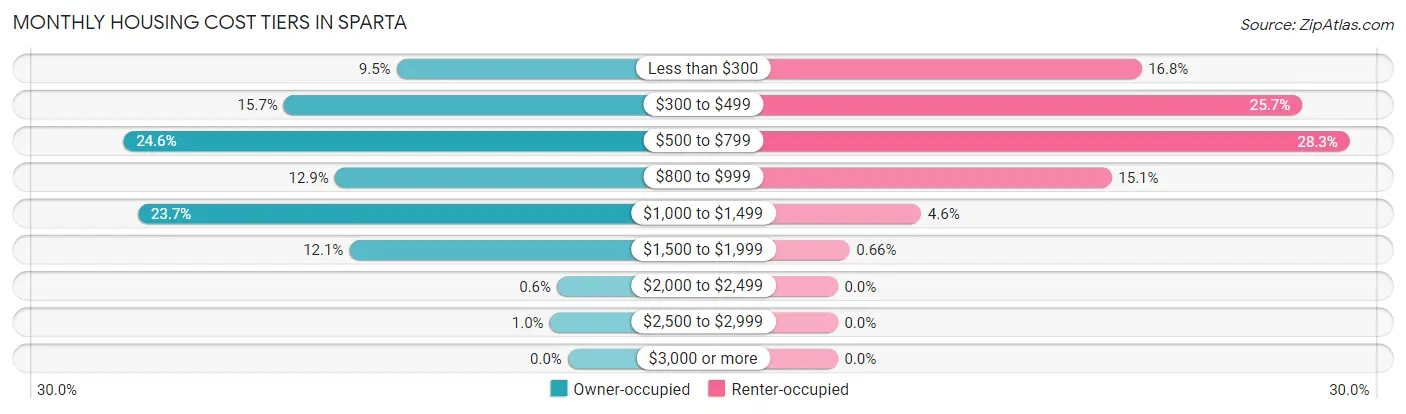
| Monthly Cost | Owner-occupied | Renter-occupied |
| Less than $300 | 47 (9.5%) | 51 (16.8%) |
| $300 to $499 | 78 (15.7%) | 78 (25.7%) |
| $500 to $799 | 122 (24.5%) | 86 (28.3%) |
| $800 to $999 | 64 (12.9%) | 46 (15.1%) |
| $1,000 to $1,499 | 118 (23.7%) | 14 (4.6%) |
| $1,500 to $1,999 | 60 (12.1%) | 2 (0.7%) |
| $2,000 to $2,499 | 3 (0.6%) | 0 (0.0%) |
| $2,500 to $2,999 | 5 (1.0%) | 0 (0.0%) |
| $3,000 or more | 0 (0.0%) | 0 (0.0%) |
| Total | 497 (100.0%) | 304 (100.0%) |
Physical Housing Characteristics in Sparta
Housing Structures in Sparta
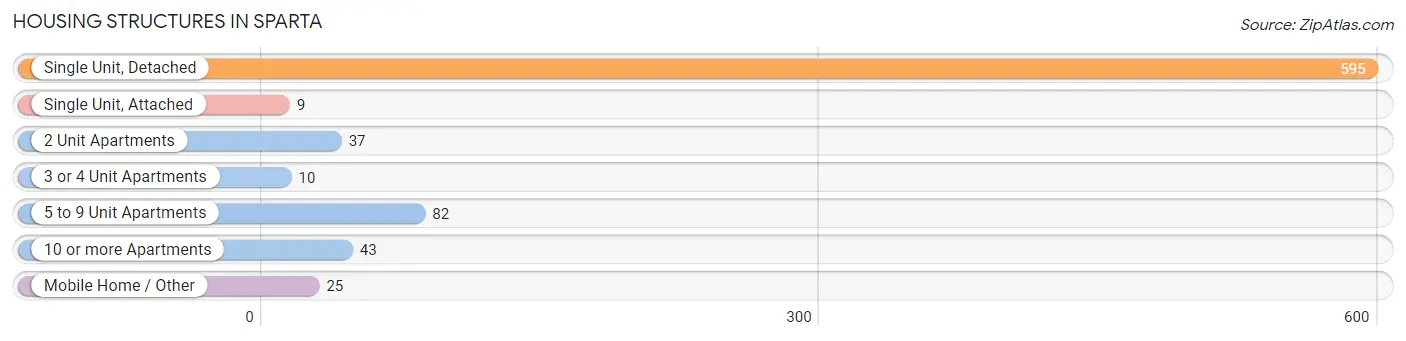
| Structure Type | # Housing Units | % Housing Units |
| Single Unit, Detached | 595 | 74.3% |
| Single Unit, Attached | 9 | 1.1% |
| 2 Unit Apartments | 37 | 4.6% |
| 3 or 4 Unit Apartments | 10 | 1.3% |
| 5 to 9 Unit Apartments | 82 | 10.2% |
| 10 or more Apartments | 43 | 5.4% |
| Mobile Home / Other | 25 | 3.1% |
| Total | 801 | 100.0% |
Housing Structures by Occupancy in Sparta
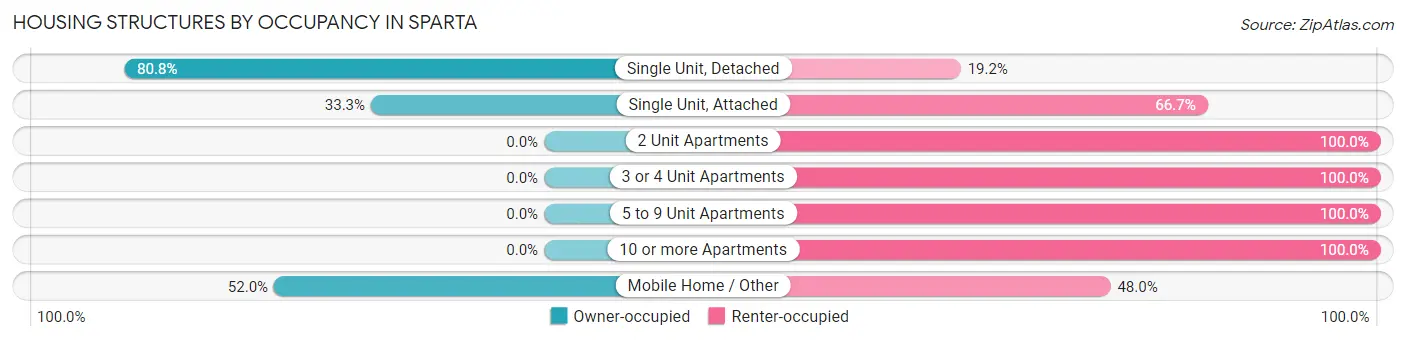
| Structure Type | Owner-occupied | Renter-occupied |
| Single Unit, Detached | 481 (80.8%) | 114 (19.2%) |
| Single Unit, Attached | 3 (33.3%) | 6 (66.7%) |
| 2 Unit Apartments | 0 (0.0%) | 37 (100.0%) |
| 3 or 4 Unit Apartments | 0 (0.0%) | 10 (100.0%) |
| 5 to 9 Unit Apartments | 0 (0.0%) | 82 (100.0%) |
| 10 or more Apartments | 0 (0.0%) | 43 (100.0%) |
| Mobile Home / Other | 13 (52.0%) | 12 (48.0%) |
| Total | 497 (62.1%) | 304 (38.0%) |
Housing Structures by Number of Rooms in Sparta
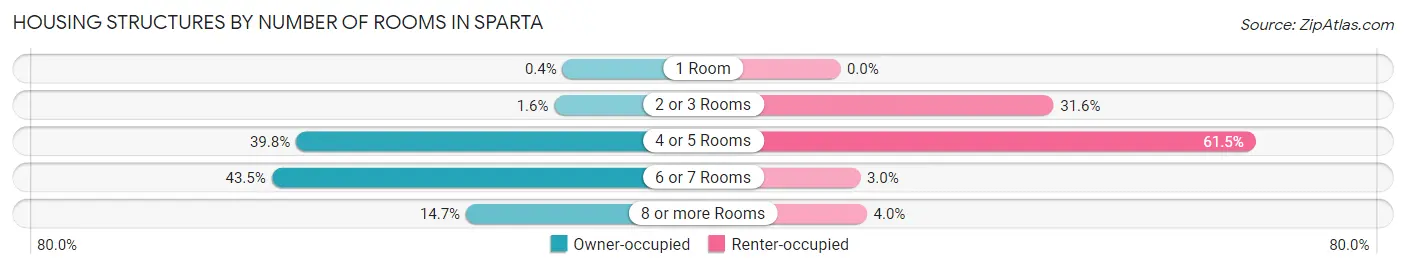
| Number of Rooms | Owner-occupied | Renter-occupied |
| 1 Room | 2 (0.4%) | 0 (0.0%) |
| 2 or 3 Rooms | 8 (1.6%) | 96 (31.6%) |
| 4 or 5 Rooms | 198 (39.8%) | 187 (61.5%) |
| 6 or 7 Rooms | 216 (43.5%) | 9 (3.0%) |
| 8 or more Rooms | 73 (14.7%) | 12 (4.0%) |
| Total | 497 (100.0%) | 304 (100.0%) |
Housing Structure by Heating Type in Sparta
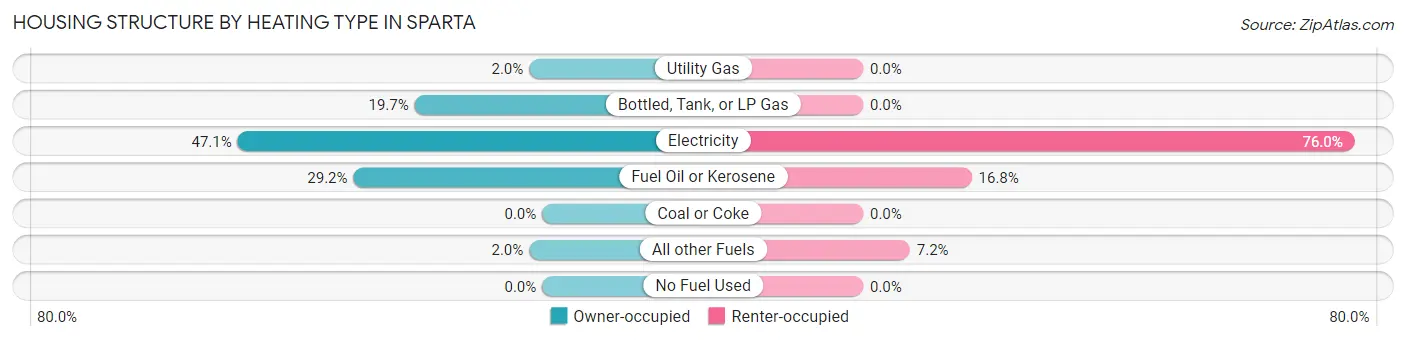
| Heating Type | Owner-occupied | Renter-occupied |
| Utility Gas | 10 (2.0%) | 0 (0.0%) |
| Bottled, Tank, or LP Gas | 98 (19.7%) | 0 (0.0%) |
| Electricity | 234 (47.1%) | 231 (76.0%) |
| Fuel Oil or Kerosene | 145 (29.2%) | 51 (16.8%) |
| Coal or Coke | 0 (0.0%) | 0 (0.0%) |
| All other Fuels | 10 (2.0%) | 22 (7.2%) |
| No Fuel Used | 0 (0.0%) | 0 (0.0%) |
| Total | 497 (100.0%) | 304 (100.0%) |
Household Vehicle Usage in Sparta
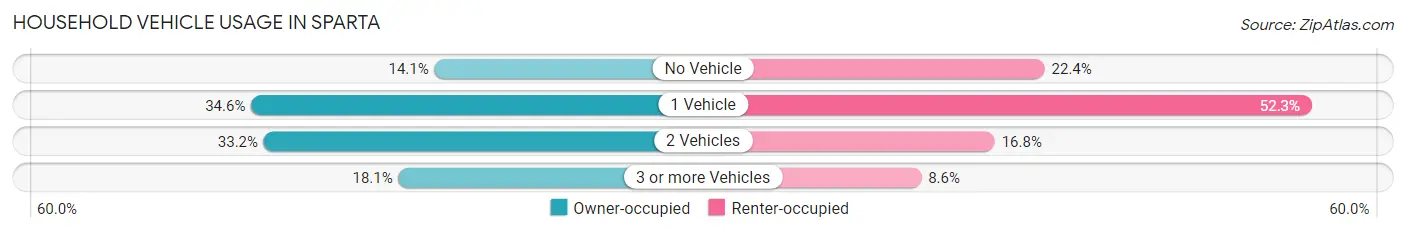
| Vehicles per Household | Owner-occupied | Renter-occupied |
| No Vehicle | 70 (14.1%) | 68 (22.4%) |
| 1 Vehicle | 172 (34.6%) | 159 (52.3%) |
| 2 Vehicles | 165 (33.2%) | 51 (16.8%) |
| 3 or more Vehicles | 90 (18.1%) | 26 (8.6%) |
| Total | 497 (100.0%) | 304 (100.0%) |
Real Estate & Mortgages in Sparta
Real Estate and Mortgage Overview in Sparta
| Characteristic | Without Mortgage | With Mortgage |
| Housing Units | 205 | 292 |
| Median Property Value | $161,100 | $169,200 |
| Median Household Income | $38,875 | $3 |
| Monthly Housing Costs | $468 | $0 |
| Real Estate Taxes | $1,384 | $0 |
Property Value by Mortgage Status in Sparta
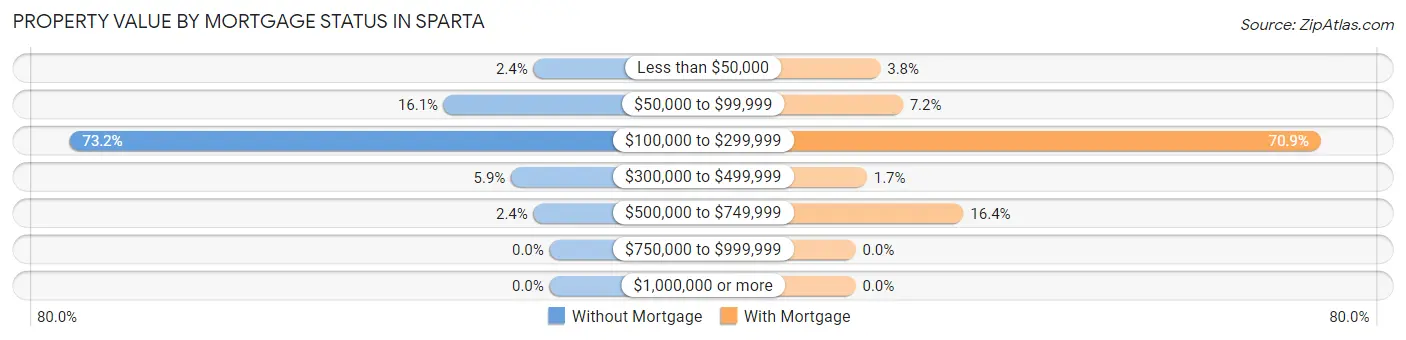
| Property Value | Without Mortgage | With Mortgage |
| Less than $50,000 | 5 (2.4%) | 11 (3.8%) |
| $50,000 to $99,999 | 33 (16.1%) | 21 (7.2%) |
| $100,000 to $299,999 | 150 (73.2%) | 207 (70.9%) |
| $300,000 to $499,999 | 12 (5.9%) | 5 (1.7%) |
| $500,000 to $749,999 | 5 (2.4%) | 48 (16.4%) |
| $750,000 to $999,999 | 0 (0.0%) | 0 (0.0%) |
| $1,000,000 or more | 0 (0.0%) | 0 (0.0%) |
| Total | 205 (100.0%) | 292 (100.0%) |
Household Income by Mortgage Status in Sparta
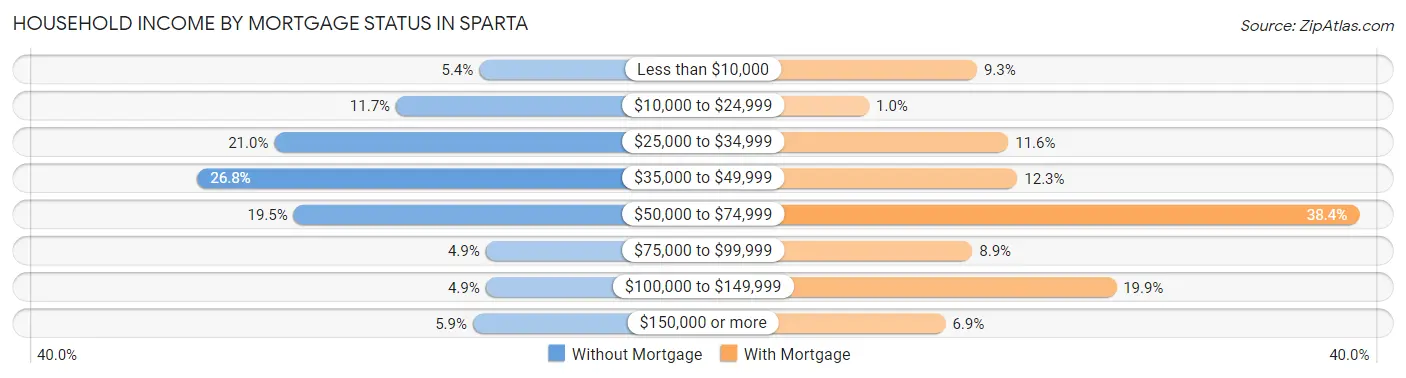
| Household Income | Without Mortgage | With Mortgage |
| Less than $10,000 | 11 (5.4%) | 27 (9.2%) |
| $10,000 to $24,999 | 24 (11.7%) | 3 (1.0%) |
| $25,000 to $34,999 | 43 (21.0%) | 34 (11.6%) |
| $35,000 to $49,999 | 55 (26.8%) | 36 (12.3%) |
| $50,000 to $74,999 | 40 (19.5%) | 112 (38.4%) |
| $75,000 to $99,999 | 10 (4.9%) | 26 (8.9%) |
| $100,000 to $149,999 | 10 (4.9%) | 58 (19.9%) |
| $150,000 or more | 12 (5.9%) | 20 (6.9%) |
| Total | 205 (100.0%) | 292 (100.0%) |
Property Value to Household Income Ratio in Sparta
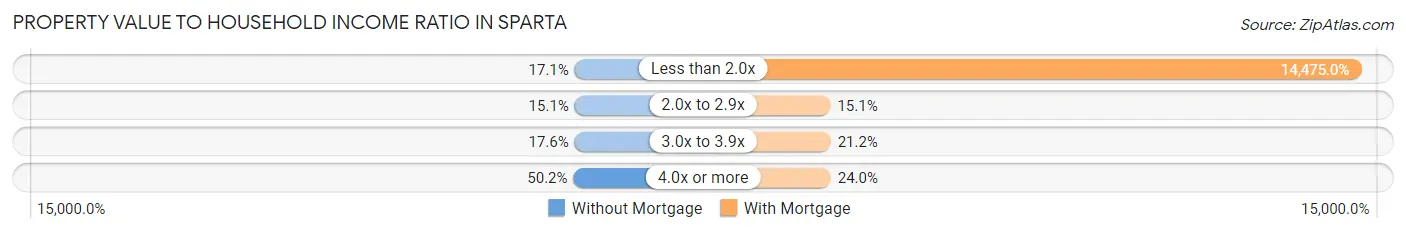
| Value-to-Income Ratio | Without Mortgage | With Mortgage |
| Less than 2.0x | 35 (17.1%) | 42,267 (14,475.0%) |
| 2.0x to 2.9x | 31 (15.1%) | 44 (15.1%) |
| 3.0x to 3.9x | 36 (17.6%) | 62 (21.2%) |
| 4.0x or more | 103 (50.2%) | 70 (24.0%) |
| Total | 205 (100.0%) | 292 (100.0%) |
Real Estate Taxes by Mortgage Status in Sparta
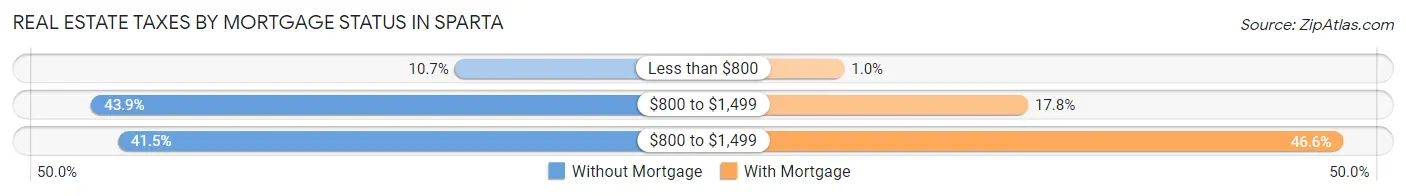
| Property Taxes | Without Mortgage | With Mortgage |
| Less than $800 | 22 (10.7%) | 3 (1.0%) |
| $800 to $1,499 | 90 (43.9%) | 52 (17.8%) |
| $800 to $1,499 | 85 (41.5%) | 136 (46.6%) |
| Total | 205 (100.0%) | 292 (100.0%) |
Health & Disability in Sparta
Health Insurance Coverage by Age in Sparta
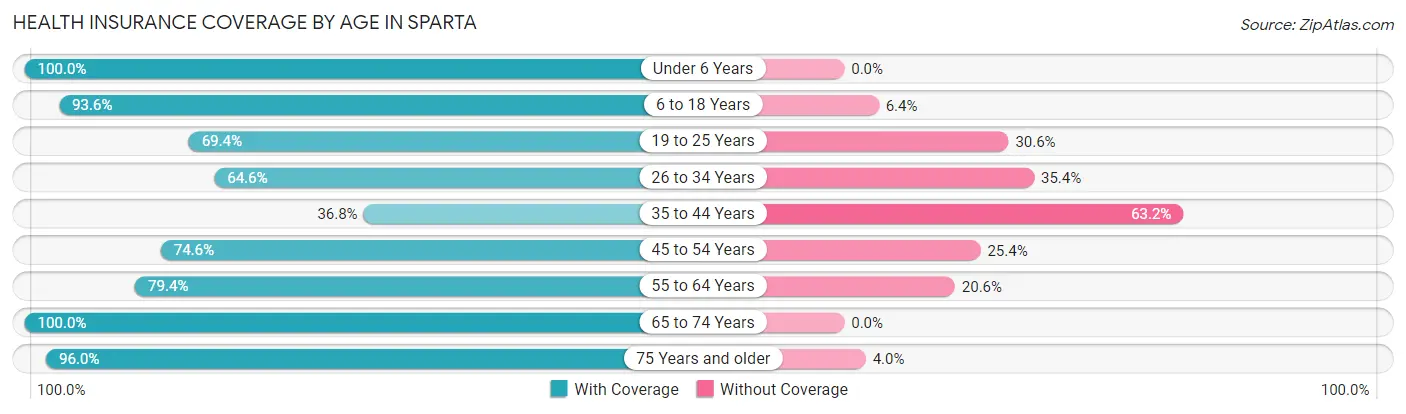
| Age Bracket | With Coverage | Without Coverage |
| Under 6 Years | 68 (100.0%) | 0 (0.0%) |
| 6 to 18 Years | 248 (93.6%) | 17 (6.4%) |
| 19 to 25 Years | 102 (69.4%) | 45 (30.6%) |
| 26 to 34 Years | 137 (64.6%) | 75 (35.4%) |
| 35 to 44 Years | 60 (36.8%) | 103 (63.2%) |
| 45 to 54 Years | 141 (74.6%) | 48 (25.4%) |
| 55 to 64 Years | 204 (79.4%) | 53 (20.6%) |
| 65 to 74 Years | 210 (100.0%) | 0 (0.0%) |
| 75 Years and older | 168 (96.0%) | 7 (4.0%) |
| Total | 1,338 (79.4%) | 348 (20.6%) |
Health Insurance Coverage by Citizenship Status in Sparta
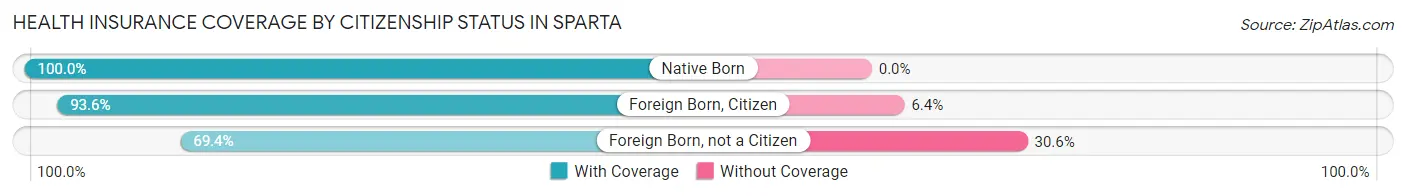
| Citizenship Status | With Coverage | Without Coverage |
| Native Born | 68 (100.0%) | 0 (0.0%) |
| Foreign Born, Citizen | 248 (93.6%) | 17 (6.4%) |
| Foreign Born, not a Citizen | 102 (69.4%) | 45 (30.6%) |
Health Insurance Coverage by Household Income in Sparta
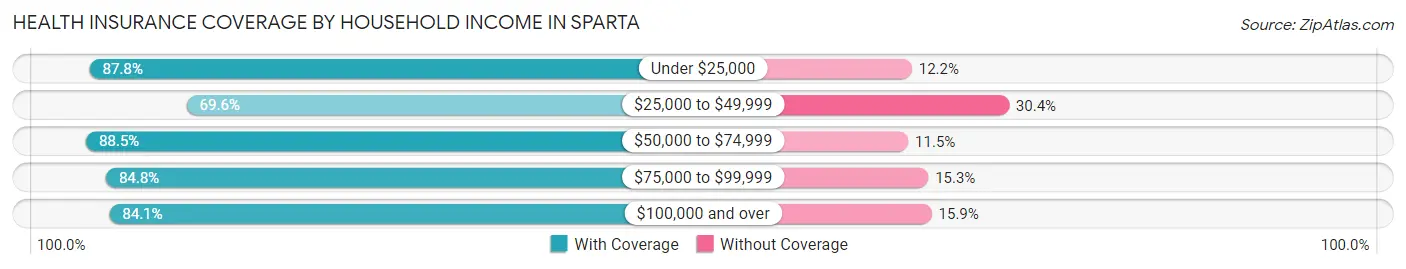
| Household Income | With Coverage | Without Coverage |
| Under $25,000 | 375 (87.8%) | 52 (12.2%) |
| $25,000 to $49,999 | 509 (69.6%) | 222 (30.4%) |
| $50,000 to $74,999 | 177 (88.5%) | 23 (11.5%) |
| $75,000 to $99,999 | 150 (84.8%) | 27 (15.2%) |
| $100,000 and over | 127 (84.1%) | 24 (15.9%) |
Public vs Private Health Insurance Coverage by Age in Sparta
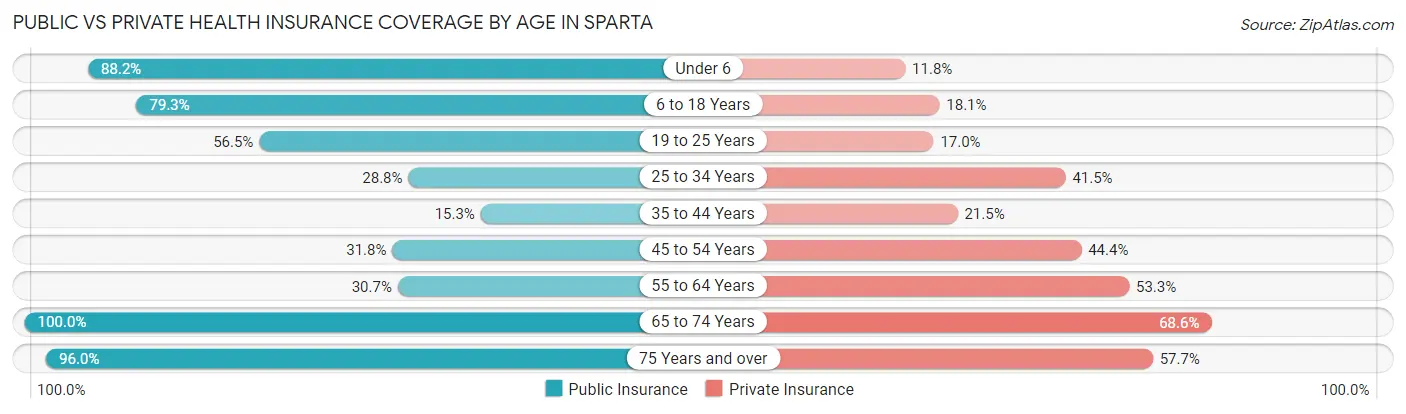
| Age Bracket | Public Insurance | Private Insurance |
| Under 6 | 60 (88.2%) | 8 (11.8%) |
| 6 to 18 Years | 210 (79.2%) | 48 (18.1%) |
| 19 to 25 Years | 83 (56.5%) | 25 (17.0%) |
| 25 to 34 Years | 61 (28.8%) | 88 (41.5%) |
| 35 to 44 Years | 25 (15.3%) | 35 (21.5%) |
| 45 to 54 Years | 60 (31.8%) | 84 (44.4%) |
| 55 to 64 Years | 79 (30.7%) | 137 (53.3%) |
| 65 to 74 Years | 210 (100.0%) | 144 (68.6%) |
| 75 Years and over | 168 (96.0%) | 101 (57.7%) |
| Total | 956 (56.7%) | 670 (39.7%) |
Disability Status by Sex by Age in Sparta
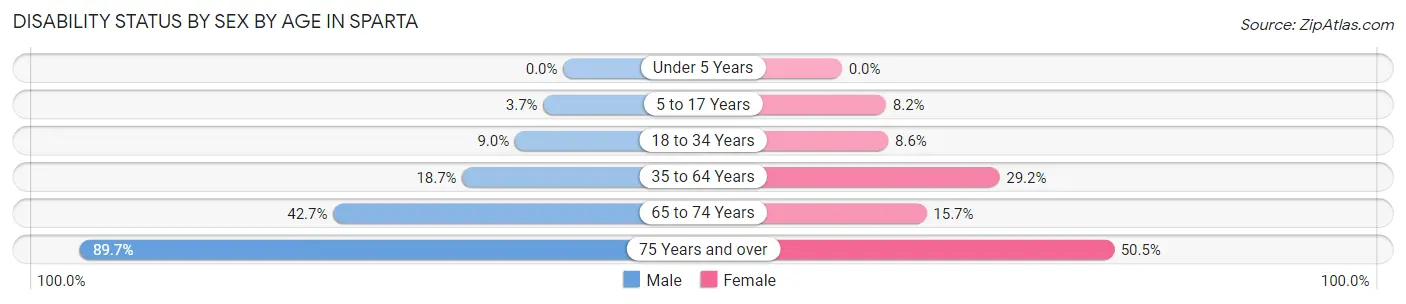
| Age Bracket | Male | Female |
| Under 5 Years | 0 (0.0%) | 0 (0.0%) |
| 5 to 17 Years | 5 (3.7%) | 9 (8.2%) |
| 18 to 34 Years | 18 (9.0%) | 16 (8.6%) |
| 35 to 64 Years | 50 (18.7%) | 100 (29.2%) |
| 65 to 74 Years | 38 (42.7%) | 19 (15.7%) |
| 75 Years and over | 61 (89.7%) | 54 (50.5%) |
Disability Class by Sex by Age in Sparta
Disability Class: Hearing Difficulty
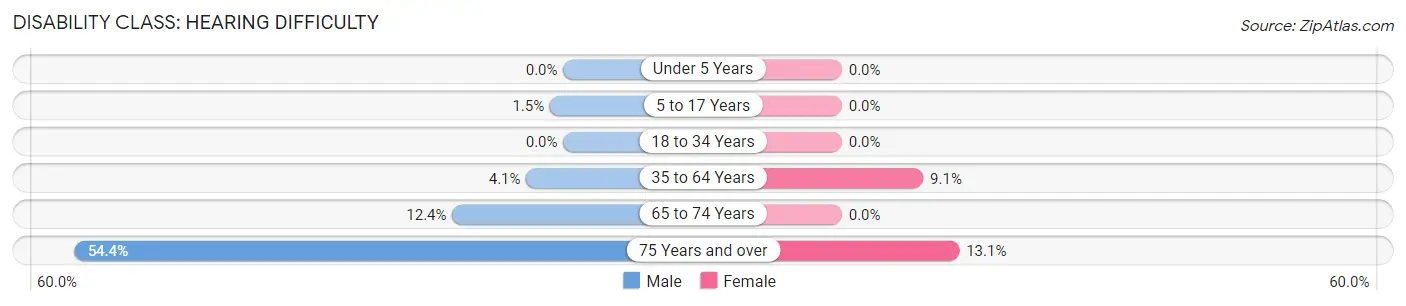
| Age Bracket | Male | Female |
| Under 5 Years | 0 (0.0%) | 0 (0.0%) |
| 5 to 17 Years | 2 (1.5%) | 0 (0.0%) |
| 18 to 34 Years | 0 (0.0%) | 0 (0.0%) |
| 35 to 64 Years | 11 (4.1%) | 31 (9.1%) |
| 65 to 74 Years | 11 (12.4%) | 0 (0.0%) |
| 75 Years and over | 37 (54.4%) | 14 (13.1%) |
Disability Class: Vision Difficulty
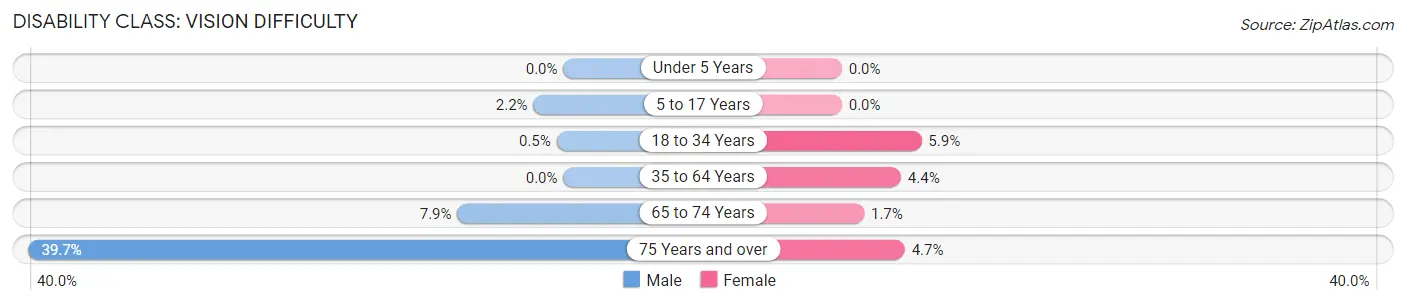
| Age Bracket | Male | Female |
| Under 5 Years | 0 (0.0%) | 0 (0.0%) |
| 5 to 17 Years | 3 (2.2%) | 0 (0.0%) |
| 18 to 34 Years | 1 (0.5%) | 11 (5.9%) |
| 35 to 64 Years | 0 (0.0%) | 15 (4.4%) |
| 65 to 74 Years | 7 (7.9%) | 2 (1.7%) |
| 75 Years and over | 27 (39.7%) | 5 (4.7%) |
Disability Class: Cognitive Difficulty
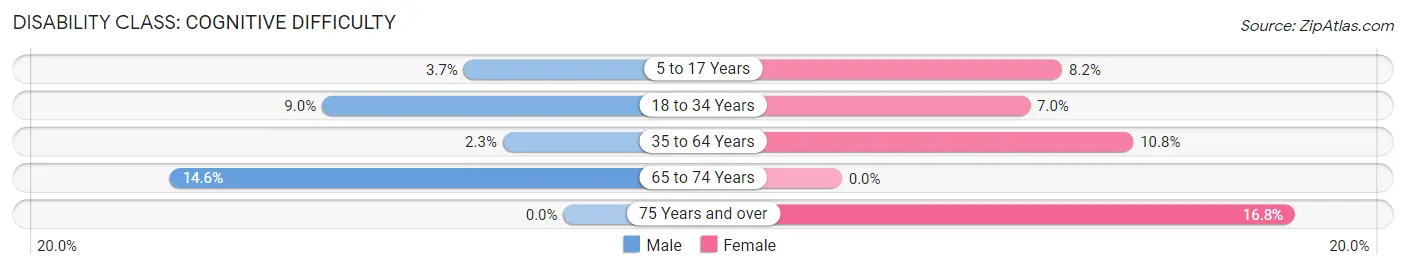
| Age Bracket | Male | Female |
| 5 to 17 Years | 5 (3.7%) | 9 (8.2%) |
| 18 to 34 Years | 18 (9.0%) | 13 (7.0%) |
| 35 to 64 Years | 6 (2.2%) | 37 (10.8%) |
| 65 to 74 Years | 13 (14.6%) | 0 (0.0%) |
| 75 Years and over | 0 (0.0%) | 18 (16.8%) |
Disability Class: Ambulatory Difficulty
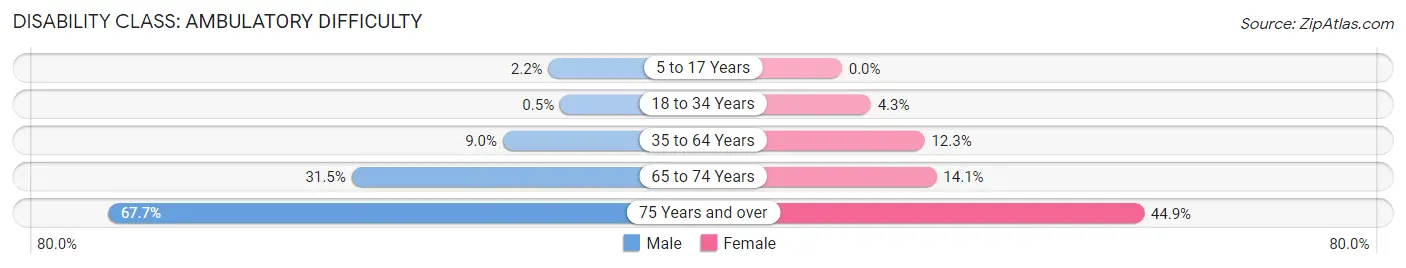
| Age Bracket | Male | Female |
| 5 to 17 Years | 3 (2.2%) | 0 (0.0%) |
| 18 to 34 Years | 1 (0.5%) | 8 (4.3%) |
| 35 to 64 Years | 24 (9.0%) | 42 (12.3%) |
| 65 to 74 Years | 28 (31.5%) | 17 (14.1%) |
| 75 Years and over | 46 (67.6%) | 48 (44.9%) |
Disability Class: Self-Care Difficulty
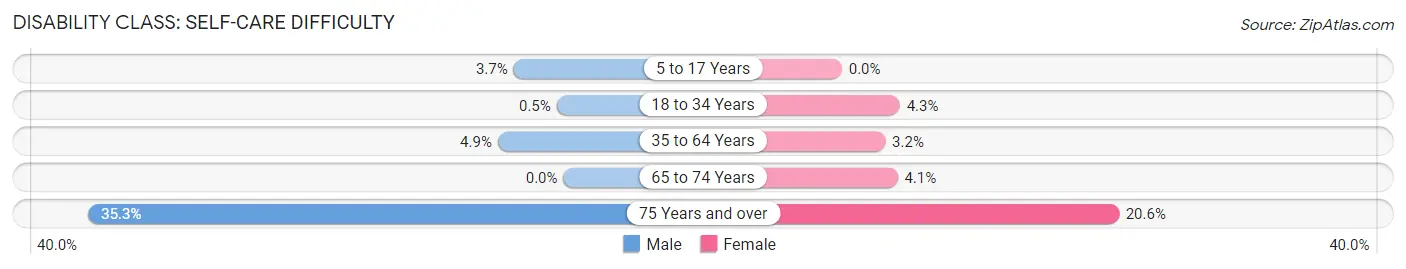
| Age Bracket | Male | Female |
| 5 to 17 Years | 5 (3.7%) | 0 (0.0%) |
| 18 to 34 Years | 1 (0.5%) | 8 (4.3%) |
| 35 to 64 Years | 13 (4.9%) | 11 (3.2%) |
| 65 to 74 Years | 0 (0.0%) | 5 (4.1%) |
| 75 Years and over | 24 (35.3%) | 22 (20.6%) |
Technology Access in Sparta
Computing Device Access in Sparta
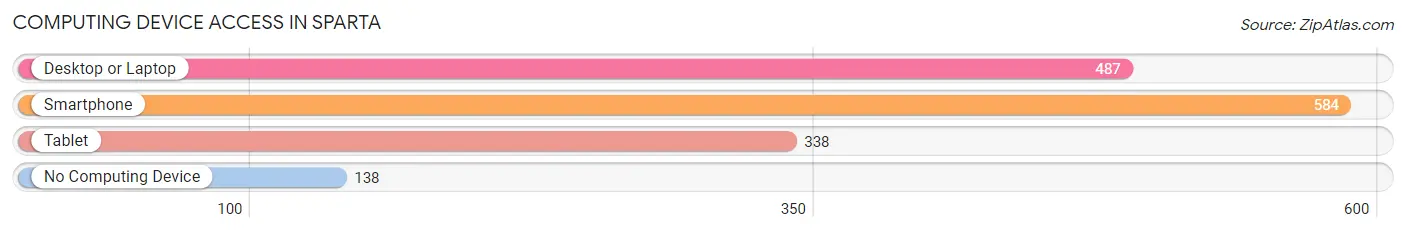
| Device Type | # Households | % Households |
| Desktop or Laptop | 487 | 60.8% |
| Smartphone | 584 | 72.9% |
| Tablet | 338 | 42.2% |
| No Computing Device | 138 | 17.2% |
| Total | 801 | 100.0% |
Internet Access in Sparta
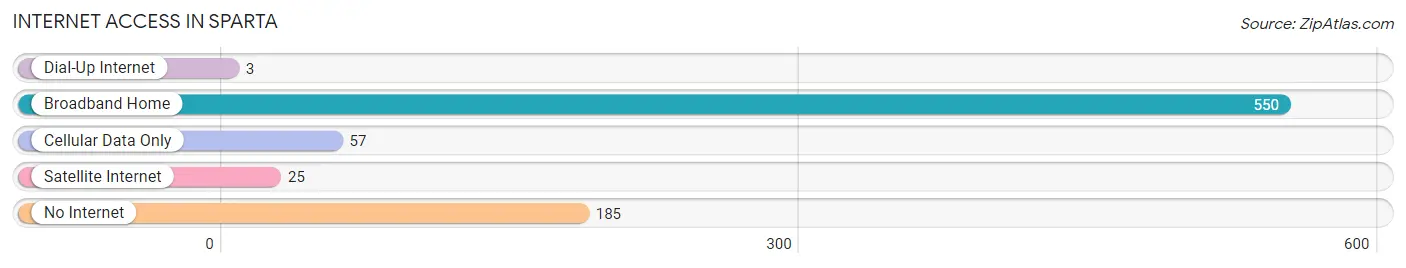
| Internet Type | # Households | % Households |
| Dial-Up Internet | 3 | 0.4% |
| Broadband Home | 550 | 68.7% |
| Cellular Data Only | 57 | 7.1% |
| Satellite Internet | 25 | 3.1% |
| No Internet | 185 | 23.1% |
| Total | 801 | 100.0% |
Sparta Summary
Sparta is a small town located in Alleghany County, North Carolina. It is situated in the foothills of the Blue Ridge Mountains, and is part of the Blue Ridge National Heritage Area. The town has a population of approximately 2,000 people, and is the county seat of Alleghany County.
Geography
Sparta is located in the foothills of the Blue Ridge Mountains, and is part of the Blue Ridge National Heritage Area. The town is situated at an elevation of 1,400 feet, and is surrounded by the Blue Ridge Mountains to the east, the Brushy Mountains to the west, and the Appalachian Mountains to the south. The town is located along the banks of the New River, and is approximately 30 miles from the Virginia border.
Economy
Sparta’s economy is largely based on agriculture and tourism. The town is home to several farms, including a dairy farm, a beef cattle farm, and a poultry farm. The town also has several small businesses, including a grocery store, a hardware store, and a restaurant. Tourism is also an important part of the local economy, with visitors coming to the area to enjoy the natural beauty of the Blue Ridge Mountains.
Demographics
As of the 2010 census, the population of Sparta was 2,000 people. The racial makeup of the town was 95.2% White, 2.2% African American, 0.4% Native American, 0.2% Asian, 0.2% from other races, and 1.9% from two or more races. Hispanic or Latino of any race were 1.2% of the population.
The median income for a household in Sparta was $30,000, and the median income for a family was $35,000. The per capita income for the town was $17,000. About 17.2% of families and 19.2% of the population were below the poverty line, including 25.2% of those under age 18 and 11.2% of those age 65 or over.
History
Sparta was founded in 1790 by settlers from Virginia and North Carolina. The town was named after the ancient Greek city-state of Sparta, and was originally known as “Sparta Town”. The town was incorporated in 1831, and was the county seat of Alleghany County.
In the late 19th century, Sparta was a major center for the production of furniture and textiles. The town was also home to several mills, including a cotton mill, a woolen mill, and a paper mill. The town’s economy declined in the early 20th century, and many of the mills closed.
Today, Sparta is a small town with a population of approximately 2,000 people. The town is home to several small businesses, and is a popular tourist destination due to its proximity to the Blue Ridge Mountains.
Common Questions
What is Per Capita Income in Sparta?
Per Capita income in Sparta is $21,537.
What is the Median Family Income in Sparta?
Median Family Income in Sparta is $41,304.
What is the Median Household income in Sparta?
Median Household Income in Sparta is $38,045.
What is Income or Wage Gap in Sparta?
Income or Wage Gap in Sparta is 26.3%.
Women in Sparta earn 73.7 cents for every dollar earned by a man.
What is Inequality or Gini Index in Sparta?
Inequality or Gini Index in Sparta is 0.40.
What is the Total Population of Sparta?
Total Population of Sparta is 1,795.
What is the Total Male Population of Sparta?
Total Male Population of Sparta is 858.
What is the Total Female Population of Sparta?
Total Female Population of Sparta is 937.
What is the Ratio of Males per 100 Females in Sparta?
There are 91.57 Males per 100 Females in Sparta.
What is the Ratio of Females per 100 Males in Sparta?
There are 109.21 Females per 100 Males in Sparta.
What is the Median Population Age in Sparta?
Median Population Age in Sparta is 47.4 Years.
What is the Average Family Size in Sparta
Average Family Size in Sparta is 2.6 People.
What is the Average Household Size in Sparta
Average Household Size in Sparta is 2.1 People.
How Large is the Labor Force in Sparta?
There are 716 People in the Labor Forcein in Sparta.
What is the Percentage of People in the Labor Force in Sparta?
46.4% of People are in the Labor Force in Sparta.
What is the Unemployment Rate in Sparta?
Unemployment Rate in Sparta is 4.5%.