West Dennis, MA Map & Demographics
West Dennis Map
West Dennis Overview
$57,302
PER CAPITA INCOME
$140,606
AVG FAMILY INCOME
$82,955
AVG HOUSEHOLD INCOME
49.3%
WAGE / INCOME GAP [ % ]
50.7¢/ $1
WAGE / INCOME GAP [ $ ]
0.48
INEQUALITY / GINI INDEX
2,732
TOTAL POPULATION
1,273
MALE POPULATION
1,459
FEMALE POPULATION
87.25
MALES / 100 FEMALES
114.61
FEMALES / 100 MALES
57.3
MEDIAN AGE
2.8
AVG FAMILY SIZE
2.1
AVG HOUSEHOLD SIZE
1,491
LABOR FORCE [ PEOPLE ]
58.5%
PERCENT IN LABOR FORCE
1.7%
UNEMPLOYMENT RATE
West Dennis Zip Codes
West Dennis Area Codes
Income in West Dennis
Income Overview in West Dennis
Per Capita Income in West Dennis is $57,302, while median incomes of families and households are $140,606 and $82,955 respectively.
| Characteristic | Number | Measure |
| Per Capita Income | 2,732 | $57,302 |
| Median Family Income | 750 | $140,606 |
| Mean Family Income | 750 | $160,283 |
| Median Household Income | 1,304 | $82,955 |
| Mean Household Income | 1,304 | $116,790 |
| Income Deficit | 750 | $0 |
| Wage / Income Gap (%) | 2,732 | 49.25% |
| Wage / Income Gap ($) | 2,732 | 50.75¢ per $1 |
| Gini / Inequality Index | 2,732 | 0.48 |
Earnings by Sex in West Dennis
Average Earnings in West Dennis are $41,432, $52,355 for men and $26,568 for women, a difference of 49.2%.
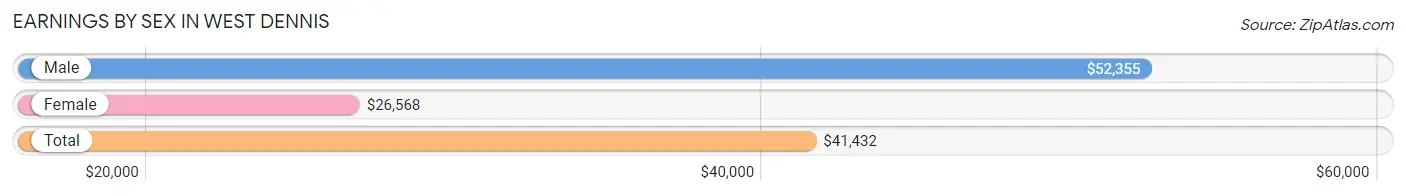
| Sex | Number | Average Earnings |
| Male | 807 (50.2%) | $52,355 |
| Female | 800 (49.8%) | $26,568 |
| Total | 1,607 (100.0%) | $41,432 |
Earnings by Sex by Income Bracket in West Dennis
The most common earnings brackets in West Dennis are $75,000 to $99,999 for men (164 | 20.3%) and $25,000 to $29,999 for women (205 | 25.6%).
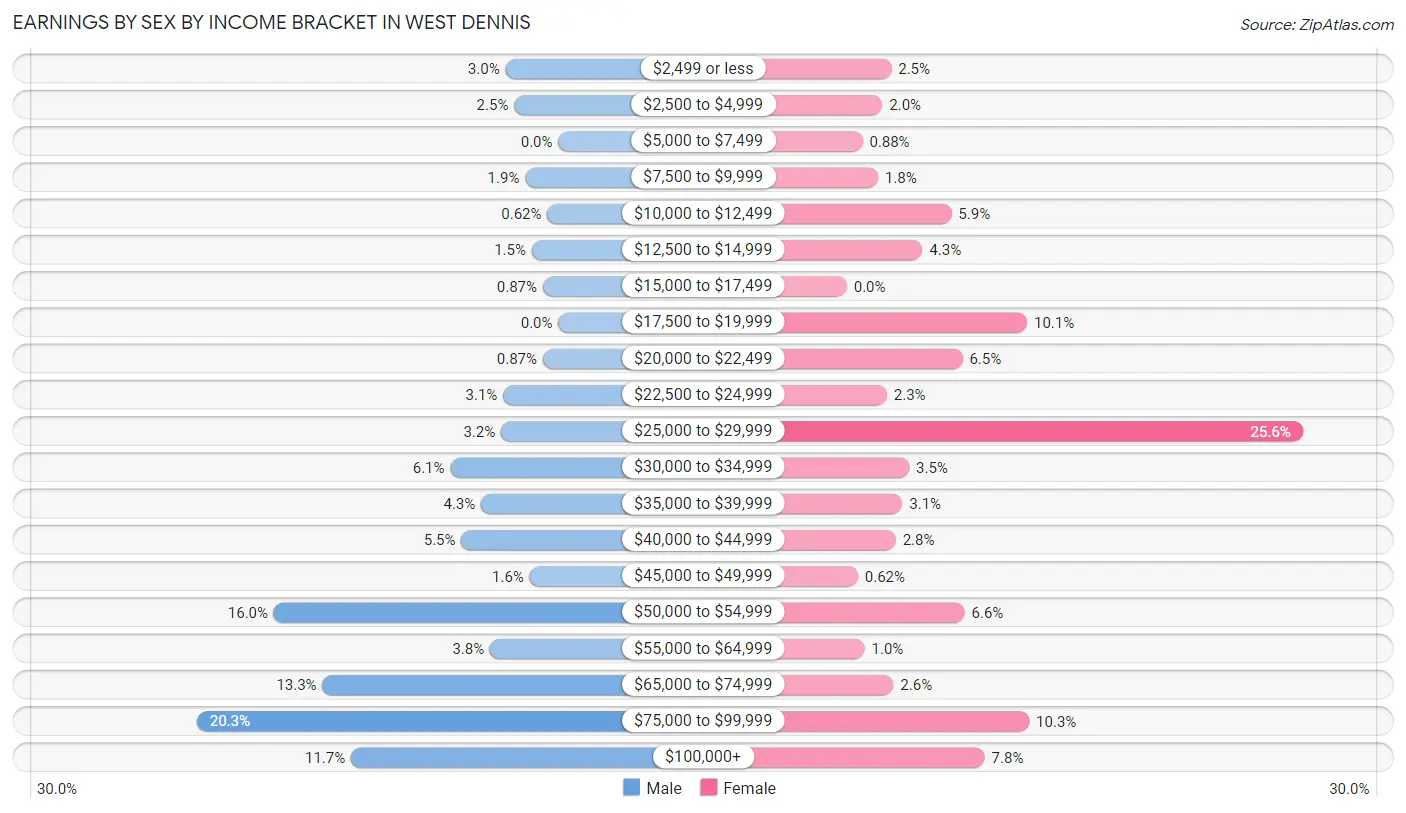
| Income | Male | Female |
| $2,499 or less | 24 (3.0%) | 20 (2.5%) |
| $2,500 to $4,999 | 20 (2.5%) | 16 (2.0%) |
| $5,000 to $7,499 | 0 (0.0%) | 7 (0.9%) |
| $7,500 to $9,999 | 15 (1.9%) | 14 (1.8%) |
| $10,000 to $12,499 | 5 (0.6%) | 47 (5.9%) |
| $12,500 to $14,999 | 12 (1.5%) | 34 (4.3%) |
| $15,000 to $17,499 | 7 (0.9%) | 0 (0.0%) |
| $17,500 to $19,999 | 0 (0.0%) | 81 (10.1%) |
| $20,000 to $22,499 | 7 (0.9%) | 52 (6.5%) |
| $22,500 to $24,999 | 25 (3.1%) | 18 (2.2%) |
| $25,000 to $29,999 | 26 (3.2%) | 205 (25.6%) |
| $30,000 to $34,999 | 49 (6.1%) | 28 (3.5%) |
| $35,000 to $39,999 | 35 (4.3%) | 25 (3.1%) |
| $40,000 to $44,999 | 44 (5.4%) | 22 (2.8%) |
| $45,000 to $49,999 | 13 (1.6%) | 5 (0.6%) |
| $50,000 to $54,999 | 129 (16.0%) | 53 (6.6%) |
| $55,000 to $64,999 | 31 (3.8%) | 8 (1.0%) |
| $65,000 to $74,999 | 107 (13.3%) | 21 (2.6%) |
| $75,000 to $99,999 | 164 (20.3%) | 82 (10.2%) |
| $100,000+ | 94 (11.7%) | 62 (7.7%) |
| Total | 807 (100.0%) | 800 (100.0%) |
Earnings by Sex by Educational Attainment in West Dennis
Average earnings in West Dennis are $51,744 for men and $29,821 for women, a difference of 42.4%. Men with an educational attainment of graduate degree enjoy the highest average annual earnings of $68,750, while those with college or associate's degree education earn the least with $31,061. Women with an educational attainment of bachelor's degree earn the most with the average annual earnings of $33,375, while those with high school diploma education have the smallest earnings of $25,000.
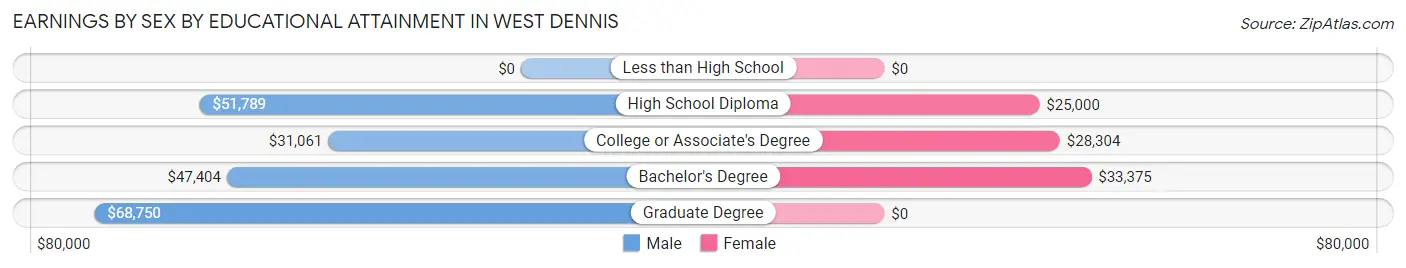
| Educational Attainment | Male Income | Female Income |
| Less than High School | - | - |
| High School Diploma | $51,789 | $25,000 |
| College or Associate's Degree | $31,061 | $28,304 |
| Bachelor's Degree | $47,404 | $33,375 |
| Graduate Degree | $68,750 | $0 |
| Total | $51,744 | $29,821 |
Family Income in West Dennis
Family Income Brackets in West Dennis
According to the West Dennis family income data, there are 206 families falling into the $150,000 to $199,999 income range, which is the most common income bracket and makes up 27.5% of all families.
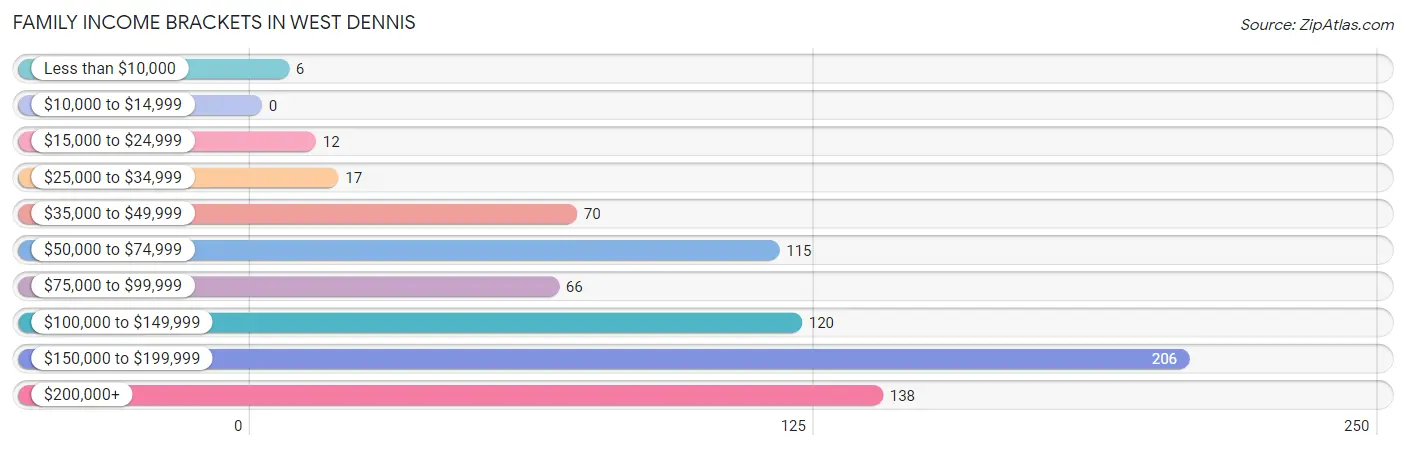
| Income Bracket | # Families | % Families |
| Less than $10,000 | 6 | 0.8% |
| $10,000 to $14,999 | 0 | 0.0% |
| $15,000 to $24,999 | 12 | 1.6% |
| $25,000 to $34,999 | 17 | 2.3% |
| $35,000 to $49,999 | 70 | 9.3% |
| $50,000 to $74,999 | 115 | 15.3% |
| $75,000 to $99,999 | 66 | 8.8% |
| $100,000 to $149,999 | 120 | 16.0% |
| $150,000 to $199,999 | 206 | 27.5% |
| $200,000+ | 138 | 18.4% |
Family Income by Famaliy Size in West Dennis
3-person families (57 | 7.6%) account for the highest median family income in West Dennis with $128,250 per family, while 2-person families (539 | 71.9%) have the highest median income of $51,620 per family member.
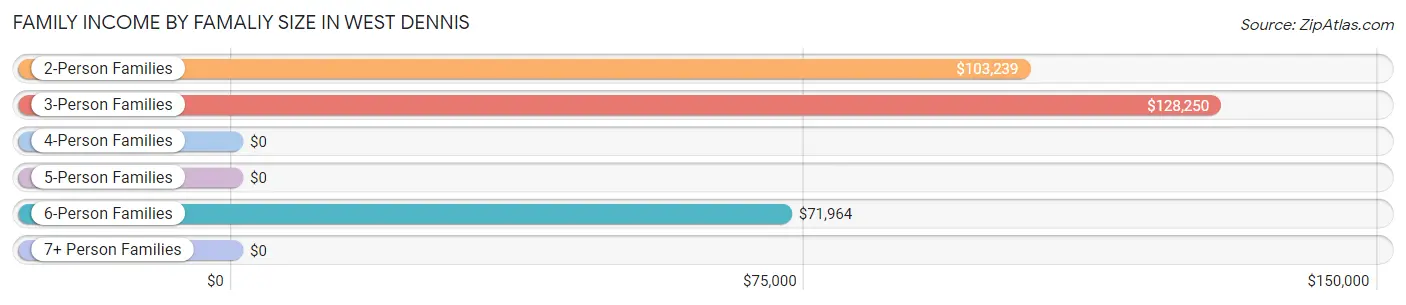
| Income Bracket | # Families | Median Income |
| 2-Person Families | 539 (71.9%) | $103,239 |
| 3-Person Families | 57 (7.6%) | $128,250 |
| 4-Person Families | 31 (4.1%) | $0 |
| 5-Person Families | 101 (13.5%) | $0 |
| 6-Person Families | 22 (2.9%) | $71,964 |
| 7+ Person Families | 0 (0.0%) | $0 |
| Total | 750 (100.0%) | $140,606 |
Family Income by Number of Earners in West Dennis
The median family income in West Dennis is $140,606, with families comprising 3+ earners (166) having the highest median family income of $170,866, while families with no earners (181) have the lowest median family income of $64,196, accounting for 22.1% and 24.1% of families, respectively.
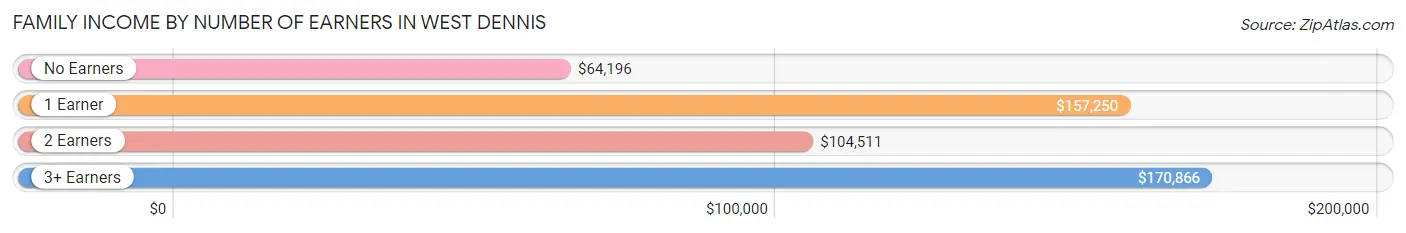
| Number of Earners | # Families | Median Income |
| No Earners | 181 (24.1%) | $64,196 |
| 1 Earner | 228 (30.4%) | $157,250 |
| 2 Earners | 175 (23.3%) | $104,511 |
| 3+ Earners | 166 (22.1%) | $170,866 |
| Total | 750 (100.0%) | $140,606 |
Household Income in West Dennis
Household Income Brackets in West Dennis
With 223 households falling in the category, the $150,000 to $199,999 income range is the most frequent in West Dennis, accounting for 17.1% of all households. In contrast, only 46 households (3.5%) fall into the less than $10,000 income bracket, making it the least populous group.
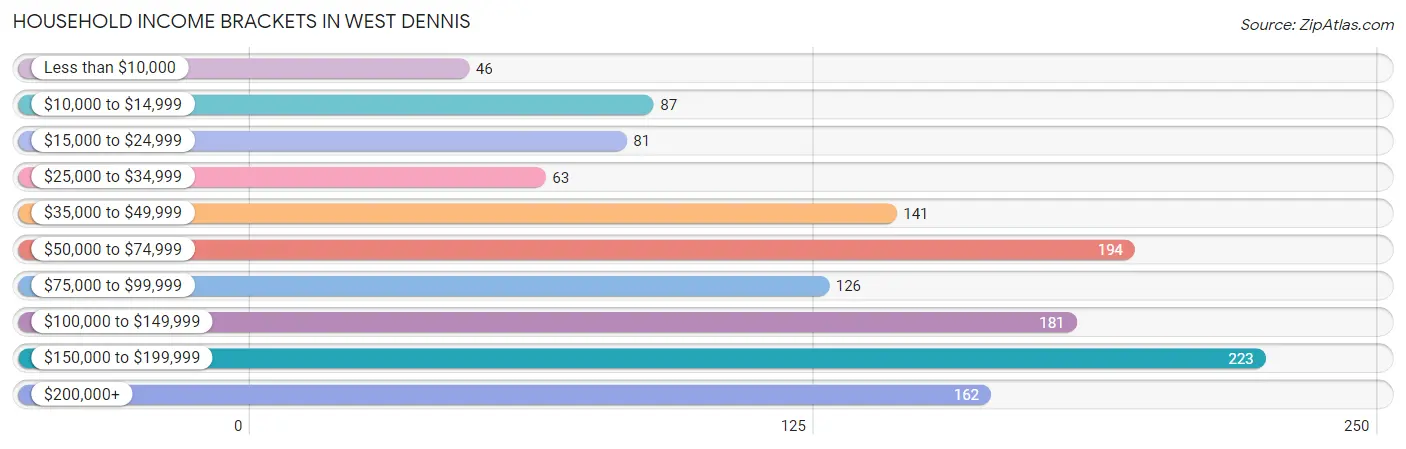
| Income Bracket | # Households | % Households |
| Less than $10,000 | 46 | 3.5% |
| $10,000 to $14,999 | 87 | 6.7% |
| $15,000 to $24,999 | 81 | 6.2% |
| $25,000 to $34,999 | 63 | 4.8% |
| $35,000 to $49,999 | 141 | 10.8% |
| $50,000 to $74,999 | 194 | 14.9% |
| $75,000 to $99,999 | 126 | 9.7% |
| $100,000 to $149,999 | 181 | 13.9% |
| $150,000 to $199,999 | 223 | 17.1% |
| $200,000+ | 162 | 12.4% |
Household Income by Householder Age in West Dennis
The median household income in West Dennis is $82,955, with the highest median household income of $83,409 found in the 45 to 64 years age bracket for the primary householder. A total of 464 households (35.6%) fall into this category. Meanwhile, the 15 to 24 years age bracket for the primary householder has the lowest median household income of $0, with 101 households (7.7%) in this group.
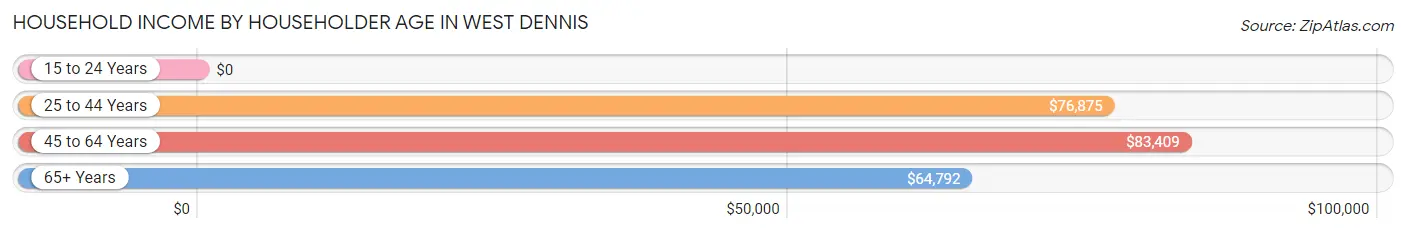
| Income Bracket | # Households | Median Income |
| 15 to 24 Years | 101 (7.7%) | $0 |
| 25 to 44 Years | 106 (8.1%) | $76,875 |
| 45 to 64 Years | 464 (35.6%) | $83,409 |
| 65+ Years | 633 (48.5%) | $64,792 |
| Total | 1,304 (100.0%) | $82,955 |
Poverty in West Dennis
Income Below Poverty by Sex and Age in West Dennis
With 8.0% poverty level for males and 5.6% for females among the residents of West Dennis, 35 to 44 year old males and 75 year old and over females are the most vulnerable to poverty, with 26 males (63.4%) and 26 females (13.1%) in their respective age groups living below the poverty level.
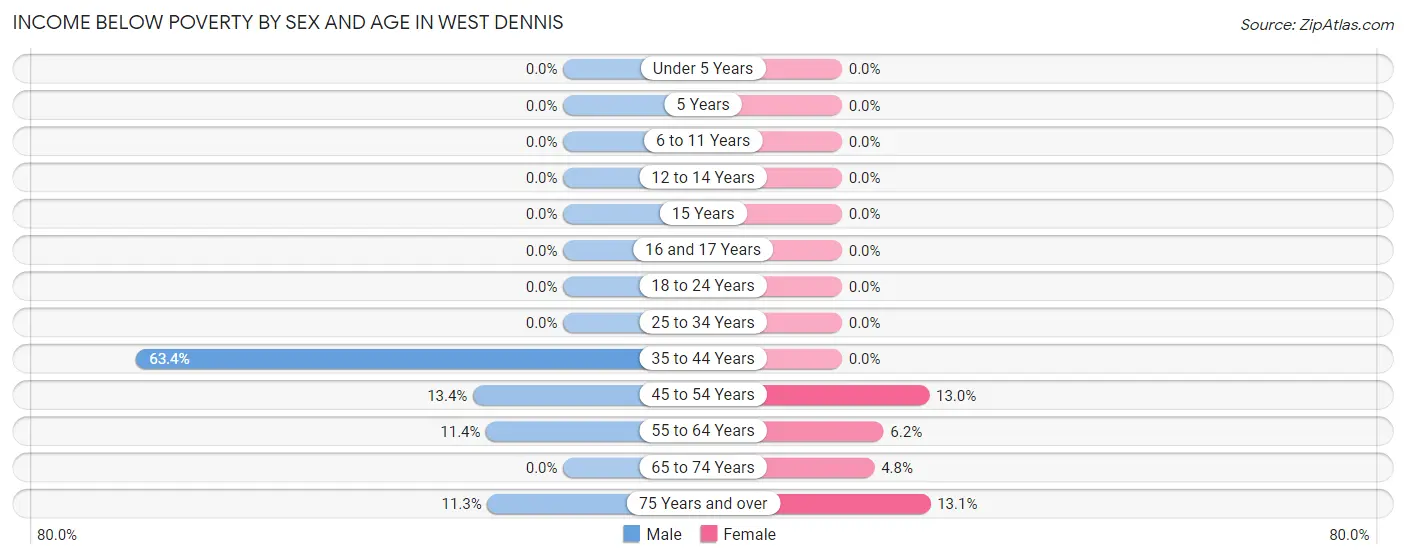
| Age Bracket | Male | Female |
| Under 5 Years | 0 (0.0%) | 0 (0.0%) |
| 5 Years | 0 (0.0%) | 0 (0.0%) |
| 6 to 11 Years | 0 (0.0%) | 0 (0.0%) |
| 12 to 14 Years | 0 (0.0%) | 0 (0.0%) |
| 15 Years | 0 (0.0%) | 0 (0.0%) |
| 16 and 17 Years | 0 (0.0%) | 0 (0.0%) |
| 18 to 24 Years | 0 (0.0%) | 0 (0.0%) |
| 25 to 34 Years | 0 (0.0%) | 0 (0.0%) |
| 35 to 44 Years | 26 (63.4%) | 0 (0.0%) |
| 45 to 54 Years | 34 (13.4%) | 21 (13.0%) |
| 55 to 64 Years | 24 (11.4%) | 17 (6.2%) |
| 65 to 74 Years | 0 (0.0%) | 17 (4.8%) |
| 75 Years and over | 18 (11.3%) | 26 (13.1%) |
| Total | 102 (8.0%) | 81 (5.6%) |
Income Above Poverty by Sex and Age in West Dennis
According to the poverty statistics in West Dennis, males aged under 5 years and females aged under 5 years are the age groups that are most secure financially, with 100.0% of males and 100.0% of females in these age groups living above the poverty line.
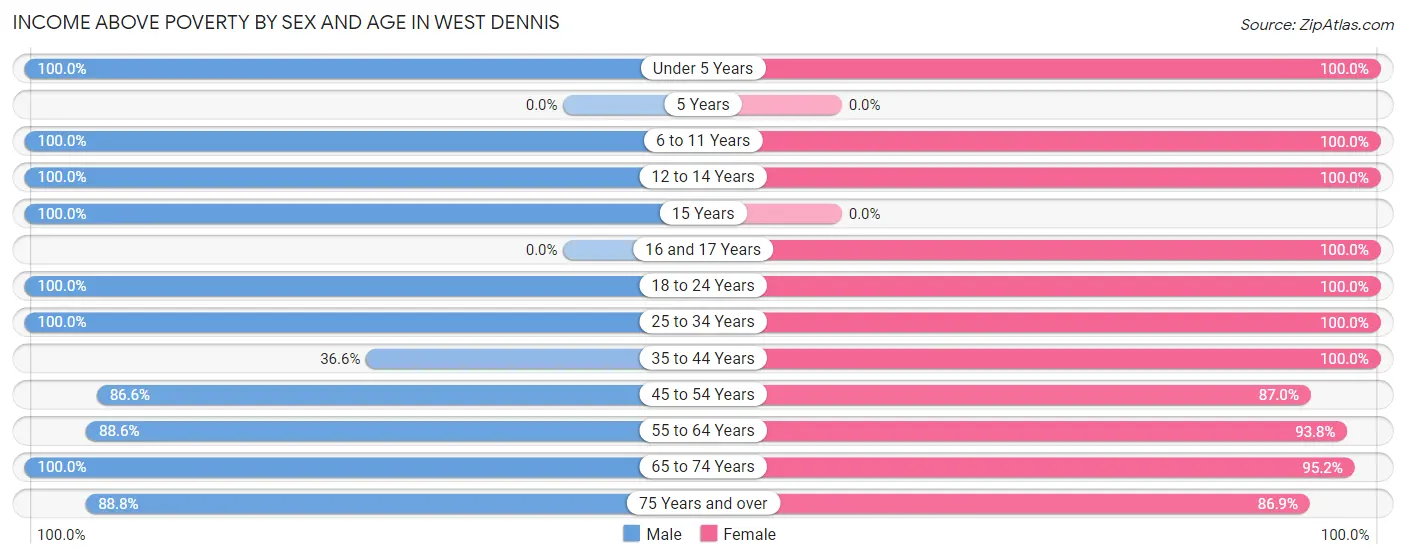
| Age Bracket | Male | Female |
| Under 5 Years | 4 (100.0%) | 13 (100.0%) |
| 5 Years | 0 (0.0%) | 0 (0.0%) |
| 6 to 11 Years | 13 (100.0%) | 25 (100.0%) |
| 12 to 14 Years | 4 (100.0%) | 30 (100.0%) |
| 15 Years | 94 (100.0%) | 0 (0.0%) |
| 16 and 17 Years | 0 (0.0%) | 24 (100.0%) |
| 18 to 24 Years | 139 (100.0%) | 235 (100.0%) |
| 25 to 34 Years | 89 (100.0%) | 14 (100.0%) |
| 35 to 44 Years | 15 (36.6%) | 130 (100.0%) |
| 45 to 54 Years | 220 (86.6%) | 141 (87.0%) |
| 55 to 64 Years | 186 (88.6%) | 258 (93.8%) |
| 65 to 74 Years | 265 (100.0%) | 336 (95.2%) |
| 75 Years and over | 142 (88.7%) | 172 (86.9%) |
| Total | 1,171 (92.0%) | 1,378 (94.5%) |
Income Below Poverty Among Married-Couple Families in West Dennis
The poverty statistics for married-couple families in West Dennis show that 1.9% or 10 of the total 512 families live below the poverty line. Families with no children have the highest poverty rate of 2.1%, comprising of 10 families. On the other hand, families with 1 or 2 children have the lowest poverty rate of 0.0%, which includes 0 families.
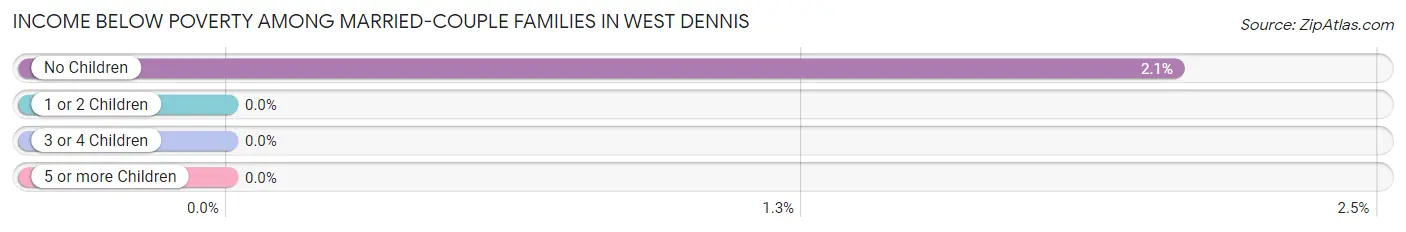
| Children | Above Poverty | Below Poverty |
| No Children | 475 (97.9%) | 10 (2.1%) |
| 1 or 2 Children | 9 (100.0%) | 0 (0.0%) |
| 3 or 4 Children | 18 (100.0%) | 0 (0.0%) |
| 5 or more Children | 0 (0.0%) | 0 (0.0%) |
| Total | 502 (98.1%) | 10 (1.9%) |
Income Below Poverty Among Single-Parent Households in West Dennis
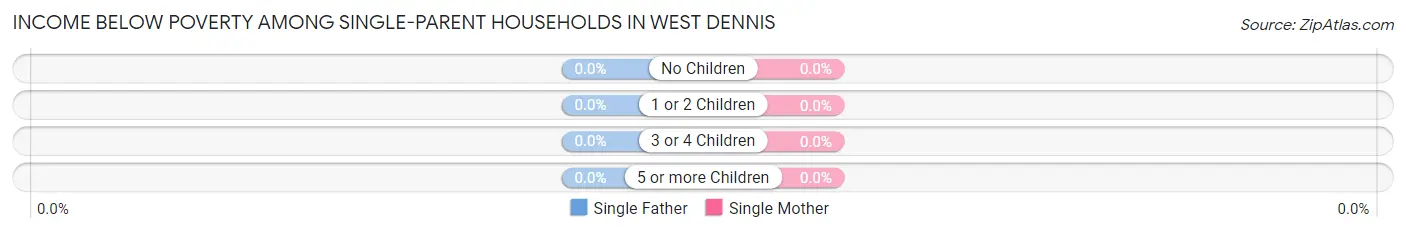
| Children | Single Father | Single Mother |
| No Children | 0 (0.0%) | 0 (0.0%) |
| 1 or 2 Children | 0 (0.0%) | 0 (0.0%) |
| 3 or 4 Children | 0 (0.0%) | 0 (0.0%) |
| 5 or more Children | 0 (0.0%) | 0 (0.0%) |
| Total | 0 (0.0%) | 0 (0.0%) |
Income Below Poverty Among Married-Couple vs Single-Parent Households in West Dennis
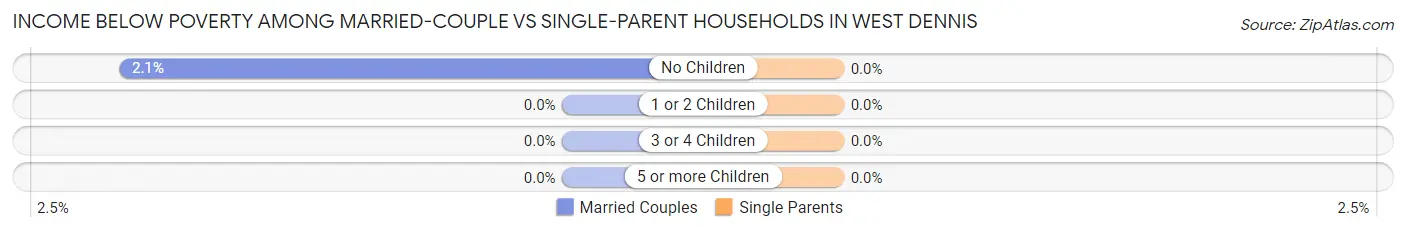
| Children | Married-Couple Families | Single-Parent Households |
| No Children | 10 (2.1%) | 0 (0.0%) |
| 1 or 2 Children | 0 (0.0%) | 0 (0.0%) |
| 3 or 4 Children | 0 (0.0%) | 0 (0.0%) |
| 5 or more Children | 0 (0.0%) | 0 (0.0%) |
| Total | 10 (1.9%) | 0 (0.0%) |
Race in West Dennis
The most populous races in West Dennis are White / Caucasian (2,140 | 78.3%), Hispanic or Latino (532 | 19.5%), and Two or more Races (521 | 19.1%).
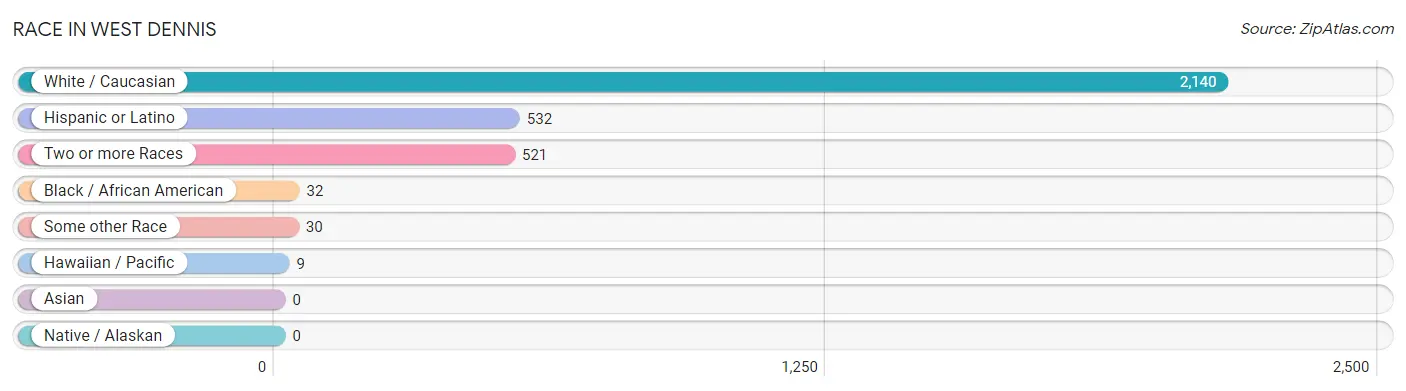
| Race | # Population | % Population |
| Asian | 0 | 0.0% |
| Black / African American | 32 | 1.2% |
| Hawaiian / Pacific | 9 | 0.3% |
| Hispanic or Latino | 532 | 19.5% |
| Native / Alaskan | 0 | 0.0% |
| White / Caucasian | 2,140 | 78.3% |
| Two or more Races | 521 | 19.1% |
| Some other Race | 30 | 1.1% |
| Total | 2,732 | 100.0% |
Ancestry in West Dennis
The most populous ancestries reported in West Dennis are Irish (716 | 26.2%), French (520 | 19.0%), Mexican (502 | 18.4%), English (415 | 15.2%), and German (298 | 10.9%), together accounting for 89.7% of all West Dennis residents.
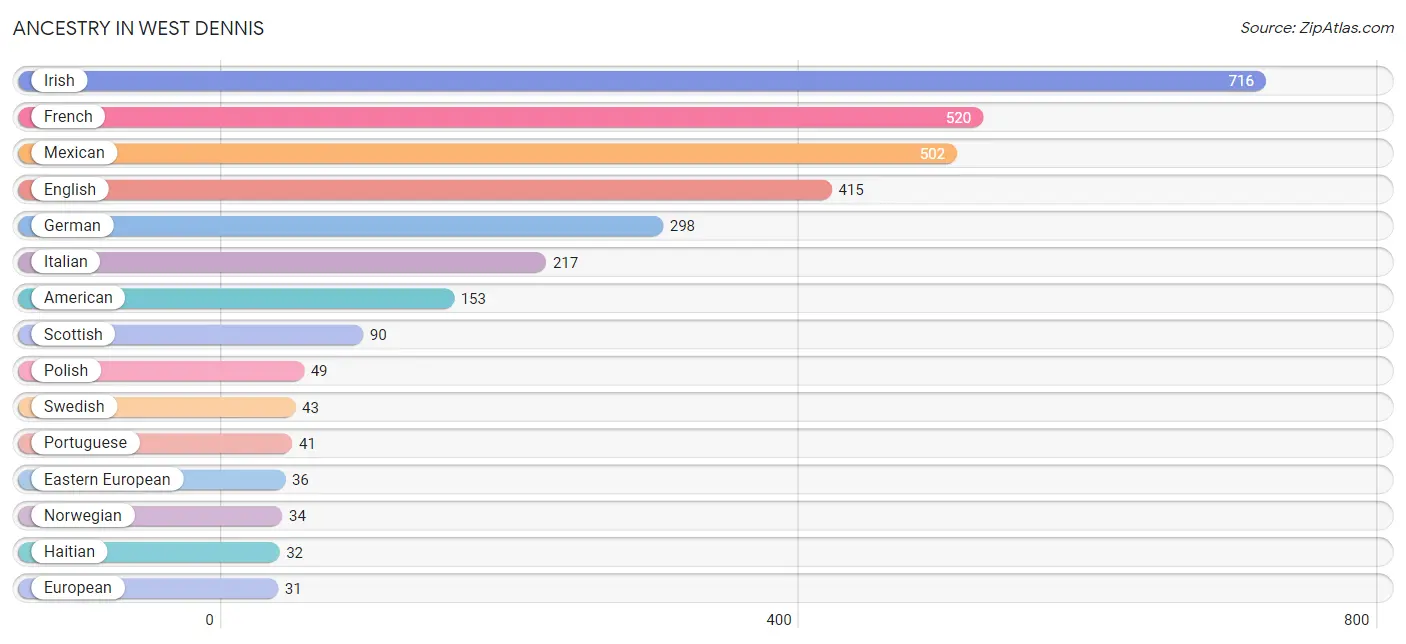
| Ancestry | # Population | % Population |
| Albanian | 5 | 0.2% |
| American | 153 | 5.6% |
| Armenian | 6 | 0.2% |
| Australian | 6 | 0.2% |
| Austrian | 12 | 0.4% |
| Brazilian | 28 | 1.0% |
| British | 6 | 0.2% |
| Bulgarian | 10 | 0.4% |
| Canadian | 13 | 0.5% |
| Central American | 30 | 1.1% |
| Czech | 8 | 0.3% |
| Eastern European | 36 | 1.3% |
| English | 415 | 15.2% |
| European | 31 | 1.1% |
| Finnish | 4 | 0.2% |
| French | 520 | 19.0% |
| French Canadian | 31 | 1.1% |
| German | 298 | 10.9% |
| Guatemalan | 30 | 1.1% |
| Haitian | 32 | 1.2% |
| Hungarian | 23 | 0.8% |
| Irish | 716 | 26.2% |
| Italian | 217 | 7.9% |
| Mexican | 502 | 18.4% |
| Norwegian | 34 | 1.2% |
| Polish | 49 | 1.8% |
| Portuguese | 41 | 1.5% |
| Romanian | 5 | 0.2% |
| Russian | 5 | 0.2% |
| Scotch-Irish | 23 | 0.8% |
| Scottish | 90 | 3.3% |
| Swedish | 43 | 1.6% | View All 32 Rows |
Immigrants in West Dennis
The most numerous immigrant groups reported in West Dennis came from Latin America (281 | 10.3%), Central America (227 | 8.3%), Mexico (197 | 7.2%), Brazil (38 | 1.4%), and Europe (38 | 1.4%), together accounting for 28.6% of all West Dennis residents.
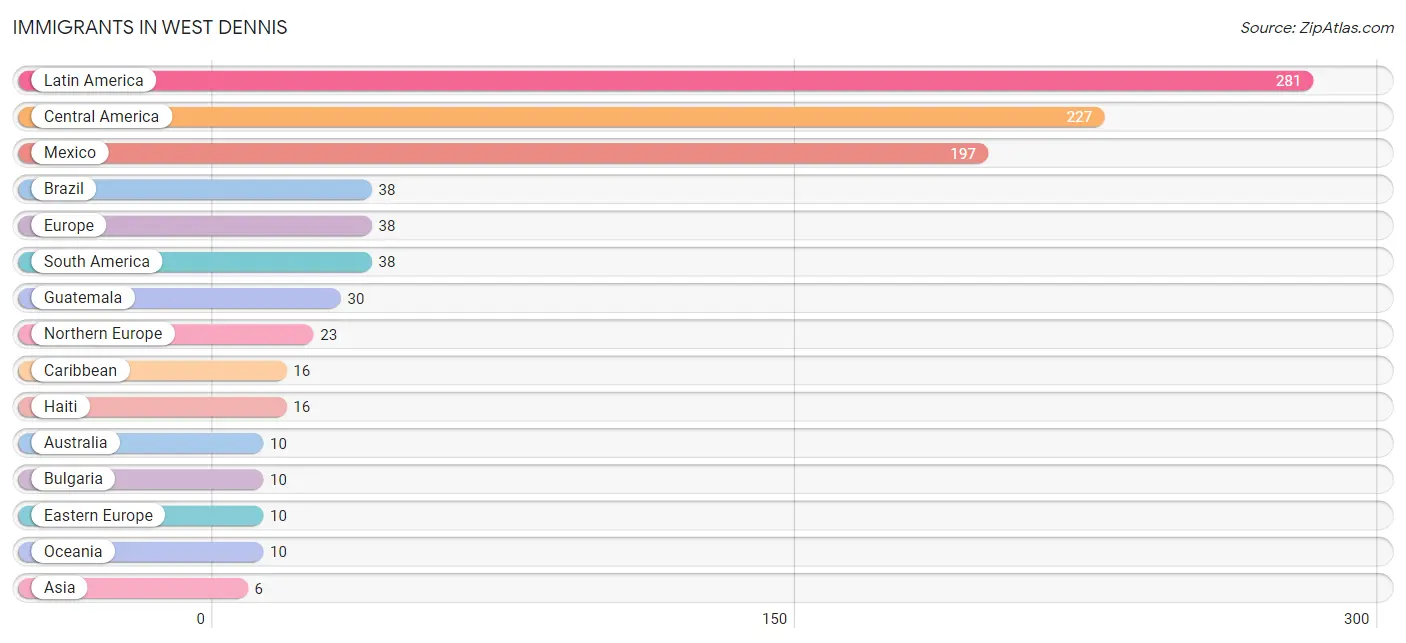
| Immigration Origin | # Population | % Population |
| Asia | 6 | 0.2% |
| Australia | 10 | 0.4% |
| Brazil | 38 | 1.4% |
| Bulgaria | 10 | 0.4% |
| Caribbean | 16 | 0.6% |
| Central America | 227 | 8.3% |
| Eastern Europe | 10 | 0.4% |
| Europe | 38 | 1.4% |
| Greece | 5 | 0.2% |
| Guatemala | 30 | 1.1% |
| Haiti | 16 | 0.6% |
| Ireland | 4 | 0.2% |
| Latin America | 281 | 10.3% |
| Mexico | 197 | 7.2% |
| Northern Europe | 23 | 0.8% |
| Oceania | 10 | 0.4% |
| Philippines | 6 | 0.2% |
| Scotland | 4 | 0.2% |
| South America | 38 | 1.4% |
| South Eastern Asia | 6 | 0.2% |
| Southern Europe | 5 | 0.2% | View All 21 Rows |
Sex and Age in West Dennis
Sex and Age in West Dennis
The most populous age groups in West Dennis are 65 to 69 Years (177 | 13.9%) for men and 65 to 69 Years (254 | 17.4%) for women.
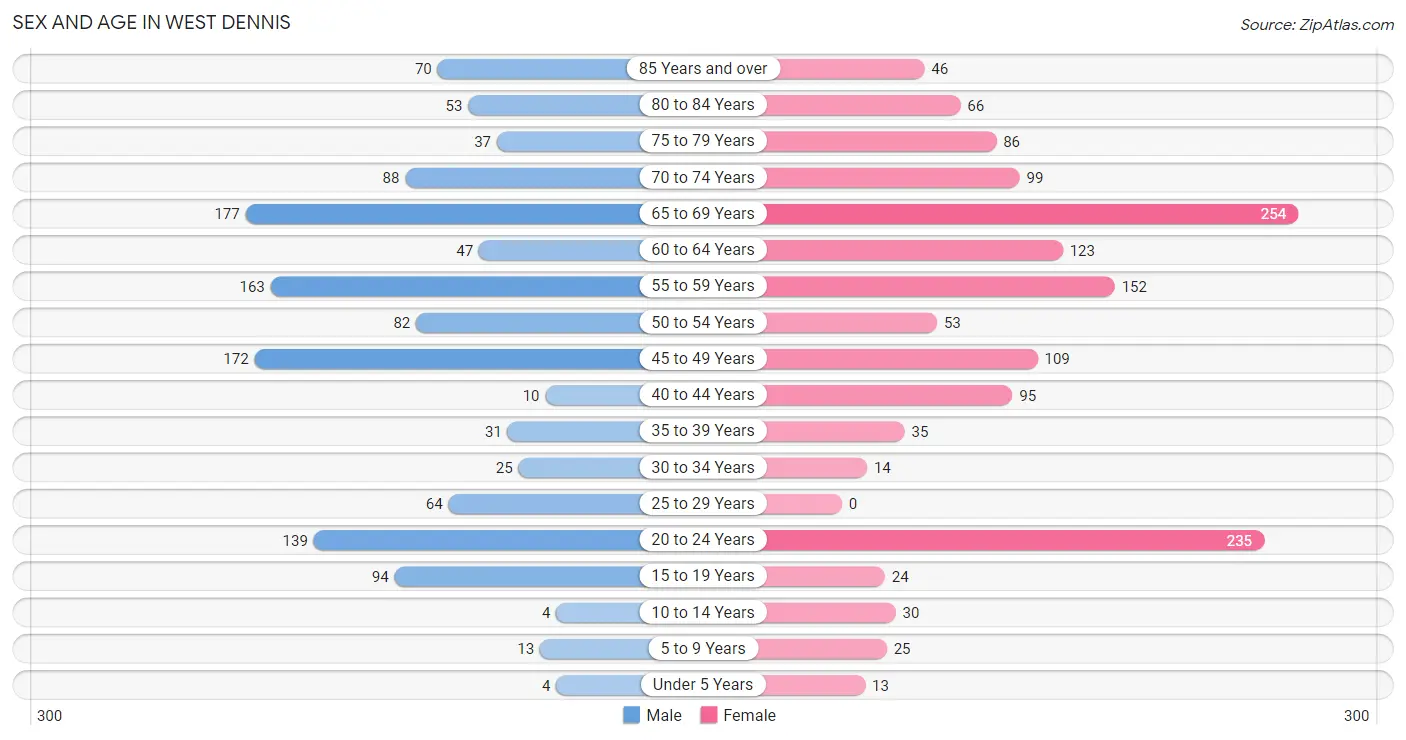
| Age Bracket | Male | Female |
| Under 5 Years | 4 (0.3%) | 13 (0.9%) |
| 5 to 9 Years | 13 (1.0%) | 25 (1.7%) |
| 10 to 14 Years | 4 (0.3%) | 30 (2.1%) |
| 15 to 19 Years | 94 (7.4%) | 24 (1.6%) |
| 20 to 24 Years | 139 (10.9%) | 235 (16.1%) |
| 25 to 29 Years | 64 (5.0%) | 0 (0.0%) |
| 30 to 34 Years | 25 (2.0%) | 14 (1.0%) |
| 35 to 39 Years | 31 (2.4%) | 35 (2.4%) |
| 40 to 44 Years | 10 (0.8%) | 95 (6.5%) |
| 45 to 49 Years | 172 (13.5%) | 109 (7.5%) |
| 50 to 54 Years | 82 (6.4%) | 53 (3.6%) |
| 55 to 59 Years | 163 (12.8%) | 152 (10.4%) |
| 60 to 64 Years | 47 (3.7%) | 123 (8.4%) |
| 65 to 69 Years | 177 (13.9%) | 254 (17.4%) |
| 70 to 74 Years | 88 (6.9%) | 99 (6.8%) |
| 75 to 79 Years | 37 (2.9%) | 86 (5.9%) |
| 80 to 84 Years | 53 (4.2%) | 66 (4.5%) |
| 85 Years and over | 70 (5.5%) | 46 (3.2%) |
| Total | 1,273 (100.0%) | 1,459 (100.0%) |
Families and Households in West Dennis
Median Family Size in West Dennis
The median family size in West Dennis is 2.79 persons per family, with single male/father families (156 | 20.8%) accounting for the largest median family size of 4.28 persons per family. On the other hand, married-couple families (512 | 68.3%) represent the smallest median family size with 2.40 persons per family.
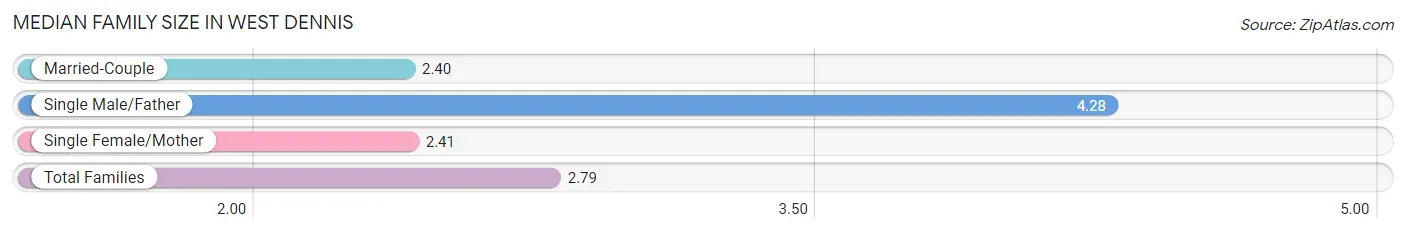
| Family Type | # Families | Family Size |
| Married-Couple | 512 (68.3%) | 2.40 |
| Single Male/Father | 156 (20.8%) | 4.28 |
| Single Female/Mother | 82 (10.9%) | 2.41 |
| Total Families | 750 (100.0%) | 2.79 |
Median Household Size in West Dennis
The median household size in West Dennis is 2.10 persons per household, with single male/father households (156 | 12.0%) accounting for the largest median household size of 4.4 persons per household. non-family households (554 | 42.5%) represent the smallest median household size with 1.09 persons per household.
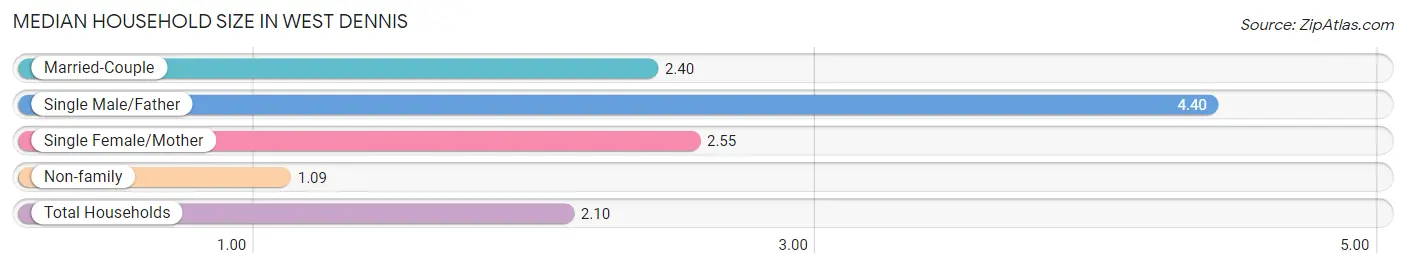
| Household Type | # Households | Household Size |
| Married-Couple | 512 (39.3%) | 2.40 |
| Single Male/Father | 156 (12.0%) | 4.40 |
| Single Female/Mother | 82 (6.3%) | 2.55 |
| Non-family | 554 (42.5%) | 1.09 |
| Total Households | 1,304 (100.0%) | 2.10 |
Household Size by Marriage Status in West Dennis
Out of a total of 1,304 households in West Dennis, 750 (57.5%) are family households, while 554 (42.5%) are nonfamily households. The most numerous type of family households are 2-person households, comprising 526, and the most common type of nonfamily households are 1-person households, comprising 510.
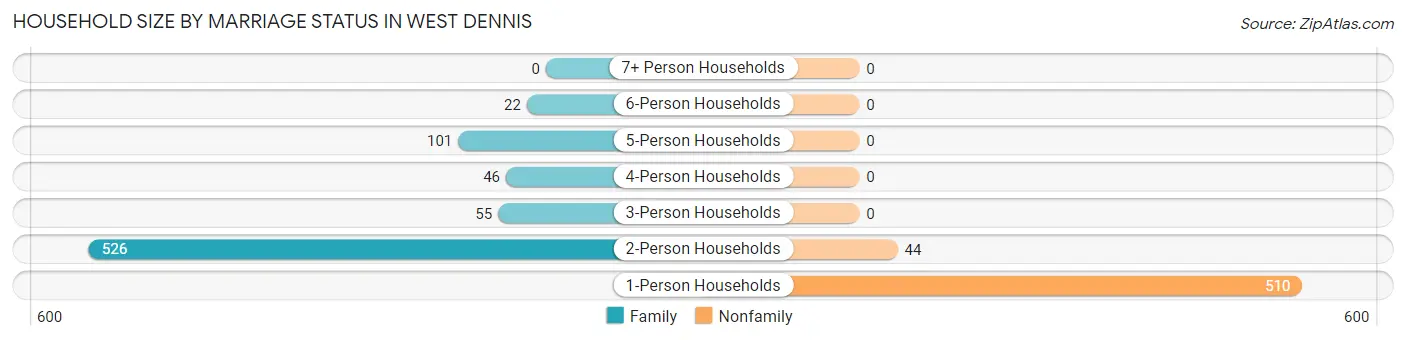
| Household Size | Family Households | Nonfamily Households |
| 1-Person Households | - | 510 (39.1%) |
| 2-Person Households | 526 (40.3%) | 44 (3.4%) |
| 3-Person Households | 55 (4.2%) | 0 (0.0%) |
| 4-Person Households | 46 (3.5%) | 0 (0.0%) |
| 5-Person Households | 101 (7.7%) | 0 (0.0%) |
| 6-Person Households | 22 (1.7%) | 0 (0.0%) |
| 7+ Person Households | 0 (0.0%) | 0 (0.0%) |
| Total | 750 (57.5%) | 554 (42.5%) |
Female Fertility in West Dennis
Fertility by Age in West Dennis
| Age Bracket | Women with Births | Births / 1,000 Women |
| 15 to 19 years | 0 (0.0%) | 0.0 |
| 20 to 34 years | 0 (0.0%) | 0.0 |
| 35 to 50 years | 0 (0.0%) | 0.0 |
| Total | 0 (0.0%) | 0.0 |
Fertility by Age by Marriage Status in West Dennis
| Age Bracket | Married | Unmarried |
| 15 to 19 years | 0 (0.0%) | 0 (0.0%) |
| 20 to 34 years | 0 (0.0%) | 0 (0.0%) |
| 35 to 50 years | 0 (0.0%) | 0 (0.0%) |
| Total | 0 (0.0%) | 0 (0.0%) |
Fertility by Education in West Dennis
| Educational Attainment | Women with Births | Births / 1,000 Women |
| Less than High School | 0 (0.0%) | 0.0 |
| High School Diploma | 0 (0.0%) | 0.0 |
| College or Associate's Degree | 0 (0.0%) | 0.0 |
| Bachelor's Degree | 0 (0.0%) | 0.0 |
| Graduate Degree | 0 (0.0%) | 0.0 |
| Total | 0 (0.0%) | 0.0 |
Fertility by Education by Marriage Status in West Dennis
| Educational Attainment | Married | Unmarried |
| Less than High School | 0 (0.0%) | 0 (0.0%) |
| High School Diploma | 0 (0.0%) | 0 (0.0%) |
| College or Associate's Degree | 0 (0.0%) | 0 (0.0%) |
| Bachelor's Degree | 0 (0.0%) | 0 (0.0%) |
| Graduate Degree | 0 (0.0%) | 0 (0.0%) |
| Total | 0 (0.0%) | 0 (0.0%) |
Employment Characteristics in West Dennis
Employment by Class of Employer in West Dennis
Among the 1,431 employed individuals in West Dennis, private company employees (760 | 53.1%), not-for-profit organizations (392 | 27.4%), and self-employed (incorporated) (109 | 7.6%) make up the most common classes of employment.
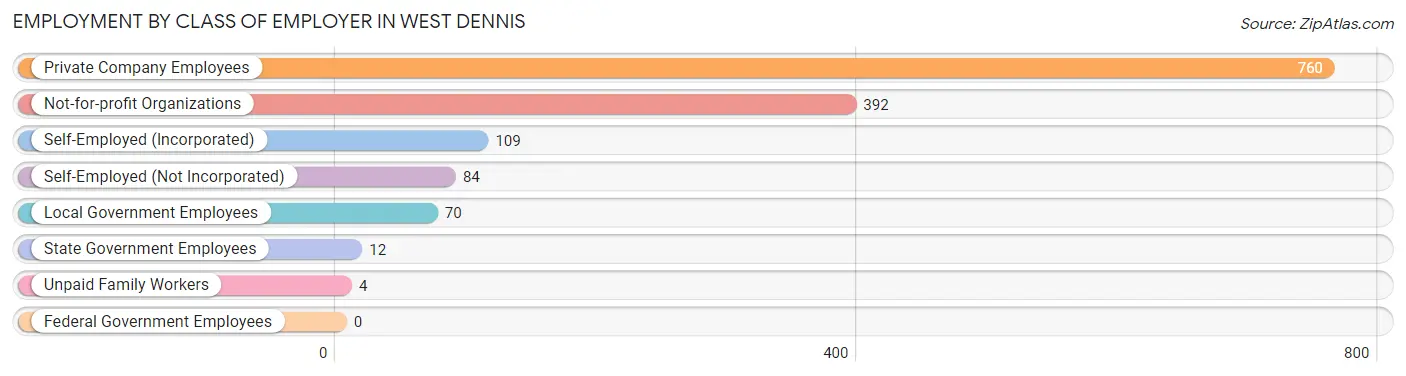
| Employer Class | # Employees | % Employees |
| Private Company Employees | 760 | 53.1% |
| Self-Employed (Incorporated) | 109 | 7.6% |
| Self-Employed (Not Incorporated) | 84 | 5.9% |
| Not-for-profit Organizations | 392 | 27.4% |
| Local Government Employees | 70 | 4.9% |
| State Government Employees | 12 | 0.8% |
| Federal Government Employees | 0 | 0.0% |
| Unpaid Family Workers | 4 | 0.3% |
| Total | 1,431 | 100.0% |
Employment Status by Age in West Dennis
According to the labor force statistics for West Dennis, out of the total population over 16 years of age (2,549), 58.5% or 1,491 individuals are in the labor force, with 1.7% or 25 of them unemployed. The age group with the highest labor force participation rate is 25 to 29 years, with 100.0% or 64 individuals in the labor force. Within the labor force, the 55 to 59 years age range has the highest percentage of unemployed individuals, with 8.8% or 14 of them being unemployed.
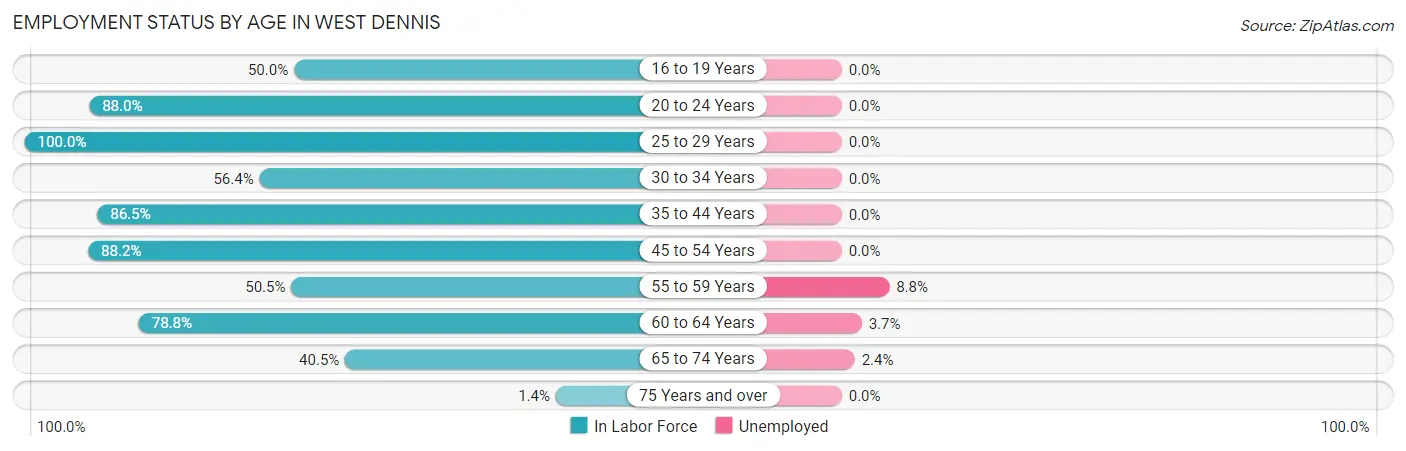
| Age Bracket | In Labor Force | Unemployed |
| 16 to 19 Years | 12 (50.0%) | 0 (0.0%) |
| 20 to 24 Years | 329 (88.0%) | 0 (0.0%) |
| 25 to 29 Years | 64 (100.0%) | 0 (0.0%) |
| 30 to 34 Years | 22 (56.4%) | 0 (0.0%) |
| 35 to 44 Years | 148 (86.5%) | 0 (0.0%) |
| 45 to 54 Years | 367 (88.2%) | 0 (0.0%) |
| 55 to 59 Years | 159 (50.5%) | 14 (8.8%) |
| 60 to 64 Years | 134 (78.8%) | 5 (3.7%) |
| 65 to 74 Years | 250 (40.5%) | 6 (2.4%) |
| 75 Years and over | 5 (1.4%) | 0 (0.0%) |
| Total | 1,491 (58.5%) | 25 (1.7%) |
Employment Status by Educational Attainment in West Dennis
According to labor force statistics for West Dennis, 76.1% of individuals (894) out of the total population between 25 and 64 years of age (1,175) are in the labor force, with 2.1% or 19 of them being unemployed. The group with the highest labor force participation rate are those with the educational attainment of college / associate degree, with 78.1% or 339 individuals in the labor force. Within the labor force, individuals with bachelor's degree or higher education have the highest percentage of unemployment, with 6.4% or 19 of them being unemployed.
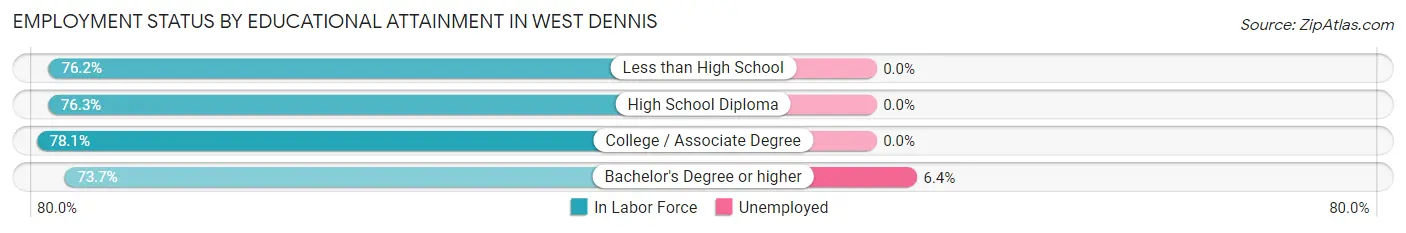
| Educational Attainment | In Labor Force | Unemployed |
| Less than High School | 16 (76.2%) | 0 (0.0%) |
| High School Diploma | 242 (76.3%) | 0 (0.0%) |
| College / Associate Degree | 339 (78.1%) | 0 (0.0%) |
| Bachelor's Degree or higher | 297 (73.7%) | 26 (6.4%) |
| Total | 894 (76.1%) | 25 (2.1%) |
Employment Occupations by Sex in West Dennis
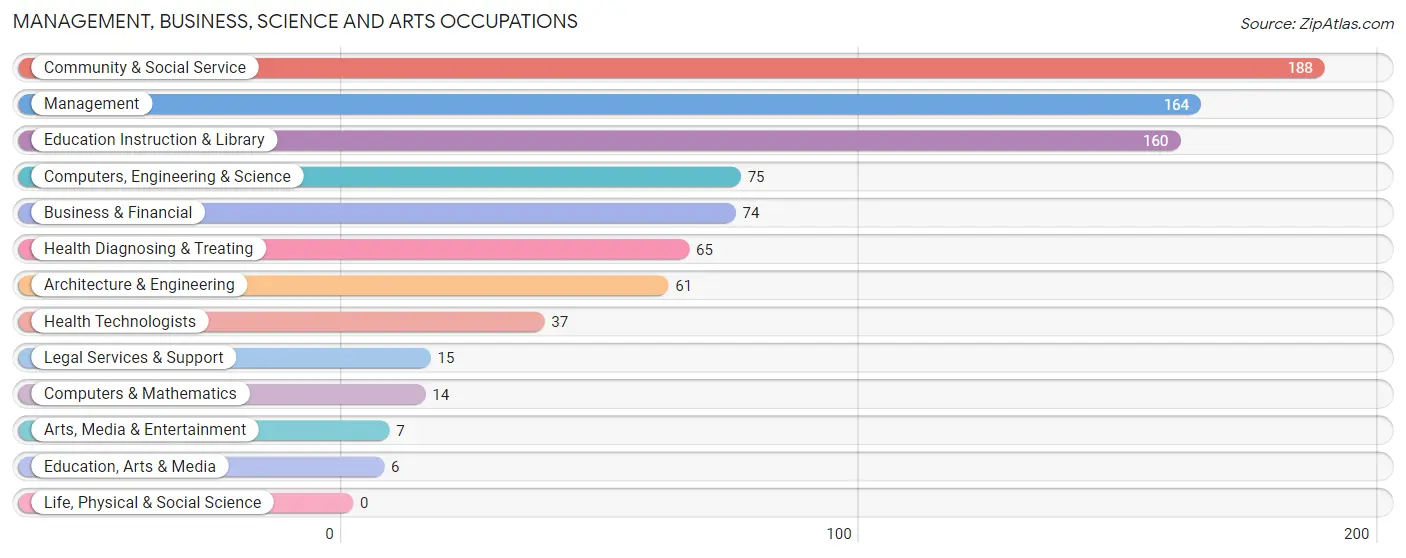
Management, Business, Science and Arts Occupations
The most common Management, Business, Science and Arts occupations in West Dennis are Community & Social Service (188 | 12.8%), Management (164 | 11.2%), Education Instruction & Library (160 | 10.9%), Computers, Engineering & Science (75 | 5.1%), and Business & Financial (74 | 5.1%).
Management, Business, Science and Arts Occupations by Sex
Within the Management, Business, Science and Arts occupations in West Dennis, the most male-oriented occupations are Education, Arts & Media (100.0%), Arts, Media & Entertainment (100.0%), and Architecture & Engineering (75.4%), while the most female-oriented occupations are Health Technologists (100.0%), Education Instruction & Library (85.0%), and Health Diagnosing & Treating (83.1%).
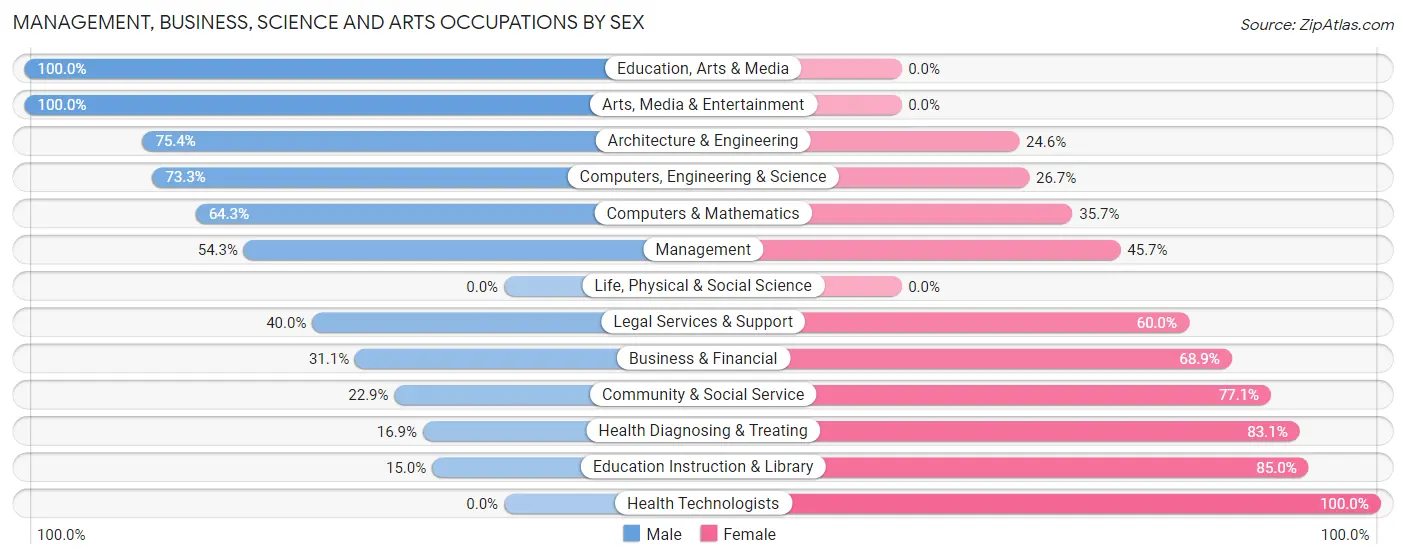
| Occupation | Male | Female |
| Management | 89 (54.3%) | 75 (45.7%) |
| Business & Financial | 23 (31.1%) | 51 (68.9%) |
| Computers, Engineering & Science | 55 (73.3%) | 20 (26.7%) |
| Computers & Mathematics | 9 (64.3%) | 5 (35.7%) |
| Architecture & Engineering | 46 (75.4%) | 15 (24.6%) |
| Life, Physical & Social Science | 0 (0.0%) | 0 (0.0%) |
| Community & Social Service | 43 (22.9%) | 145 (77.1%) |
| Education, Arts & Media | 6 (100.0%) | 0 (0.0%) |
| Legal Services & Support | 6 (40.0%) | 9 (60.0%) |
| Education Instruction & Library | 24 (15.0%) | 136 (85.0%) |
| Arts, Media & Entertainment | 7 (100.0%) | 0 (0.0%) |
| Health Diagnosing & Treating | 11 (16.9%) | 54 (83.1%) |
| Health Technologists | 0 (0.0%) | 37 (100.0%) |
| Total (Category) | 221 (39.1%) | 345 (61.0%) |
| Total (Overall) | 710 (48.5%) | 755 (51.5%) |
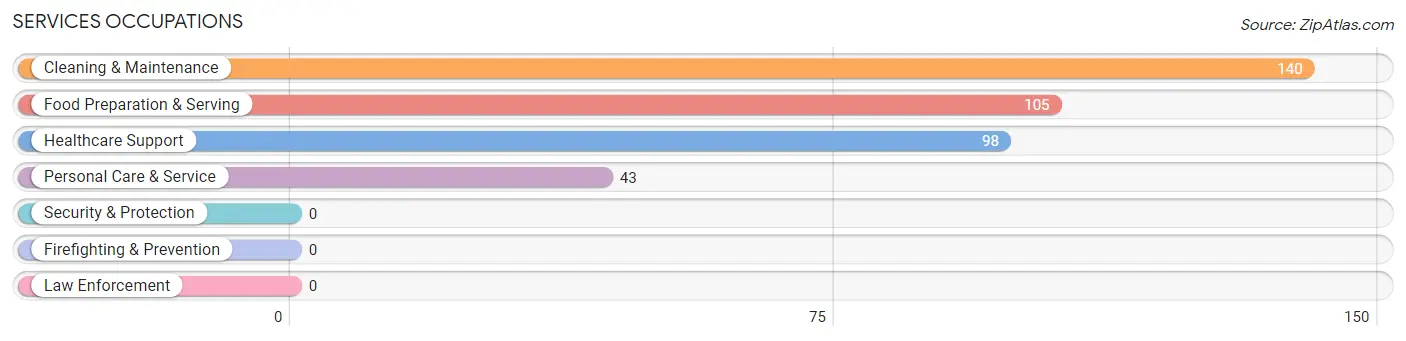
Services Occupations
The most common Services occupations in West Dennis are Cleaning & Maintenance (140 | 9.6%), Food Preparation & Serving (105 | 7.2%), Healthcare Support (98 | 6.7%), and Personal Care & Service (43 | 2.9%).
Services Occupations by Sex
Within the Services occupations in West Dennis, the most male-oriented occupations are Food Preparation & Serving (40.9%), Personal Care & Service (39.5%), and Cleaning & Maintenance (37.1%), while the most female-oriented occupations are Healthcare Support (94.9%), Cleaning & Maintenance (62.9%), and Personal Care & Service (60.5%).
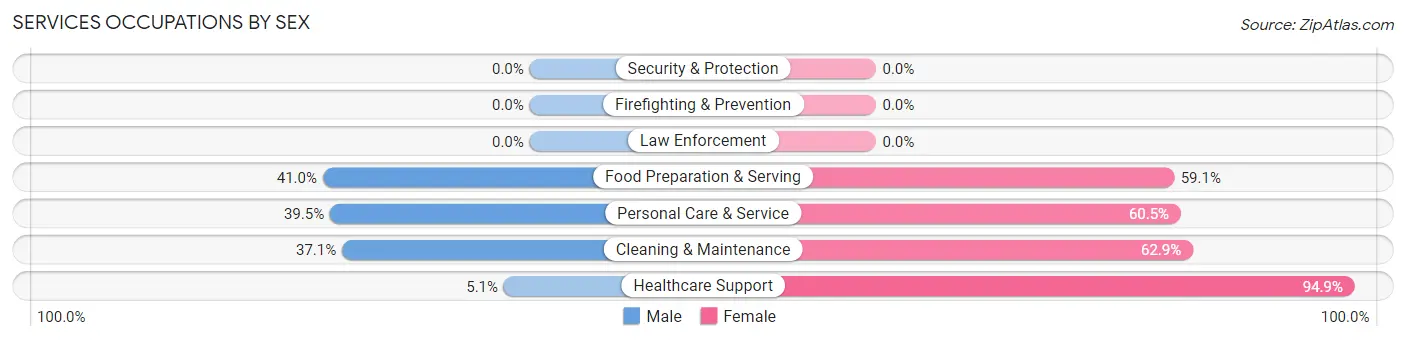
| Occupation | Male | Female |
| Healthcare Support | 5 (5.1%) | 93 (94.9%) |
| Security & Protection | 0 (0.0%) | 0 (0.0%) |
| Firefighting & Prevention | 0 (0.0%) | 0 (0.0%) |
| Law Enforcement | 0 (0.0%) | 0 (0.0%) |
| Food Preparation & Serving | 43 (40.9%) | 62 (59.1%) |
| Cleaning & Maintenance | 52 (37.1%) | 88 (62.9%) |
| Personal Care & Service | 17 (39.5%) | 26 (60.5%) |
| Total (Category) | 117 (30.3%) | 269 (69.7%) |
| Total (Overall) | 710 (48.5%) | 755 (51.5%) |
Sales and Office Occupations
The most common Sales and Office occupations in West Dennis are Office & Administration (74 | 5.1%), and Sales & Related (52 | 3.5%).
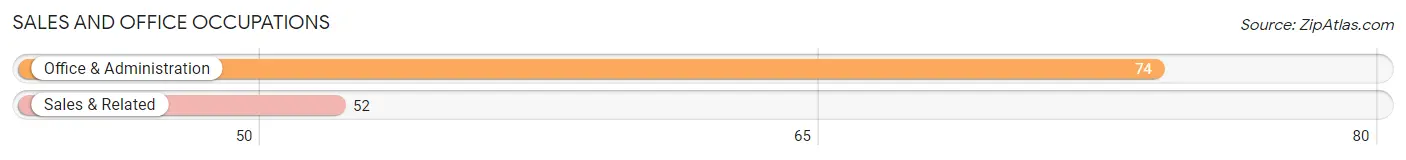
Sales and Office Occupations by Sex

| Occupation | Male | Female |
| Sales & Related | 27 (51.9%) | 25 (48.1%) |
| Office & Administration | 7 (9.5%) | 67 (90.5%) |
| Total (Category) | 34 (27.0%) | 92 (73.0%) |
| Total (Overall) | 710 (48.5%) | 755 (51.5%) |
Natural Resources, Construction and Maintenance Occupations
The most common Natural Resources, Construction and Maintenance occupations in West Dennis are Construction & Extraction (163 | 11.1%), Installation, Maintenance & Repair (111 | 7.6%), and Farming, Fishing & Forestry (16 | 1.1%).
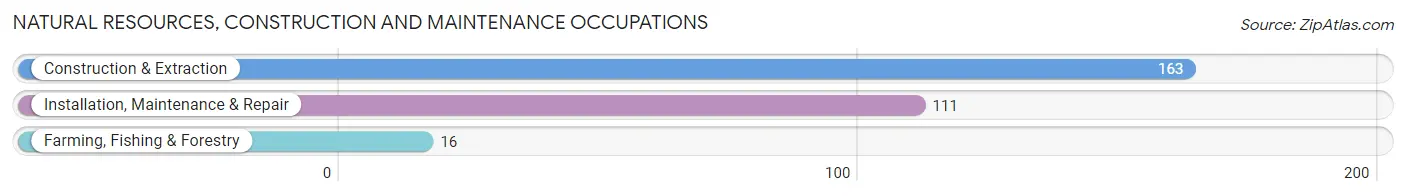
Natural Resources, Construction and Maintenance Occupations by Sex
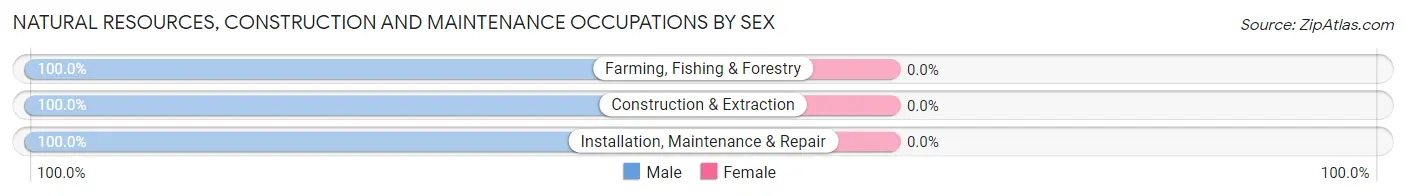
| Occupation | Male | Female |
| Farming, Fishing & Forestry | 16 (100.0%) | 0 (0.0%) |
| Construction & Extraction | 163 (100.0%) | 0 (0.0%) |
| Installation, Maintenance & Repair | 111 (100.0%) | 0 (0.0%) |
| Total (Category) | 290 (100.0%) | 0 (0.0%) |
| Total (Overall) | 710 (48.5%) | 755 (51.5%) |
Production, Transportation and Moving Occupations
The most common Production, Transportation and Moving occupations in West Dennis are Transportation (51 | 3.5%), and Material Moving (46 | 3.1%).
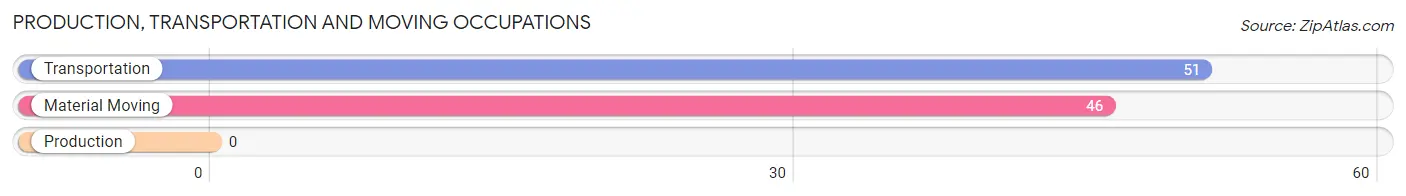
Production, Transportation and Moving Occupations by Sex
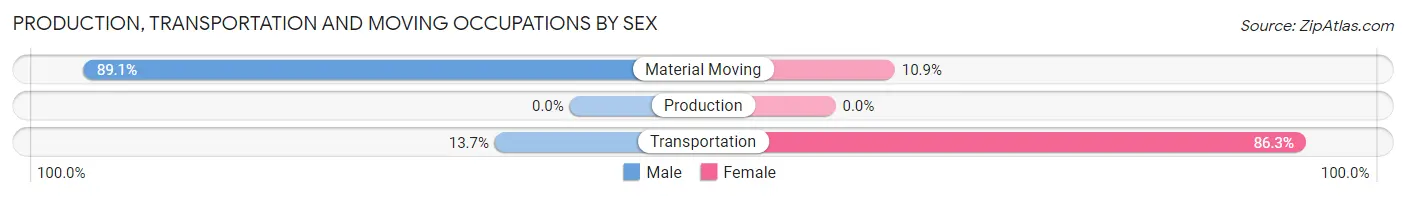
| Occupation | Male | Female |
| Production | 0 (0.0%) | 0 (0.0%) |
| Transportation | 7 (13.7%) | 44 (86.3%) |
| Material Moving | 41 (89.1%) | 5 (10.9%) |
| Total (Category) | 48 (49.5%) | 49 (50.5%) |
| Total (Overall) | 710 (48.5%) | 755 (51.5%) |
Employment Industries by Sex in West Dennis
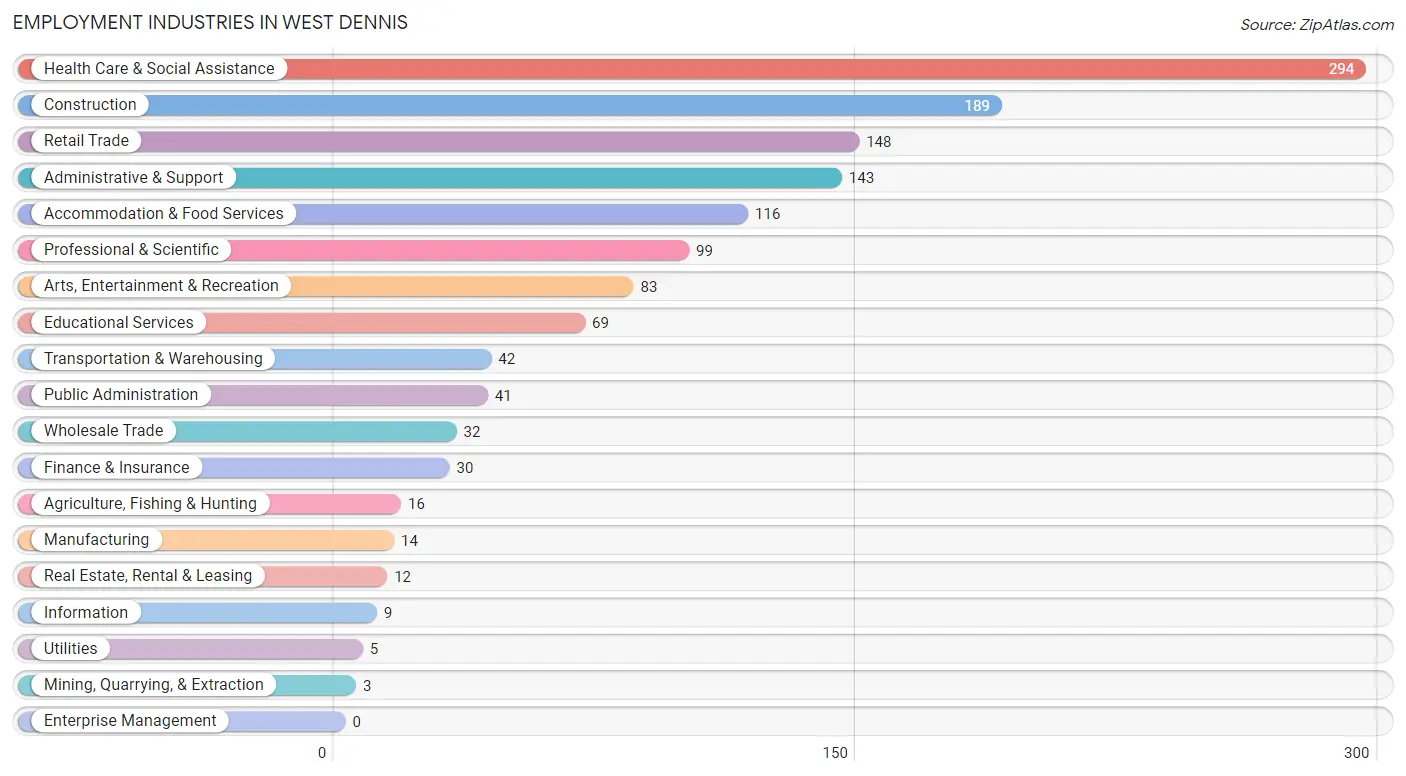
Employment Industries in West Dennis
The major employment industries in West Dennis include Health Care & Social Assistance (294 | 20.1%), Construction (189 | 12.9%), Retail Trade (148 | 10.1%), Administrative & Support (143 | 9.8%), and Accommodation & Food Services (116 | 7.9%).
Employment Industries by Sex in West Dennis
The West Dennis industries that see more men than women are Agriculture, Fishing & Hunting (100.0%), Mining, Quarrying, & Extraction (100.0%), and Wholesale Trade (100.0%), whereas the industries that tend to have a higher number of women are Utilities (100.0%), Health Care & Social Assistance (96.3%), and Finance & Insurance (86.7%).
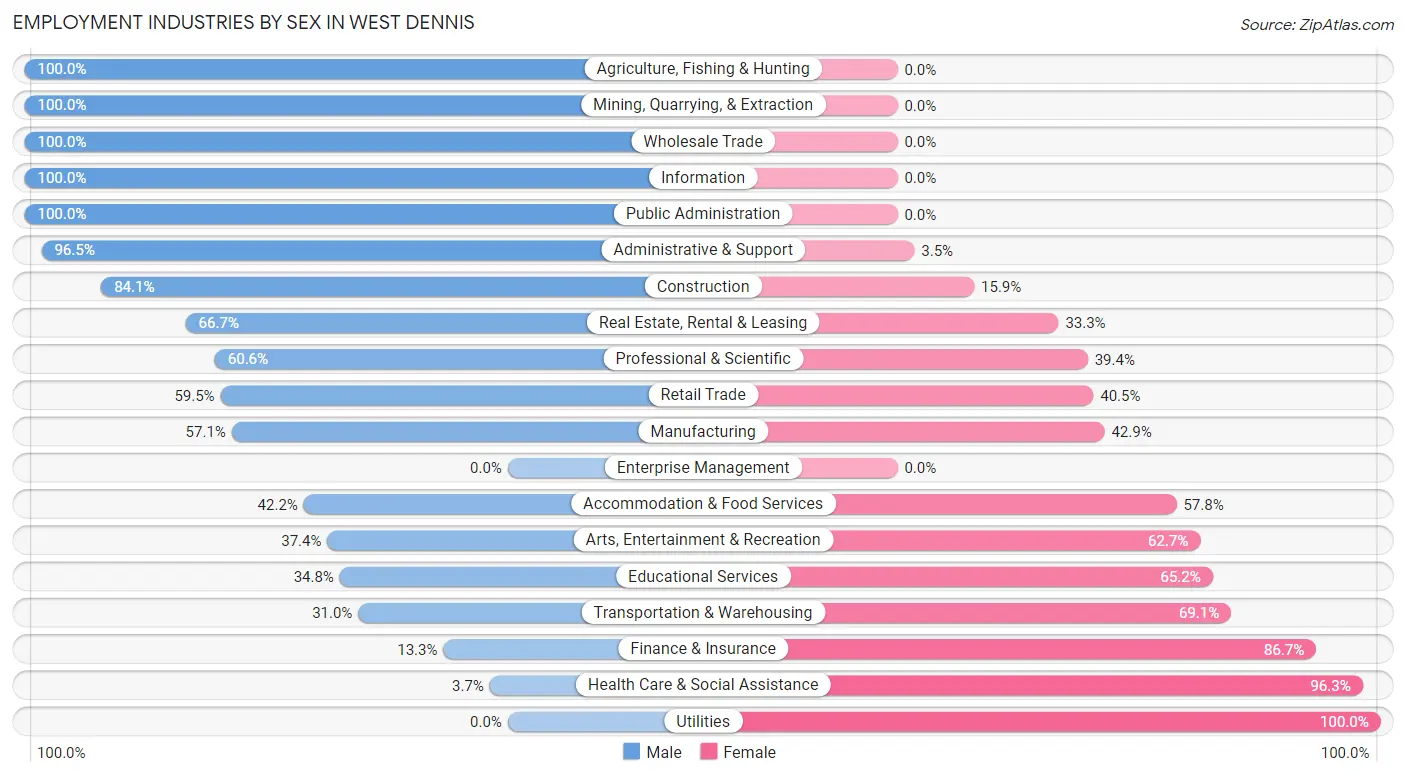
| Industry | Male | Female |
| Agriculture, Fishing & Hunting | 16 (100.0%) | 0 (0.0%) |
| Mining, Quarrying, & Extraction | 3 (100.0%) | 0 (0.0%) |
| Construction | 159 (84.1%) | 30 (15.9%) |
| Manufacturing | 8 (57.1%) | 6 (42.9%) |
| Wholesale Trade | 32 (100.0%) | 0 (0.0%) |
| Retail Trade | 88 (59.5%) | 60 (40.5%) |
| Transportation & Warehousing | 13 (30.9%) | 29 (69.1%) |
| Utilities | 0 (0.0%) | 5 (100.0%) |
| Information | 9 (100.0%) | 0 (0.0%) |
| Finance & Insurance | 4 (13.3%) | 26 (86.7%) |
| Real Estate, Rental & Leasing | 8 (66.7%) | 4 (33.3%) |
| Professional & Scientific | 60 (60.6%) | 39 (39.4%) |
| Enterprise Management | 0 (0.0%) | 0 (0.0%) |
| Administrative & Support | 138 (96.5%) | 5 (3.5%) |
| Educational Services | 24 (34.8%) | 45 (65.2%) |
| Health Care & Social Assistance | 11 (3.7%) | 283 (96.3%) |
| Arts, Entertainment & Recreation | 31 (37.3%) | 52 (62.6%) |
| Accommodation & Food Services | 49 (42.2%) | 67 (57.8%) |
| Public Administration | 41 (100.0%) | 0 (0.0%) |
| Total | 710 (48.5%) | 755 (51.5%) |
Education in West Dennis
School Enrollment in West Dennis
The most common levels of schooling among the 358 students in West Dennis are college / undergraduate (153 | 42.7%), high school (118 | 33.0%), and elementary school (38 | 10.6%).
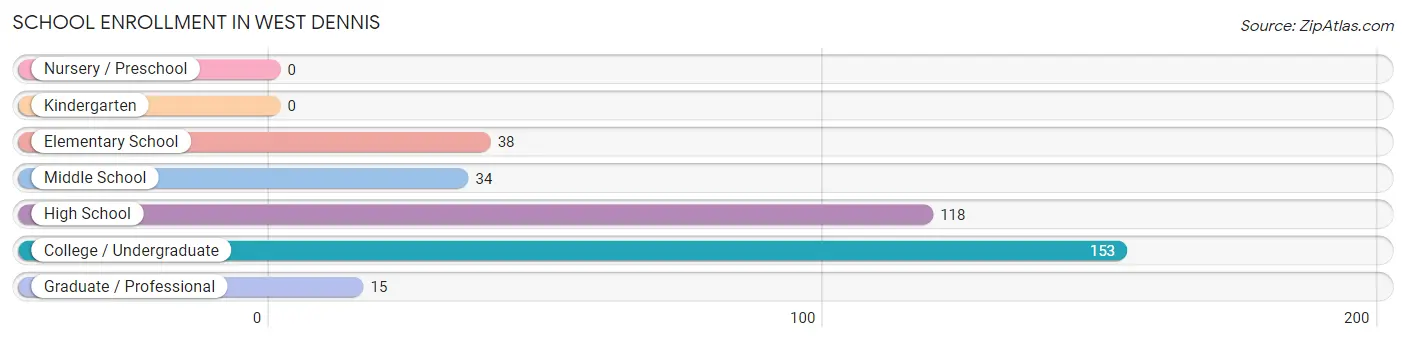
| School Level | # Students | % Students |
| Nursery / Preschool | 0 | 0.0% |
| Kindergarten | 0 | 0.0% |
| Elementary School | 38 | 10.6% |
| Middle School | 34 | 9.5% |
| High School | 118 | 33.0% |
| College / Undergraduate | 153 | 42.7% |
| Graduate / Professional | 15 | 4.2% |
| Total | 358 | 100.0% |
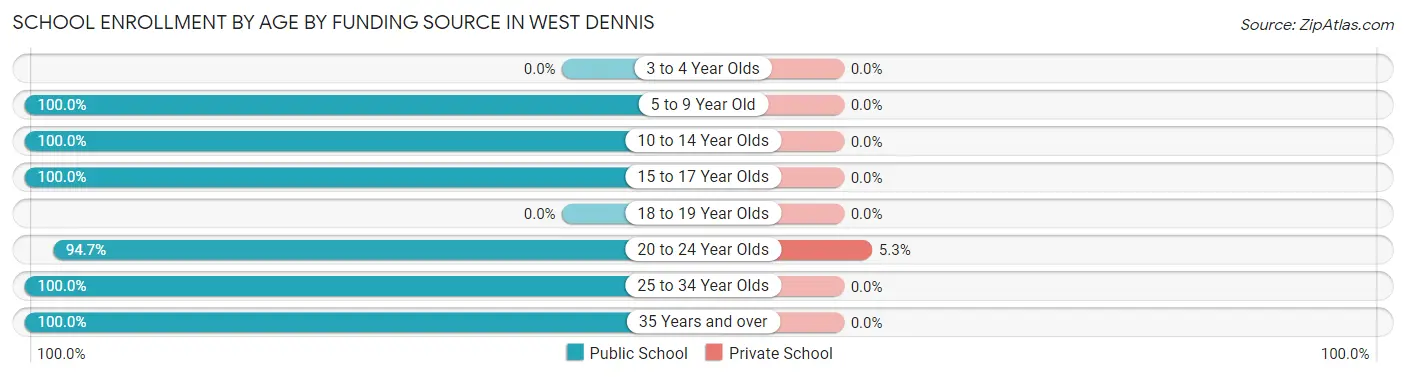
School Enrollment by Age by Funding Source in West Dennis
Out of a total of 358 students who are enrolled in schools in West Dennis, 7 (2.0%) attend a private institution, while the remaining 351 (98.0%) are enrolled in public schools. The age group of 20 to 24 year olds has the highest likelihood of being enrolled in private schools, with 7 (5.3% in the age bracket) enrolled. Conversely, the age group of 5 to 9 year old has the lowest likelihood of being enrolled in a private school, with 38 (100.0% in the age bracket) attending a public institution.
| Age Bracket | Public School | Private School |
| 3 to 4 Year Olds | 0 (0.0%) | 0 (0.0%) |
| 5 to 9 Year Old | 38 (100.0%) | 0 (0.0%) |
| 10 to 14 Year Olds | 34 (100.0%) | 0 (0.0%) |
| 15 to 17 Year Olds | 118 (100.0%) | 0 (0.0%) |
| 18 to 19 Year Olds | 0 (0.0%) | 0 (0.0%) |
| 20 to 24 Year Olds | 126 (94.7%) | 7 (5.3%) |
| 25 to 34 Year Olds | 20 (100.0%) | 0 (0.0%) |
| 35 Years and over | 15 (100.0%) | 0 (0.0%) |
| Total | 351 (98.0%) | 7 (2.0%) |
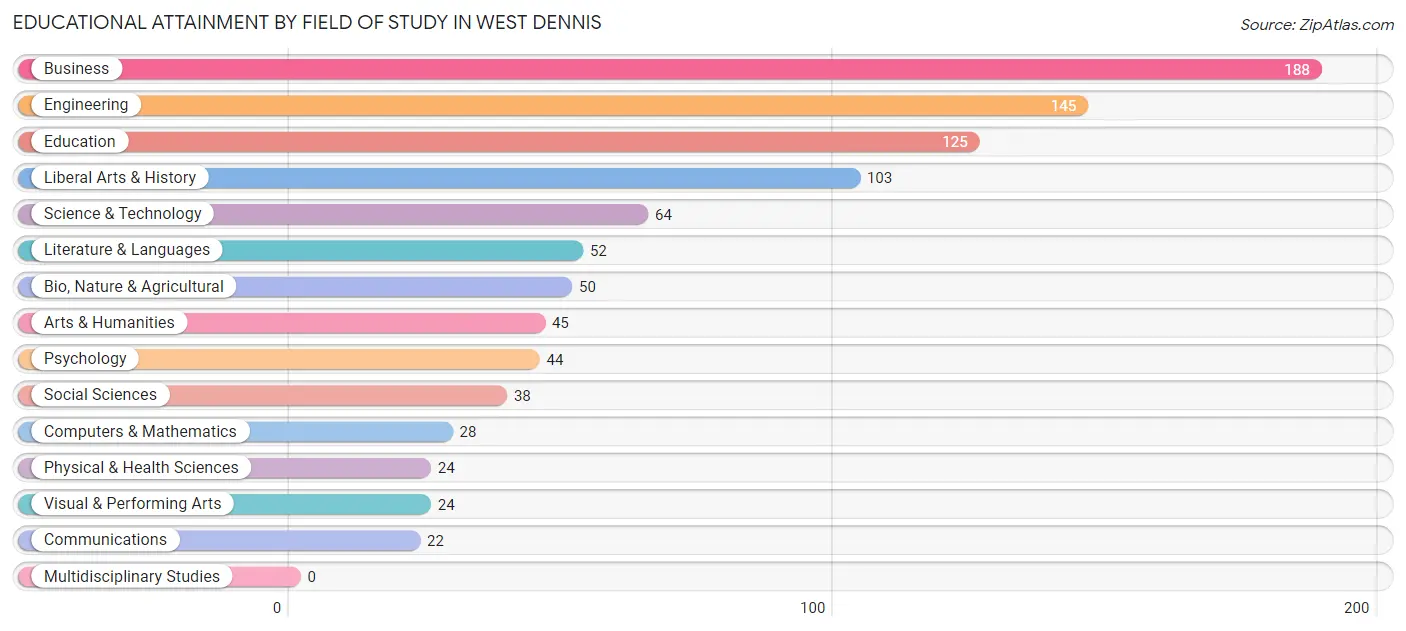
Educational Attainment by Field of Study in West Dennis
Business (188 | 19.8%), engineering (145 | 15.2%), education (125 | 13.1%), liberal arts & history (103 | 10.8%), and science & technology (64 | 6.7%) are the most common fields of study among 952 individuals in West Dennis who have obtained a bachelor's degree or higher.
| Field of Study | # Graduates | % Graduates |
| Computers & Mathematics | 28 | 2.9% |
| Bio, Nature & Agricultural | 50 | 5.2% |
| Physical & Health Sciences | 24 | 2.5% |
| Psychology | 44 | 4.6% |
| Social Sciences | 38 | 4.0% |
| Engineering | 145 | 15.2% |
| Multidisciplinary Studies | 0 | 0.0% |
| Science & Technology | 64 | 6.7% |
| Business | 188 | 19.8% |
| Education | 125 | 13.1% |
| Literature & Languages | 52 | 5.5% |
| Liberal Arts & History | 103 | 10.8% |
| Visual & Performing Arts | 24 | 2.5% |
| Communications | 22 | 2.3% |
| Arts & Humanities | 45 | 4.7% |
| Total | 952 | 100.0% |
Transportation & Commute in West Dennis
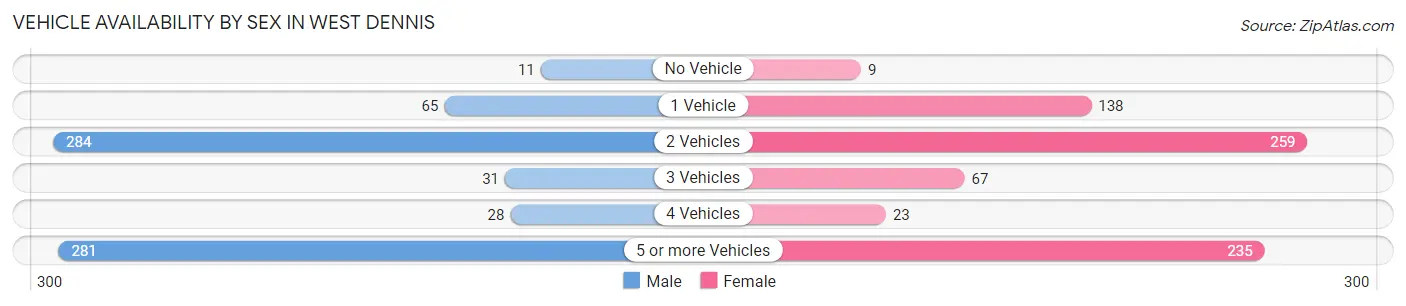
Vehicle Availability by Sex in West Dennis
The most prevalent vehicle ownership categories in West Dennis are males with 2 vehicles (284, accounting for 40.6%) and females with 2 vehicles (259, making up 38.9%).
| Vehicles Available | Male | Female |
| No Vehicle | 11 (1.6%) | 9 (1.2%) |
| 1 Vehicle | 65 (9.3%) | 138 (18.9%) |
| 2 Vehicles | 284 (40.6%) | 259 (35.4%) |
| 3 Vehicles | 31 (4.4%) | 67 (9.2%) |
| 4 Vehicles | 28 (4.0%) | 23 (3.2%) |
| 5 or more Vehicles | 281 (40.1%) | 235 (32.2%) |
| Total | 700 (100.0%) | 731 (100.0%) |
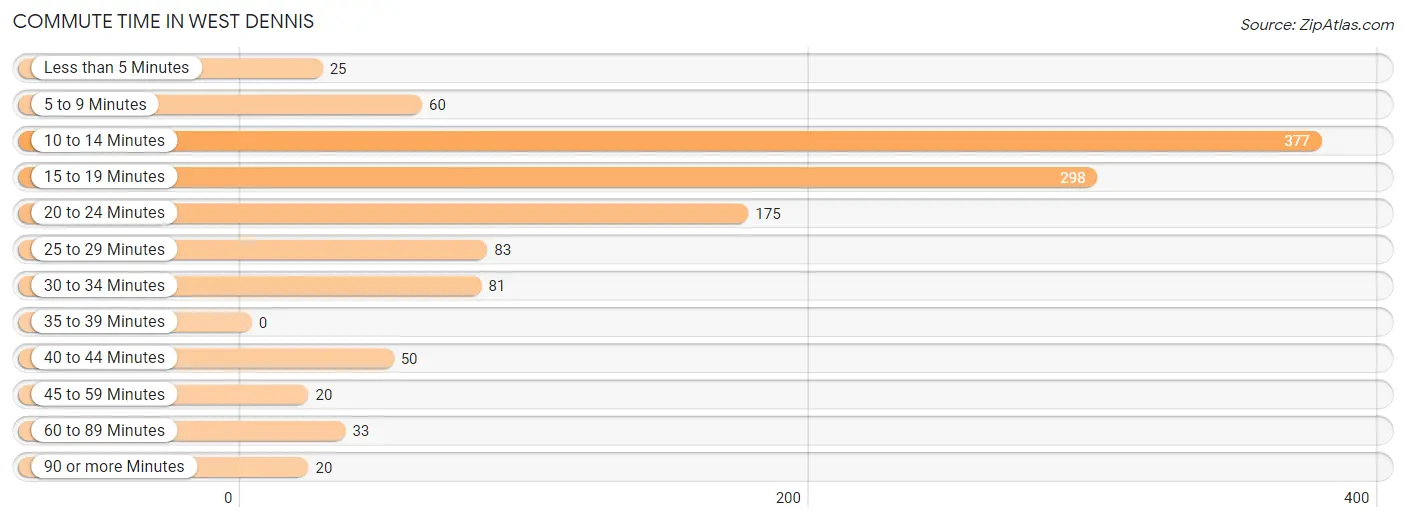
Commute Time in West Dennis
The most frequently occuring commute durations in West Dennis are 10 to 14 minutes (377 commuters, 30.8%), 15 to 19 minutes (298 commuters, 24.4%), and 20 to 24 minutes (175 commuters, 14.3%).
| Commute Time | # Commuters | % Commuters |
| Less than 5 Minutes | 25 | 2.1% |
| 5 to 9 Minutes | 60 | 4.9% |
| 10 to 14 Minutes | 377 | 30.8% |
| 15 to 19 Minutes | 298 | 24.4% |
| 20 to 24 Minutes | 175 | 14.3% |
| 25 to 29 Minutes | 83 | 6.8% |
| 30 to 34 Minutes | 81 | 6.6% |
| 35 to 39 Minutes | 0 | 0.0% |
| 40 to 44 Minutes | 50 | 4.1% |
| 45 to 59 Minutes | 20 | 1.6% |
| 60 to 89 Minutes | 33 | 2.7% |
| 90 or more Minutes | 20 | 1.6% |
Commute Time by Sex in West Dennis
The most common commute times in West Dennis are 15 to 19 minutes (193 commuters, 30.2%) for males and 10 to 14 minutes (253 commuters, 43.3%) for females.
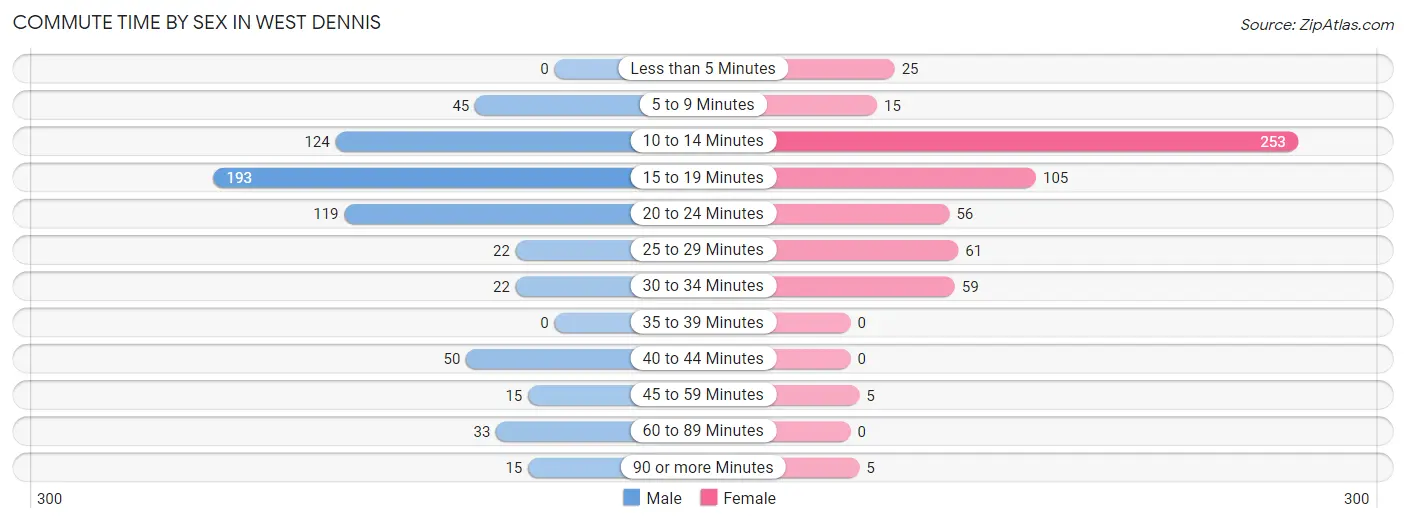
| Commute Time | Male | Female |
| Less than 5 Minutes | 0 (0.0%) | 25 (4.3%) |
| 5 to 9 Minutes | 45 (7.0%) | 15 (2.6%) |
| 10 to 14 Minutes | 124 (19.4%) | 253 (43.3%) |
| 15 to 19 Minutes | 193 (30.2%) | 105 (18.0%) |
| 20 to 24 Minutes | 119 (18.6%) | 56 (9.6%) |
| 25 to 29 Minutes | 22 (3.5%) | 61 (10.4%) |
| 30 to 34 Minutes | 22 (3.5%) | 59 (10.1%) |
| 35 to 39 Minutes | 0 (0.0%) | 0 (0.0%) |
| 40 to 44 Minutes | 50 (7.8%) | 0 (0.0%) |
| 45 to 59 Minutes | 15 (2.4%) | 5 (0.9%) |
| 60 to 89 Minutes | 33 (5.2%) | 0 (0.0%) |
| 90 or more Minutes | 15 (2.4%) | 5 (0.9%) |
Time of Departure to Work by Sex in West Dennis
The most frequent times of departure to work in West Dennis are 12:00 AM to 4:59 AM (142, 22.3%) for males and 8:30 AM to 8:59 AM (141, 24.1%) for females.
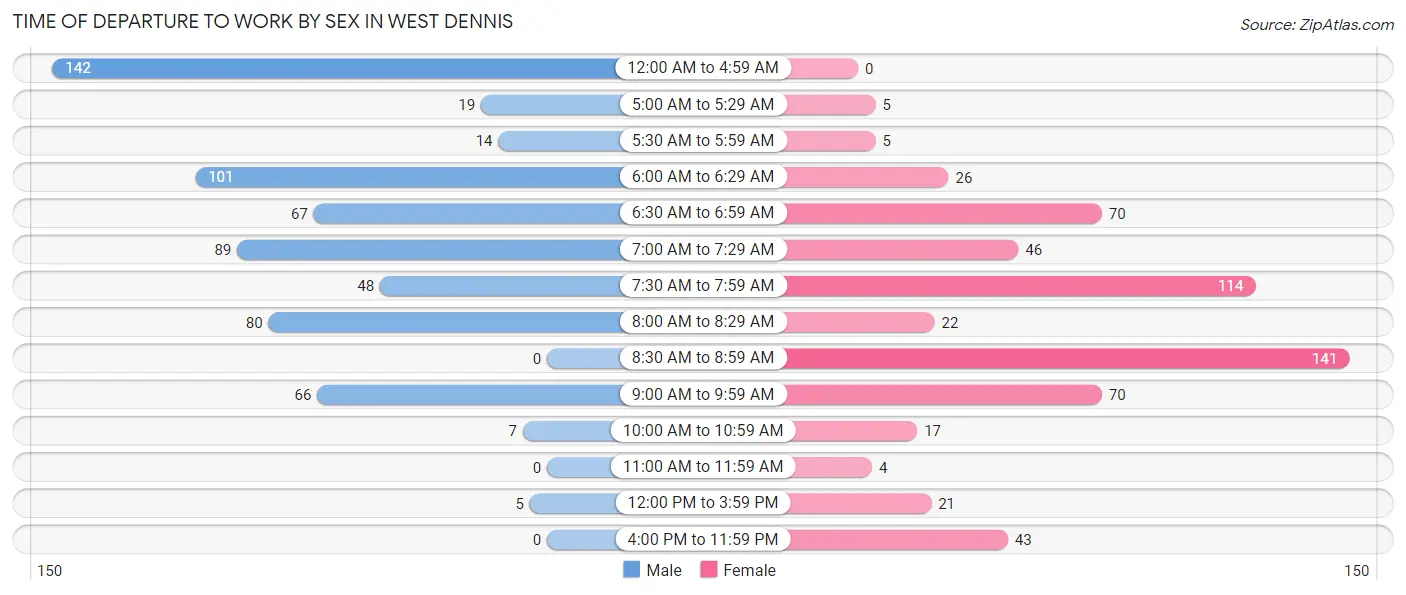
| Time of Departure | Male | Female |
| 12:00 AM to 4:59 AM | 142 (22.3%) | 0 (0.0%) |
| 5:00 AM to 5:29 AM | 19 (3.0%) | 5 (0.9%) |
| 5:30 AM to 5:59 AM | 14 (2.2%) | 5 (0.9%) |
| 6:00 AM to 6:29 AM | 101 (15.8%) | 26 (4.4%) |
| 6:30 AM to 6:59 AM | 67 (10.5%) | 70 (12.0%) |
| 7:00 AM to 7:29 AM | 89 (14.0%) | 46 (7.9%) |
| 7:30 AM to 7:59 AM | 48 (7.5%) | 114 (19.5%) |
| 8:00 AM to 8:29 AM | 80 (12.5%) | 22 (3.8%) |
| 8:30 AM to 8:59 AM | 0 (0.0%) | 141 (24.1%) |
| 9:00 AM to 9:59 AM | 66 (10.3%) | 70 (12.0%) |
| 10:00 AM to 10:59 AM | 7 (1.1%) | 17 (2.9%) |
| 11:00 AM to 11:59 AM | 0 (0.0%) | 4 (0.7%) |
| 12:00 PM to 3:59 PM | 5 (0.8%) | 21 (3.6%) |
| 4:00 PM to 11:59 PM | 0 (0.0%) | 43 (7.4%) |
| Total | 638 (100.0%) | 584 (100.0%) |
Housing Occupancy in West Dennis
Occupancy by Ownership in West Dennis
Of the total 1,304 dwellings in West Dennis, owner-occupied units account for 971 (74.5%), while renter-occupied units make up 333 (25.5%).
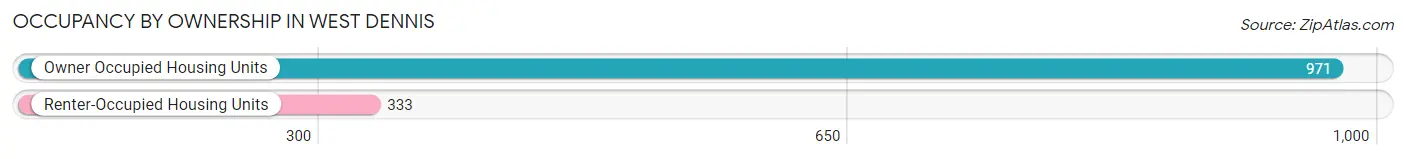
| Occupancy | # Housing Units | % Housing Units |
| Owner Occupied Housing Units | 971 | 74.5% |
| Renter-Occupied Housing Units | 333 | 25.5% |
| Total Occupied Housing Units | 1,304 | 100.0% |
Occupancy by Household Size in West Dennis
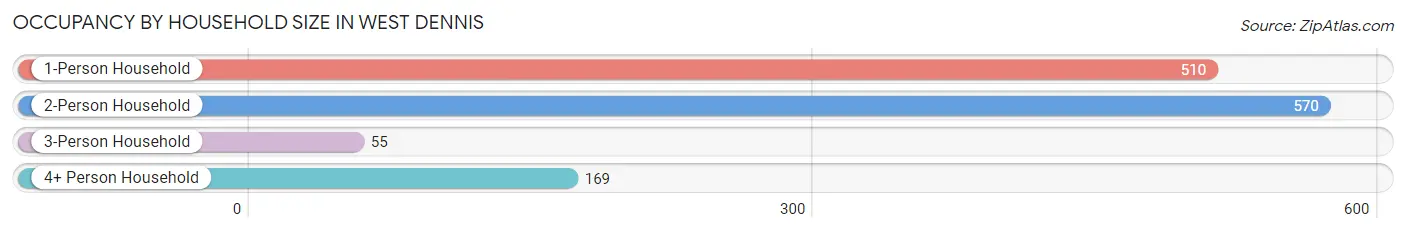
| Household Size | # Housing Units | % Housing Units |
| 1-Person Household | 510 | 39.1% |
| 2-Person Household | 570 | 43.7% |
| 3-Person Household | 55 | 4.2% |
| 4+ Person Household | 169 | 13.0% |
| Total Housing Units | 1,304 | 100.0% |
Occupancy by Ownership by Household Size in West Dennis
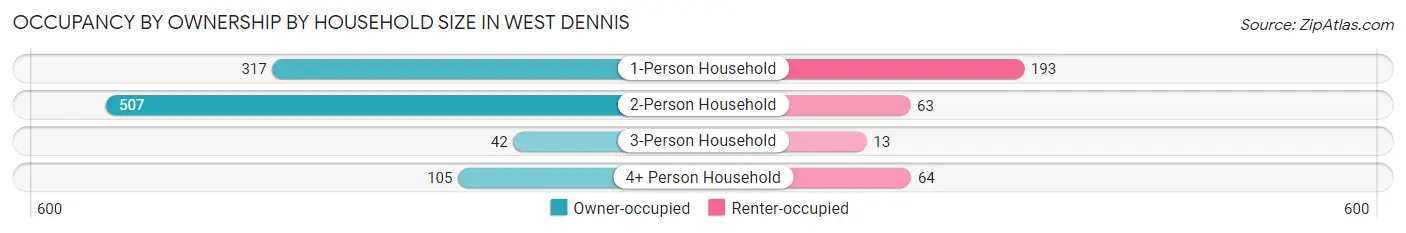
| Household Size | Owner-occupied | Renter-occupied |
| 1-Person Household | 317 (62.2%) | 193 (37.8%) |
| 2-Person Household | 507 (88.9%) | 63 (11.1%) |
| 3-Person Household | 42 (76.4%) | 13 (23.6%) |
| 4+ Person Household | 105 (62.1%) | 64 (37.9%) |
| Total Housing Units | 971 (74.5%) | 333 (25.5%) |
Occupancy by Educational Attainment in West Dennis
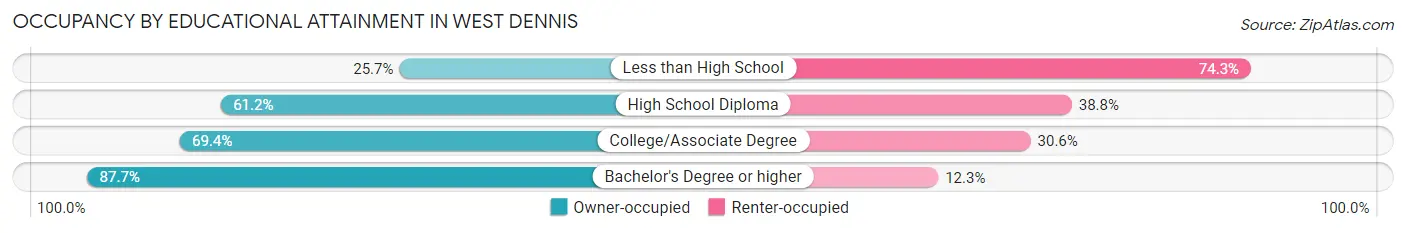
| Household Size | Owner-occupied | Renter-occupied |
| Less than High School | 9 (25.7%) | 26 (74.3%) |
| High School Diploma | 213 (61.2%) | 135 (38.8%) |
| College/Associate Degree | 222 (69.4%) | 98 (30.6%) |
| Bachelor's Degree or higher | 527 (87.7%) | 74 (12.3%) |
Occupancy by Age of Householder in West Dennis
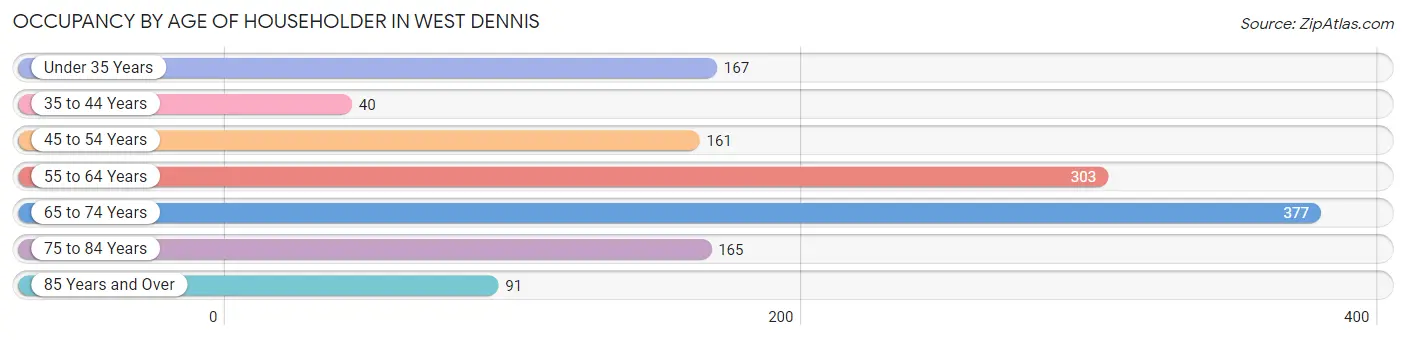
| Age Bracket | # Households | % Households |
| Under 35 Years | 167 | 12.8% |
| 35 to 44 Years | 40 | 3.1% |
| 45 to 54 Years | 161 | 12.3% |
| 55 to 64 Years | 303 | 23.2% |
| 65 to 74 Years | 377 | 28.9% |
| 75 to 84 Years | 165 | 12.7% |
| 85 Years and Over | 91 | 7.0% |
| Total | 1,304 | 100.0% |
Housing Finances in West Dennis
Median Income by Occupancy in West Dennis
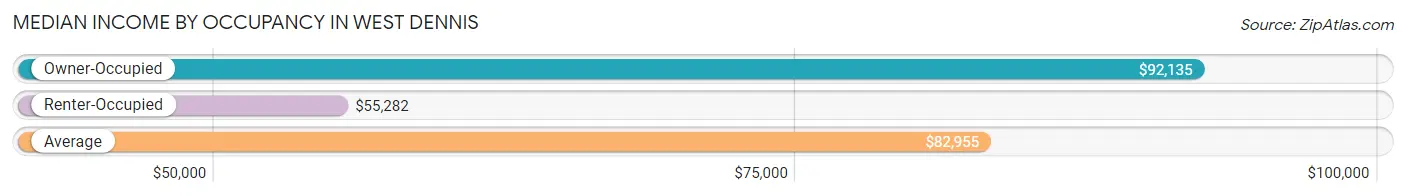
| Occupancy Type | # Households | Median Income |
| Owner-Occupied | 971 (74.5%) | $92,135 |
| Renter-Occupied | 333 (25.5%) | $55,282 |
| Average | 1,304 (100.0%) | $82,955 |
Occupancy by Householder Income Bracket in West Dennis
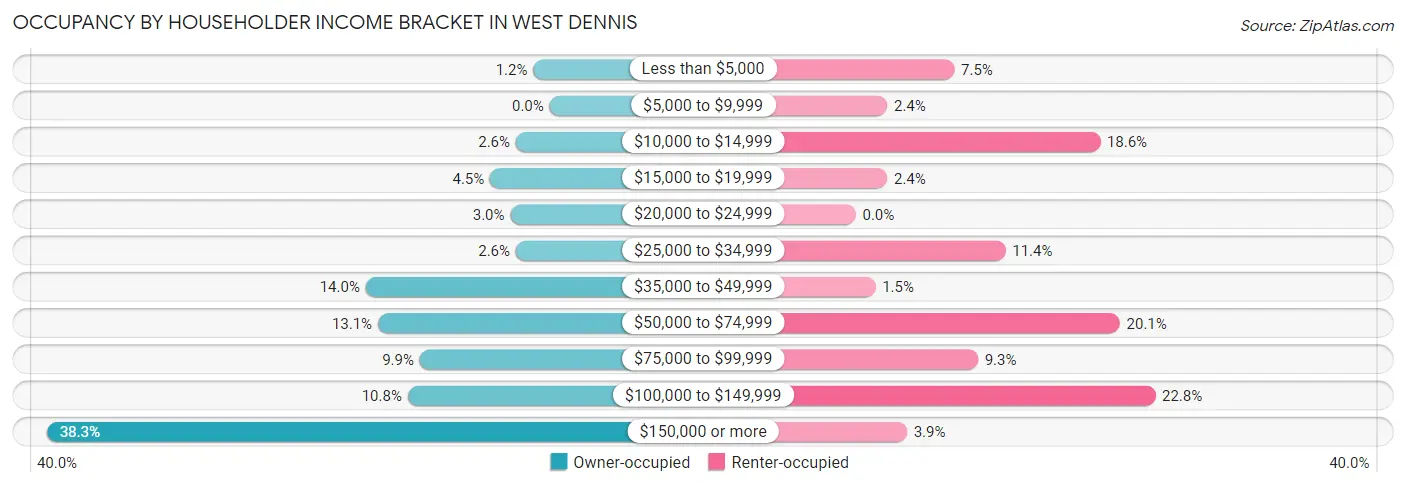
| Income Bracket | Owner-occupied | Renter-occupied |
| Less than $5,000 | 12 (1.2%) | 25 (7.5%) |
| $5,000 to $9,999 | 0 (0.0%) | 8 (2.4%) |
| $10,000 to $14,999 | 25 (2.6%) | 62 (18.6%) |
| $15,000 to $19,999 | 44 (4.5%) | 8 (2.4%) |
| $20,000 to $24,999 | 29 (3.0%) | 0 (0.0%) |
| $25,000 to $34,999 | 25 (2.6%) | 38 (11.4%) |
| $35,000 to $49,999 | 136 (14.0%) | 5 (1.5%) |
| $50,000 to $74,999 | 127 (13.1%) | 67 (20.1%) |
| $75,000 to $99,999 | 96 (9.9%) | 31 (9.3%) |
| $100,000 to $149,999 | 105 (10.8%) | 76 (22.8%) |
| $150,000 or more | 372 (38.3%) | 13 (3.9%) |
| Total | 971 (100.0%) | 333 (100.0%) |
Monthly Housing Cost Tiers in West Dennis
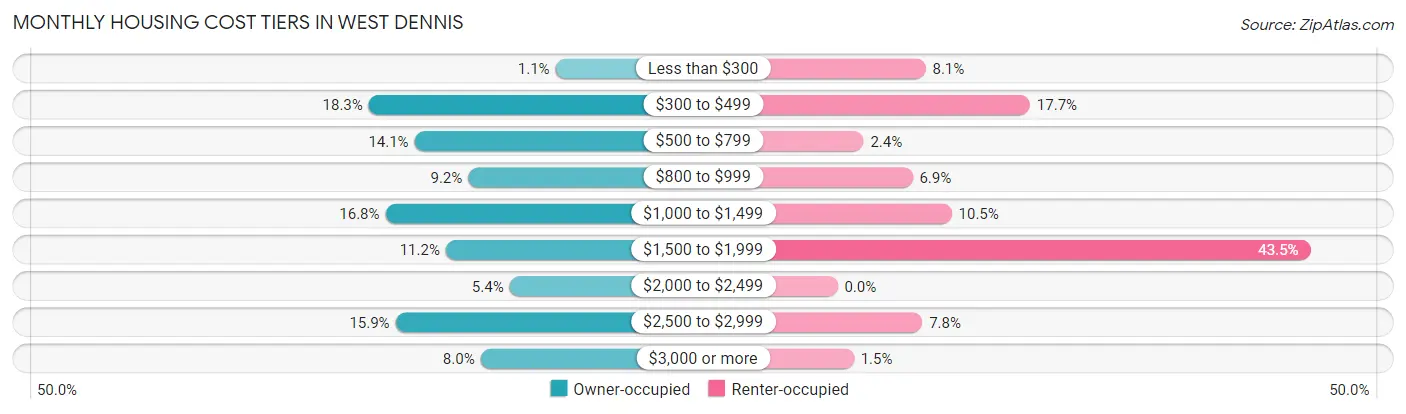
| Monthly Cost | Owner-occupied | Renter-occupied |
| Less than $300 | 11 (1.1%) | 27 (8.1%) |
| $300 to $499 | 178 (18.3%) | 59 (17.7%) |
| $500 to $799 | 137 (14.1%) | 8 (2.4%) |
| $800 to $999 | 89 (9.2%) | 23 (6.9%) |
| $1,000 to $1,499 | 163 (16.8%) | 35 (10.5%) |
| $1,500 to $1,999 | 109 (11.2%) | 145 (43.5%) |
| $2,000 to $2,499 | 52 (5.4%) | 0 (0.0%) |
| $2,500 to $2,999 | 154 (15.9%) | 26 (7.8%) |
| $3,000 or more | 78 (8.0%) | 5 (1.5%) |
| Total | 971 (100.0%) | 333 (100.0%) |
Physical Housing Characteristics in West Dennis
Housing Structures in West Dennis
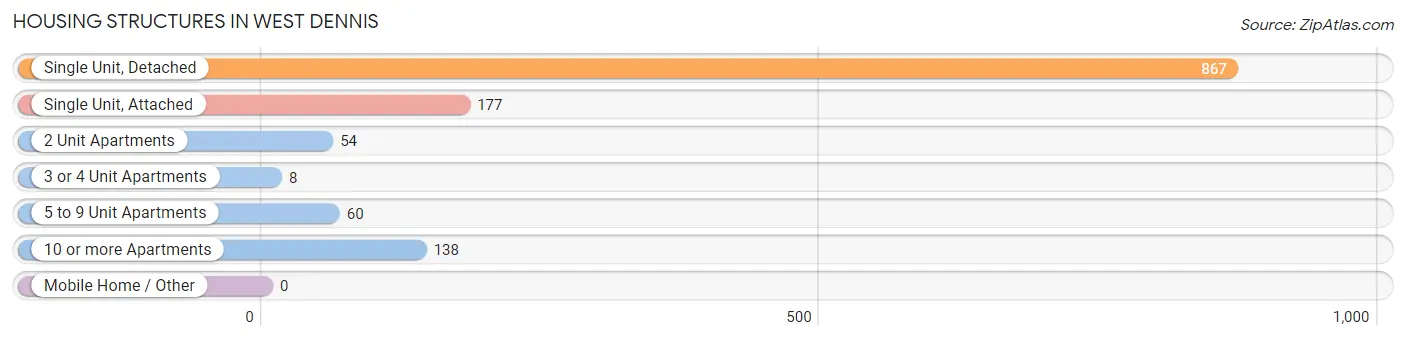
| Structure Type | # Housing Units | % Housing Units |
| Single Unit, Detached | 867 | 66.5% |
| Single Unit, Attached | 177 | 13.6% |
| 2 Unit Apartments | 54 | 4.1% |
| 3 or 4 Unit Apartments | 8 | 0.6% |
| 5 to 9 Unit Apartments | 60 | 4.6% |
| 10 or more Apartments | 138 | 10.6% |
| Mobile Home / Other | 0 | 0.0% |
| Total | 1,304 | 100.0% |
Housing Structures by Occupancy in West Dennis
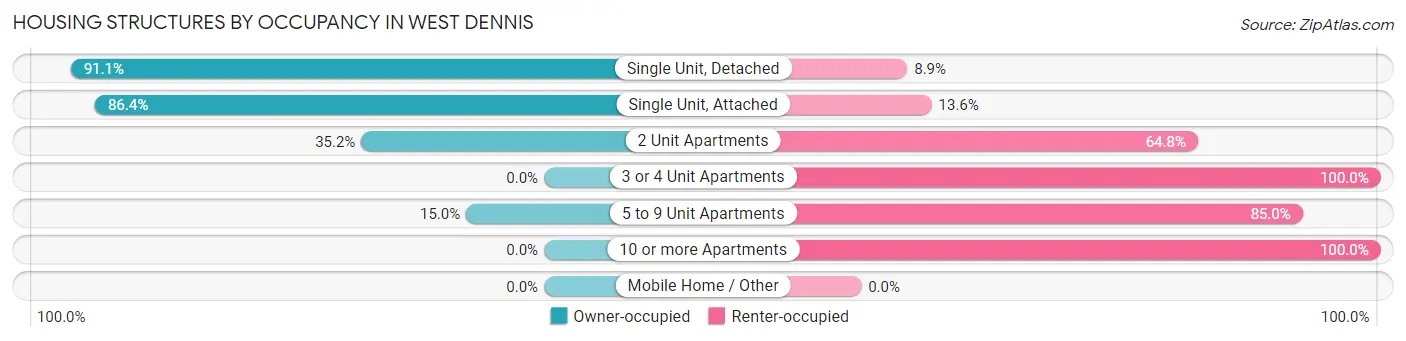
| Structure Type | Owner-occupied | Renter-occupied |
| Single Unit, Detached | 790 (91.1%) | 77 (8.9%) |
| Single Unit, Attached | 153 (86.4%) | 24 (13.6%) |
| 2 Unit Apartments | 19 (35.2%) | 35 (64.8%) |
| 3 or 4 Unit Apartments | 0 (0.0%) | 8 (100.0%) |
| 5 to 9 Unit Apartments | 9 (15.0%) | 51 (85.0%) |
| 10 or more Apartments | 0 (0.0%) | 138 (100.0%) |
| Mobile Home / Other | 0 (0.0%) | 0 (0.0%) |
| Total | 971 (74.5%) | 333 (25.5%) |
Housing Structures by Number of Rooms in West Dennis
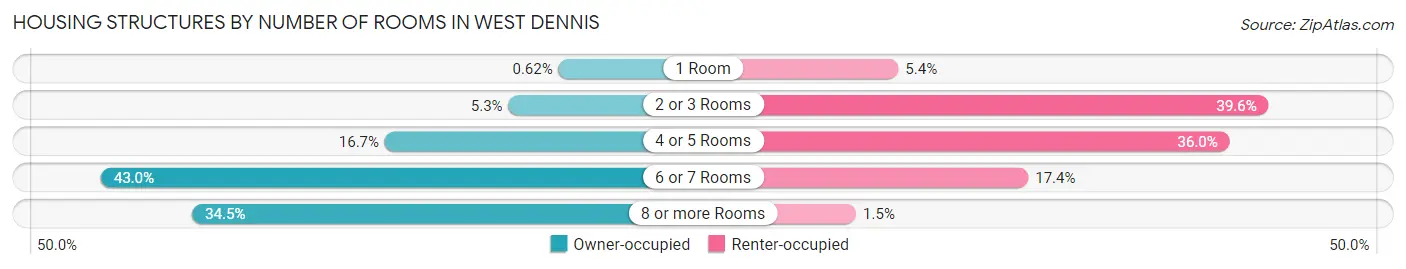
| Number of Rooms | Owner-occupied | Renter-occupied |
| 1 Room | 6 (0.6%) | 18 (5.4%) |
| 2 or 3 Rooms | 51 (5.2%) | 132 (39.6%) |
| 4 or 5 Rooms | 162 (16.7%) | 120 (36.0%) |
| 6 or 7 Rooms | 417 (42.9%) | 58 (17.4%) |
| 8 or more Rooms | 335 (34.5%) | 5 (1.5%) |
| Total | 971 (100.0%) | 333 (100.0%) |
Housing Structure by Heating Type in West Dennis
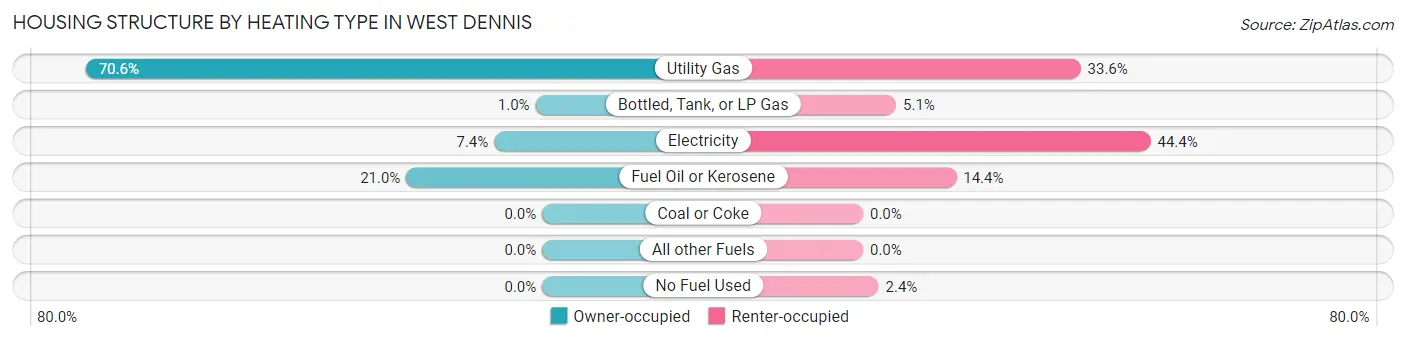
| Heating Type | Owner-occupied | Renter-occupied |
| Utility Gas | 685 (70.6%) | 112 (33.6%) |
| Bottled, Tank, or LP Gas | 10 (1.0%) | 17 (5.1%) |
| Electricity | 72 (7.4%) | 148 (44.4%) |
| Fuel Oil or Kerosene | 204 (21.0%) | 48 (14.4%) |
| Coal or Coke | 0 (0.0%) | 0 (0.0%) |
| All other Fuels | 0 (0.0%) | 0 (0.0%) |
| No Fuel Used | 0 (0.0%) | 8 (2.4%) |
| Total | 971 (100.0%) | 333 (100.0%) |
Household Vehicle Usage in West Dennis
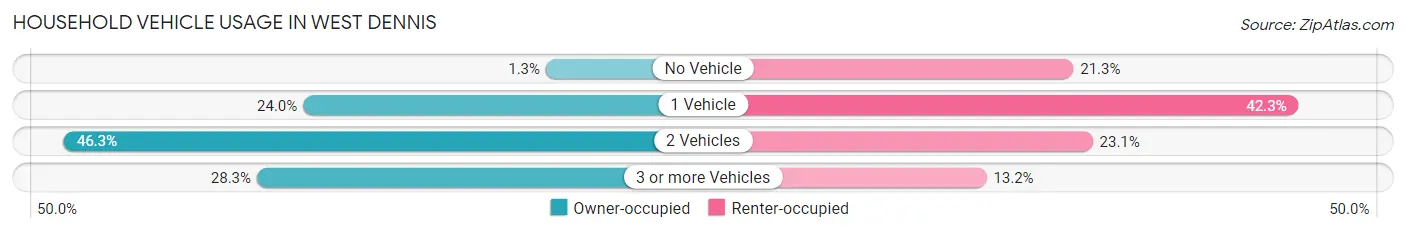
| Vehicles per Household | Owner-occupied | Renter-occupied |
| No Vehicle | 13 (1.3%) | 71 (21.3%) |
| 1 Vehicle | 233 (24.0%) | 141 (42.3%) |
| 2 Vehicles | 450 (46.3%) | 77 (23.1%) |
| 3 or more Vehicles | 275 (28.3%) | 44 (13.2%) |
| Total | 971 (100.0%) | 333 (100.0%) |
Real Estate & Mortgages in West Dennis
Real Estate and Mortgage Overview in West Dennis
| Characteristic | Without Mortgage | With Mortgage |
| Housing Units | 447 | 524 |
| Median Property Value | $429,700 | $561,300 |
| Median Household Income | $81,750 | $223 |
| Monthly Housing Costs | $599 | $78 |
| Real Estate Taxes | $2,467 | $38 |
Property Value by Mortgage Status in West Dennis
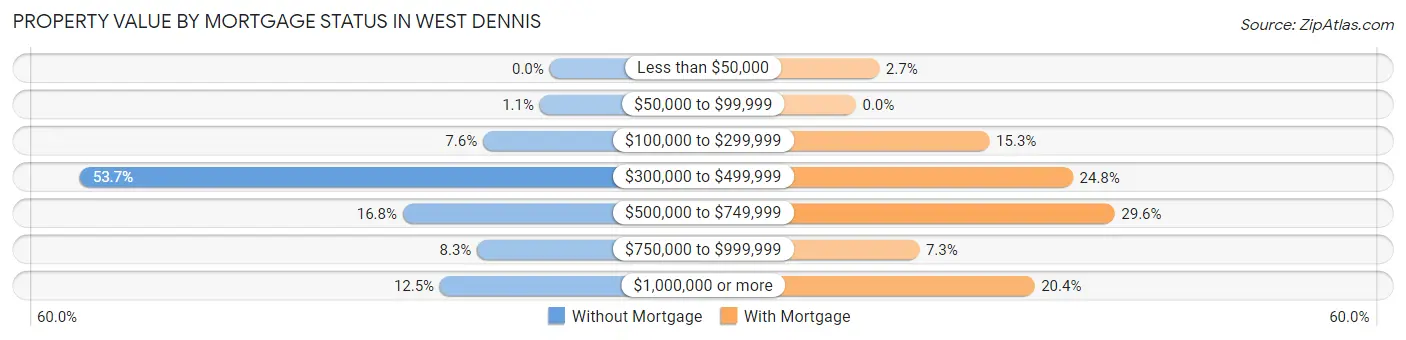
| Property Value | Without Mortgage | With Mortgage |
| Less than $50,000 | 0 (0.0%) | 14 (2.7%) |
| $50,000 to $99,999 | 5 (1.1%) | 0 (0.0%) |
| $100,000 to $299,999 | 34 (7.6%) | 80 (15.3%) |
| $300,000 to $499,999 | 240 (53.7%) | 130 (24.8%) |
| $500,000 to $749,999 | 75 (16.8%) | 155 (29.6%) |
| $750,000 to $999,999 | 37 (8.3%) | 38 (7.2%) |
| $1,000,000 or more | 56 (12.5%) | 107 (20.4%) |
| Total | 447 (100.0%) | 524 (100.0%) |
Household Income by Mortgage Status in West Dennis
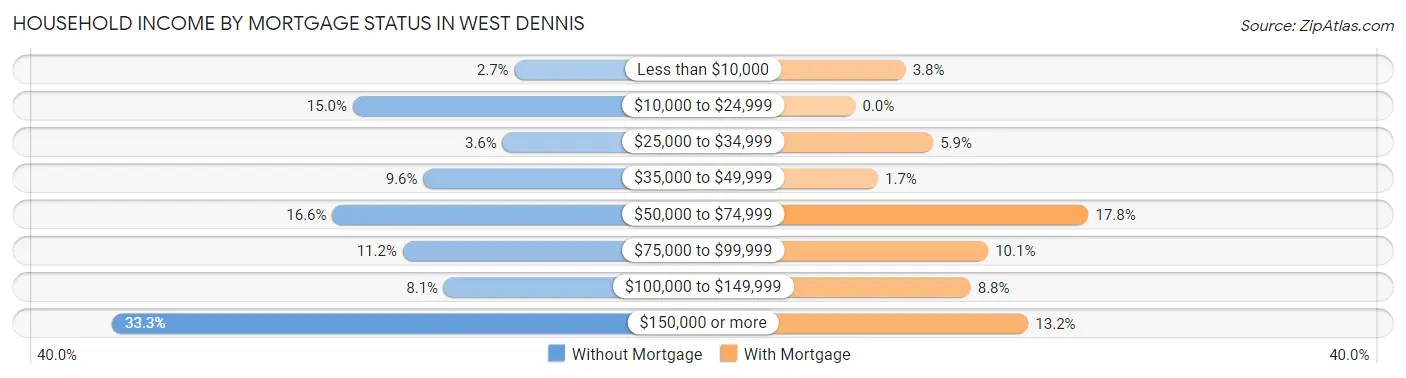
| Household Income | Without Mortgage | With Mortgage |
| Less than $10,000 | 12 (2.7%) | 20 (3.8%) |
| $10,000 to $24,999 | 67 (15.0%) | 0 (0.0%) |
| $25,000 to $34,999 | 16 (3.6%) | 31 (5.9%) |
| $35,000 to $49,999 | 43 (9.6%) | 9 (1.7%) |
| $50,000 to $74,999 | 74 (16.6%) | 93 (17.7%) |
| $75,000 to $99,999 | 50 (11.2%) | 53 (10.1%) |
| $100,000 to $149,999 | 36 (8.1%) | 46 (8.8%) |
| $150,000 or more | 149 (33.3%) | 69 (13.2%) |
| Total | 447 (100.0%) | 524 (100.0%) |
Property Value to Household Income Ratio in West Dennis
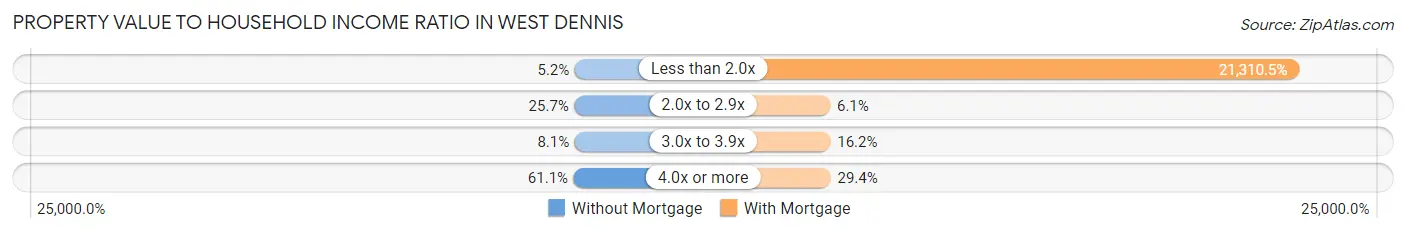
| Value-to-Income Ratio | Without Mortgage | With Mortgage |
| Less than 2.0x | 23 (5.1%) | 111,667 (21,310.5%) |
| 2.0x to 2.9x | 115 (25.7%) | 32 (6.1%) |
| 3.0x to 3.9x | 36 (8.1%) | 85 (16.2%) |
| 4.0x or more | 273 (61.1%) | 154 (29.4%) |
| Total | 447 (100.0%) | 524 (100.0%) |
Real Estate Taxes by Mortgage Status in West Dennis
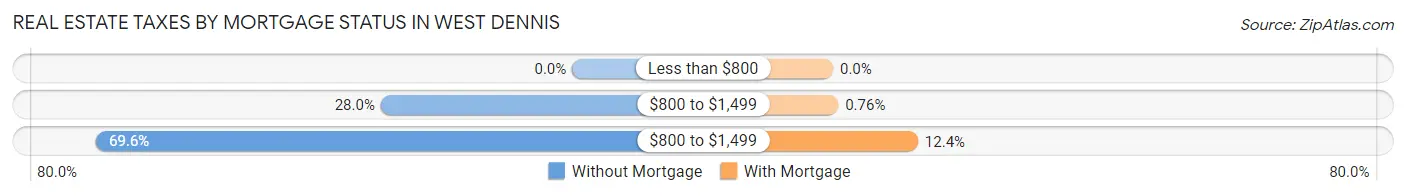
| Property Taxes | Without Mortgage | With Mortgage |
| Less than $800 | 0 (0.0%) | 0 (0.0%) |
| $800 to $1,499 | 125 (28.0%) | 4 (0.8%) |
| $800 to $1,499 | 311 (69.6%) | 65 (12.4%) |
| Total | 447 (100.0%) | 524 (100.0%) |
Health & Disability in West Dennis
Health Insurance Coverage by Age in West Dennis
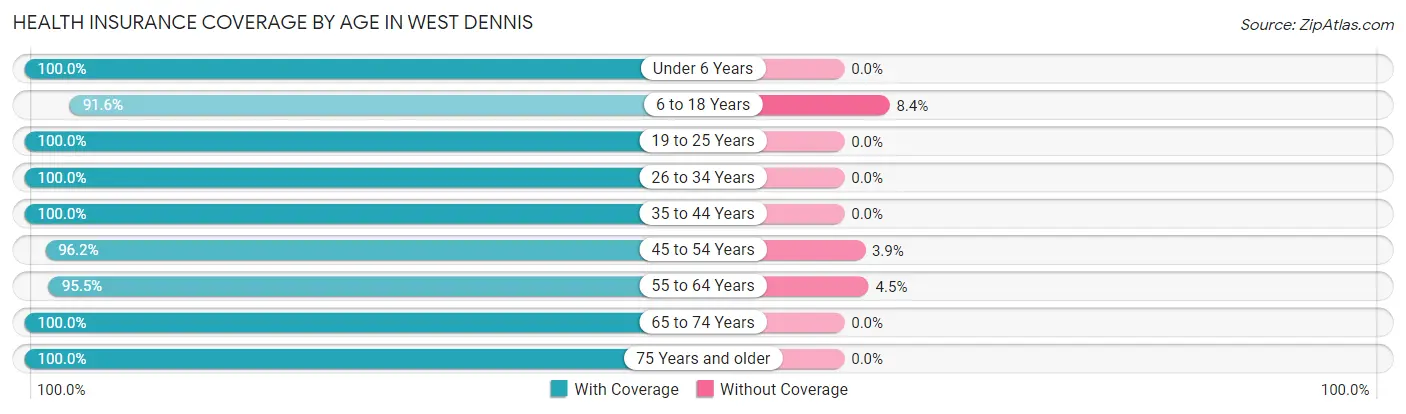
| Age Bracket | With Coverage | Without Coverage |
| Under 6 Years | 17 (100.0%) | 0 (0.0%) |
| 6 to 18 Years | 174 (91.6%) | 16 (8.4%) |
| 19 to 25 Years | 374 (100.0%) | 0 (0.0%) |
| 26 to 34 Years | 103 (100.0%) | 0 (0.0%) |
| 35 to 44 Years | 171 (100.0%) | 0 (0.0%) |
| 45 to 54 Years | 400 (96.2%) | 16 (3.8%) |
| 55 to 64 Years | 463 (95.5%) | 22 (4.5%) |
| 65 to 74 Years | 618 (100.0%) | 0 (0.0%) |
| 75 Years and older | 358 (100.0%) | 0 (0.0%) |
| Total | 2,678 (98.0%) | 54 (2.0%) |
Health Insurance Coverage by Citizenship Status in West Dennis
| Citizenship Status | With Coverage | Without Coverage |
| Native Born | 17 (100.0%) | 0 (0.0%) |
| Foreign Born, Citizen | 174 (91.6%) | 16 (8.4%) |
| Foreign Born, not a Citizen | 374 (100.0%) | 0 (0.0%) |
Health Insurance Coverage by Household Income in West Dennis
| Household Income | With Coverage | Without Coverage |
| Under $25,000 | 232 (100.0%) | 0 (0.0%) |
| $25,000 to $49,999 | 286 (94.7%) | 16 (5.3%) |
| $50,000 to $74,999 | 375 (98.7%) | 5 (1.3%) |
| $75,000 to $99,999 | 209 (88.9%) | 26 (11.1%) |
| $100,000 and over | 1,576 (99.6%) | 7 (0.4%) |
Public vs Private Health Insurance Coverage by Age in West Dennis
| Age Bracket | Public Insurance | Private Insurance |
| Under 6 | 0 (0.0%) | 17 (100.0%) |
| 6 to 18 Years | 162 (85.3%) | 63 (33.2%) |
| 19 to 25 Years | 48 (12.8%) | 326 (87.2%) |
| 25 to 34 Years | 13 (12.6%) | 90 (87.4%) |
| 35 to 44 Years | 131 (76.6%) | 54 (31.6%) |
| 45 to 54 Years | 232 (55.8%) | 210 (50.5%) |
| 55 to 64 Years | 164 (33.8%) | 359 (74.0%) |
| 65 to 74 Years | 589 (95.3%) | 423 (68.4%) |
| 75 Years and over | 358 (100.0%) | 256 (71.5%) |
| Total | 1,697 (62.1%) | 1,798 (65.8%) |
Disability Status by Sex by Age in West Dennis
| Age Bracket | Male | Female |
| Under 5 Years | 0 (0.0%) | 0 (0.0%) |
| 5 to 17 Years | 0 (0.0%) | 0 (0.0%) |
| 18 to 34 Years | 13 (5.7%) | 0 (0.0%) |
| 35 to 64 Years | 63 (12.5%) | 73 (12.9%) |
| 65 to 74 Years | 49 (18.5%) | 65 (18.4%) |
| 75 Years and over | 103 (64.4%) | 89 (45.0%) |
Disability Class by Sex by Age in West Dennis
Disability Class: Hearing Difficulty
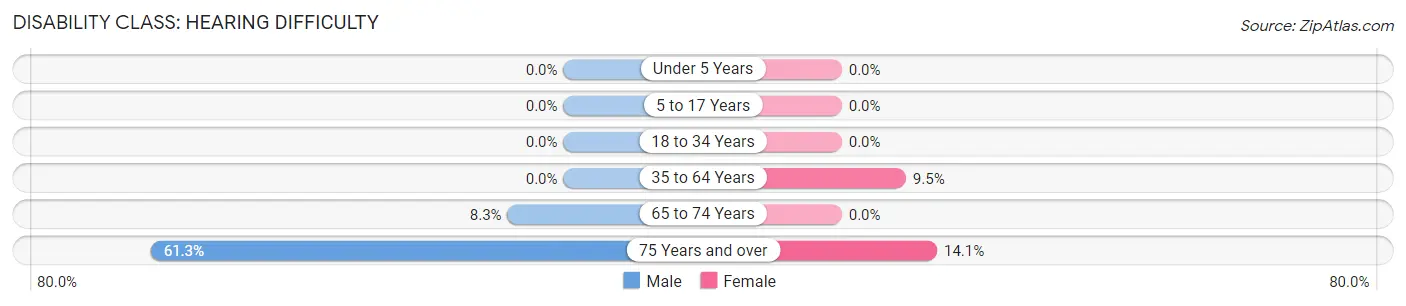
| Age Bracket | Male | Female |
| Under 5 Years | 0 (0.0%) | 0 (0.0%) |
| 5 to 17 Years | 0 (0.0%) | 0 (0.0%) |
| 18 to 34 Years | 0 (0.0%) | 0 (0.0%) |
| 35 to 64 Years | 0 (0.0%) | 54 (9.5%) |
| 65 to 74 Years | 22 (8.3%) | 0 (0.0%) |
| 75 Years and over | 98 (61.3%) | 28 (14.1%) |
Disability Class: Vision Difficulty
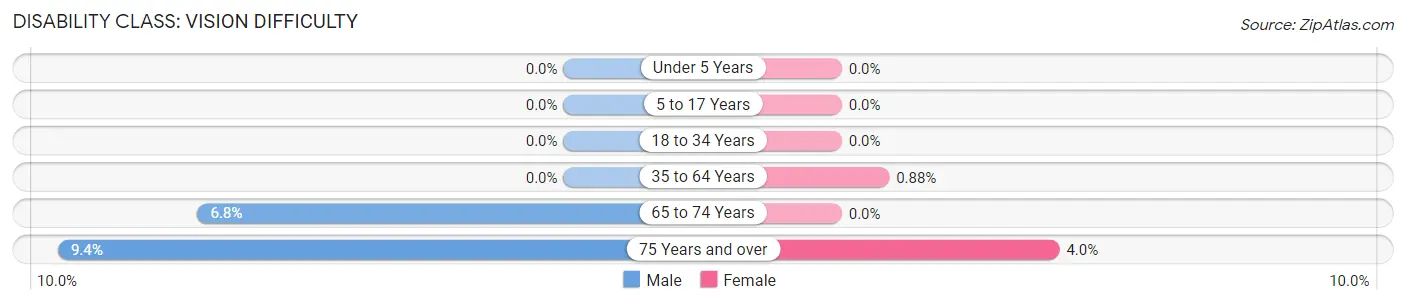
| Age Bracket | Male | Female |
| Under 5 Years | 0 (0.0%) | 0 (0.0%) |
| 5 to 17 Years | 0 (0.0%) | 0 (0.0%) |
| 18 to 34 Years | 0 (0.0%) | 0 (0.0%) |
| 35 to 64 Years | 0 (0.0%) | 5 (0.9%) |
| 65 to 74 Years | 18 (6.8%) | 0 (0.0%) |
| 75 Years and over | 15 (9.4%) | 8 (4.0%) |
Disability Class: Cognitive Difficulty
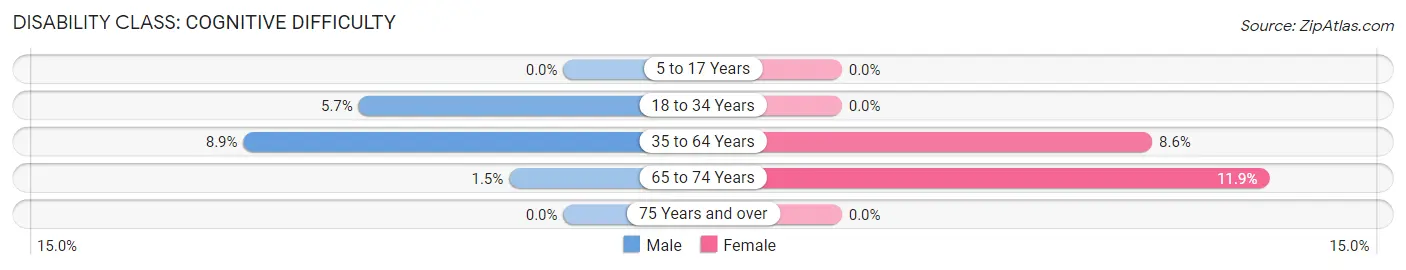
| Age Bracket | Male | Female |
| 5 to 17 Years | 0 (0.0%) | 0 (0.0%) |
| 18 to 34 Years | 13 (5.7%) | 0 (0.0%) |
| 35 to 64 Years | 45 (8.9%) | 49 (8.6%) |
| 65 to 74 Years | 4 (1.5%) | 42 (11.9%) |
| 75 Years and over | 0 (0.0%) | 0 (0.0%) |
Disability Class: Ambulatory Difficulty
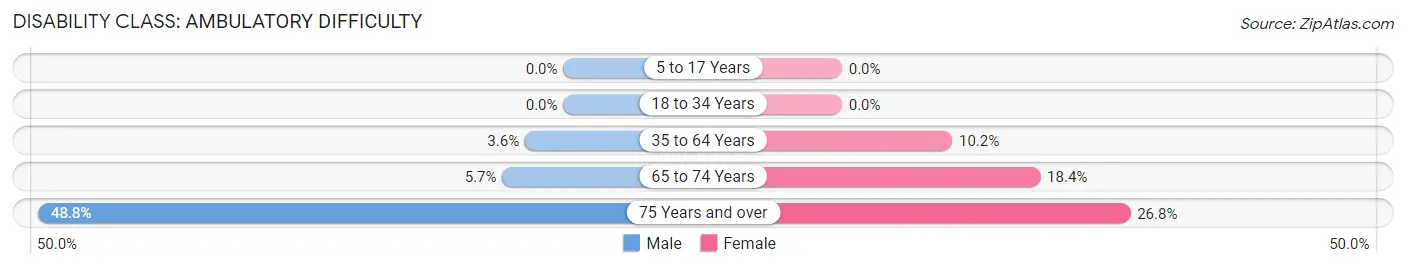
| Age Bracket | Male | Female |
| 5 to 17 Years | 0 (0.0%) | 0 (0.0%) |
| 18 to 34 Years | 0 (0.0%) | 0 (0.0%) |
| 35 to 64 Years | 18 (3.6%) | 58 (10.2%) |
| 65 to 74 Years | 15 (5.7%) | 65 (18.4%) |
| 75 Years and over | 78 (48.7%) | 53 (26.8%) |
Disability Class: Self-Care Difficulty
| Age Bracket | Male | Female |
| 5 to 17 Years | 0 (0.0%) | 0 (0.0%) |
| 18 to 34 Years | 0 (0.0%) | 0 (0.0%) |
| 35 to 64 Years | 0 (0.0%) | 0 (0.0%) |
| 65 to 74 Years | 0 (0.0%) | 12 (3.4%) |
| 75 Years and over | 0 (0.0%) | 8 (4.0%) |
Technology Access in West Dennis
Computing Device Access in West Dennis
| Device Type | # Households | % Households |
| Desktop or Laptop | 1,061 | 81.4% |
| Smartphone | 1,166 | 89.4% |
| Tablet | 871 | 66.8% |
| No Computing Device | 61 | 4.7% |
| Total | 1,304 | 100.0% |
Internet Access in West Dennis
| Internet Type | # Households | % Households |
| Dial-Up Internet | 0 | 0.0% |
| Broadband Home | 1,089 | 83.5% |
| Cellular Data Only | 90 | 6.9% |
| Satellite Internet | 38 | 2.9% |
| No Internet | 125 | 9.6% |
| Total | 1,304 | 100.0% |
West Dennis Summary
History
West Dennis is a small town located in the southeastern corner of Massachusetts, in the county of Barnstable. It is situated on the south side of Cape Cod, and is bordered by the towns of Dennis, Yarmouth, and Brewster. The town was first settled in 1639, and was originally part of the town of Yarmouth. In 1793, the town was officially incorporated as West Dennis.
The town was originally a farming community, and the main crops were cranberries and potatoes. In the late 19th century, the town began to develop as a summer resort destination. The town was known for its beautiful beaches, and many wealthy families built large summer homes in the area. The town also became a popular spot for fishing, and the local economy was bolstered by the fishing industry.
In the early 20th century, the town began to develop as a year-round community. The town was home to several small businesses, including a general store, a post office, and a few restaurants. The town also had a small school, and a library.
Geography
West Dennis is located in the southeastern corner of Massachusetts, in the county of Barnstable. It is situated on the south side of Cape Cod, and is bordered by the towns of Dennis, Yarmouth, and Brewster. The town is located on the shores of Nantucket Sound, and is home to several beaches, including West Dennis Beach, Glendon Beach, and Sea Street Beach. The town is also home to several ponds, including Bass River Pond, Swan Pond, and Long Pond.
The town has a total area of 8.2 square miles, of which 7.9 square miles is land and 0.3 square miles is water. The town is mostly flat, with some rolling hills in the northern part of town. The highest point in the town is located at the intersection of Old Wharf Road and Old Bass River Road, and is approximately 80 feet above sea level.
Economy
The economy of West Dennis is largely based on tourism and the fishing industry. The town is home to several beaches, which attract visitors from all over the region. The town is also home to several restaurants, which cater to both locals and tourists. The town is also home to several small businesses, including a general store, a post office, and a few restaurants.
The fishing industry is also an important part of the local economy. The town is home to several commercial fishing boats, which bring in a variety of seafood, including lobster, scallops, and clams. The town also has several marinas, which provide services to recreational boaters.
Demographics
As of the 2010 census, the town of West Dennis had a population of 4,845. The population was spread out, with 2,845 people (58.7%) over the age of 18, 1,845 people (38.2%) under the age of 18, and 155 people (3.2%) over the age of 65. The median age of the population was 43.7 years.
The racial makeup of the town was 97.2% White, 0.7% African American, 0.3% Native American, 0.4% Asian, 0.1% Pacific Islander, 0.3% from other races, and 1.0% from two or more races. Hispanic or Latino of any race were 1.2% of the population.
The median household income in the town was $62,917, and the median family income was $76,250. The per capita income for the town was $32,917. About 4.2% of the population was below the poverty line.
Common Questions
What is Per Capita Income in West Dennis?
Per Capita income in West Dennis is $57,302.
What is the Median Family Income in West Dennis?
Median Family Income in West Dennis is $140,606.
What is the Median Household income in West Dennis?
Median Household Income in West Dennis is $82,955.
What is Income or Wage Gap in West Dennis?
Income or Wage Gap in West Dennis is 49.3%.
Women in West Dennis earn 50.7 cents for every dollar earned by a man.
What is Inequality or Gini Index in West Dennis?
Inequality or Gini Index in West Dennis is 0.48.
What is the Total Population of West Dennis?
Total Population of West Dennis is 2,732.
What is the Total Male Population of West Dennis?
Total Male Population of West Dennis is 1,273.
What is the Total Female Population of West Dennis?
Total Female Population of West Dennis is 1,459.
What is the Ratio of Males per 100 Females in West Dennis?
There are 87.25 Males per 100 Females in West Dennis.
What is the Ratio of Females per 100 Males in West Dennis?
There are 114.61 Females per 100 Males in West Dennis.
What is the Median Population Age in West Dennis?
Median Population Age in West Dennis is 57.3 Years.
What is the Average Family Size in West Dennis
Average Family Size in West Dennis is 2.8 People.
What is the Average Household Size in West Dennis
Average Household Size in West Dennis is 2.1 People.
How Large is the Labor Force in West Dennis?
There are 1,491 People in the Labor Forcein in West Dennis.
What is the Percentage of People in the Labor Force in West Dennis?
58.5% of People are in the Labor Force in West Dennis.
What is the Unemployment Rate in West Dennis?
Unemployment Rate in West Dennis is 1.7%.