Manhattan, KS Map & Demographics
Manhattan Map
Manhattan Overview
$32,863
PER CAPITA INCOME
$87,377
AVG FAMILY INCOME
$55,316
AVG HOUSEHOLD INCOME
39.1%
WAGE / INCOME GAP [ % ]
60.9¢/ $1
WAGE / INCOME GAP [ $ ]
$11,717
FAMILY INCOME DEFICIT
0.50
INEQUALITY / GINI INDEX
54,287
TOTAL POPULATION
28,156
MALE POPULATION
26,131
FEMALE POPULATION
107.75
MALES / 100 FEMALES
92.81
FEMALES / 100 MALES
24.7
MEDIAN AGE
2.8
AVG FAMILY SIZE
2.2
AVG HOUSEHOLD SIZE
32,383
LABOR FORCE [ PEOPLE ]
68.6%
PERCENT IN LABOR FORCE
4.5%
UNEMPLOYMENT RATE
Manhattan Area Codes
Income in Manhattan
Income Overview in Manhattan
Per Capita Income in Manhattan is $32,863, while median incomes of families and households are $87,377 and $55,316 respectively.
| Characteristic | Number | Measure |
| Per Capita Income | 54,287 | $32,863 |
| Median Family Income | 9,684 | $87,377 |
| Mean Family Income | 9,684 | $111,585 |
| Median Household Income | 21,428 | $55,316 |
| Mean Household Income | 21,428 | $78,054 |
| Income Deficit | 9,684 | $11,717 |
| Wage / Income Gap (%) | 54,287 | 39.07% |
| Wage / Income Gap ($) | 54,287 | 60.93¢ per $1 |
| Gini / Inequality Index | 54,287 | 0.50 |
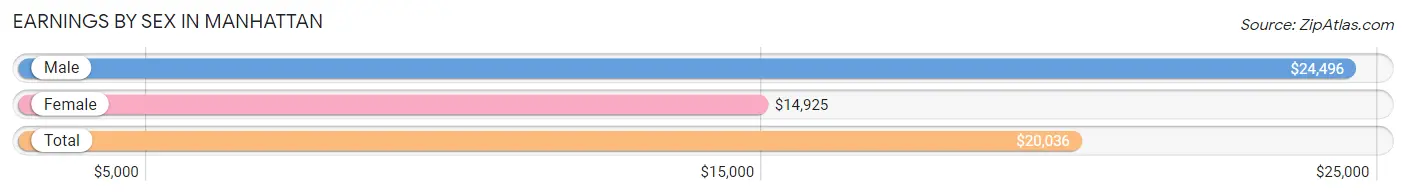
Earnings by Sex in Manhattan
Average Earnings in Manhattan are $20,036, $24,496 for men and $14,925 for women, a difference of 39.1%.
| Sex | Number | Average Earnings |
| Male | 19,773 (52.2%) | $24,496 |
| Female | 18,102 (47.8%) | $14,925 |
| Total | 37,875 (100.0%) | $20,036 |
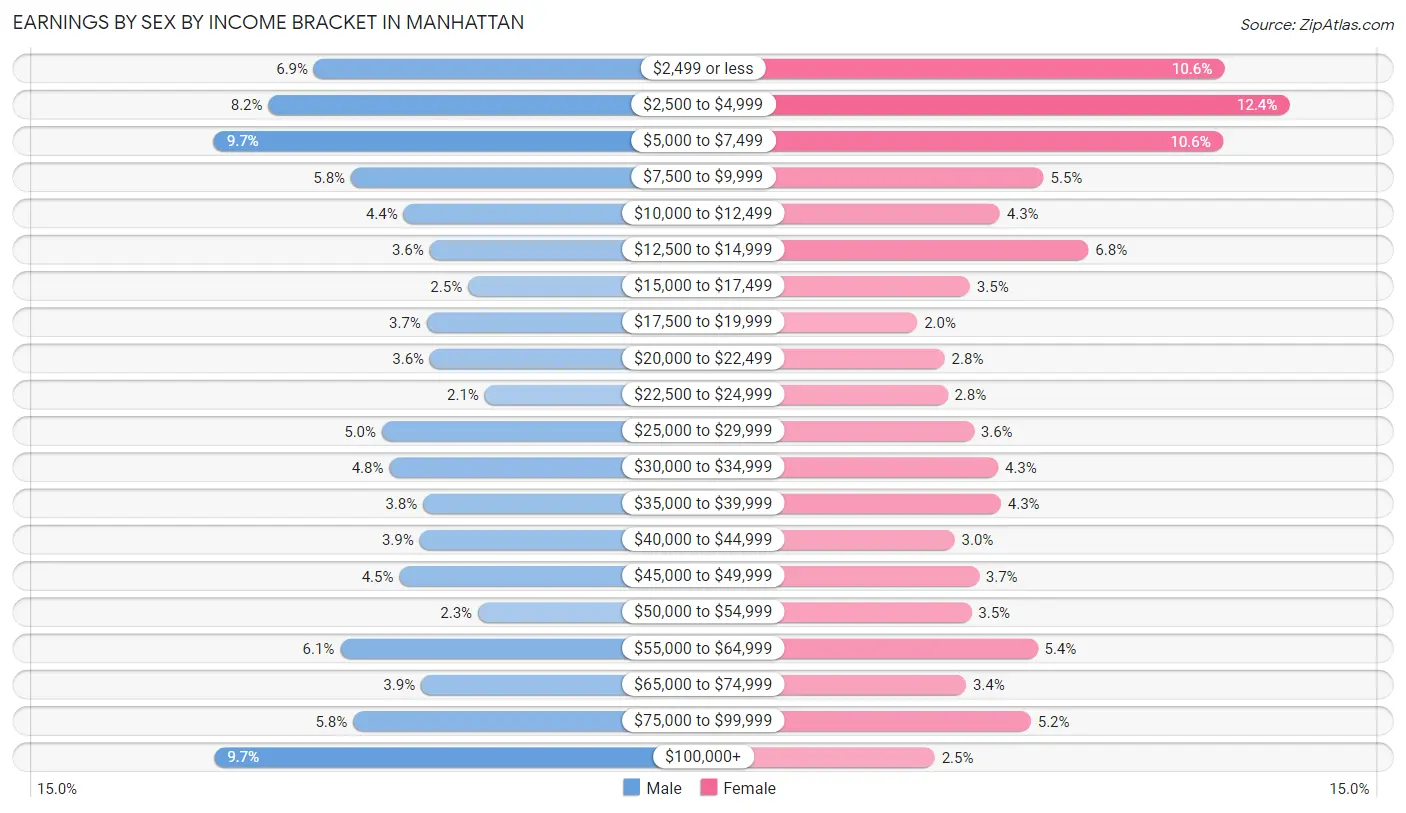
Earnings by Sex by Income Bracket in Manhattan
The most common earnings brackets in Manhattan are $5,000 to $7,499 for men (1,914 | 9.7%) and $2,500 to $4,999 for women (2,250 | 12.4%).
| Income | Male | Female |
| $2,499 or less | 1,358 (6.9%) | 1,918 (10.6%) |
| $2,500 to $4,999 | 1,611 (8.2%) | 2,250 (12.4%) |
| $5,000 to $7,499 | 1,914 (9.7%) | 1,912 (10.6%) |
| $7,500 to $9,999 | 1,153 (5.8%) | 1,001 (5.5%) |
| $10,000 to $12,499 | 861 (4.3%) | 778 (4.3%) |
| $12,500 to $14,999 | 715 (3.6%) | 1,229 (6.8%) |
| $15,000 to $17,499 | 502 (2.5%) | 627 (3.5%) |
| $17,500 to $19,999 | 732 (3.7%) | 359 (2.0%) |
| $20,000 to $22,499 | 714 (3.6%) | 498 (2.8%) |
| $22,500 to $24,999 | 409 (2.1%) | 513 (2.8%) |
| $25,000 to $29,999 | 980 (5.0%) | 647 (3.6%) |
| $30,000 to $34,999 | 940 (4.8%) | 770 (4.3%) |
| $35,000 to $39,999 | 752 (3.8%) | 784 (4.3%) |
| $40,000 to $44,999 | 772 (3.9%) | 549 (3.0%) |
| $45,000 to $49,999 | 884 (4.5%) | 671 (3.7%) |
| $50,000 to $54,999 | 447 (2.3%) | 634 (3.5%) |
| $55,000 to $64,999 | 1,213 (6.1%) | 971 (5.4%) |
| $65,000 to $74,999 | 764 (3.9%) | 607 (3.4%) |
| $75,000 to $99,999 | 1,140 (5.8%) | 936 (5.2%) |
| $100,000+ | 1,912 (9.7%) | 448 (2.5%) |
| Total | 19,773 (100.0%) | 18,102 (100.0%) |
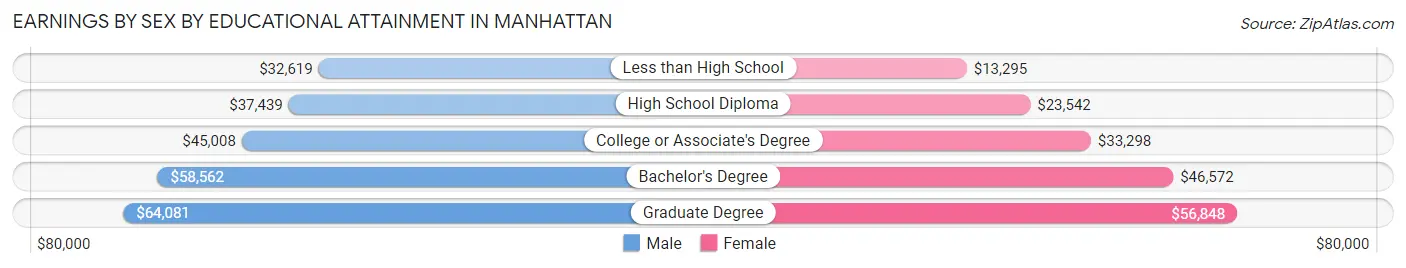
Earnings by Sex by Educational Attainment in Manhattan
Average earnings in Manhattan are $47,878 for men and $40,257 for women, a difference of 15.9%. Men with an educational attainment of graduate degree enjoy the highest average annual earnings of $64,081, while those with less than high school education earn the least with $32,619. Women with an educational attainment of graduate degree earn the most with the average annual earnings of $56,848, while those with less than high school education have the smallest earnings of $13,295.
| Educational Attainment | Male Income | Female Income |
| Less than High School | $32,619 | $13,295 |
| High School Diploma | $37,439 | $23,542 |
| College or Associate's Degree | $45,008 | $33,298 |
| Bachelor's Degree | $58,562 | $46,572 |
| Graduate Degree | $64,081 | $56,848 |
| Total | $47,878 | $40,257 |
Family Income in Manhattan
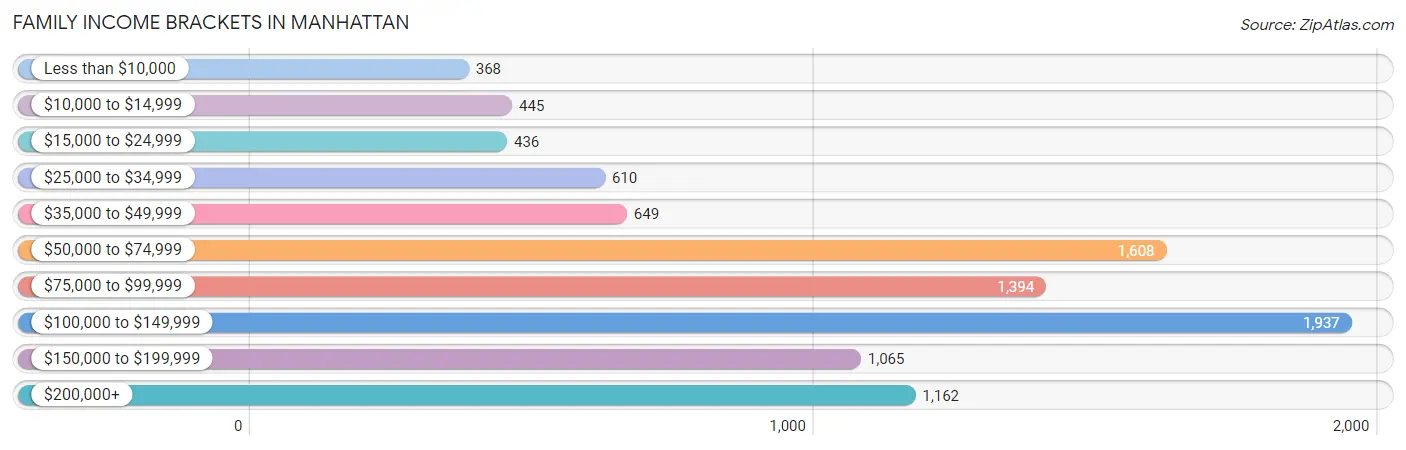
Family Income Brackets in Manhattan
According to the Manhattan family income data, there are 1,937 families falling into the $100,000 to $149,999 income range, which is the most common income bracket and makes up 20.0% of all families. Conversely, the less than $10,000 income bracket is the least frequent group with only 368 families (3.8%) belonging to this category.
| Income Bracket | # Families | % Families |
| Less than $10,000 | 368 | 3.8% |
| $10,000 to $14,999 | 445 | 4.6% |
| $15,000 to $24,999 | 436 | 4.5% |
| $25,000 to $34,999 | 610 | 6.3% |
| $35,000 to $49,999 | 649 | 6.7% |
| $50,000 to $74,999 | 1,608 | 16.6% |
| $75,000 to $99,999 | 1,394 | 14.4% |
| $100,000 to $149,999 | 1,937 | 20.0% |
| $150,000 to $199,999 | 1,065 | 11.0% |
| $200,000+ | 1,162 | 12.0% |
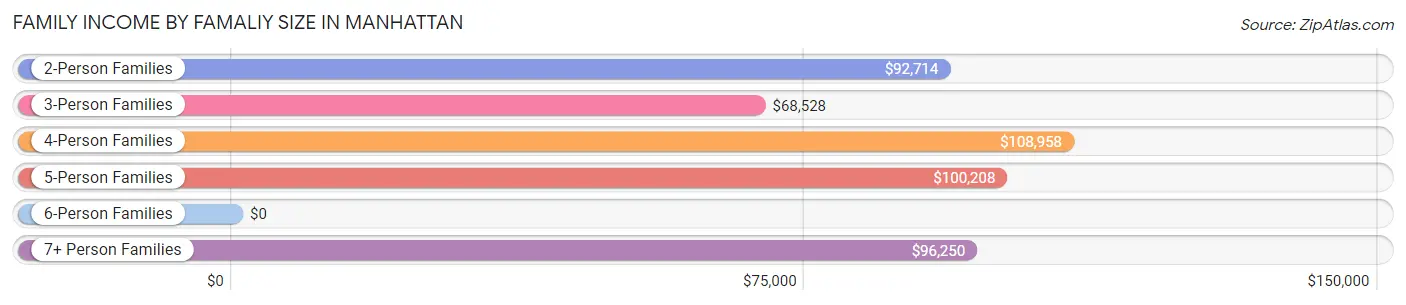
Family Income by Famaliy Size in Manhattan
4-person families (1,483 | 15.3%) account for the highest median family income in Manhattan with $108,958 per family, while 2-person families (5,024 | 51.9%) have the highest median income of $46,357 per family member.
| Income Bracket | # Families | Median Income |
| 2-Person Families | 5,024 (51.9%) | $92,714 |
| 3-Person Families | 2,029 (20.9%) | $68,528 |
| 4-Person Families | 1,483 (15.3%) | $108,958 |
| 5-Person Families | 772 (8.0%) | $100,208 |
| 6-Person Families | 314 (3.2%) | $0 |
| 7+ Person Families | 62 (0.6%) | $96,250 |
| Total | 9,684 (100.0%) | $87,377 |
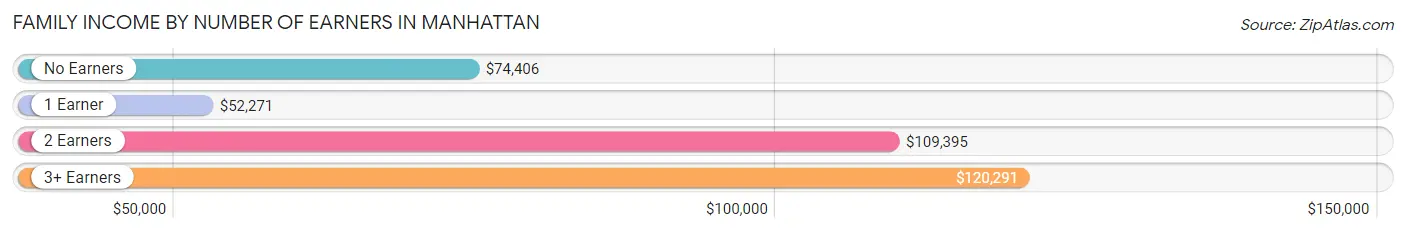
Family Income by Number of Earners in Manhattan
The median family income in Manhattan is $87,377, with families comprising 3+ earners (674) having the highest median family income of $120,291, while families with 1 earner (3,227) have the lowest median family income of $52,271, accounting for 7.0% and 33.3% of families, respectively.
| Number of Earners | # Families | Median Income |
| No Earners | 1,179 (12.2%) | $74,406 |
| 1 Earner | 3,227 (33.3%) | $52,271 |
| 2 Earners | 4,604 (47.5%) | $109,395 |
| 3+ Earners | 674 (7.0%) | $120,291 |
| Total | 9,684 (100.0%) | $87,377 |
Household Income in Manhattan
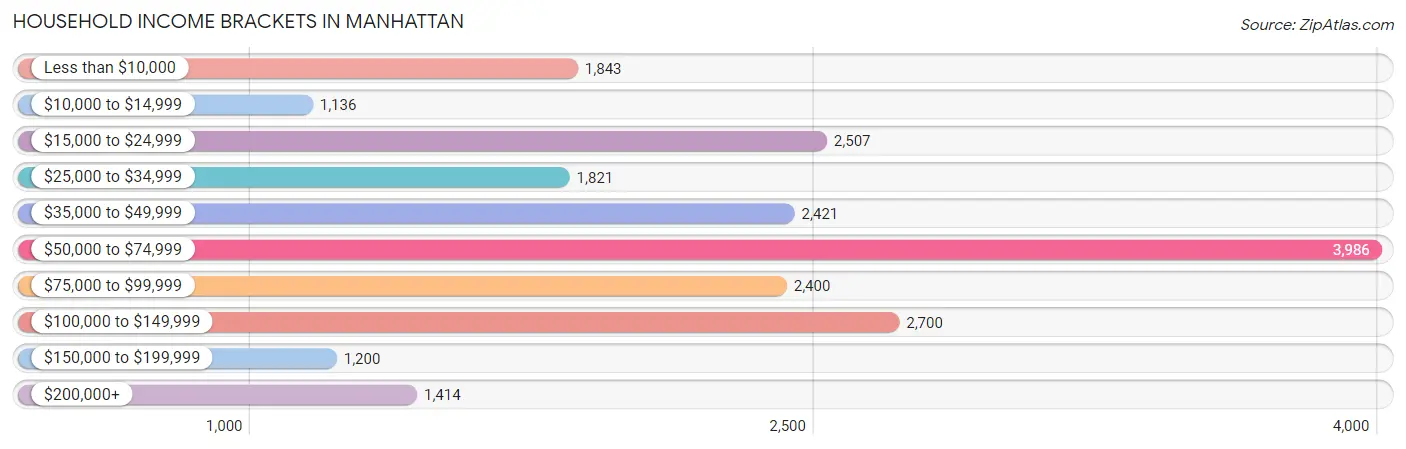
Household Income Brackets in Manhattan
With 3,986 households falling in the category, the $50,000 to $74,999 income range is the most frequent in Manhattan, accounting for 18.6% of all households. In contrast, only 1,136 households (5.3%) fall into the $10,000 to $14,999 income bracket, making it the least populous group.
| Income Bracket | # Households | % Households |
| Less than $10,000 | 1,843 | 8.6% |
| $10,000 to $14,999 | 1,136 | 5.3% |
| $15,000 to $24,999 | 2,507 | 11.7% |
| $25,000 to $34,999 | 1,821 | 8.5% |
| $35,000 to $49,999 | 2,421 | 11.3% |
| $50,000 to $74,999 | 3,986 | 18.6% |
| $75,000 to $99,999 | 2,400 | 11.2% |
| $100,000 to $149,999 | 2,700 | 12.6% |
| $150,000 to $199,999 | 1,200 | 5.6% |
| $200,000+ | 1,414 | 6.6% |
Household Income by Householder Age in Manhattan
The median household income in Manhattan is $55,316, with the highest median household income of $77,549 found in the 45 to 64 years age bracket for the primary householder. A total of 4,891 households (22.8%) fall into this category. Meanwhile, the 15 to 24 years age bracket for the primary householder has the lowest median household income of $24,888, with 5,336 households (24.9%) in this group.
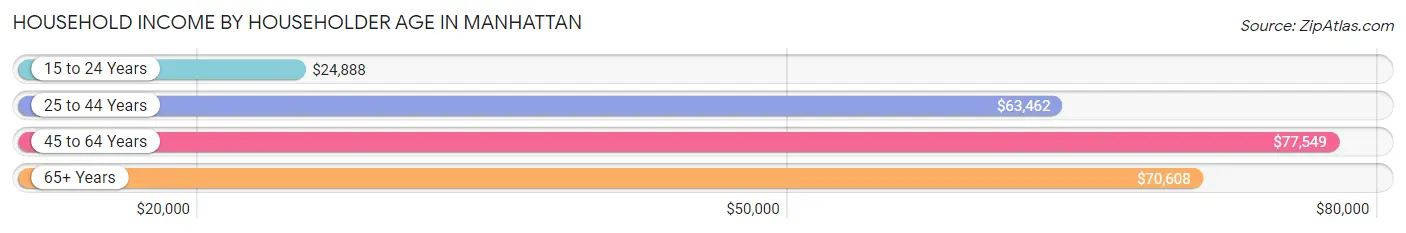
| Income Bracket | # Households | Median Income |
| 15 to 24 Years | 5,336 (24.9%) | $24,888 |
| 25 to 44 Years | 7,994 (37.3%) | $63,462 |
| 45 to 64 Years | 4,891 (22.8%) | $77,549 |
| 65+ Years | 3,207 (15.0%) | $70,608 |
| Total | 21,428 (100.0%) | $55,316 |
Poverty in Manhattan
Income Below Poverty by Sex and Age in Manhattan
With 25.0% poverty level for males and 28.0% for females among the residents of Manhattan, 18 to 24 year old males and 18 to 24 year old females are the most vulnerable to poverty, with 3,962 males (53.4%) and 3,924 females (62.6%) in their respective age groups living below the poverty level.
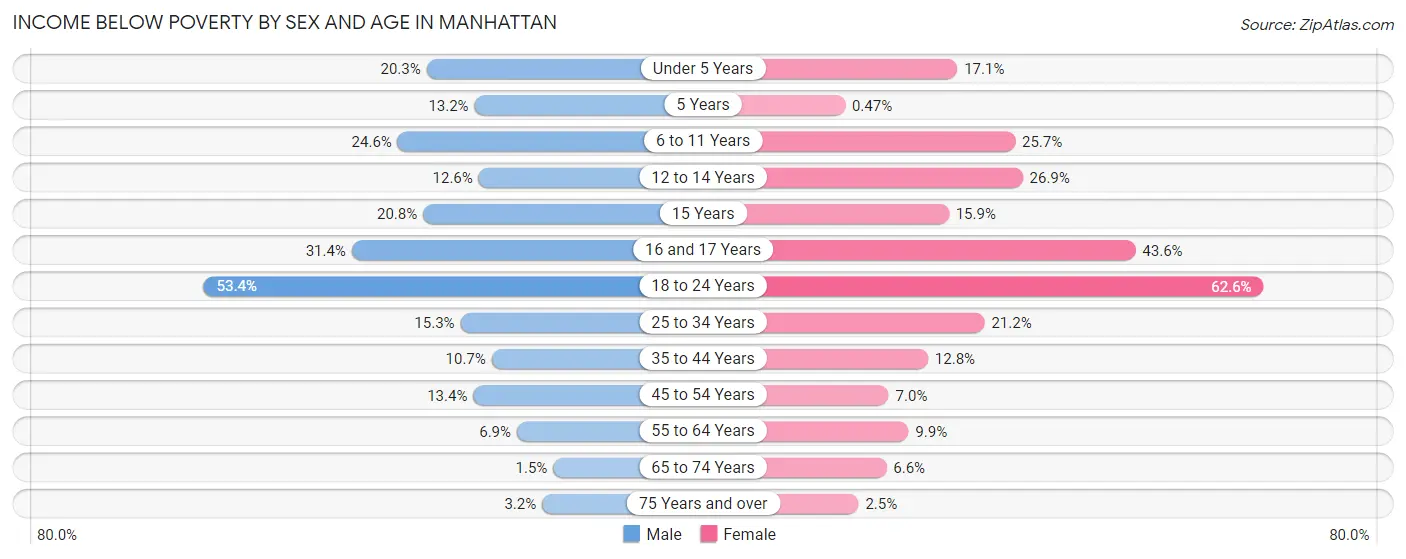
| Age Bracket | Male | Female |
| Under 5 Years | 247 (20.3%) | 168 (17.1%) |
| 5 Years | 33 (13.2%) | 1 (0.5%) |
| 6 to 11 Years | 335 (24.6%) | 220 (25.7%) |
| 12 to 14 Years | 100 (12.6%) | 192 (26.9%) |
| 15 Years | 35 (20.8%) | 44 (15.9%) |
| 16 and 17 Years | 171 (31.4%) | 211 (43.6%) |
| 18 to 24 Years | 3,962 (53.4%) | 3,924 (62.6%) |
| 25 to 34 Years | 672 (15.3%) | 797 (21.2%) |
| 35 to 44 Years | 296 (10.6%) | 337 (12.8%) |
| 45 to 54 Years | 257 (13.4%) | 137 (7.0%) |
| 55 to 64 Years | 137 (6.9%) | 200 (9.9%) |
| 65 to 74 Years | 23 (1.5%) | 104 (6.6%) |
| 75 Years and over | 25 (3.2%) | 23 (2.5%) |
| Total | 6,293 (25.0%) | 6,358 (28.0%) |
Income Above Poverty by Sex and Age in Manhattan
According to the poverty statistics in Manhattan, males aged 65 to 74 years and females aged 5 years are the age groups that are most secure financially, with 98.5% of males and 99.5% of females in these age groups living above the poverty line.
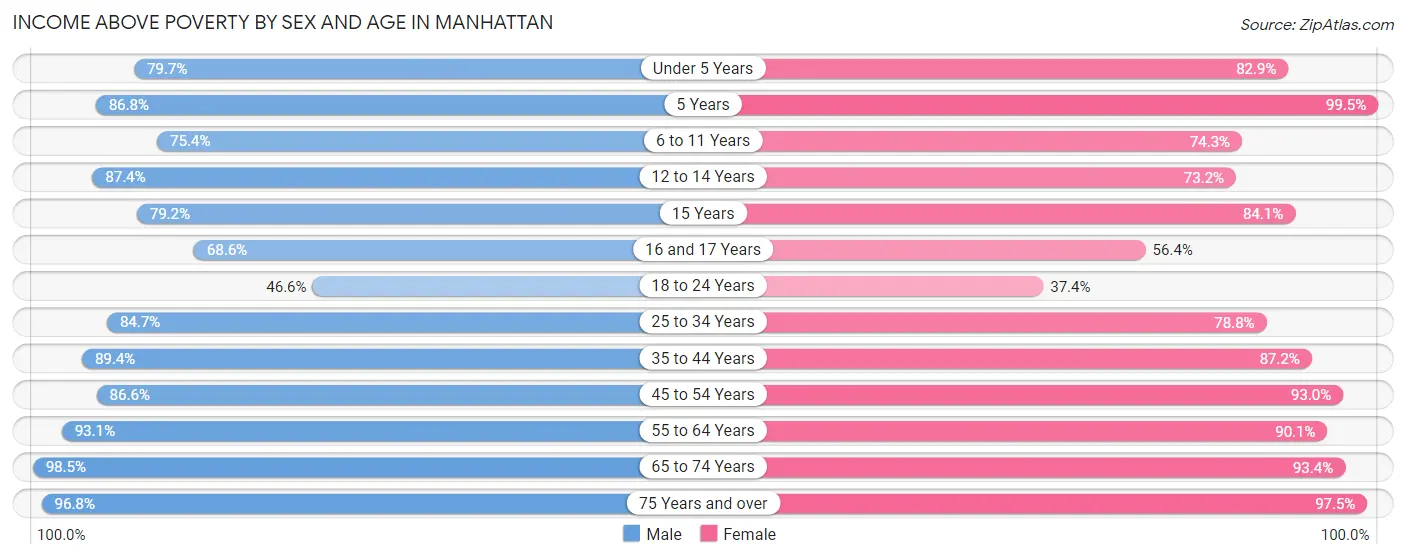
| Age Bracket | Male | Female |
| Under 5 Years | 969 (79.7%) | 812 (82.9%) |
| 5 Years | 217 (86.8%) | 210 (99.5%) |
| 6 to 11 Years | 1,027 (75.4%) | 635 (74.3%) |
| 12 to 14 Years | 695 (87.4%) | 523 (73.2%) |
| 15 Years | 133 (79.2%) | 233 (84.1%) |
| 16 and 17 Years | 373 (68.6%) | 273 (56.4%) |
| 18 to 24 Years | 3,456 (46.6%) | 2,344 (37.4%) |
| 25 to 34 Years | 3,724 (84.7%) | 2,964 (78.8%) |
| 35 to 44 Years | 2,483 (89.3%) | 2,298 (87.2%) |
| 45 to 54 Years | 1,664 (86.6%) | 1,832 (93.0%) |
| 55 to 64 Years | 1,848 (93.1%) | 1,822 (90.1%) |
| 65 to 74 Years | 1,503 (98.5%) | 1,470 (93.4%) |
| 75 Years and over | 766 (96.8%) | 906 (97.5%) |
| Total | 18,858 (75.0%) | 16,322 (72.0%) |
Income Below Poverty Among Married-Couple Families in Manhattan
The poverty statistics for married-couple families in Manhattan show that 7.0% or 514 of the total 7,295 families live below the poverty line. Families with 3 or 4 children have the highest poverty rate of 23.4%, comprising of 152 families. On the other hand, families with 5 or more children have the lowest poverty rate of 0.0%, which includes 0 families.
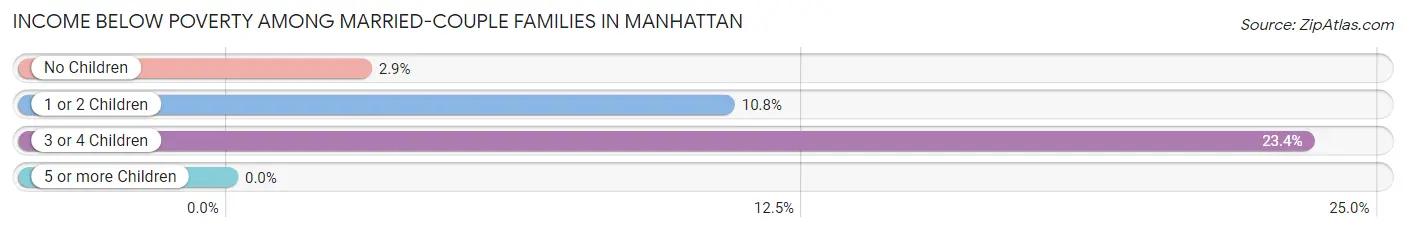
| Children | Above Poverty | Below Poverty |
| No Children | 4,345 (97.1%) | 130 (2.9%) |
| 1 or 2 Children | 1,915 (89.2%) | 232 (10.8%) |
| 3 or 4 Children | 497 (76.6%) | 152 (23.4%) |
| 5 or more Children | 24 (100.0%) | 0 (0.0%) |
| Total | 6,781 (92.9%) | 514 (7.0%) |
Income Below Poverty Among Single-Parent Households in Manhattan
According to the poverty data in Manhattan, 28.5% or 263 single-father households and 38.4% or 563 single-mother households are living below the poverty line. Among single-father households, those with 3 or 4 children have the highest poverty rate, with 158 households (65.0%) experiencing poverty. Likewise, among single-mother households, those with 3 or 4 children have the highest poverty rate, with 242 households (83.7%) falling below the poverty line.
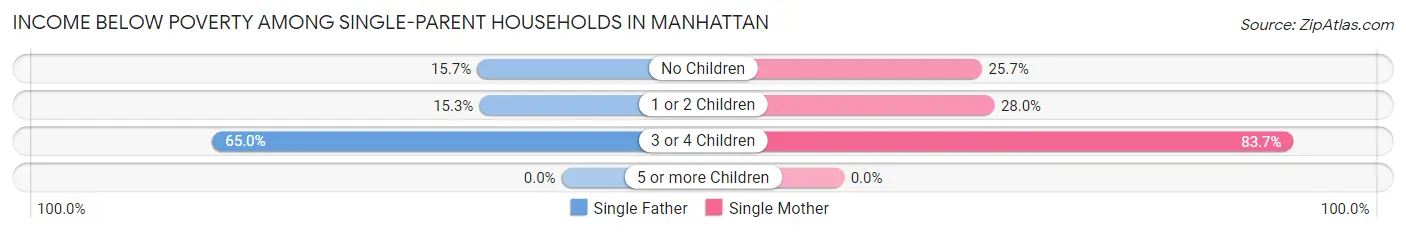
| Children | Single Father | Single Mother |
| No Children | 34 (15.7%) | 96 (25.7%) |
| 1 or 2 Children | 71 (15.3%) | 225 (28.0%) |
| 3 or 4 Children | 158 (65.0%) | 242 (83.7%) |
| 5 or more Children | 0 (0.0%) | 0 (0.0%) |
| Total | 263 (28.5%) | 563 (38.4%) |
Income Below Poverty Among Married-Couple vs Single-Parent Households in Manhattan
The poverty data for Manhattan shows that 514 of the married-couple family households (7.0%) and 826 of the single-parent households (34.6%) are living below the poverty level. Within the married-couple family households, those with 3 or 4 children have the highest poverty rate, with 152 households (23.4%) falling below the poverty line. Among the single-parent households, those with 3 or 4 children have the highest poverty rate, with 400 household (75.2%) living below poverty.
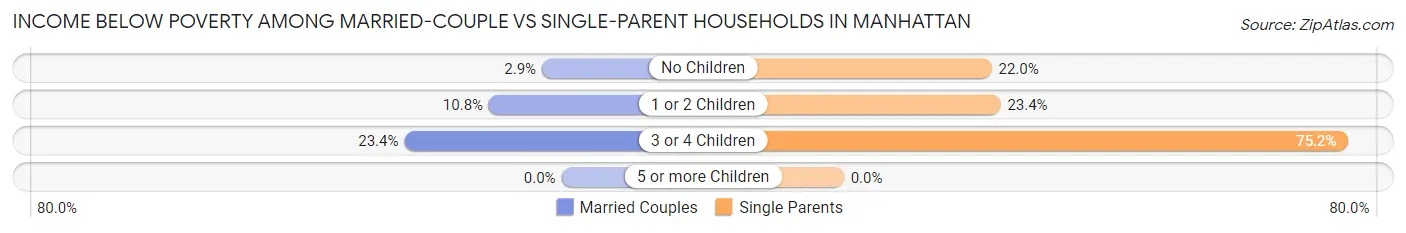
| Children | Married-Couple Families | Single-Parent Households |
| No Children | 130 (2.9%) | 130 (22.0%) |
| 1 or 2 Children | 232 (10.8%) | 296 (23.4%) |
| 3 or 4 Children | 152 (23.4%) | 400 (75.2%) |
| 5 or more Children | 0 (0.0%) | 0 (0.0%) |
| Total | 514 (7.0%) | 826 (34.6%) |
Race in Manhattan
The most populous races in Manhattan are White / Caucasian (43,250 | 79.7%), Hispanic or Latino (4,184 | 7.7%), and Two or more Races (3,865 | 7.1%).
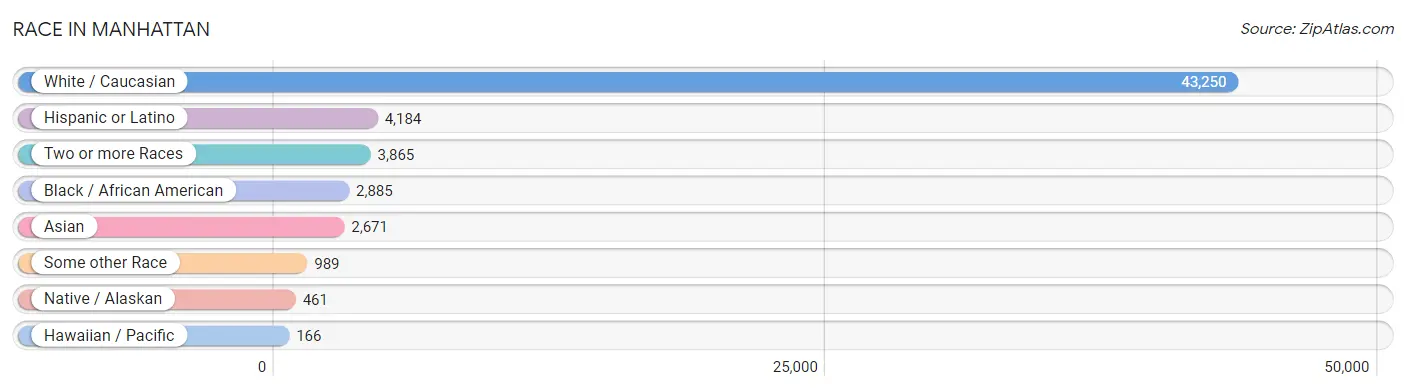
| Race | # Population | % Population |
| Asian | 2,671 | 4.9% |
| Black / African American | 2,885 | 5.3% |
| Hawaiian / Pacific | 166 | 0.3% |
| Hispanic or Latino | 4,184 | 7.7% |
| Native / Alaskan | 461 | 0.9% |
| White / Caucasian | 43,250 | 79.7% |
| Two or more Races | 3,865 | 7.1% |
| Some other Race | 989 | 1.8% |
| Total | 54,287 | 100.0% |
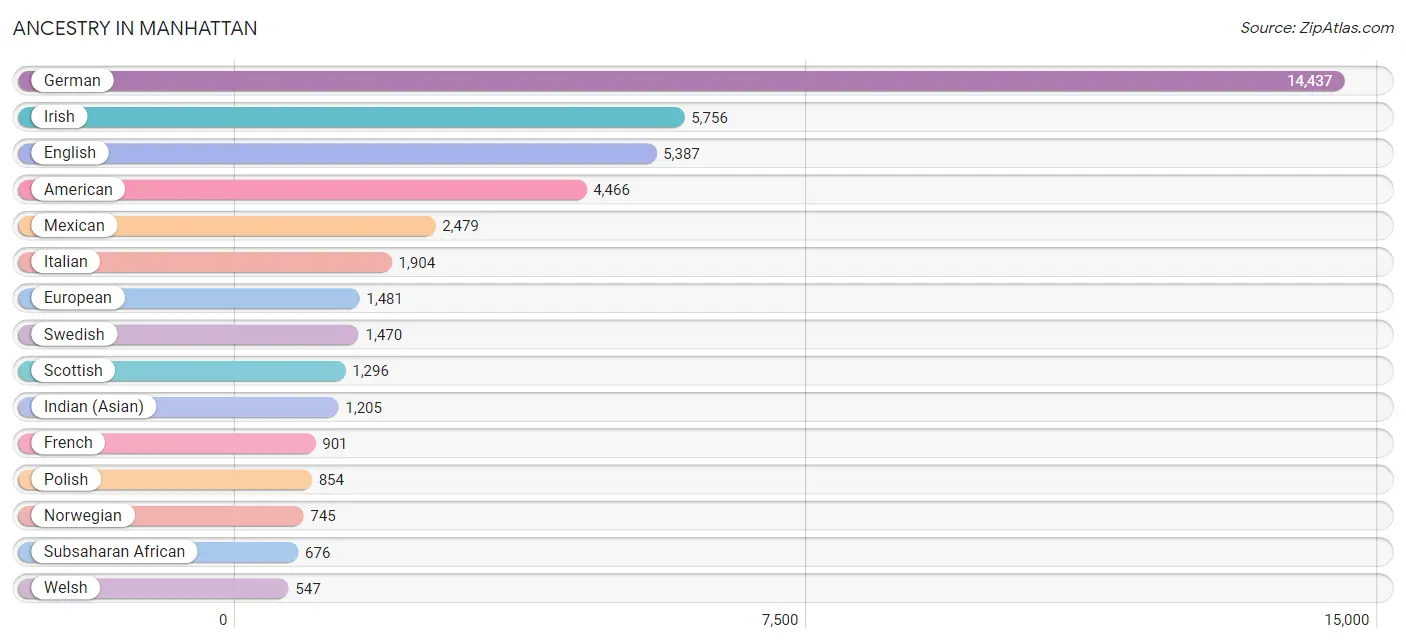
Ancestry in Manhattan
The most populous ancestries reported in Manhattan are German (14,437 | 26.6%), Irish (5,756 | 10.6%), English (5,387 | 9.9%), American (4,466 | 8.2%), and Mexican (2,479 | 4.6%), together accounting for 59.9% of all Manhattan residents.
| Ancestry | # Population | % Population |
| African | 283 | 0.5% |
| Alaska Native | 14 | 0.0% |
| American | 4,466 | 8.2% |
| Arab | 307 | 0.6% |
| Argentinean | 21 | 0.0% |
| Austrian | 44 | 0.1% |
| Bangladeshi | 36 | 0.1% |
| Belgian | 146 | 0.3% |
| Belizean | 15 | 0.0% |
| Bhutanese | 311 | 0.6% |
| Blackfeet | 76 | 0.1% |
| Bolivian | 133 | 0.2% |
| Brazilian | 25 | 0.1% |
| British | 371 | 0.7% |
| Burmese | 277 | 0.5% |
| Cajun | 30 | 0.1% |
| Cambodian | 7 | 0.0% |
| Canadian | 48 | 0.1% |
| Central American | 491 | 0.9% |
| Central American Indian | 228 | 0.4% |
| Cherokee | 294 | 0.5% |
| Cheyenne | 15 | 0.0% |
| Chilean | 23 | 0.0% |
| Choctaw | 8 | 0.0% |
| Colombian | 22 | 0.0% |
| Comanche | 1 | 0.0% |
| Costa Rican | 18 | 0.0% |
| Creek | 3 | 0.0% |
| Croatian | 22 | 0.0% |
| Cuban | 323 | 0.6% |
| Czech | 534 | 1.0% |
| Czechoslovakian | 18 | 0.0% |
| Danish | 203 | 0.4% |
| Dominican | 8 | 0.0% |
| Dutch | 515 | 0.9% |
| Eastern European | 114 | 0.2% |
| Ecuadorian | 18 | 0.0% |
| Egyptian | 121 | 0.2% |
| English | 5,387 | 9.9% |
| Ethiopian | 232 | 0.4% |
| European | 1,481 | 2.7% |
| Filipino | 55 | 0.1% |
| Finnish | 45 | 0.1% |
| French | 901 | 1.7% |
| French Canadian | 177 | 0.3% |
| German | 14,437 | 26.6% |
| Greek | 136 | 0.3% |
| Guatemalan | 44 | 0.1% |
| Honduran | 46 | 0.1% |
| Houma | 9 | 0.0% |
| Hungarian | 161 | 0.3% |
| Indian (Asian) | 1,205 | 2.2% |
| Iranian | 19 | 0.0% |
| Irish | 5,756 | 10.6% |
| Italian | 1,904 | 3.5% |
| Jordanian | 27 | 0.1% |
| Kiowa | 35 | 0.1% |
| Korean | 361 | 0.7% |
| Laotian | 8 | 0.0% |
| Lebanese | 86 | 0.2% |
| Lithuanian | 169 | 0.3% |
| Luxembourger | 16 | 0.0% |
| Malaysian | 14 | 0.0% |
| Mexican | 2,479 | 4.6% |
| Mexican American Indian | 81 | 0.2% |
| Moroccan | 16 | 0.0% |
| Native Hawaiian | 131 | 0.2% |
| Navajo | 95 | 0.2% |
| Nicaraguan | 128 | 0.2% |
| Nigerian | 93 | 0.2% |
| Northern European | 156 | 0.3% |
| Norwegian | 745 | 1.4% |
| Osage | 7 | 0.0% |
| Ottawa | 9 | 0.0% |
| Pakistani | 32 | 0.1% |
| Panamanian | 45 | 0.1% |
| Paraguayan | 141 | 0.3% |
| Pennsylvania German | 18 | 0.0% |
| Peruvian | 54 | 0.1% |
| Polish | 854 | 1.6% |
| Portuguese | 19 | 0.0% |
| Potawatomi | 38 | 0.1% |
| Puerto Rican | 228 | 0.4% |
| Romanian | 13 | 0.0% |
| Russian | 440 | 0.8% |
| Salvadoran | 210 | 0.4% |
| Samoan | 145 | 0.3% |
| Scandinavian | 249 | 0.5% |
| Scotch-Irish | 372 | 0.7% |
| Scottish | 1,296 | 2.4% |
| Sioux | 10 | 0.0% |
| Slovak | 80 | 0.2% |
| South American | 461 | 0.9% |
| Spaniard | 56 | 0.1% |
| Spanish | 48 | 0.1% |
| Sri Lankan | 486 | 0.9% |
| Subsaharan African | 676 | 1.3% |
| Sudanese | 55 | 0.1% |
| Swedish | 1,470 | 2.7% |
| Swiss | 123 | 0.2% |
| Thai | 316 | 0.6% |
| Trinidadian and Tobagonian | 42 | 0.1% |
| Turkish | 55 | 0.1% |
| Ukrainian | 104 | 0.2% |
| Uruguayan | 16 | 0.0% |
| Venezuelan | 33 | 0.1% |
| Vietnamese | 272 | 0.5% |
| Welsh | 547 | 1.0% |
| Yugoslavian | 25 | 0.1% | View All 109 Rows |
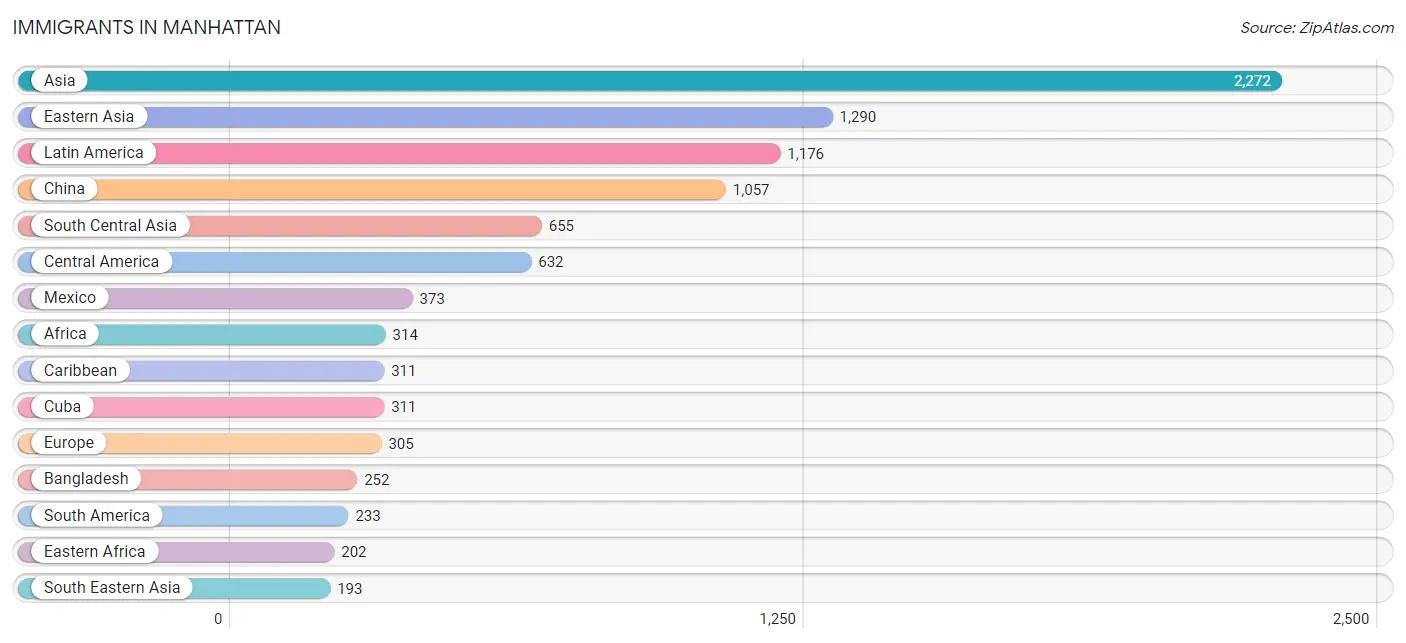
Immigrants in Manhattan
The most numerous immigrant groups reported in Manhattan came from Asia (2,272 | 4.2%), Eastern Asia (1,290 | 2.4%), Latin America (1,176 | 2.2%), China (1,057 | 1.9%), and South Central Asia (655 | 1.2%), together accounting for 11.9% of all Manhattan residents.
| Immigration Origin | # Population | % Population |
| Africa | 314 | 0.6% |
| Argentina | 21 | 0.0% |
| Asia | 2,272 | 4.2% |
| Australia | 10 | 0.0% |
| Bangladesh | 252 | 0.5% |
| Brazil | 38 | 0.1% |
| Canada | 46 | 0.1% |
| Caribbean | 311 | 0.6% |
| Central America | 632 | 1.2% |
| China | 1,057 | 1.9% |
| Colombia | 17 | 0.0% |
| Cuba | 311 | 0.6% |
| Eastern Africa | 202 | 0.4% |
| Eastern Asia | 1,290 | 2.4% |
| Eastern Europe | 144 | 0.3% |
| Ecuador | 18 | 0.0% |
| Egypt | 49 | 0.1% |
| El Salvador | 55 | 0.1% |
| Eritrea | 26 | 0.1% |
| Ethiopia | 176 | 0.3% |
| Europe | 305 | 0.6% |
| France | 10 | 0.0% |
| Germany | 96 | 0.2% |
| Guatemala | 37 | 0.1% |
| Honduras | 24 | 0.0% |
| Hong Kong | 4 | 0.0% |
| Hungary | 77 | 0.1% |
| India | 158 | 0.3% |
| Indonesia | 20 | 0.0% |
| Iran | 19 | 0.0% |
| Japan | 88 | 0.2% |
| Jordan | 10 | 0.0% |
| Korea | 145 | 0.3% |
| Kuwait | 10 | 0.0% |
| Latin America | 1,176 | 2.2% |
| Lebanon | 20 | 0.0% |
| Lithuania | 6 | 0.0% |
| Mexico | 373 | 0.7% |
| Moldova | 12 | 0.0% |
| Nepal | 152 | 0.3% |
| Nicaragua | 128 | 0.2% |
| Nigeria | 63 | 0.1% |
| Northern Africa | 49 | 0.1% |
| Northern Europe | 55 | 0.1% |
| Norway | 26 | 0.1% |
| Oceania | 95 | 0.2% |
| Panama | 15 | 0.0% |
| Philippines | 60 | 0.1% |
| Romania | 13 | 0.0% |
| Saudi Arabia | 37 | 0.1% |
| South America | 233 | 0.4% |
| South Central Asia | 655 | 1.2% |
| South Eastern Asia | 193 | 0.4% |
| Sri Lanka | 74 | 0.1% |
| Taiwan | 140 | 0.3% |
| Ukraine | 36 | 0.1% |
| Uruguay | 16 | 0.0% |
| Venezuela | 33 | 0.1% |
| Vietnam | 113 | 0.2% |
| Western Africa | 63 | 0.1% |
| Western Asia | 134 | 0.3% |
| Western Europe | 106 | 0.2% | View All 62 Rows |
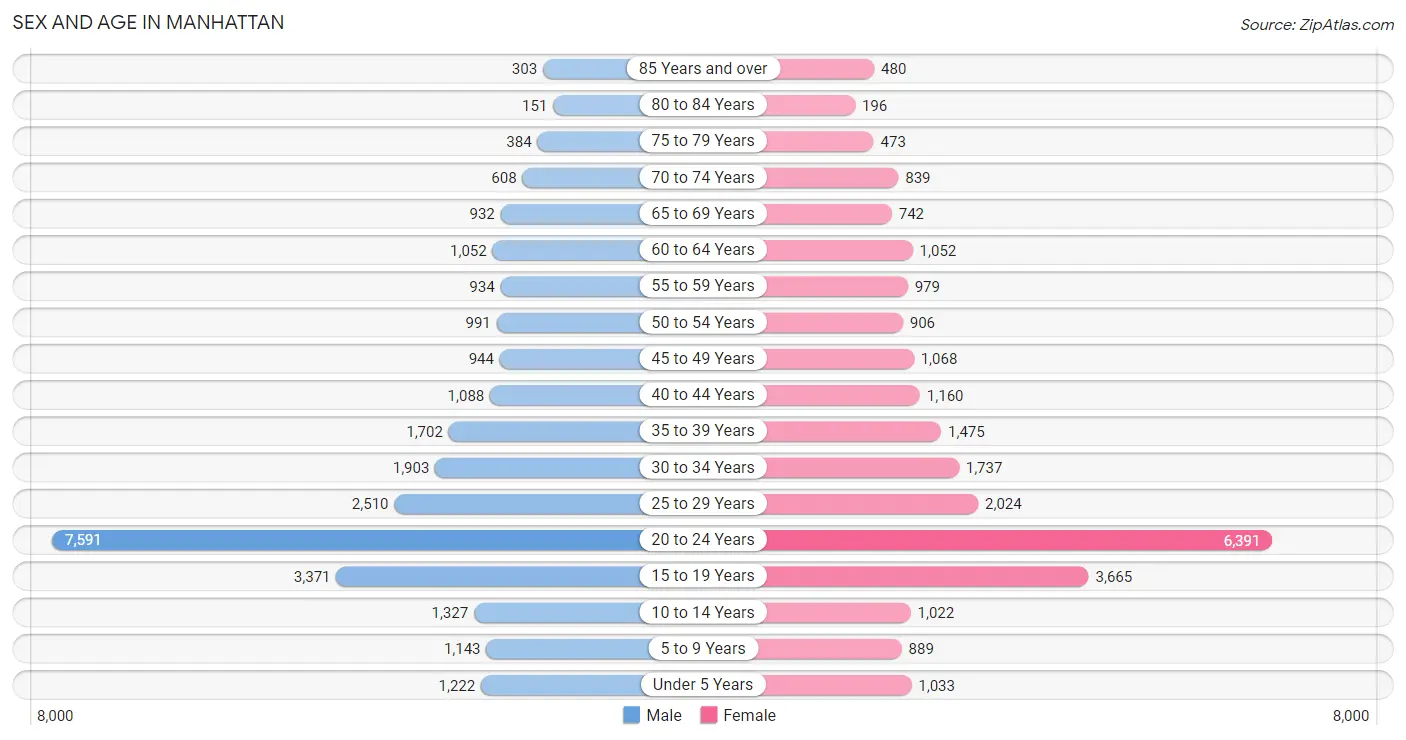
Sex and Age in Manhattan
Sex and Age in Manhattan
The most populous age groups in Manhattan are 20 to 24 Years (7,591 | 27.0%) for men and 20 to 24 Years (6,391 | 24.5%) for women.
| Age Bracket | Male | Female |
| Under 5 Years | 1,222 (4.3%) | 1,033 (4.0%) |
| 5 to 9 Years | 1,143 (4.1%) | 889 (3.4%) |
| 10 to 14 Years | 1,327 (4.7%) | 1,022 (3.9%) |
| 15 to 19 Years | 3,371 (12.0%) | 3,665 (14.0%) |
| 20 to 24 Years | 7,591 (27.0%) | 6,391 (24.5%) |
| 25 to 29 Years | 2,510 (8.9%) | 2,024 (7.7%) |
| 30 to 34 Years | 1,903 (6.8%) | 1,737 (6.7%) |
| 35 to 39 Years | 1,702 (6.0%) | 1,475 (5.6%) |
| 40 to 44 Years | 1,088 (3.9%) | 1,160 (4.4%) |
| 45 to 49 Years | 944 (3.4%) | 1,068 (4.1%) |
| 50 to 54 Years | 991 (3.5%) | 906 (3.5%) |
| 55 to 59 Years | 934 (3.3%) | 979 (3.7%) |
| 60 to 64 Years | 1,052 (3.7%) | 1,052 (4.0%) |
| 65 to 69 Years | 932 (3.3%) | 742 (2.8%) |
| 70 to 74 Years | 608 (2.2%) | 839 (3.2%) |
| 75 to 79 Years | 384 (1.4%) | 473 (1.8%) |
| 80 to 84 Years | 151 (0.5%) | 196 (0.7%) |
| 85 Years and over | 303 (1.1%) | 480 (1.8%) |
| Total | 28,156 (100.0%) | 26,131 (100.0%) |
Families and Households in Manhattan
Median Family Size in Manhattan
The median family size in Manhattan is 2.83 persons per family, with single female/mother families (1,467 | 15.1%) accounting for the largest median family size of 2.99 persons per family. On the other hand, single male/father families (922 | 9.5%) represent the smallest median family size with 2.57 persons per family.

| Family Type | # Families | Family Size |
| Married-Couple | 7,295 (75.3%) | 2.83 |
| Single Male/Father | 922 (9.5%) | 2.57 |
| Single Female/Mother | 1,467 (15.1%) | 2.99 |
| Total Families | 9,684 (100.0%) | 2.83 |
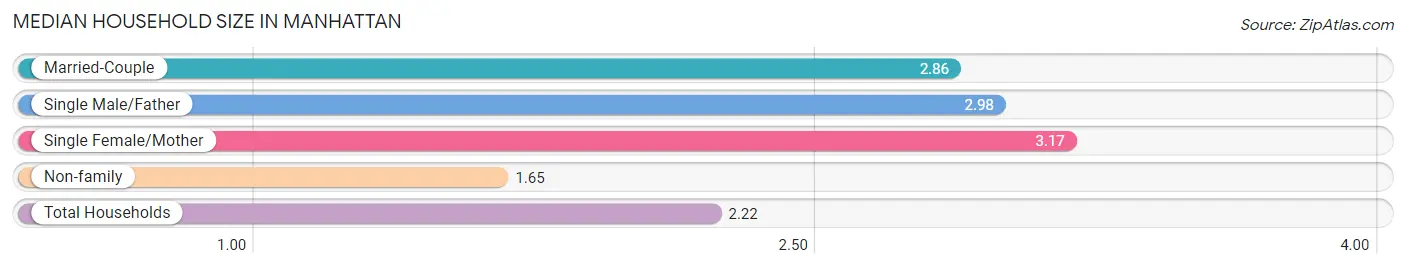
Median Household Size in Manhattan
The median household size in Manhattan is 2.22 persons per household, with single female/mother households (1,467 | 6.9%) accounting for the largest median household size of 3.17 persons per household. non-family households (11,744 | 54.8%) represent the smallest median household size with 1.65 persons per household.
| Household Type | # Households | Household Size |
| Married-Couple | 7,295 (34.0%) | 2.86 |
| Single Male/Father | 922 (4.3%) | 2.98 |
| Single Female/Mother | 1,467 (6.9%) | 3.17 |
| Non-family | 11,744 (54.8%) | 1.65 |
| Total Households | 21,428 (100.0%) | 2.22 |
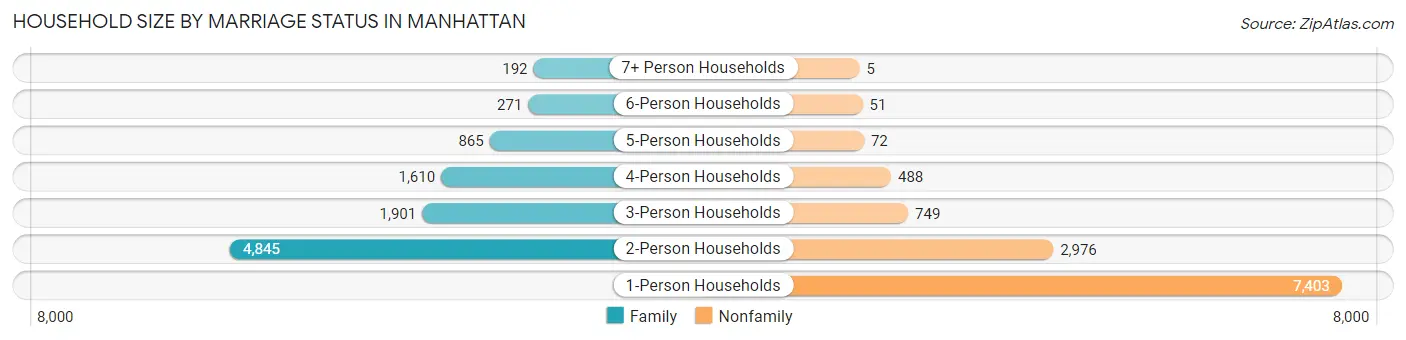
Household Size by Marriage Status in Manhattan
Out of a total of 21,428 households in Manhattan, 9,684 (45.2%) are family households, while 11,744 (54.8%) are nonfamily households. The most numerous type of family households are 2-person households, comprising 4,845, and the most common type of nonfamily households are 1-person households, comprising 7,403.
| Household Size | Family Households | Nonfamily Households |
| 1-Person Households | - | 7,403 (34.5%) |
| 2-Person Households | 4,845 (22.6%) | 2,976 (13.9%) |
| 3-Person Households | 1,901 (8.9%) | 749 (3.5%) |
| 4-Person Households | 1,610 (7.5%) | 488 (2.3%) |
| 5-Person Households | 865 (4.0%) | 72 (0.3%) |
| 6-Person Households | 271 (1.3%) | 51 (0.2%) |
| 7+ Person Households | 192 (0.9%) | 5 (0.0%) |
| Total | 9,684 (45.2%) | 11,744 (54.8%) |
Female Fertility in Manhattan
Fertility by Age in Manhattan
Average fertility rate in Manhattan is 21.0 births per 1,000 women. Women in the age bracket of 35 to 50 years have the highest fertility rate with 30.0 births per 1,000 women. Women in the age bracket of 20 to 34 years acount for 59.3% of all women with births.
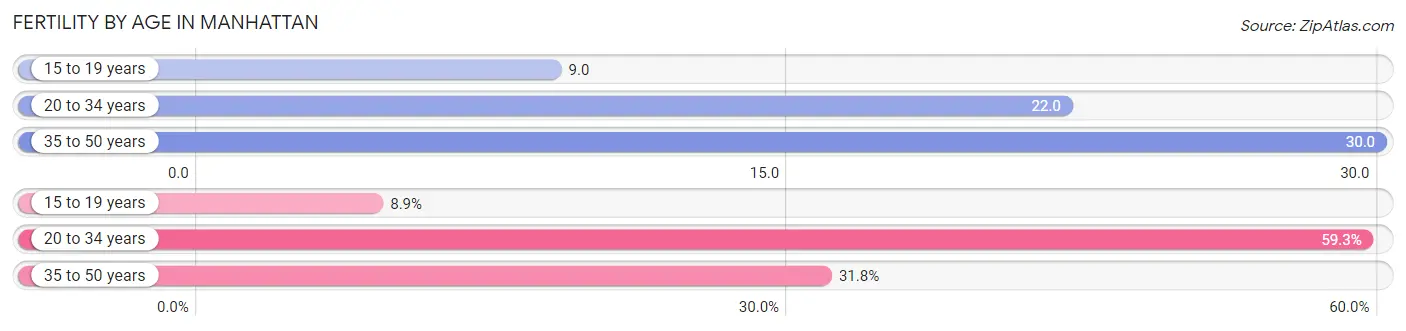
| Age Bracket | Women with Births | Births / 1,000 Women |
| 15 to 19 years | 34 (8.9%) | 9.0 |
| 20 to 34 years | 226 (59.3%) | 22.0 |
| 35 to 50 years | 121 (31.8%) | 30.0 |
| Total | 381 (100.0%) | 21.0 |
Fertility by Age by Marriage Status in Manhattan
66.4% of women with births (381) in Manhattan are married. The highest percentage of unmarried women with births falls into 15 to 19 years age bracket with 100.0% of them unmarried at the time of birth, while the lowest percentage of unmarried women with births belong to 35 to 50 years age bracket with 0.0% of them unmarried.
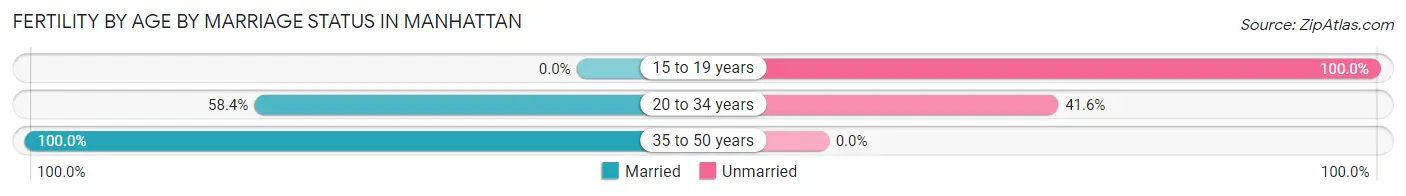
| Age Bracket | Married | Unmarried |
| 15 to 19 years | 0 (0.0%) | 34 (100.0%) |
| 20 to 34 years | 132 (58.4%) | 94 (41.6%) |
| 35 to 50 years | 121 (100.0%) | 0 (0.0%) |
| Total | 253 (66.4%) | 128 (33.6%) |
Fertility by Education in Manhattan
Average fertility rate in Manhattan is 21.0 births per 1,000 women. Women with the education attainment of bachelor's degree have the highest fertility rate of 39.0 births per 1,000 women, while women with the education attainment of college or associate's degree have the lowest fertility at 11.0 births per 1,000 women. Women with the education attainment of bachelor's degree represent 38.6% of all women with births.
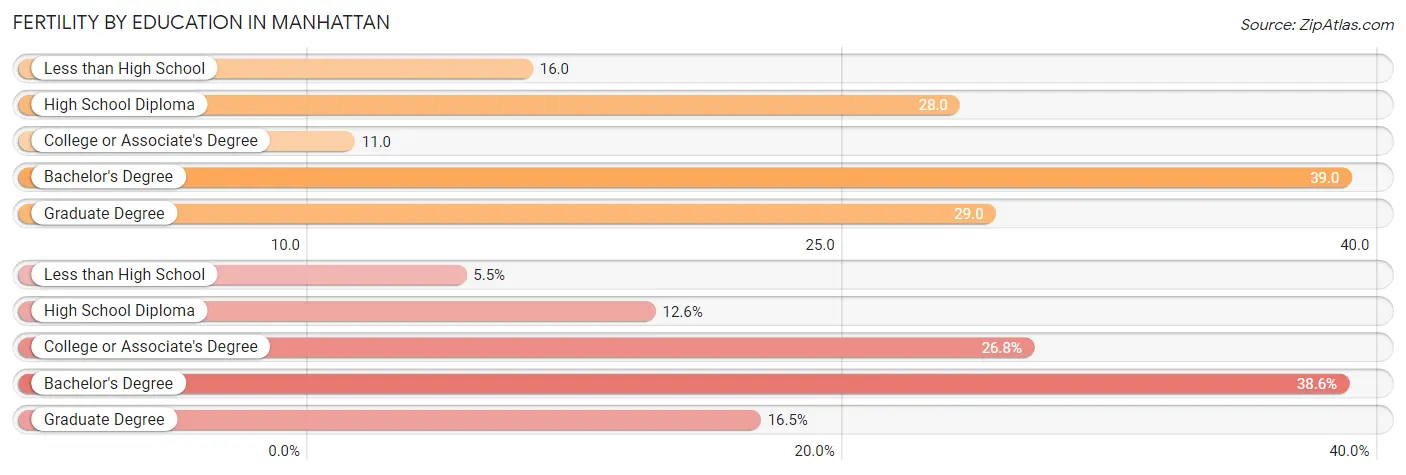
| Educational Attainment | Women with Births | Births / 1,000 Women |
| Less than High School | 21 (5.5%) | 16.0 |
| High School Diploma | 48 (12.6%) | 28.0 |
| College or Associate's Degree | 102 (26.8%) | 11.0 |
| Bachelor's Degree | 147 (38.6%) | 39.0 |
| Graduate Degree | 63 (16.5%) | 29.0 |
| Total | 381 (100.0%) | 21.0 |
Fertility by Education by Marriage Status in Manhattan
33.6% of women with births in Manhattan are unmarried. Women with the educational attainment of bachelor's degree are most likely to be married with 100.0% of them married at childbirth, while women with the educational attainment of less than high school are least likely to be married with 100.0% of them unmarried at childbirth.
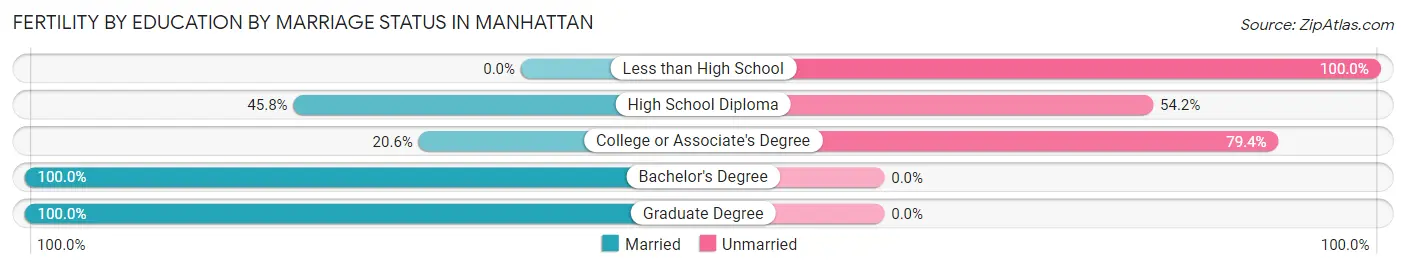
| Educational Attainment | Married | Unmarried |
| Less than High School | 0 (0.0%) | 21 (100.0%) |
| High School Diploma | 22 (45.8%) | 26 (54.2%) |
| College or Associate's Degree | 21 (20.6%) | 81 (79.4%) |
| Bachelor's Degree | 147 (100.0%) | 0 (0.0%) |
| Graduate Degree | 63 (100.0%) | 0 (0.0%) |
| Total | 253 (66.4%) | 128 (33.6%) |
Employment Characteristics in Manhattan
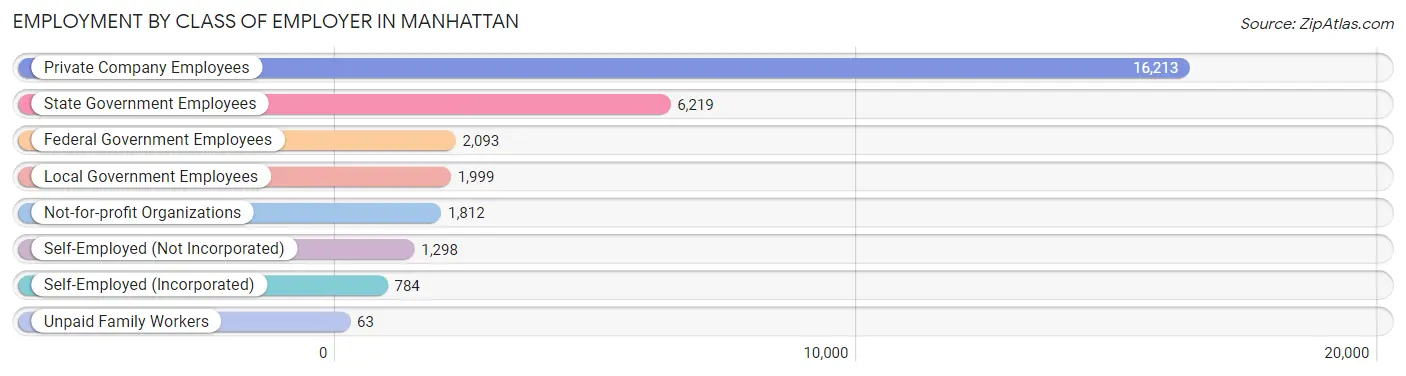
Employment by Class of Employer in Manhattan
Among the 30,481 employed individuals in Manhattan, private company employees (16,213 | 53.2%), state government employees (6,219 | 20.4%), and federal government employees (2,093 | 6.9%) make up the most common classes of employment.
| Employer Class | # Employees | % Employees |
| Private Company Employees | 16,213 | 53.2% |
| Self-Employed (Incorporated) | 784 | 2.6% |
| Self-Employed (Not Incorporated) | 1,298 | 4.3% |
| Not-for-profit Organizations | 1,812 | 5.9% |
| Local Government Employees | 1,999 | 6.6% |
| State Government Employees | 6,219 | 20.4% |
| Federal Government Employees | 2,093 | 6.9% |
| Unpaid Family Workers | 63 | 0.2% |
| Total | 30,481 | 100.0% |
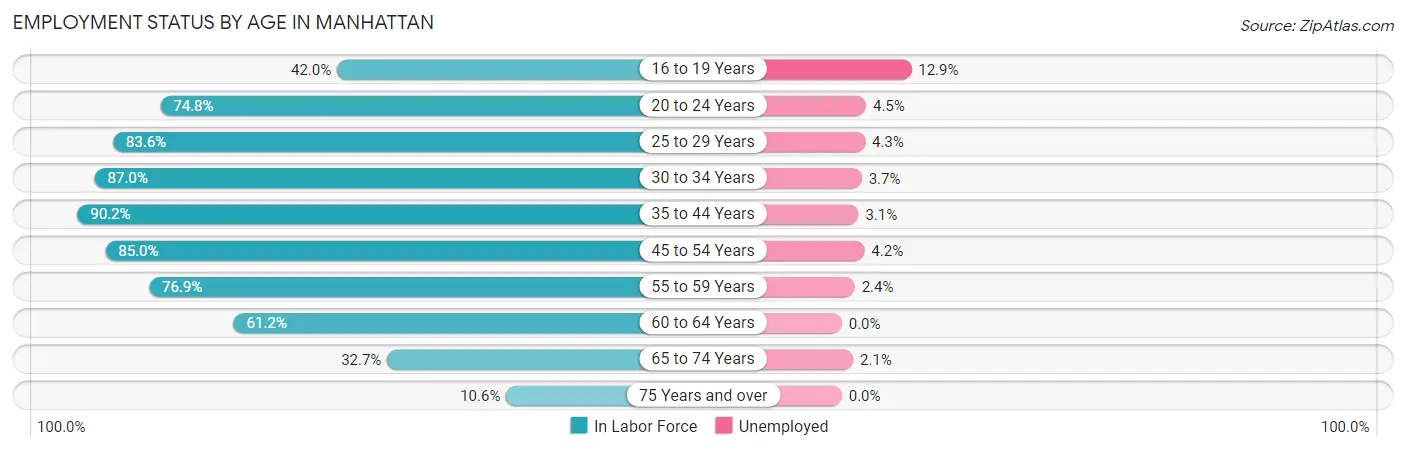
Employment Status by Age in Manhattan
According to the labor force statistics for Manhattan, out of the total population over 16 years of age (47,206), 68.6% or 32,383 individuals are in the labor force, with 4.5% or 1,457 of them unemployed. The age group with the highest labor force participation rate is 35 to 44 years, with 90.2% or 4,893 individuals in the labor force. Within the labor force, the 16 to 19 years age range has the highest percentage of unemployed individuals, with 12.9% or 357 of them being unemployed.
| Age Bracket | In Labor Force | Unemployed |
| 16 to 19 Years | 2,768 (42.0%) | 357 (12.9%) |
| 20 to 24 Years | 10,459 (74.8%) | 471 (4.5%) |
| 25 to 29 Years | 3,790 (83.6%) | 163 (4.3%) |
| 30 to 34 Years | 3,167 (87.0%) | 117 (3.7%) |
| 35 to 44 Years | 4,893 (90.2%) | 152 (3.1%) |
| 45 to 54 Years | 3,323 (85.0%) | 140 (4.2%) |
| 55 to 59 Years | 1,471 (76.9%) | 35 (2.4%) |
| 60 to 64 Years | 1,288 (61.2%) | 0 (0.0%) |
| 65 to 74 Years | 1,021 (32.7%) | 21 (2.1%) |
| 75 Years and over | 211 (10.6%) | 0 (0.0%) |
| Total | 32,383 (68.6%) | 1,457 (4.5%) |
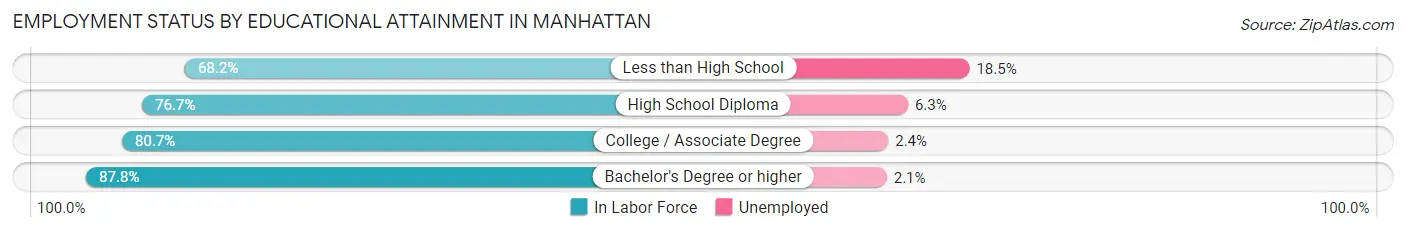
Employment Status by Educational Attainment in Manhattan
According to labor force statistics for Manhattan, 83.3% of individuals (17,930) out of the total population between 25 and 64 years of age (21,525) are in the labor force, with 3.4% or 610 of them being unemployed. The group with the highest labor force participation rate are those with the educational attainment of bachelor's degree or higher, with 87.8% or 9,957 individuals in the labor force. Within the labor force, individuals with less than high school education have the highest percentage of unemployment, with 18.5% or 136 of them being unemployed.
| Educational Attainment | In Labor Force | Unemployed |
| Less than High School | 737 (68.2%) | 200 (18.5%) |
| High School Diploma | 2,032 (76.7%) | 167 (6.3%) |
| College / Associate Degree | 5,210 (80.7%) | 155 (2.4%) |
| Bachelor's Degree or higher | 9,957 (87.8%) | 238 (2.1%) |
| Total | 17,930 (83.3%) | 732 (3.4%) |
Employment Occupations by Sex in Manhattan
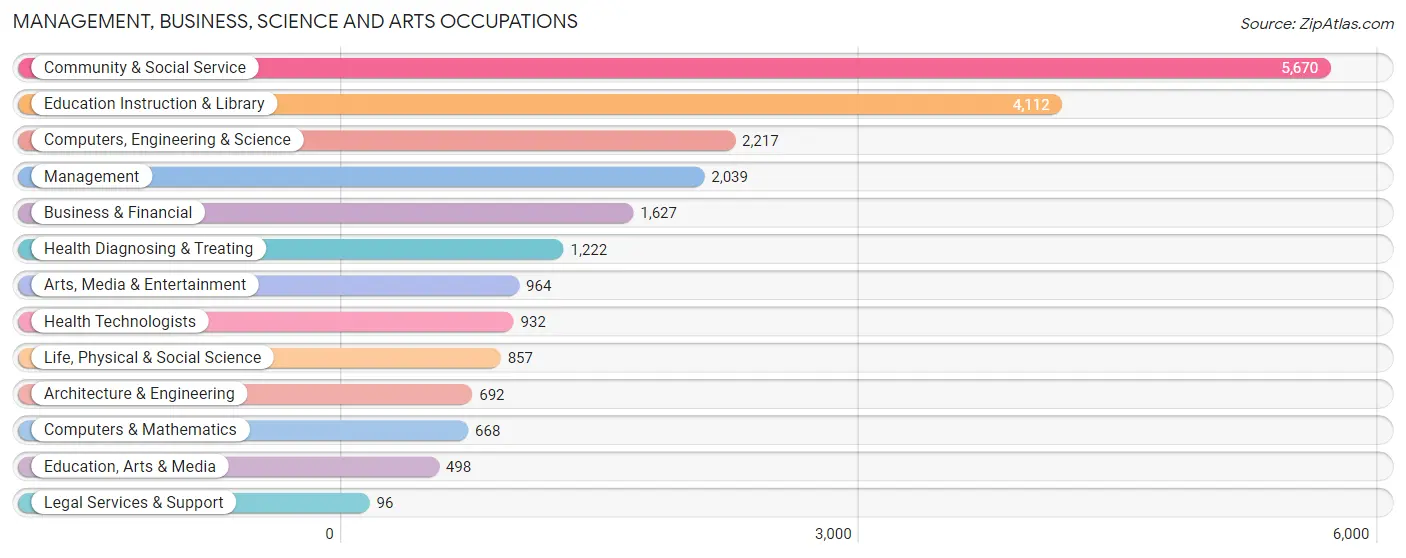
Management, Business, Science and Arts Occupations
The most common Management, Business, Science and Arts occupations in Manhattan are Community & Social Service (5,670 | 18.9%), Education Instruction & Library (4,112 | 13.7%), Computers, Engineering & Science (2,217 | 7.4%), Management (2,039 | 6.8%), and Business & Financial (1,627 | 5.4%).
Management, Business, Science and Arts Occupations by Sex
Within the Management, Business, Science and Arts occupations in Manhattan, the most male-oriented occupations are Computers & Mathematics (84.4%), Architecture & Engineering (84.3%), and Computers, Engineering & Science (76.4%), while the most female-oriented occupations are Health Technologists (71.8%), Health Diagnosing & Treating (70.8%), and Education Instruction & Library (62.6%).
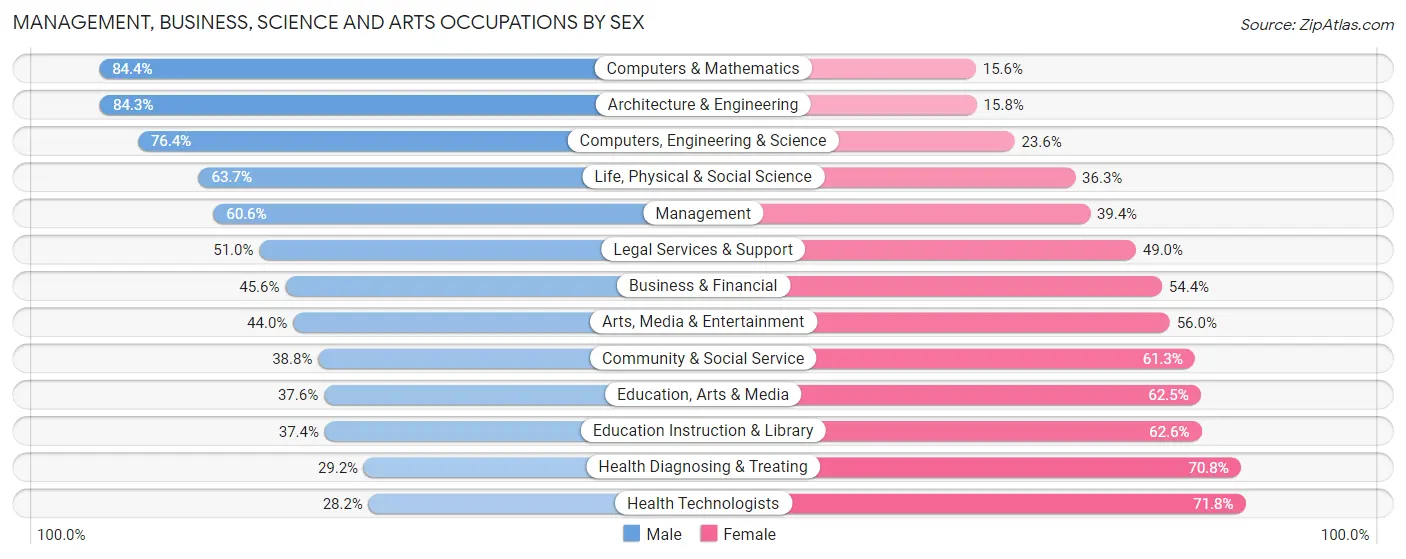
| Occupation | Male | Female |
| Management | 1,236 (60.6%) | 803 (39.4%) |
| Business & Financial | 742 (45.6%) | 885 (54.4%) |
| Computers, Engineering & Science | 1,693 (76.4%) | 524 (23.6%) |
| Computers & Mathematics | 564 (84.4%) | 104 (15.6%) |
| Architecture & Engineering | 583 (84.3%) | 109 (15.8%) |
| Life, Physical & Social Science | 546 (63.7%) | 311 (36.3%) |
| Community & Social Service | 2,197 (38.8%) | 3,473 (61.3%) |
| Education, Arts & Media | 187 (37.6%) | 311 (62.5%) |
| Legal Services & Support | 49 (51.0%) | 47 (49.0%) |
| Education Instruction & Library | 1,537 (37.4%) | 2,575 (62.6%) |
| Arts, Media & Entertainment | 424 (44.0%) | 540 (56.0%) |
| Health Diagnosing & Treating | 357 (29.2%) | 865 (70.8%) |
| Health Technologists | 263 (28.2%) | 669 (71.8%) |
| Total (Category) | 6,225 (48.7%) | 6,550 (51.3%) |
| Total (Overall) | 15,349 (51.2%) | 14,609 (48.8%) |
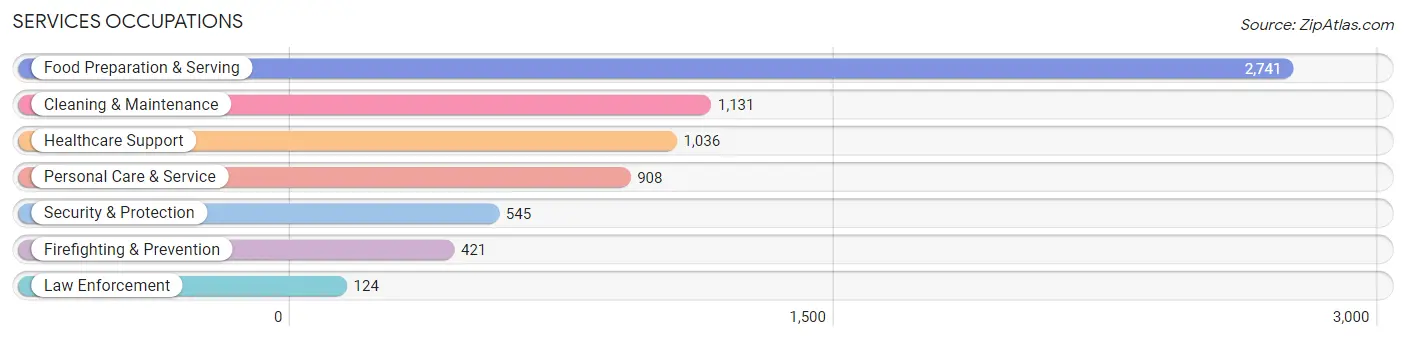
Services Occupations
The most common Services occupations in Manhattan are Food Preparation & Serving (2,741 | 9.1%), Cleaning & Maintenance (1,131 | 3.8%), Healthcare Support (1,036 | 3.5%), Personal Care & Service (908 | 3.0%), and Security & Protection (545 | 1.8%).
Services Occupations by Sex
Within the Services occupations in Manhattan, the most male-oriented occupations are Firefighting & Prevention (91.0%), Security & Protection (86.6%), and Law Enforcement (71.8%), while the most female-oriented occupations are Healthcare Support (76.7%), Personal Care & Service (63.1%), and Food Preparation & Serving (57.1%).
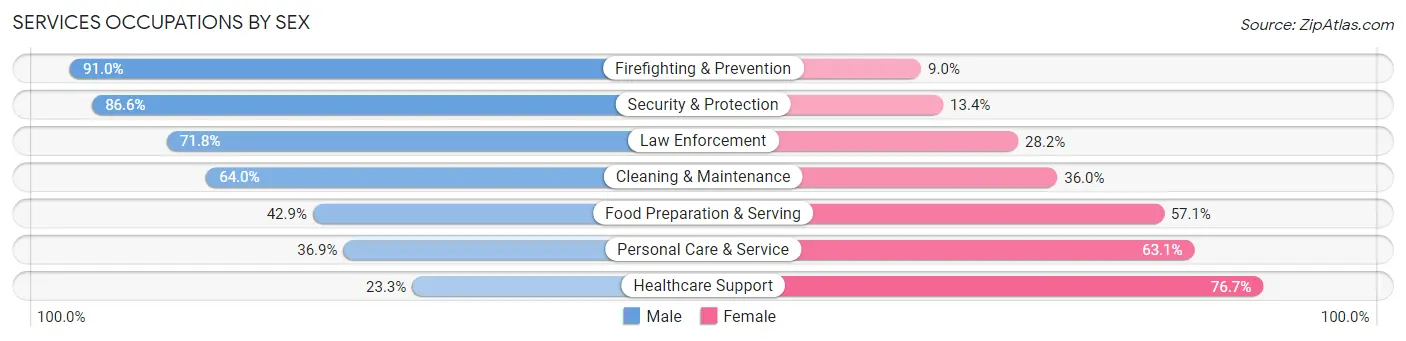
| Occupation | Male | Female |
| Healthcare Support | 241 (23.3%) | 795 (76.7%) |
| Security & Protection | 472 (86.6%) | 73 (13.4%) |
| Firefighting & Prevention | 383 (91.0%) | 38 (9.0%) |
| Law Enforcement | 89 (71.8%) | 35 (28.2%) |
| Food Preparation & Serving | 1,177 (42.9%) | 1,564 (57.1%) |
| Cleaning & Maintenance | 724 (64.0%) | 407 (36.0%) |
| Personal Care & Service | 335 (36.9%) | 573 (63.1%) |
| Total (Category) | 2,949 (46.4%) | 3,412 (53.6%) |
| Total (Overall) | 15,349 (51.2%) | 14,609 (48.8%) |
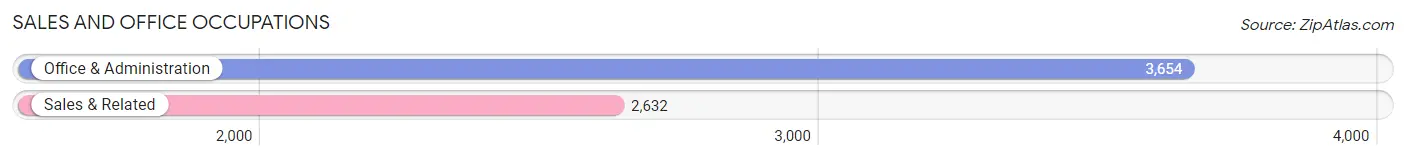
Sales and Office Occupations
The most common Sales and Office occupations in Manhattan are Office & Administration (3,654 | 12.2%), and Sales & Related (2,632 | 8.8%).
Sales and Office Occupations by Sex
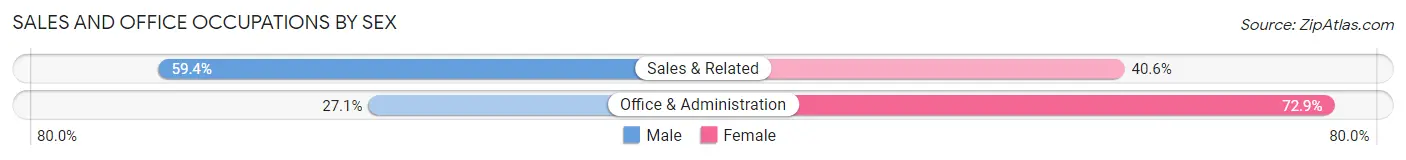
| Occupation | Male | Female |
| Sales & Related | 1,563 (59.4%) | 1,069 (40.6%) |
| Office & Administration | 991 (27.1%) | 2,663 (72.9%) |
| Total (Category) | 2,554 (40.6%) | 3,732 (59.4%) |
| Total (Overall) | 15,349 (51.2%) | 14,609 (48.8%) |
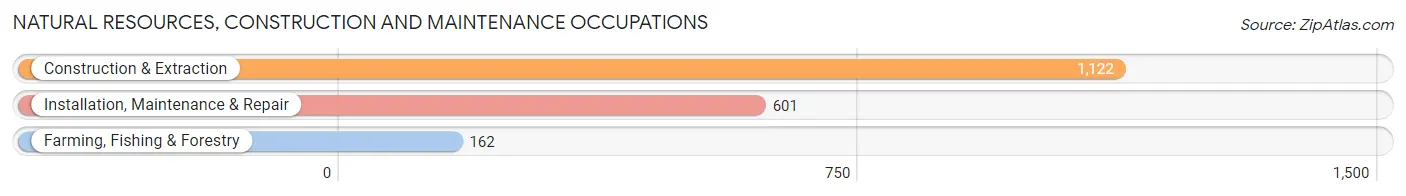
Natural Resources, Construction and Maintenance Occupations
The most common Natural Resources, Construction and Maintenance occupations in Manhattan are Construction & Extraction (1,122 | 3.7%), Installation, Maintenance & Repair (601 | 2.0%), and Farming, Fishing & Forestry (162 | 0.5%).
Natural Resources, Construction and Maintenance Occupations by Sex
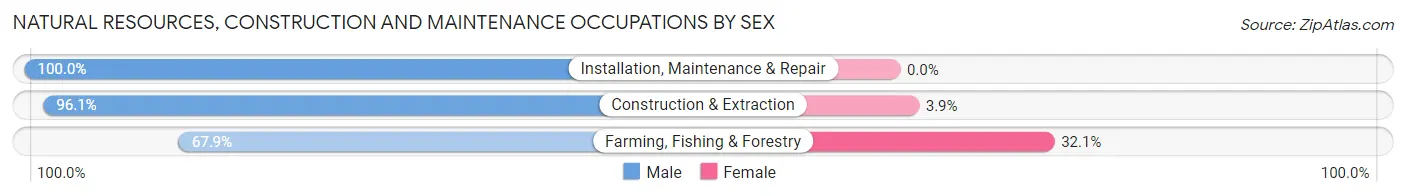
| Occupation | Male | Female |
| Farming, Fishing & Forestry | 110 (67.9%) | 52 (32.1%) |
| Construction & Extraction | 1,078 (96.1%) | 44 (3.9%) |
| Installation, Maintenance & Repair | 601 (100.0%) | 0 (0.0%) |
| Total (Category) | 1,789 (94.9%) | 96 (5.1%) |
| Total (Overall) | 15,349 (51.2%) | 14,609 (48.8%) |
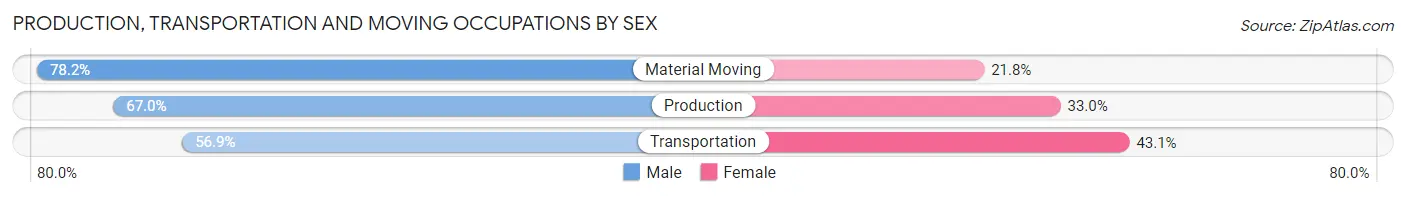
Production, Transportation and Moving Occupations
The most common Production, Transportation and Moving occupations in Manhattan are Production (1,190 | 4.0%), Material Moving (958 | 3.2%), and Transportation (503 | 1.7%).
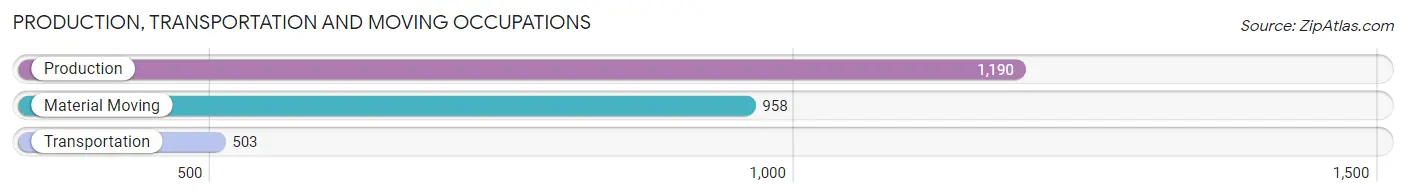
Production, Transportation and Moving Occupations by Sex
| Occupation | Male | Female |
| Production | 797 (67.0%) | 393 (33.0%) |
| Transportation | 286 (56.9%) | 217 (43.1%) |
| Material Moving | 749 (78.2%) | 209 (21.8%) |
| Total (Category) | 1,832 (69.1%) | 819 (30.9%) |
| Total (Overall) | 15,349 (51.2%) | 14,609 (48.8%) |
Employment Industries by Sex in Manhattan
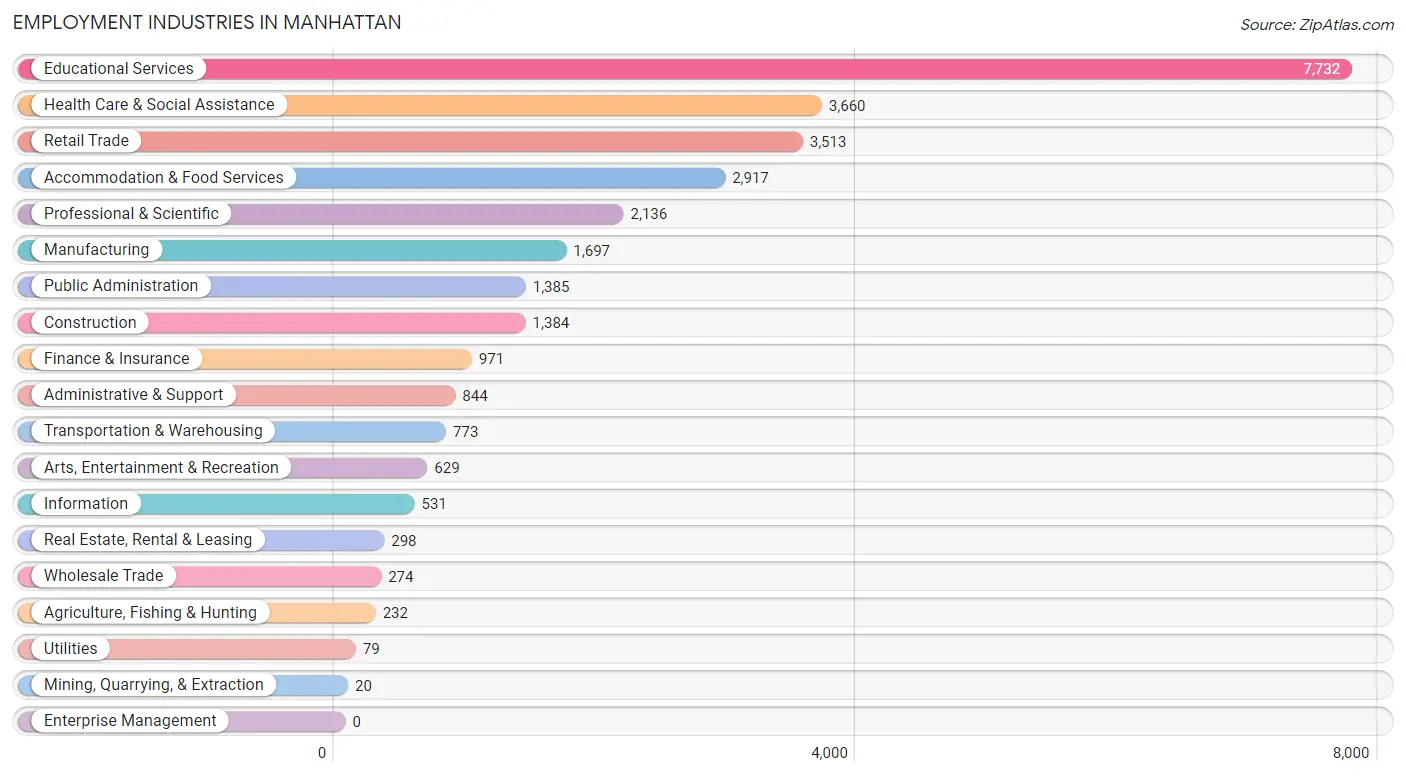
Employment Industries in Manhattan
The major employment industries in Manhattan include Educational Services (7,732 | 25.8%), Health Care & Social Assistance (3,660 | 12.2%), Retail Trade (3,513 | 11.7%), Accommodation & Food Services (2,917 | 9.7%), and Professional & Scientific (2,136 | 7.1%).
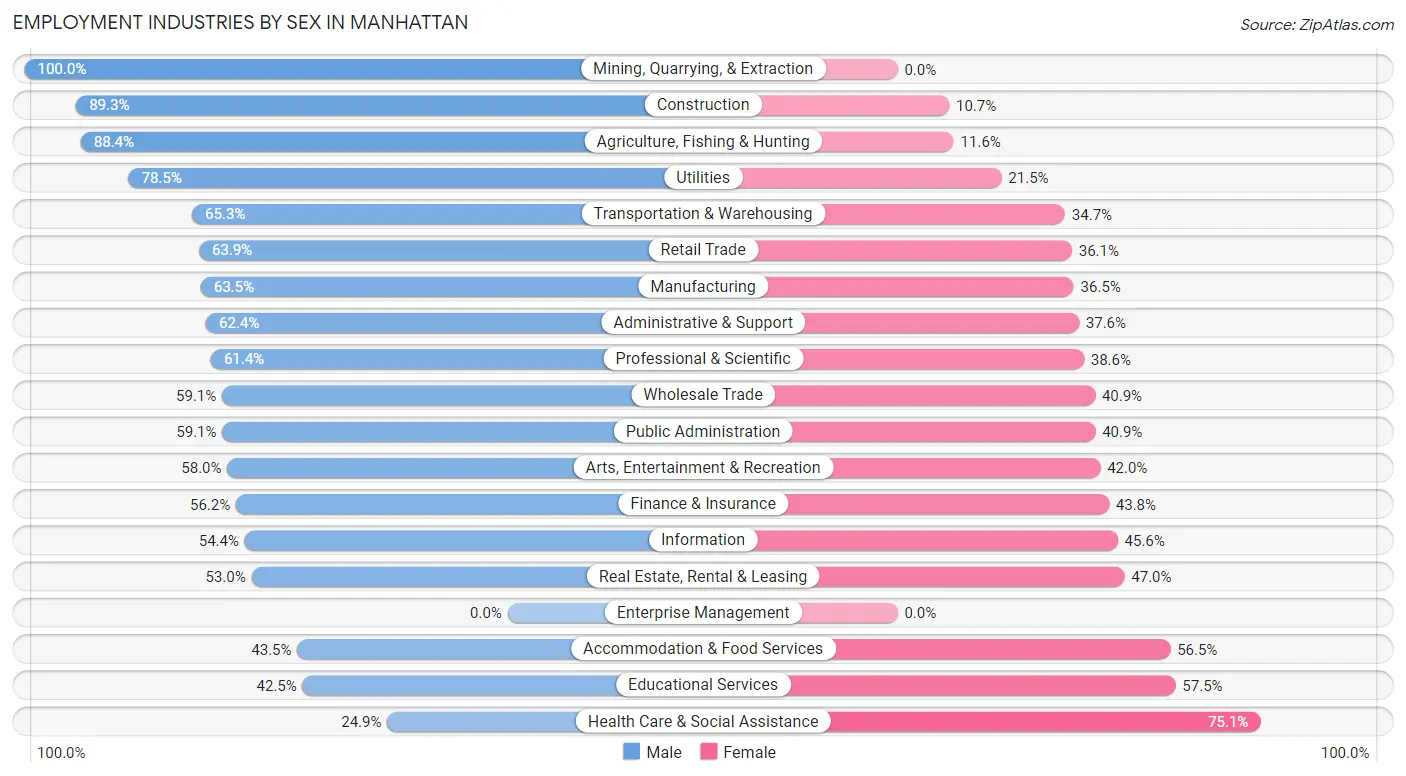
Employment Industries by Sex in Manhattan
The Manhattan industries that see more men than women are Mining, Quarrying, & Extraction (100.0%), Construction (89.3%), and Agriculture, Fishing & Hunting (88.4%), whereas the industries that tend to have a higher number of women are Health Care & Social Assistance (75.1%), Educational Services (57.5%), and Accommodation & Food Services (56.5%).
| Industry | Male | Female |
| Agriculture, Fishing & Hunting | 205 (88.4%) | 27 (11.6%) |
| Mining, Quarrying, & Extraction | 20 (100.0%) | 0 (0.0%) |
| Construction | 1,236 (89.3%) | 148 (10.7%) |
| Manufacturing | 1,078 (63.5%) | 619 (36.5%) |
| Wholesale Trade | 162 (59.1%) | 112 (40.9%) |
| Retail Trade | 2,245 (63.9%) | 1,268 (36.1%) |
| Transportation & Warehousing | 505 (65.3%) | 268 (34.7%) |
| Utilities | 62 (78.5%) | 17 (21.5%) |
| Information | 289 (54.4%) | 242 (45.6%) |
| Finance & Insurance | 546 (56.2%) | 425 (43.8%) |
| Real Estate, Rental & Leasing | 158 (53.0%) | 140 (47.0%) |
| Professional & Scientific | 1,312 (61.4%) | 824 (38.6%) |
| Enterprise Management | 0 (0.0%) | 0 (0.0%) |
| Administrative & Support | 527 (62.4%) | 317 (37.6%) |
| Educational Services | 3,283 (42.5%) | 4,449 (57.5%) |
| Health Care & Social Assistance | 912 (24.9%) | 2,748 (75.1%) |
| Arts, Entertainment & Recreation | 365 (58.0%) | 264 (42.0%) |
| Accommodation & Food Services | 1,270 (43.5%) | 1,647 (56.5%) |
| Public Administration | 818 (59.1%) | 567 (40.9%) |
| Total | 15,349 (51.2%) | 14,609 (48.8%) |
Education in Manhattan
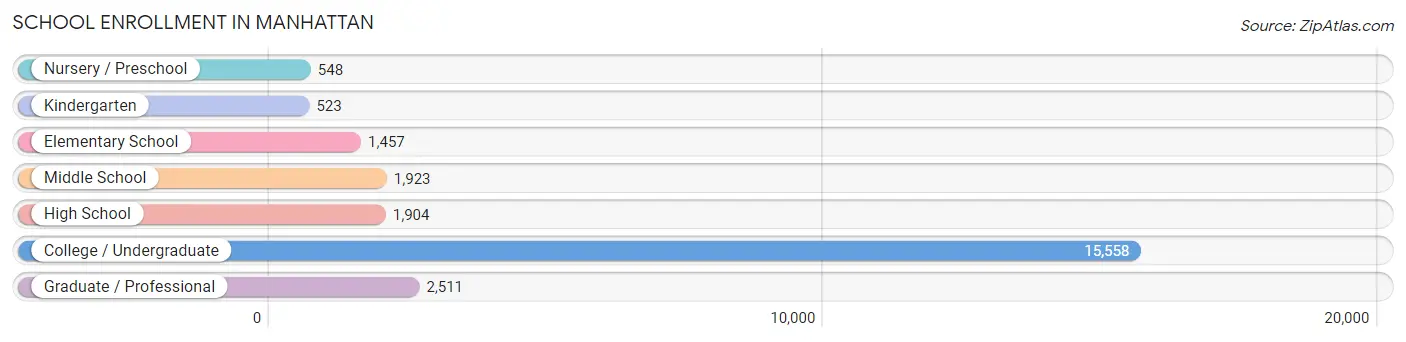
School Enrollment in Manhattan
The most common levels of schooling among the 24,424 students in Manhattan are college / undergraduate (15,558 | 63.7%), graduate / professional (2,511 | 10.3%), and middle school (1,923 | 7.9%).
| School Level | # Students | % Students |
| Nursery / Preschool | 548 | 2.2% |
| Kindergarten | 523 | 2.1% |
| Elementary School | 1,457 | 6.0% |
| Middle School | 1,923 | 7.9% |
| High School | 1,904 | 7.8% |
| College / Undergraduate | 15,558 | 63.7% |
| Graduate / Professional | 2,511 | 10.3% |
| Total | 24,424 | 100.0% |
School Enrollment by Age by Funding Source in Manhattan
Out of a total of 24,424 students who are enrolled in schools in Manhattan, 1,197 (4.9%) attend a private institution, while the remaining 23,227 (95.1%) are enrolled in public schools. The age group of 3 to 4 year olds has the highest likelihood of being enrolled in private schools, with 86 (21.3% in the age bracket) enrolled. Conversely, the age group of 18 to 19 year olds has the lowest likelihood of being enrolled in a private school, with 5,178 (98.9% in the age bracket) attending a public institution.
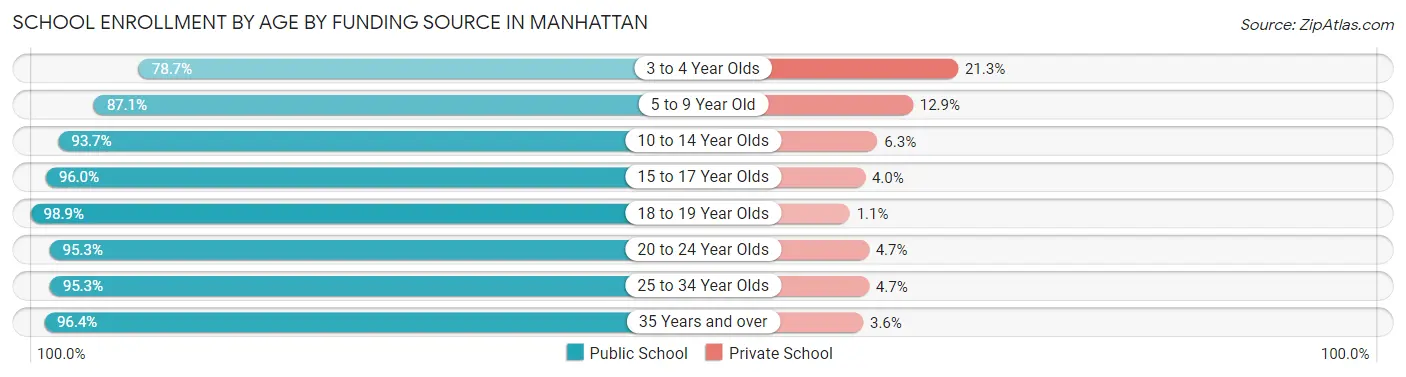
| Age Bracket | Public School | Private School |
| 3 to 4 Year Olds | 318 (78.7%) | 86 (21.3%) |
| 5 to 9 Year Old | 1,677 (87.1%) | 248 (12.9%) |
| 10 to 14 Year Olds | 2,060 (93.7%) | 138 (6.3%) |
| 15 to 17 Year Olds | 1,335 (96.0%) | 55 (4.0%) |
| 18 to 19 Year Olds | 5,178 (98.9%) | 59 (1.1%) |
| 20 to 24 Year Olds | 9,761 (95.3%) | 477 (4.7%) |
| 25 to 34 Year Olds | 1,966 (95.3%) | 97 (4.7%) |
| 35 Years and over | 934 (96.4%) | 35 (3.6%) |
| Total | 23,227 (95.1%) | 1,197 (4.9%) |
Educational Attainment by Field of Study in Manhattan
Business (2,662 | 17.6%), education (2,065 | 13.6%), bio, nature & agricultural (2,007 | 13.2%), arts & humanities (1,347 | 8.9%), and engineering (1,151 | 7.6%) are the most common fields of study among 15,159 individuals in Manhattan who have obtained a bachelor's degree or higher.
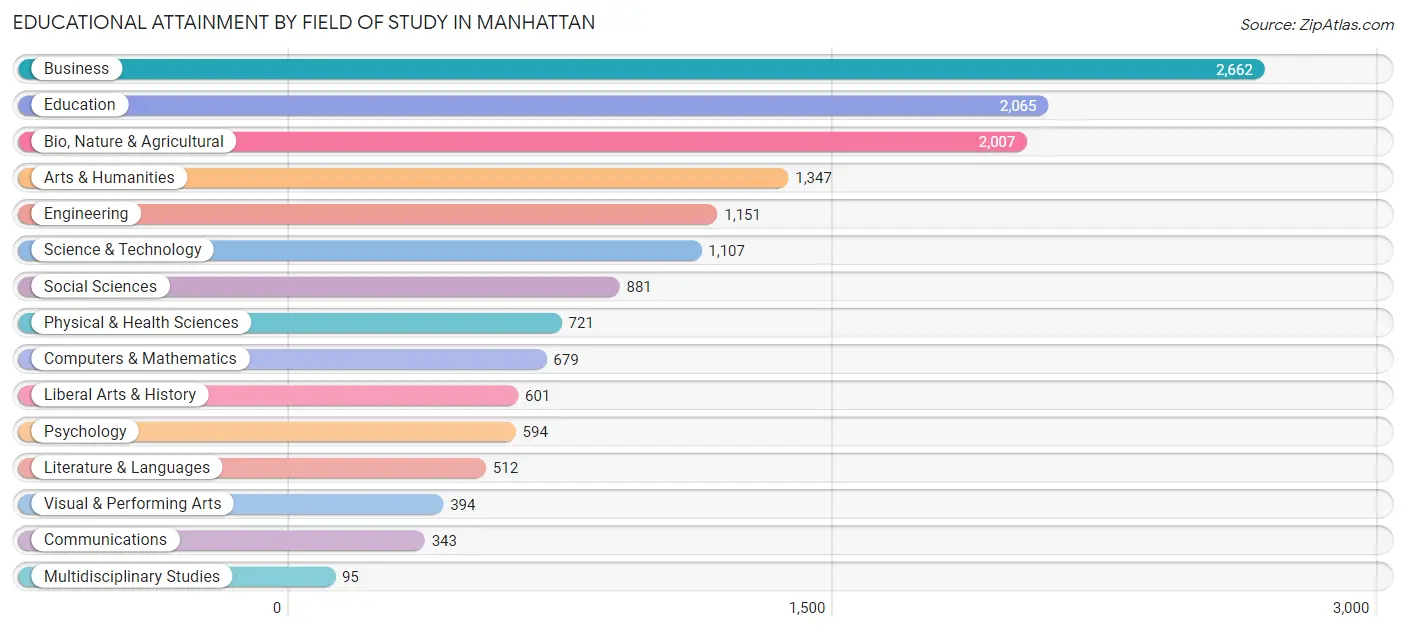
| Field of Study | # Graduates | % Graduates |
| Computers & Mathematics | 679 | 4.5% |
| Bio, Nature & Agricultural | 2,007 | 13.2% |
| Physical & Health Sciences | 721 | 4.8% |
| Psychology | 594 | 3.9% |
| Social Sciences | 881 | 5.8% |
| Engineering | 1,151 | 7.6% |
| Multidisciplinary Studies | 95 | 0.6% |
| Science & Technology | 1,107 | 7.3% |
| Business | 2,662 | 17.6% |
| Education | 2,065 | 13.6% |
| Literature & Languages | 512 | 3.4% |
| Liberal Arts & History | 601 | 4.0% |
| Visual & Performing Arts | 394 | 2.6% |
| Communications | 343 | 2.3% |
| Arts & Humanities | 1,347 | 8.9% |
| Total | 15,159 | 100.0% |
Transportation & Commute in Manhattan
Vehicle Availability by Sex in Manhattan
The most prevalent vehicle ownership categories in Manhattan are males with 2 vehicles (6,426, accounting for 43.6%) and females with 2 vehicles (5,450, making up 49.1%).
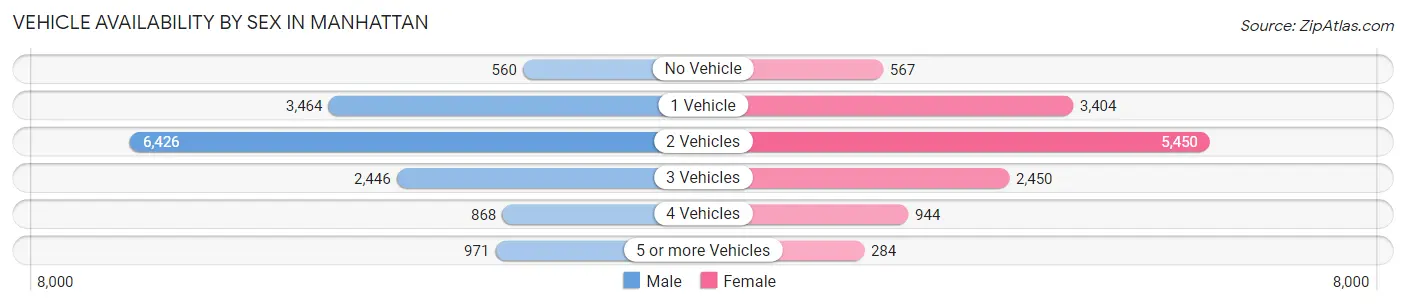
| Vehicles Available | Male | Female |
| No Vehicle | 560 (3.8%) | 567 (4.3%) |
| 1 Vehicle | 3,464 (23.5%) | 3,404 (26.0%) |
| 2 Vehicles | 6,426 (43.6%) | 5,450 (41.6%) |
| 3 Vehicles | 2,446 (16.6%) | 2,450 (18.7%) |
| 4 Vehicles | 868 (5.9%) | 944 (7.2%) |
| 5 or more Vehicles | 971 (6.6%) | 284 (2.2%) |
| Total | 14,735 (100.0%) | 13,099 (100.0%) |
Commute Time in Manhattan
The most frequently occuring commute durations in Manhattan are 10 to 14 minutes (7,700 commuters, 28.5%), 5 to 9 minutes (6,958 commuters, 25.8%), and 15 to 19 minutes (4,099 commuters, 15.2%).
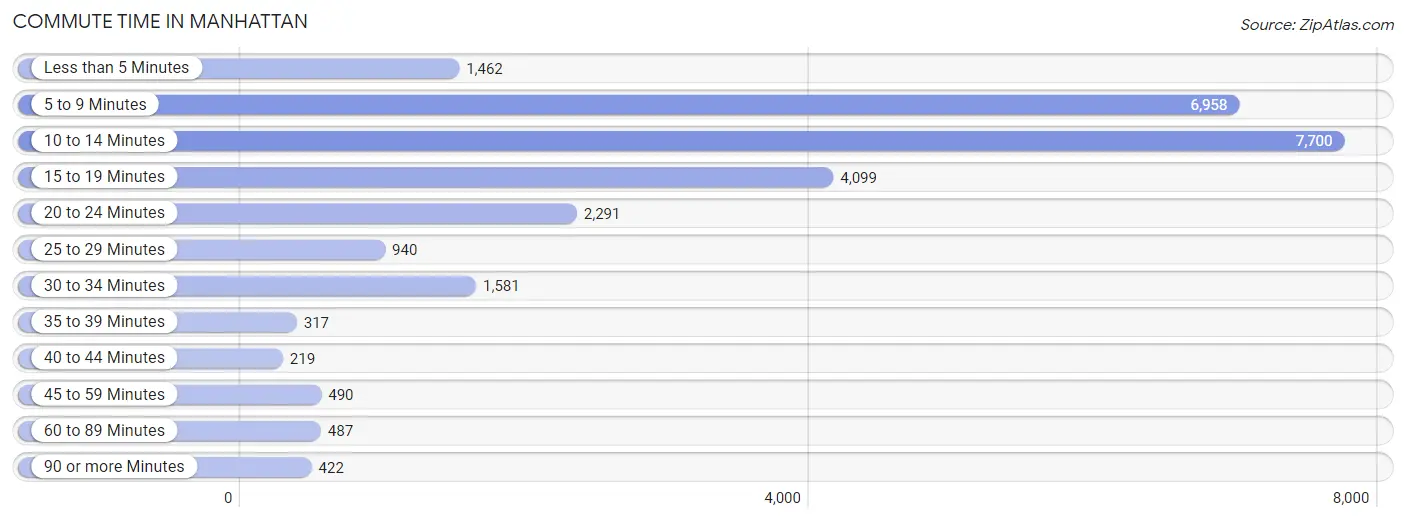
| Commute Time | # Commuters | % Commuters |
| Less than 5 Minutes | 1,462 | 5.4% |
| 5 to 9 Minutes | 6,958 | 25.8% |
| 10 to 14 Minutes | 7,700 | 28.5% |
| 15 to 19 Minutes | 4,099 | 15.2% |
| 20 to 24 Minutes | 2,291 | 8.5% |
| 25 to 29 Minutes | 940 | 3.5% |
| 30 to 34 Minutes | 1,581 | 5.9% |
| 35 to 39 Minutes | 317 | 1.2% |
| 40 to 44 Minutes | 219 | 0.8% |
| 45 to 59 Minutes | 490 | 1.8% |
| 60 to 89 Minutes | 487 | 1.8% |
| 90 or more Minutes | 422 | 1.6% |
Commute Time by Sex in Manhattan
The most common commute times in Manhattan are 5 to 9 minutes (3,706 commuters, 25.9%) for males and 10 to 14 minutes (4,039 commuters, 31.9%) for females.
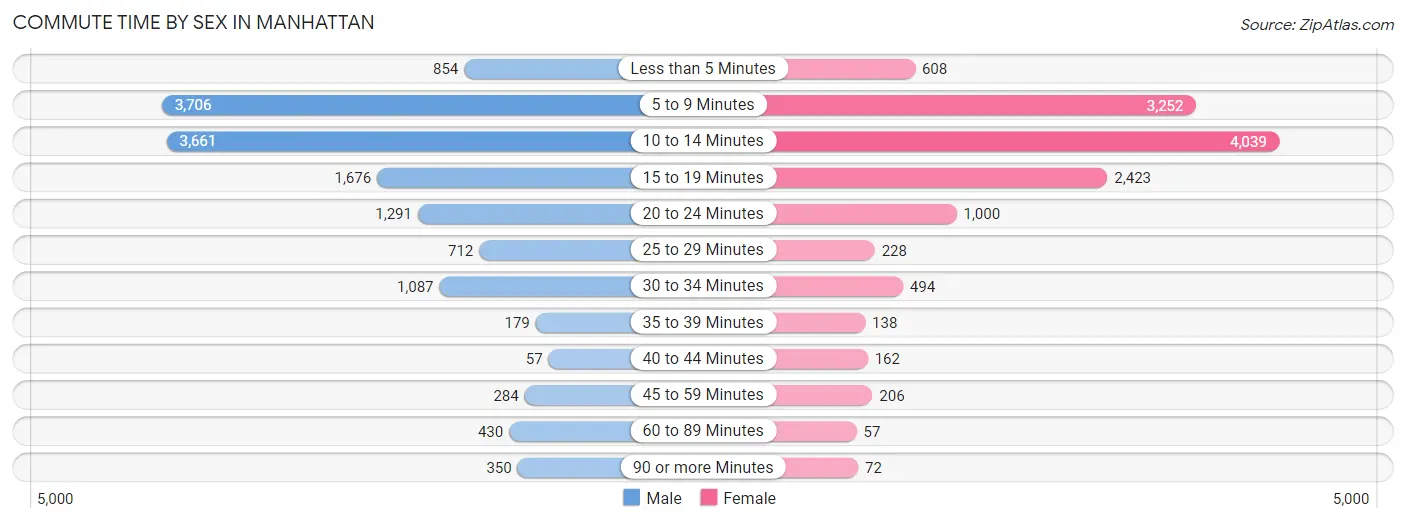
| Commute Time | Male | Female |
| Less than 5 Minutes | 854 (6.0%) | 608 (4.8%) |
| 5 to 9 Minutes | 3,706 (25.9%) | 3,252 (25.7%) |
| 10 to 14 Minutes | 3,661 (25.6%) | 4,039 (31.9%) |
| 15 to 19 Minutes | 1,676 (11.7%) | 2,423 (19.1%) |
| 20 to 24 Minutes | 1,291 (9.0%) | 1,000 (7.9%) |
| 25 to 29 Minutes | 712 (5.0%) | 228 (1.8%) |
| 30 to 34 Minutes | 1,087 (7.6%) | 494 (3.9%) |
| 35 to 39 Minutes | 179 (1.3%) | 138 (1.1%) |
| 40 to 44 Minutes | 57 (0.4%) | 162 (1.3%) |
| 45 to 59 Minutes | 284 (2.0%) | 206 (1.6%) |
| 60 to 89 Minutes | 430 (3.0%) | 57 (0.4%) |
| 90 or more Minutes | 350 (2.5%) | 72 (0.6%) |
Time of Departure to Work by Sex in Manhattan
The most frequent times of departure to work in Manhattan are 7:30 AM to 7:59 AM (2,576, 18.0%) for males and 7:30 AM to 7:59 AM (2,982, 23.5%) for females.
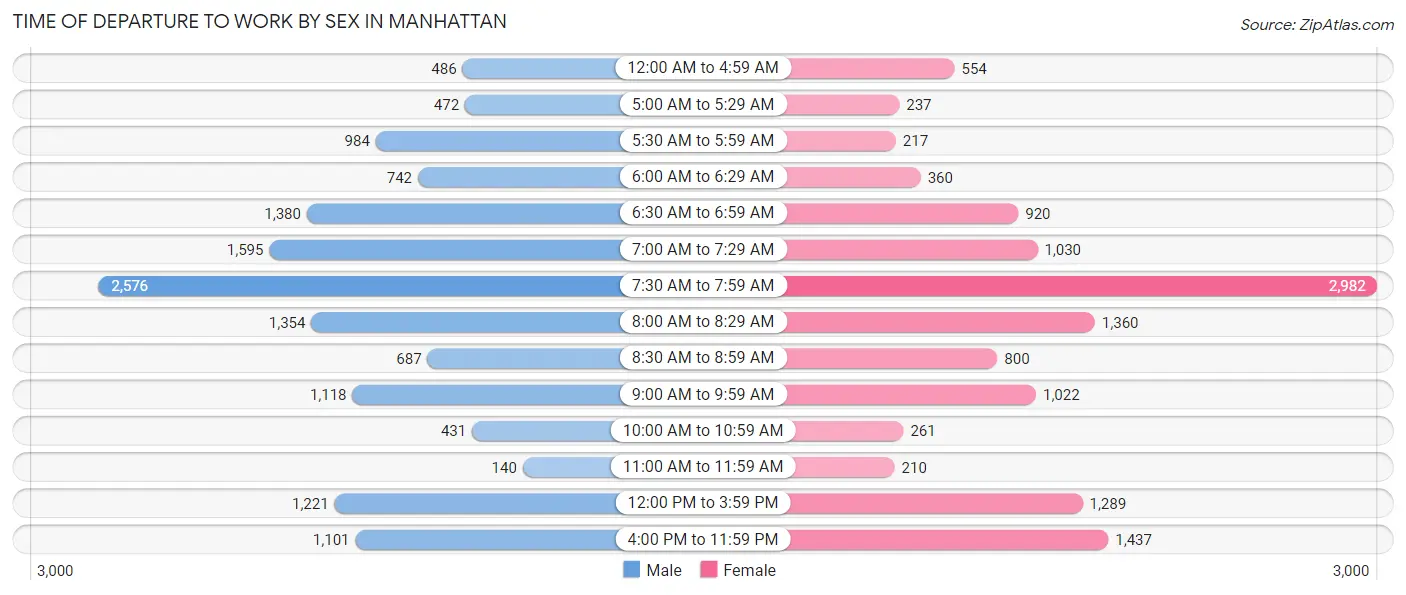
| Time of Departure | Male | Female |
| 12:00 AM to 4:59 AM | 486 (3.4%) | 554 (4.4%) |
| 5:00 AM to 5:29 AM | 472 (3.3%) | 237 (1.9%) |
| 5:30 AM to 5:59 AM | 984 (6.9%) | 217 (1.7%) |
| 6:00 AM to 6:29 AM | 742 (5.2%) | 360 (2.8%) |
| 6:30 AM to 6:59 AM | 1,380 (9.7%) | 920 (7.3%) |
| 7:00 AM to 7:29 AM | 1,595 (11.2%) | 1,030 (8.1%) |
| 7:30 AM to 7:59 AM | 2,576 (18.0%) | 2,982 (23.5%) |
| 8:00 AM to 8:29 AM | 1,354 (9.5%) | 1,360 (10.7%) |
| 8:30 AM to 8:59 AM | 687 (4.8%) | 800 (6.3%) |
| 9:00 AM to 9:59 AM | 1,118 (7.8%) | 1,022 (8.1%) |
| 10:00 AM to 10:59 AM | 431 (3.0%) | 261 (2.1%) |
| 11:00 AM to 11:59 AM | 140 (1.0%) | 210 (1.7%) |
| 12:00 PM to 3:59 PM | 1,221 (8.6%) | 1,289 (10.2%) |
| 4:00 PM to 11:59 PM | 1,101 (7.7%) | 1,437 (11.3%) |
| Total | 14,287 (100.0%) | 12,679 (100.0%) |
Housing Occupancy in Manhattan
Occupancy by Ownership in Manhattan
Of the total 21,428 dwellings in Manhattan, owner-occupied units account for 8,581 (40.1%), while renter-occupied units make up 12,847 (60.0%).
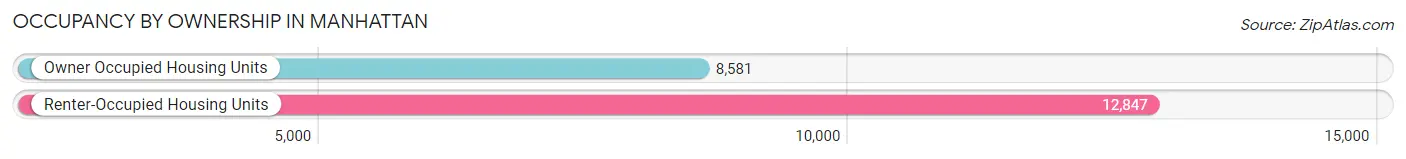
| Occupancy | # Housing Units | % Housing Units |
| Owner Occupied Housing Units | 8,581 | 40.1% |
| Renter-Occupied Housing Units | 12,847 | 60.0% |
| Total Occupied Housing Units | 21,428 | 100.0% |
Occupancy by Household Size in Manhattan
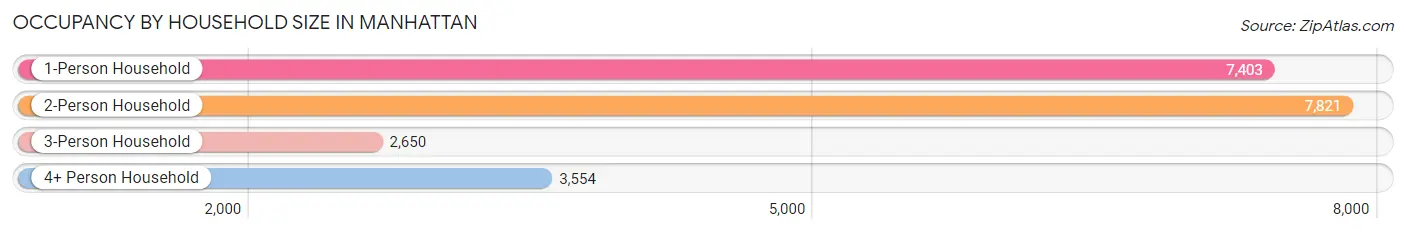
| Household Size | # Housing Units | % Housing Units |
| 1-Person Household | 7,403 | 34.5% |
| 2-Person Household | 7,821 | 36.5% |
| 3-Person Household | 2,650 | 12.4% |
| 4+ Person Household | 3,554 | 16.6% |
| Total Housing Units | 21,428 | 100.0% |
Occupancy by Ownership by Household Size in Manhattan
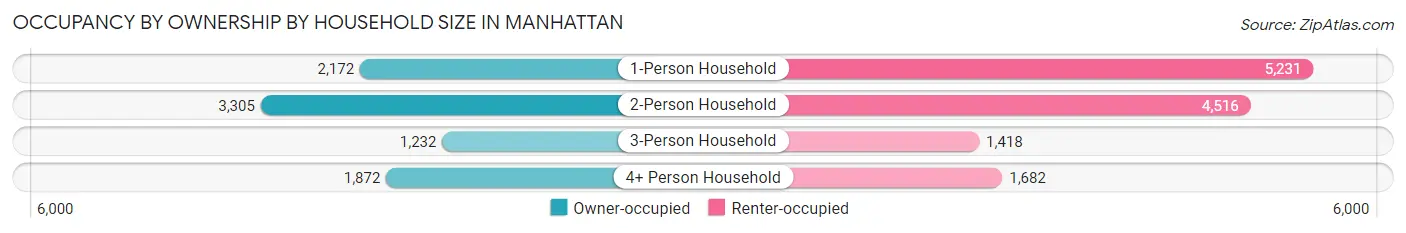
| Household Size | Owner-occupied | Renter-occupied |
| 1-Person Household | 2,172 (29.3%) | 5,231 (70.7%) |
| 2-Person Household | 3,305 (42.3%) | 4,516 (57.7%) |
| 3-Person Household | 1,232 (46.5%) | 1,418 (53.5%) |
| 4+ Person Household | 1,872 (52.7%) | 1,682 (47.3%) |
| Total Housing Units | 8,581 (40.1%) | 12,847 (60.0%) |
Occupancy by Educational Attainment in Manhattan
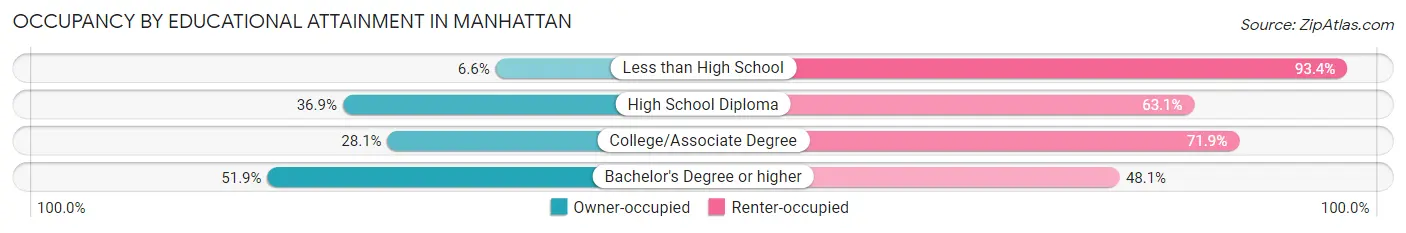
| Household Size | Owner-occupied | Renter-occupied |
| Less than High School | 49 (6.6%) | 689 (93.4%) |
| High School Diploma | 935 (36.9%) | 1,597 (63.1%) |
| College/Associate Degree | 2,148 (28.1%) | 5,505 (71.9%) |
| Bachelor's Degree or higher | 5,449 (51.9%) | 5,056 (48.1%) |
Occupancy by Age of Householder in Manhattan
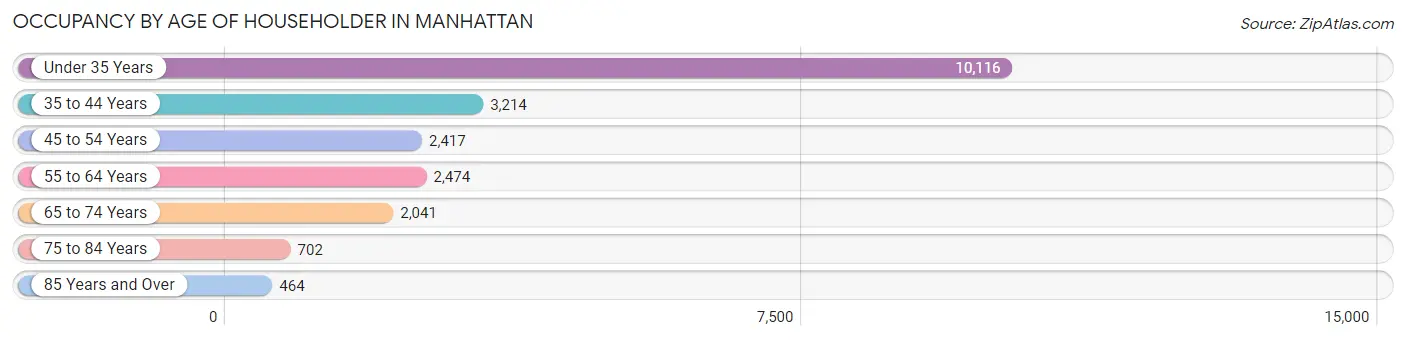
| Age Bracket | # Households | % Households |
| Under 35 Years | 10,116 | 47.2% |
| 35 to 44 Years | 3,214 | 15.0% |
| 45 to 54 Years | 2,417 | 11.3% |
| 55 to 64 Years | 2,474 | 11.6% |
| 65 to 74 Years | 2,041 | 9.5% |
| 75 to 84 Years | 702 | 3.3% |
| 85 Years and Over | 464 | 2.2% |
| Total | 21,428 | 100.0% |
Housing Finances in Manhattan
Median Income by Occupancy in Manhattan
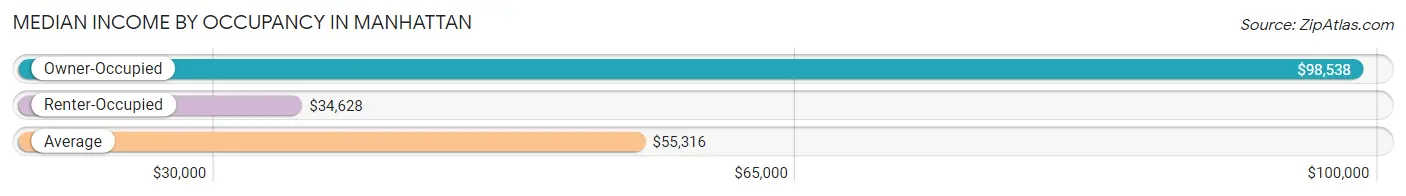
| Occupancy Type | # Households | Median Income |
| Owner-Occupied | 8,581 (40.1%) | $98,538 |
| Renter-Occupied | 12,847 (60.0%) | $34,628 |
| Average | 21,428 (100.0%) | $55,316 |
Occupancy by Householder Income Bracket in Manhattan
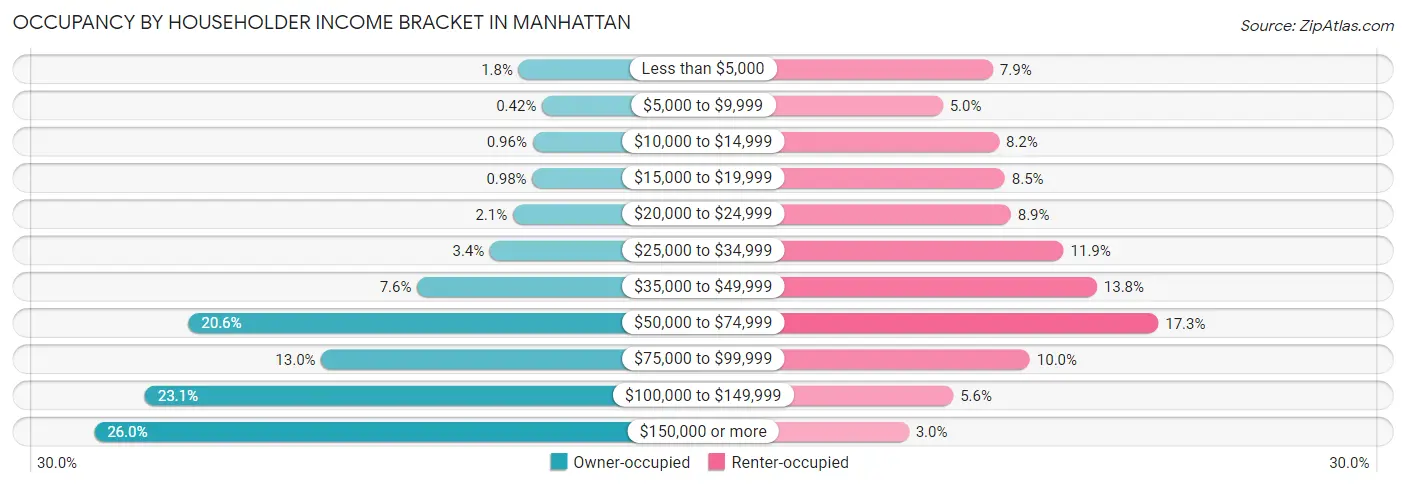
| Income Bracket | Owner-occupied | Renter-occupied |
| Less than $5,000 | 151 (1.8%) | 1,008 (7.9%) |
| $5,000 to $9,999 | 36 (0.4%) | 640 (5.0%) |
| $10,000 to $14,999 | 82 (1.0%) | 1,054 (8.2%) |
| $15,000 to $19,999 | 84 (1.0%) | 1,096 (8.5%) |
| $20,000 to $24,999 | 179 (2.1%) | 1,140 (8.9%) |
| $25,000 to $34,999 | 292 (3.4%) | 1,527 (11.9%) |
| $35,000 to $49,999 | 649 (7.6%) | 1,771 (13.8%) |
| $50,000 to $74,999 | 1,771 (20.6%) | 2,223 (17.3%) |
| $75,000 to $99,999 | 1,119 (13.0%) | 1,280 (10.0%) |
| $100,000 to $149,999 | 1,985 (23.1%) | 717 (5.6%) |
| $150,000 or more | 2,233 (26.0%) | 391 (3.0%) |
| Total | 8,581 (100.0%) | 12,847 (100.0%) |
Monthly Housing Cost Tiers in Manhattan
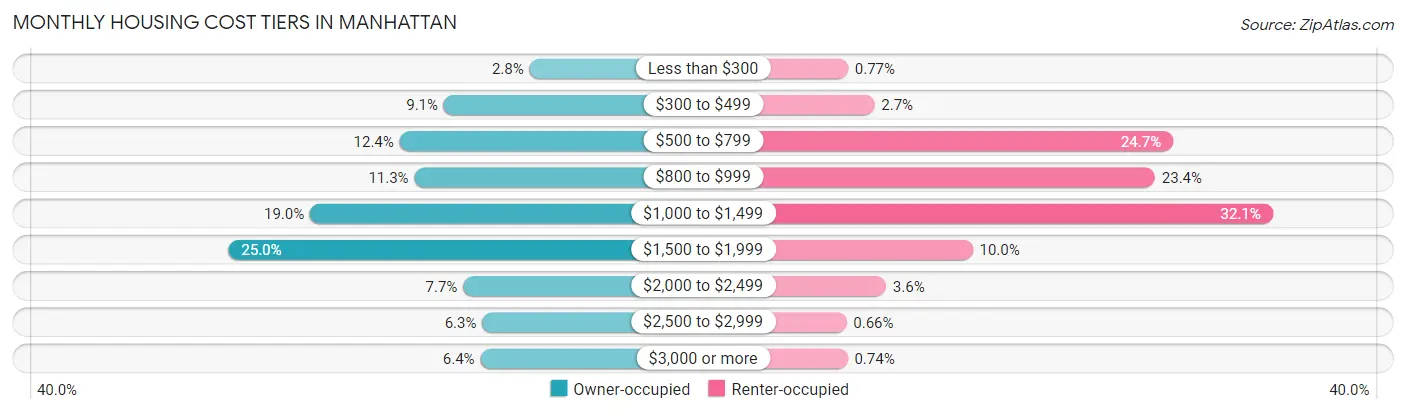
| Monthly Cost | Owner-occupied | Renter-occupied |
| Less than $300 | 241 (2.8%) | 99 (0.8%) |
| $300 to $499 | 783 (9.1%) | 349 (2.7%) |
| $500 to $799 | 1,062 (12.4%) | 3,175 (24.7%) |
| $800 to $999 | 969 (11.3%) | 3,004 (23.4%) |
| $1,000 to $1,499 | 1,629 (19.0%) | 4,118 (32.1%) |
| $1,500 to $1,999 | 2,144 (25.0%) | 1,278 (10.0%) |
| $2,000 to $2,499 | 661 (7.7%) | 458 (3.6%) |
| $2,500 to $2,999 | 540 (6.3%) | 85 (0.7%) |
| $3,000 or more | 552 (6.4%) | 95 (0.7%) |
| Total | 8,581 (100.0%) | 12,847 (100.0%) |
Physical Housing Characteristics in Manhattan
Housing Structures in Manhattan
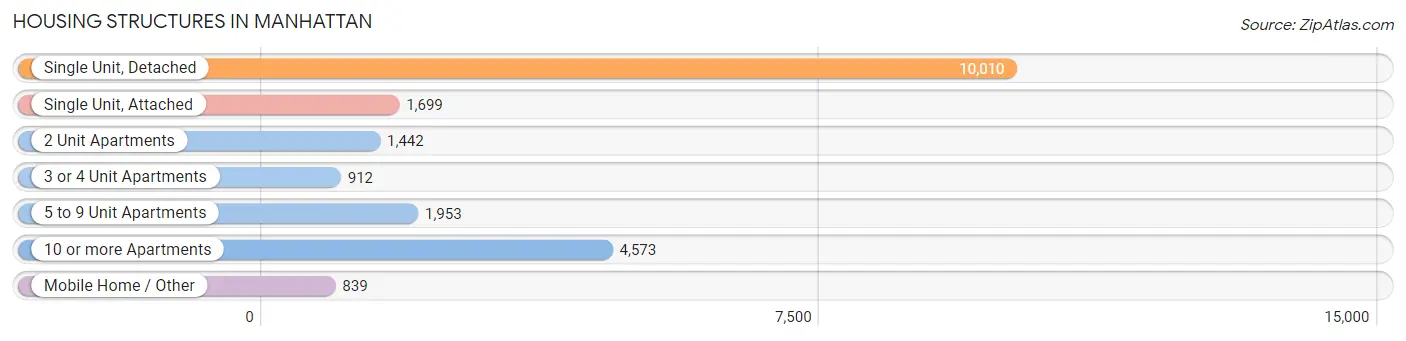
| Structure Type | # Housing Units | % Housing Units |
| Single Unit, Detached | 10,010 | 46.7% |
| Single Unit, Attached | 1,699 | 7.9% |
| 2 Unit Apartments | 1,442 | 6.7% |
| 3 or 4 Unit Apartments | 912 | 4.3% |
| 5 to 9 Unit Apartments | 1,953 | 9.1% |
| 10 or more Apartments | 4,573 | 21.3% |
| Mobile Home / Other | 839 | 3.9% |
| Total | 21,428 | 100.0% |
Housing Structures by Occupancy in Manhattan
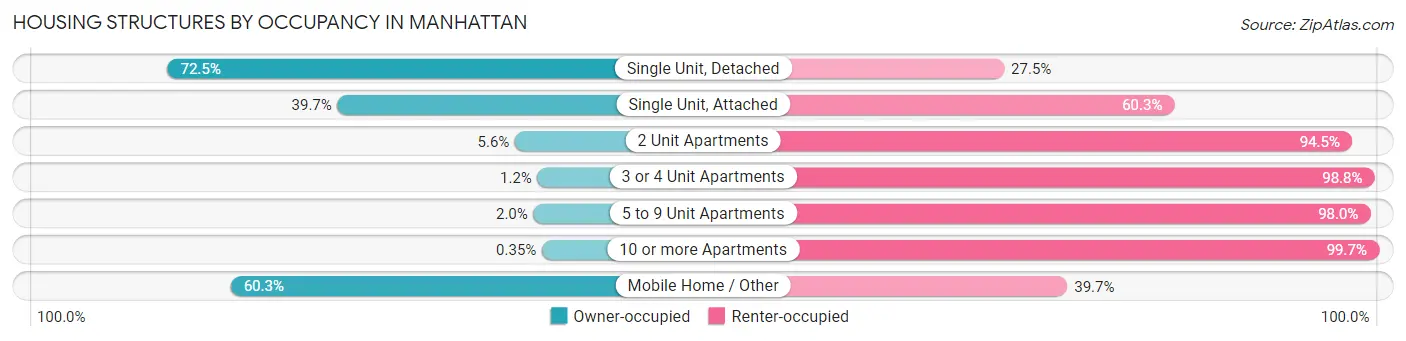
| Structure Type | Owner-occupied | Renter-occupied |
| Single Unit, Detached | 7,254 (72.5%) | 2,756 (27.5%) |
| Single Unit, Attached | 675 (39.7%) | 1,024 (60.3%) |
| 2 Unit Apartments | 80 (5.6%) | 1,362 (94.5%) |
| 3 or 4 Unit Apartments | 11 (1.2%) | 901 (98.8%) |
| 5 to 9 Unit Apartments | 39 (2.0%) | 1,914 (98.0%) |
| 10 or more Apartments | 16 (0.4%) | 4,557 (99.7%) |
| Mobile Home / Other | 506 (60.3%) | 333 (39.7%) |
| Total | 8,581 (40.1%) | 12,847 (60.0%) |
Housing Structures by Number of Rooms in Manhattan
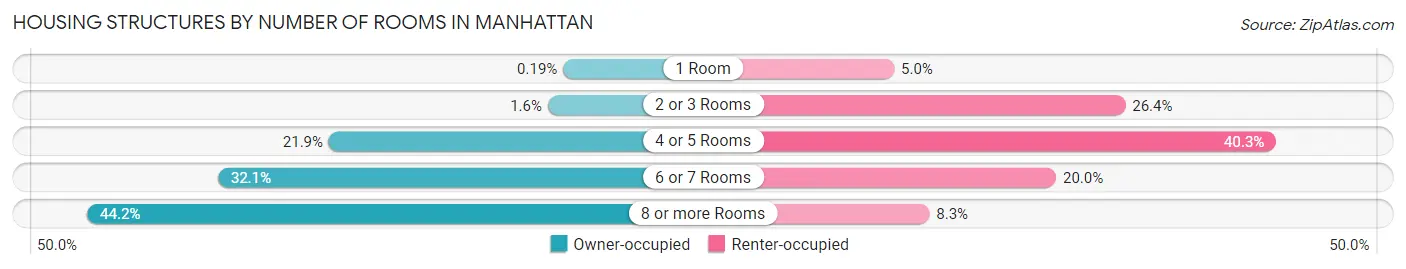
| Number of Rooms | Owner-occupied | Renter-occupied |
| 1 Room | 16 (0.2%) | 643 (5.0%) |
| 2 or 3 Rooms | 138 (1.6%) | 3,390 (26.4%) |
| 4 or 5 Rooms | 1,876 (21.9%) | 5,183 (40.3%) |
| 6 or 7 Rooms | 2,757 (32.1%) | 2,568 (20.0%) |
| 8 or more Rooms | 3,794 (44.2%) | 1,063 (8.3%) |
| Total | 8,581 (100.0%) | 12,847 (100.0%) |
Housing Structure by Heating Type in Manhattan
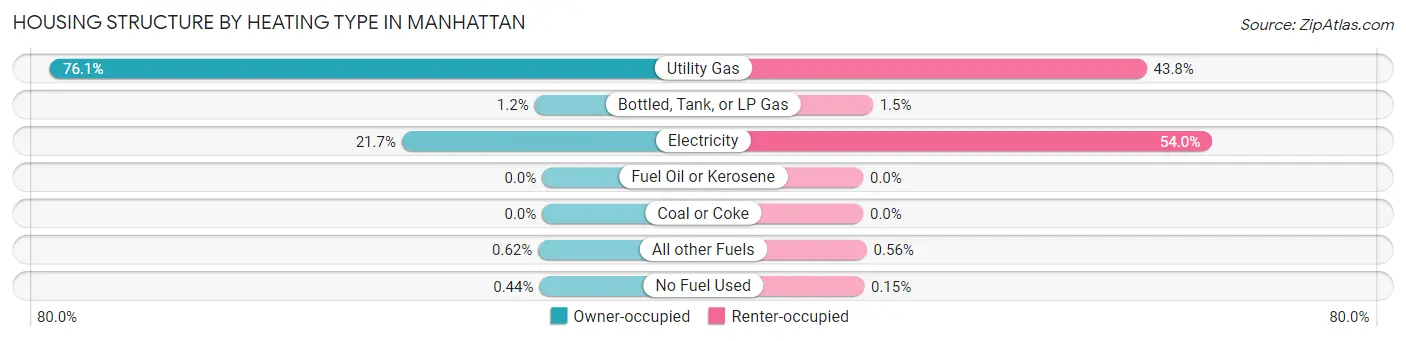
| Heating Type | Owner-occupied | Renter-occupied |
| Utility Gas | 6,527 (76.1%) | 5,632 (43.8%) |
| Bottled, Tank, or LP Gas | 101 (1.2%) | 193 (1.5%) |
| Electricity | 1,862 (21.7%) | 6,931 (53.9%) |
| Fuel Oil or Kerosene | 0 (0.0%) | 0 (0.0%) |
| Coal or Coke | 0 (0.0%) | 0 (0.0%) |
| All other Fuels | 53 (0.6%) | 72 (0.6%) |
| No Fuel Used | 38 (0.4%) | 19 (0.2%) |
| Total | 8,581 (100.0%) | 12,847 (100.0%) |
Household Vehicle Usage in Manhattan
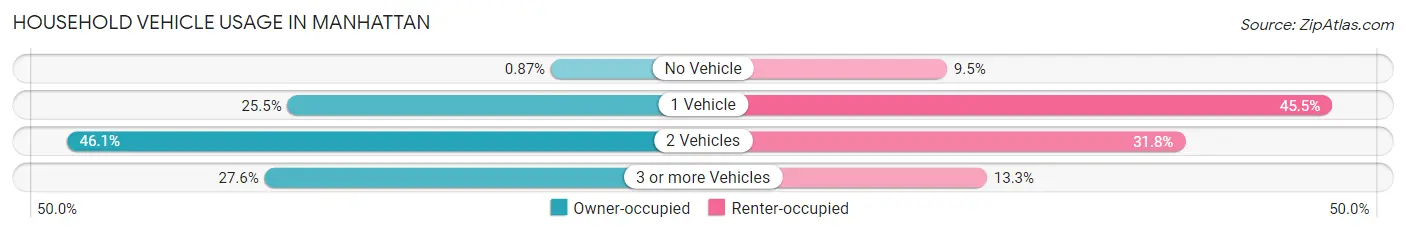
| Vehicles per Household | Owner-occupied | Renter-occupied |
| No Vehicle | 75 (0.9%) | 1,223 (9.5%) |
| 1 Vehicle | 2,185 (25.5%) | 5,842 (45.5%) |
| 2 Vehicles | 3,953 (46.1%) | 4,080 (31.8%) |
| 3 or more Vehicles | 2,368 (27.6%) | 1,702 (13.3%) |
| Total | 8,581 (100.0%) | 12,847 (100.0%) |
Real Estate & Mortgages in Manhattan
Real Estate and Mortgage Overview in Manhattan
| Characteristic | Without Mortgage | With Mortgage |
| Housing Units | 3,112 | 5,469 |
| Median Property Value | $215,400 | $254,900 |
| Median Household Income | $78,053 | $1,647 |
| Monthly Housing Costs | $684 | $552 |
| Real Estate Taxes | $3,510 | $32 |
Property Value by Mortgage Status in Manhattan
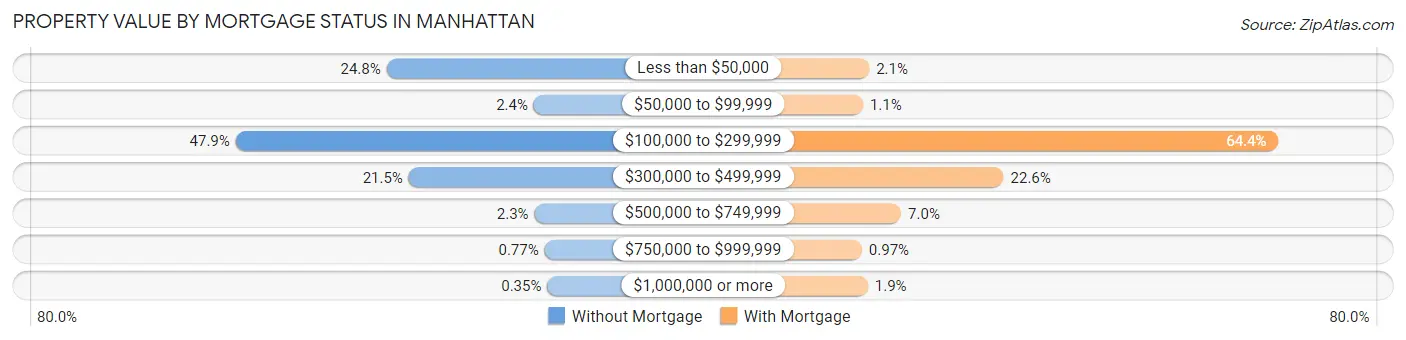
| Property Value | Without Mortgage | With Mortgage |
| Less than $50,000 | 773 (24.8%) | 114 (2.1%) |
| $50,000 to $99,999 | 75 (2.4%) | 62 (1.1%) |
| $100,000 to $299,999 | 1,489 (47.8%) | 3,524 (64.4%) |
| $300,000 to $499,999 | 668 (21.5%) | 1,234 (22.6%) |
| $500,000 to $749,999 | 72 (2.3%) | 380 (7.0%) |
| $750,000 to $999,999 | 24 (0.8%) | 53 (1.0%) |
| $1,000,000 or more | 11 (0.4%) | 102 (1.9%) |
| Total | 3,112 (100.0%) | 5,469 (100.0%) |
Household Income by Mortgage Status in Manhattan
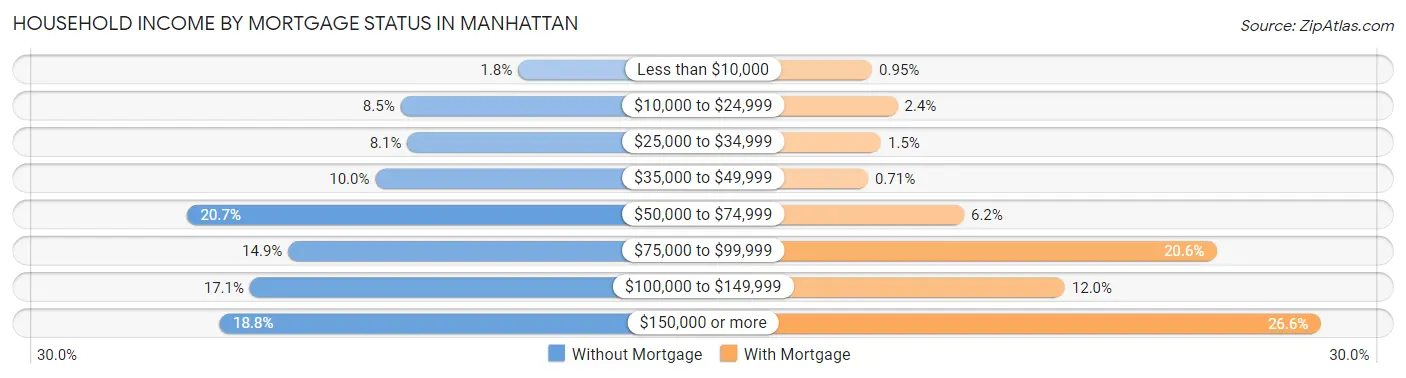
| Household Income | Without Mortgage | With Mortgage |
| Less than $10,000 | 56 (1.8%) | 52 (0.9%) |
| $10,000 to $24,999 | 265 (8.5%) | 131 (2.4%) |
| $25,000 to $34,999 | 253 (8.1%) | 80 (1.5%) |
| $35,000 to $49,999 | 310 (10.0%) | 39 (0.7%) |
| $50,000 to $74,999 | 644 (20.7%) | 339 (6.2%) |
| $75,000 to $99,999 | 465 (14.9%) | 1,127 (20.6%) |
| $100,000 to $149,999 | 533 (17.1%) | 654 (12.0%) |
| $150,000 or more | 586 (18.8%) | 1,452 (26.6%) |
| Total | 3,112 (100.0%) | 5,469 (100.0%) |
Property Value to Household Income Ratio in Manhattan
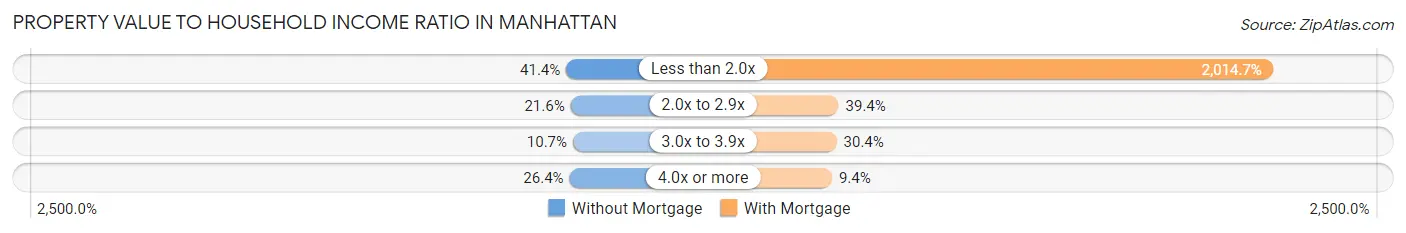
| Value-to-Income Ratio | Without Mortgage | With Mortgage |
| Less than 2.0x | 1,287 (41.4%) | 110,186 (2,014.7%) |
| 2.0x to 2.9x | 671 (21.6%) | 2,155 (39.4%) |
| 3.0x to 3.9x | 334 (10.7%) | 1,664 (30.4%) |
| 4.0x or more | 820 (26.4%) | 513 (9.4%) |
| Total | 3,112 (100.0%) | 5,469 (100.0%) |
Real Estate Taxes by Mortgage Status in Manhattan

| Property Taxes | Without Mortgage | With Mortgage |
| Less than $800 | 569 (18.3%) | 0 (0.0%) |
| $800 to $1,499 | 119 (3.8%) | 117 (2.1%) |
| $800 to $1,499 | 2,150 (69.1%) | 348 (6.4%) |
| Total | 3,112 (100.0%) | 5,469 (100.0%) |
Health & Disability in Manhattan
Health Insurance Coverage by Age in Manhattan
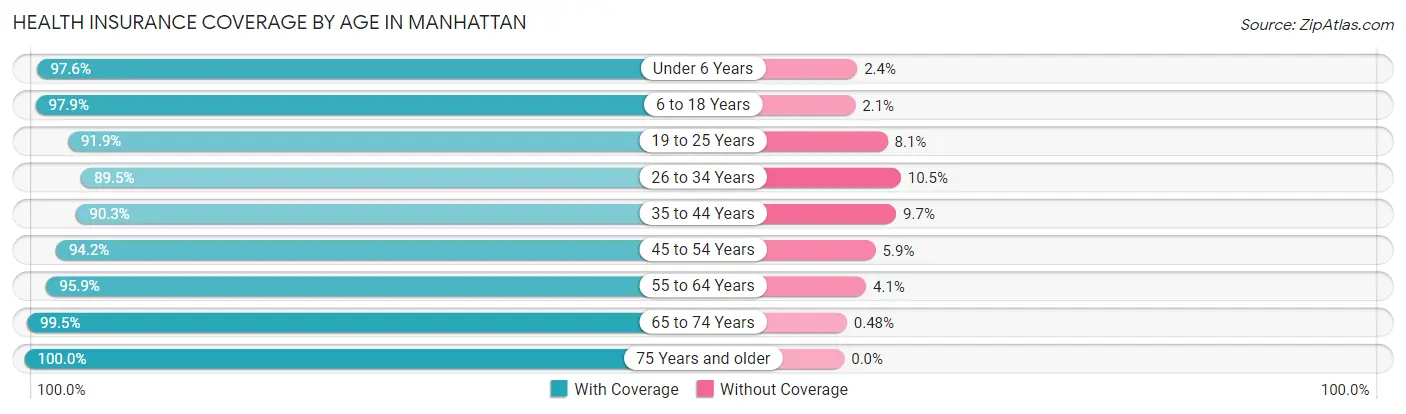
| Age Bracket | With Coverage | Without Coverage |
| Under 6 Years | 2,674 (97.6%) | 66 (2.4%) |
| 6 to 18 Years | 7,325 (97.9%) | 154 (2.1%) |
| 19 to 25 Years | 16,936 (91.9%) | 1,489 (8.1%) |
| 26 to 34 Years | 5,635 (89.5%) | 664 (10.5%) |
| 35 to 44 Years | 4,790 (90.3%) | 513 (9.7%) |
| 45 to 54 Years | 3,605 (94.2%) | 224 (5.9%) |
| 55 to 64 Years | 3,844 (95.9%) | 163 (4.1%) |
| 65 to 74 Years | 3,085 (99.5%) | 15 (0.5%) |
| 75 Years and older | 1,720 (100.0%) | 0 (0.0%) |
| Total | 49,614 (93.8%) | 3,288 (6.2%) |
Health Insurance Coverage by Citizenship Status in Manhattan
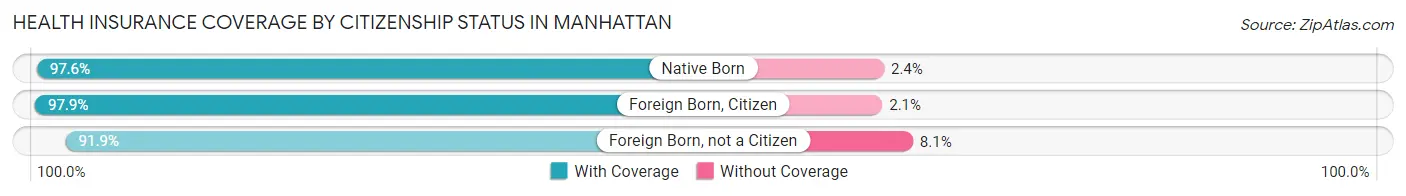
| Citizenship Status | With Coverage | Without Coverage |
| Native Born | 2,674 (97.6%) | 66 (2.4%) |
| Foreign Born, Citizen | 7,325 (97.9%) | 154 (2.1%) |
| Foreign Born, not a Citizen | 16,936 (91.9%) | 1,489 (8.1%) |
Health Insurance Coverage by Household Income in Manhattan
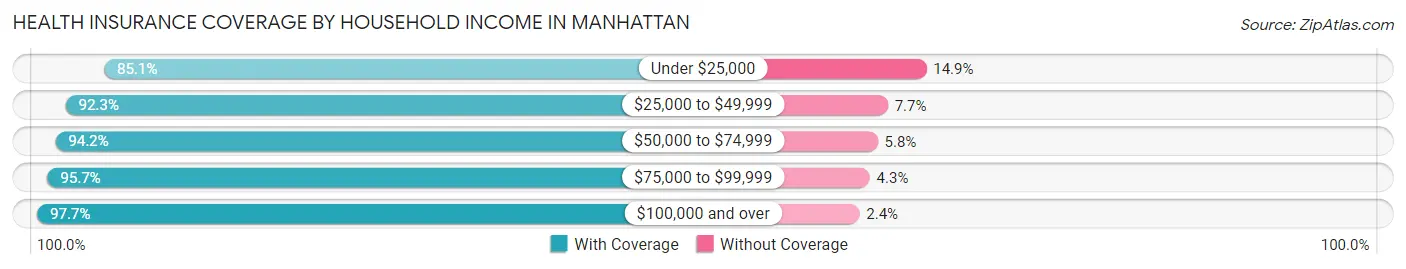
| Household Income | With Coverage | Without Coverage |
| Under $25,000 | 8,430 (85.1%) | 1,475 (14.9%) |
| $25,000 to $49,999 | 8,092 (92.3%) | 672 (7.7%) |
| $50,000 to $74,999 | 7,192 (94.2%) | 440 (5.8%) |
| $75,000 to $99,999 | 5,590 (95.7%) | 250 (4.3%) |
| $100,000 and over | 14,128 (97.7%) | 340 (2.4%) |
Public vs Private Health Insurance Coverage by Age in Manhattan
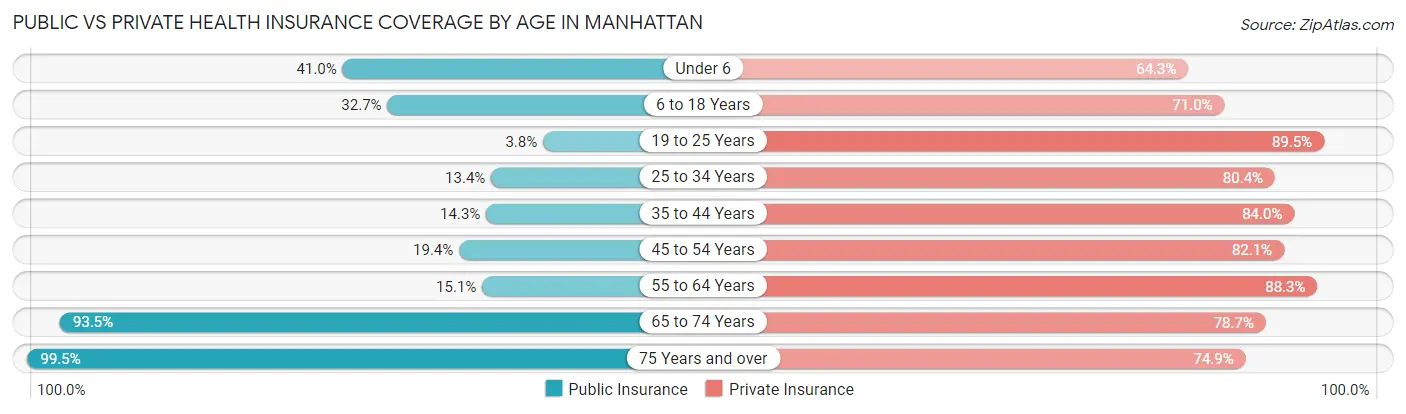
| Age Bracket | Public Insurance | Private Insurance |
| Under 6 | 1,123 (41.0%) | 1,762 (64.3%) |
| 6 to 18 Years | 2,443 (32.7%) | 5,311 (71.0%) |
| 19 to 25 Years | 692 (3.8%) | 16,489 (89.5%) |
| 25 to 34 Years | 844 (13.4%) | 5,063 (80.4%) |
| 35 to 44 Years | 760 (14.3%) | 4,453 (84.0%) |
| 45 to 54 Years | 741 (19.4%) | 3,142 (82.1%) |
| 55 to 64 Years | 604 (15.1%) | 3,536 (88.2%) |
| 65 to 74 Years | 2,897 (93.4%) | 2,439 (78.7%) |
| 75 Years and over | 1,711 (99.5%) | 1,289 (74.9%) |
| Total | 11,815 (22.3%) | 43,484 (82.2%) |
Disability Status by Sex by Age in Manhattan
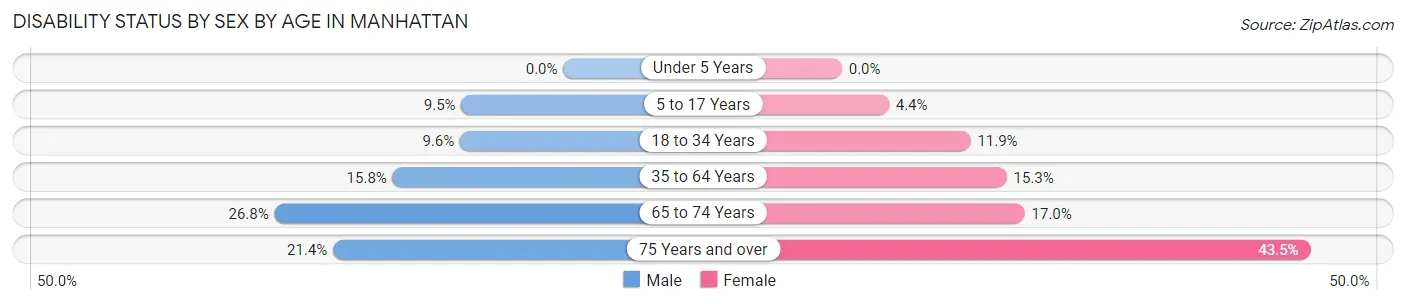
| Age Bracket | Male | Female |
| Under 5 Years | 0 (0.0%) | 0 (0.0%) |
| 5 to 17 Years | 301 (9.5%) | 117 (4.4%) |
| 18 to 34 Years | 1,329 (9.6%) | 1,547 (11.9%) |
| 35 to 64 Years | 1,042 (15.8%) | 1,003 (15.3%) |
| 65 to 74 Years | 409 (26.8%) | 267 (17.0%) |
| 75 Years and over | 169 (21.4%) | 404 (43.5%) |
Disability Class by Sex by Age in Manhattan
Disability Class: Hearing Difficulty
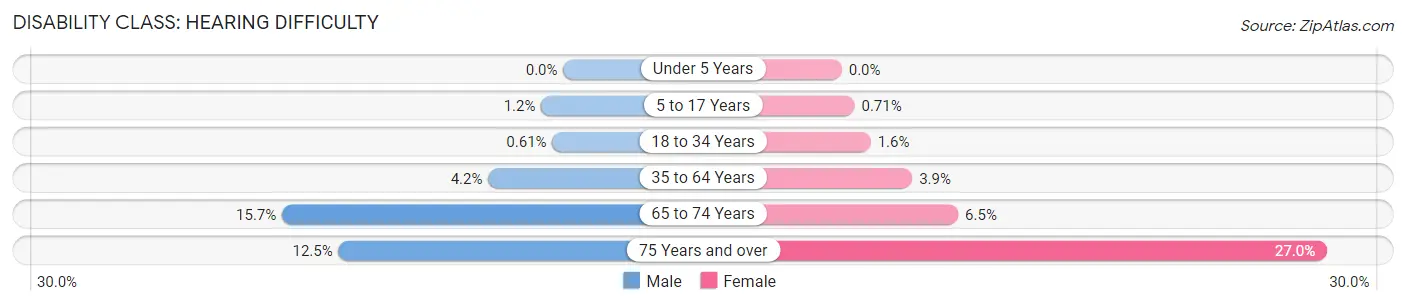
| Age Bracket | Male | Female |
| Under 5 Years | 0 (0.0%) | 0 (0.0%) |
| 5 to 17 Years | 39 (1.2%) | 19 (0.7%) |
| 18 to 34 Years | 85 (0.6%) | 209 (1.6%) |
| 35 to 64 Years | 275 (4.2%) | 257 (3.9%) |
| 65 to 74 Years | 239 (15.7%) | 102 (6.5%) |
| 75 Years and over | 99 (12.5%) | 251 (27.0%) |
Disability Class: Vision Difficulty
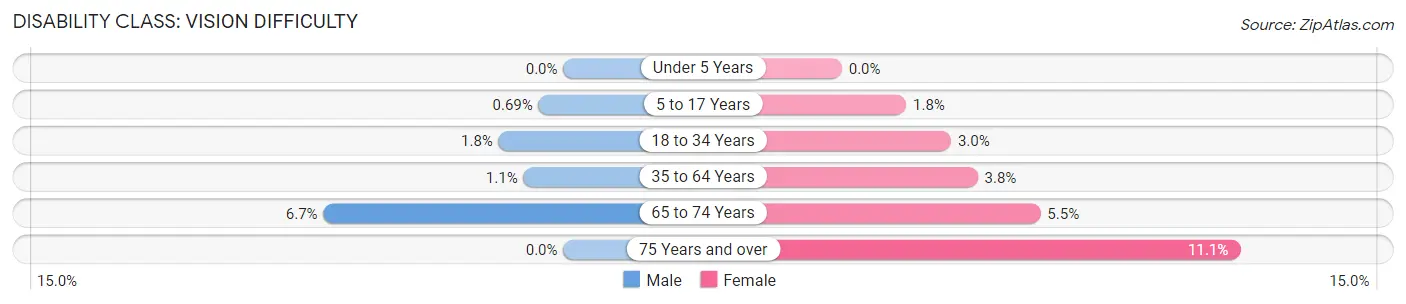
| Age Bracket | Male | Female |
| Under 5 Years | 0 (0.0%) | 0 (0.0%) |
| 5 to 17 Years | 22 (0.7%) | 48 (1.8%) |
| 18 to 34 Years | 250 (1.8%) | 394 (3.0%) |
| 35 to 64 Years | 73 (1.1%) | 248 (3.8%) |
| 65 to 74 Years | 102 (6.7%) | 87 (5.5%) |
| 75 Years and over | 0 (0.0%) | 103 (11.1%) |
Disability Class: Cognitive Difficulty
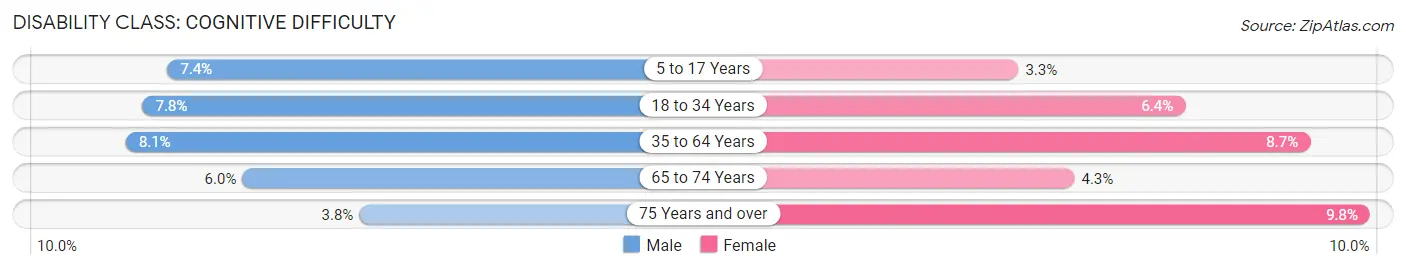
| Age Bracket | Male | Female |
| 5 to 17 Years | 234 (7.3%) | 88 (3.3%) |
| 18 to 34 Years | 1,082 (7.8%) | 825 (6.4%) |
| 35 to 64 Years | 534 (8.1%) | 570 (8.7%) |
| 65 to 74 Years | 91 (6.0%) | 68 (4.3%) |
| 75 Years and over | 30 (3.8%) | 91 (9.8%) |
Disability Class: Ambulatory Difficulty
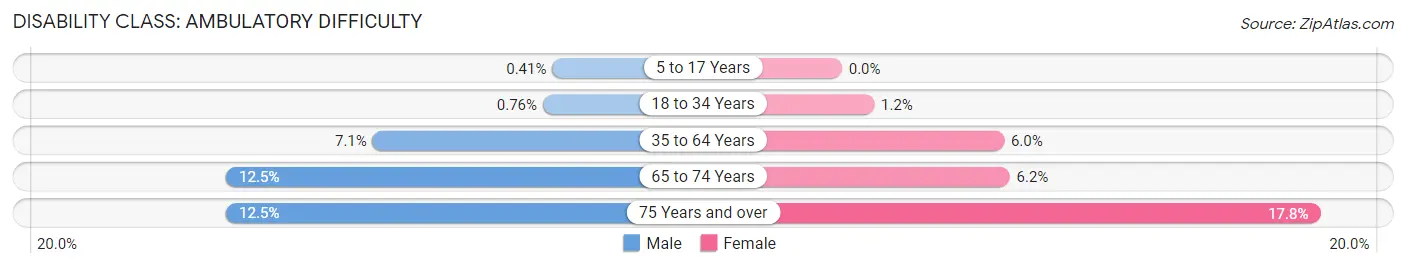
| Age Bracket | Male | Female |
| 5 to 17 Years | 13 (0.4%) | 0 (0.0%) |
| 18 to 34 Years | 105 (0.8%) | 156 (1.2%) |
| 35 to 64 Years | 466 (7.1%) | 395 (6.0%) |
| 65 to 74 Years | 191 (12.5%) | 98 (6.2%) |
| 75 Years and over | 99 (12.5%) | 165 (17.8%) |
Disability Class: Self-Care Difficulty
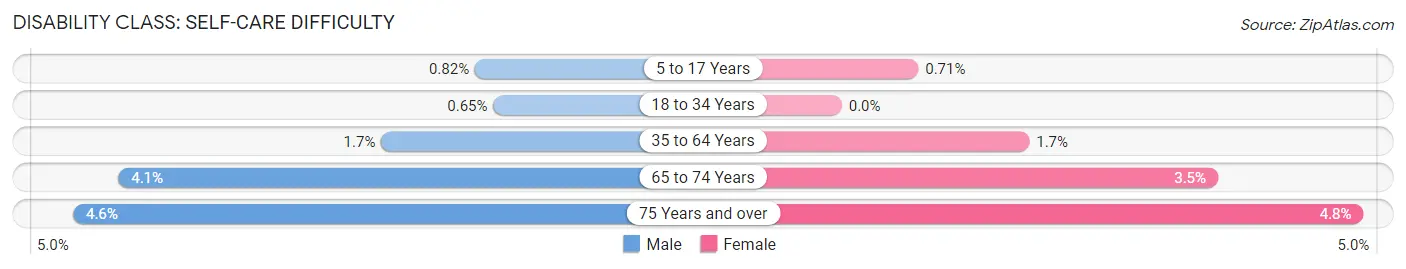
| Age Bracket | Male | Female |
| 5 to 17 Years | 26 (0.8%) | 19 (0.7%) |
| 18 to 34 Years | 90 (0.6%) | 0 (0.0%) |
| 35 to 64 Years | 111 (1.7%) | 114 (1.7%) |
| 65 to 74 Years | 63 (4.1%) | 55 (3.5%) |
| 75 Years and over | 36 (4.5%) | 45 (4.8%) |
Technology Access in Manhattan
Computing Device Access in Manhattan
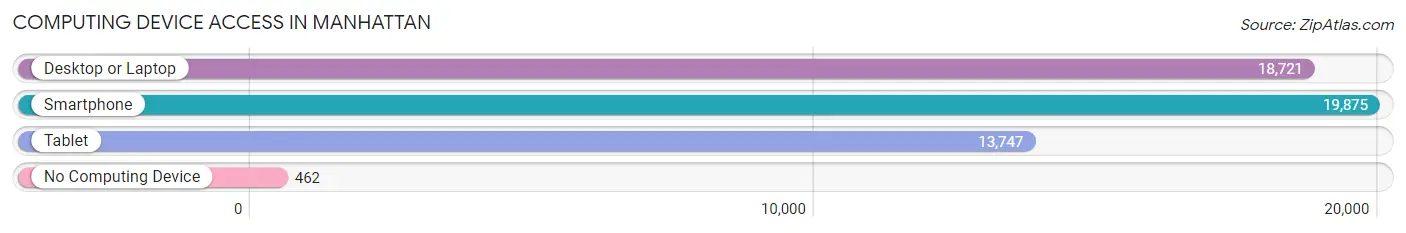
| Device Type | # Households | % Households |
| Desktop or Laptop | 18,721 | 87.4% |
| Smartphone | 19,875 | 92.7% |
| Tablet | 13,747 | 64.1% |
| No Computing Device | 462 | 2.2% |
| Total | 21,428 | 100.0% |
Internet Access in Manhattan
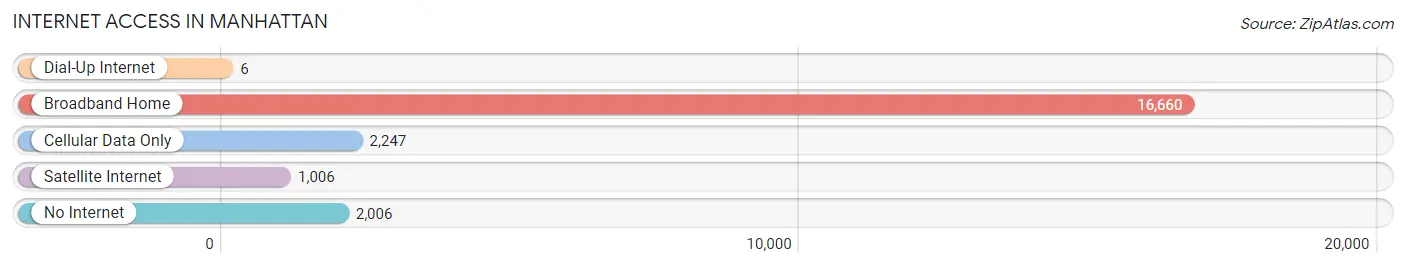
| Internet Type | # Households | % Households |
| Dial-Up Internet | 6 | 0.0% |
| Broadband Home | 16,660 | 77.7% |
| Cellular Data Only | 2,247 | 10.5% |
| Satellite Internet | 1,006 | 4.7% |
| No Internet | 2,006 | 9.4% |
| Total | 21,428 | 100.0% |
Manhattan Summary
Manhattan, Kansas is a city located in the northeastern part of the state of Kansas. It is the county seat of Riley County and the fifth-largest city in the state. The city is located on the Kansas River in the Flint Hills region of the Great Plains. Manhattan is home to Kansas State University, the state’s oldest public university.
History
The area that is now Manhattan was originally inhabited by the Kansa Native American tribe. The first European settlers arrived in the area in 1855 and established a trading post. The town was officially founded in 1855 and was named after Manhattan, New York. The city was incorporated in 1857 and was designated as the county seat of Riley County.
In 1863, the city was the site of the Battle of Manhattan, a Civil War battle between Union and Confederate forces. The city was also the site of the first Kansas State Fair in 1867.
Geography
Manhattan is located in the northeastern part of the state of Kansas. It is situated on the Kansas River in the Flint Hills region of the Great Plains. The city has a total area of 16.3 square miles, of which 16.2 square miles is land and 0.1 square miles is water.
The city has a humid continental climate, with hot, humid summers and cold, dry winters. The average annual temperature is 54.3°F, with an average high of 79.2°F in July and an average low of 28.7°F in January.
Economy
Manhattan’s economy is largely driven by Kansas State University, which is the city’s largest employer. Other major employers in the city include Fort Riley, the U.S. Army installation located just outside of the city, and the Manhattan-Ogden School District.
The city is also home to several major industries, including manufacturing, healthcare, and retail. The city’s largest manufacturing employers include Cessna Aircraft Company, which produces aircraft components, and Kansas State University, which produces agricultural and food products.
Demographics
As of the 2010 census, the city had a population of 52,281. The racial makeup of the city was 84.2% White, 8.2% African American, 0.7% Native American, 3.2% Asian, 0.1% Pacific Islander, and 2.7% from other races. Hispanic or Latino of any race were 6.3% of the population.
The median household income in the city was $41,945, and the median family income was $54,890. The per capita income for the city was $21,945. About 11.2% of the population was below the poverty line.
Manhattan is a diverse city with a rich history and a vibrant economy. The city is home to Kansas State University, the state’s oldest public university, and is a major employer in the area. The city also has a diverse population and a strong economy, with major industries in manufacturing, healthcare, and retail.
Common Questions
What is Per Capita Income in Manhattan?
Per Capita income in Manhattan is $32,863.
What is the Median Family Income in Manhattan?
Median Family Income in Manhattan is $87,377.
What is the Median Household income in Manhattan?
Median Household Income in Manhattan is $55,316.
What is Income or Wage Gap in Manhattan?
Income or Wage Gap in Manhattan is 39.1%.
Women in Manhattan earn 60.9 cents for every dollar earned by a man.
What is Family Income Deficit in Manhattan?
Family Income Deficit in Manhattan is $11,717.
Families that are below poverty line in Manhattan earn $11,717 less on average than the poverty threshold level.
What is Inequality or Gini Index in Manhattan?
Inequality or Gini Index in Manhattan is 0.50.
What is the Total Population of Manhattan?
Total Population of Manhattan is 54,287.
What is the Total Male Population of Manhattan?
Total Male Population of Manhattan is 28,156.
What is the Total Female Population of Manhattan?
Total Female Population of Manhattan is 26,131.
What is the Ratio of Males per 100 Females in Manhattan?
There are 107.75 Males per 100 Females in Manhattan.
What is the Ratio of Females per 100 Males in Manhattan?
There are 92.81 Females per 100 Males in Manhattan.
What is the Median Population Age in Manhattan?
Median Population Age in Manhattan is 24.7 Years.
What is the Average Family Size in Manhattan
Average Family Size in Manhattan is 2.8 People.
What is the Average Household Size in Manhattan
Average Household Size in Manhattan is 2.2 People.
How Large is the Labor Force in Manhattan?
There are 32,383 People in the Labor Forcein in Manhattan.
What is the Percentage of People in the Labor Force in Manhattan?
68.6% of People are in the Labor Force in Manhattan.
What is the Unemployment Rate in Manhattan?
Unemployment Rate in Manhattan is 4.5%.