Richfield, KS Map & Demographics
Richfield Map
Richfield Overview
$79,074
PER CAPITA INCOME
$120,625
AVG FAMILY INCOME
$122,500
AVG HOUSEHOLD INCOME
0.18
INEQUALITY / GINI INDEX
19
TOTAL POPULATION
8
MALE POPULATION
11
FEMALE POPULATION
72.73
MALES / 100 FEMALES
137.50
FEMALES / 100 MALES
61.8
MEDIAN AGE
2.3
AVG FAMILY SIZE
1.9
AVG HOUSEHOLD SIZE
14
LABOR FORCE [ PEOPLE ]
73.7%
PERCENT IN LABOR FORCE
Richfield Zip Codes
Richfield Area Codes
Income in Richfield
Income Overview in Richfield
Per Capita Income in Richfield is $79,074, while median incomes of families and households are $120,625 and $122,500 respectively.
| Characteristic | Number | Measure |
| Per Capita Income | 19 | $79,074 |
| Median Family Income | 7 | $120,625 |
| Mean Family Income | 7 | $111,857 |
| Median Household Income | 10 | $122,500 |
| Mean Household Income | 10 | $139,380 |
| Income Deficit | 7 | $0 |
| Wage / Income Gap (%) | 19 | 0.00% |
| Wage / Income Gap ($) | 19 | 100.00¢ per $1 |
| Gini / Inequality Index | 19 | 0.18 |
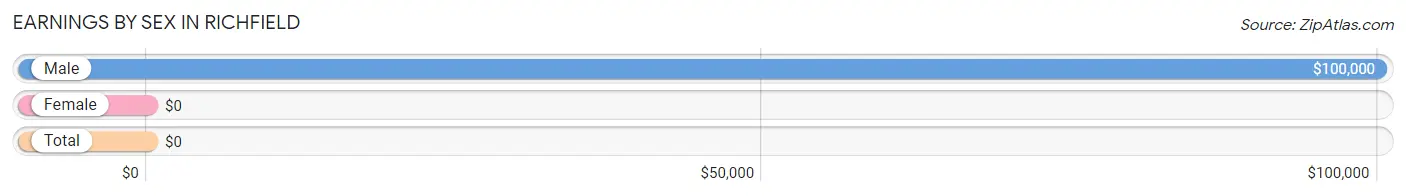
Earnings by Sex in Richfield
| Sex | Number | Average Earnings |
| Male | 8 (53.3%) | $100,000 |
| Female | 7 (46.7%) | $0 |
| Total | 15 (100.0%) | $0 |
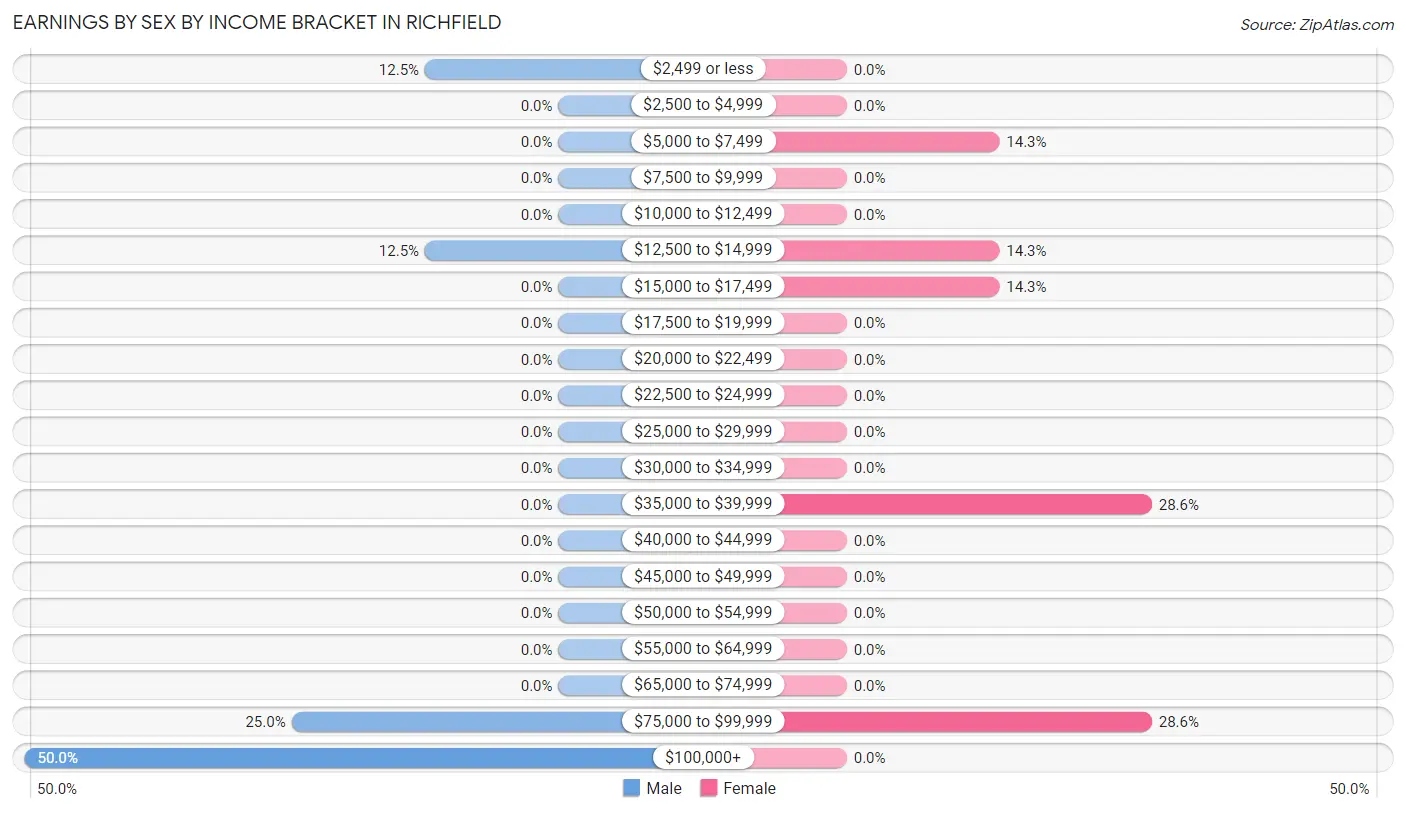
Earnings by Sex by Income Bracket in Richfield
The most common earnings brackets in Richfield are $100,000+ for men (4 | 50.0%) and $35,000 to $39,999 for women (2 | 28.6%).
| Income | Male | Female |
| $2,499 or less | 1 (12.5%) | 0 (0.0%) |
| $2,500 to $4,999 | 0 (0.0%) | 0 (0.0%) |
| $5,000 to $7,499 | 0 (0.0%) | 1 (14.3%) |
| $7,500 to $9,999 | 0 (0.0%) | 0 (0.0%) |
| $10,000 to $12,499 | 0 (0.0%) | 0 (0.0%) |
| $12,500 to $14,999 | 1 (12.5%) | 1 (14.3%) |
| $15,000 to $17,499 | 0 (0.0%) | 1 (14.3%) |
| $17,500 to $19,999 | 0 (0.0%) | 0 (0.0%) |
| $20,000 to $22,499 | 0 (0.0%) | 0 (0.0%) |
| $22,500 to $24,999 | 0 (0.0%) | 0 (0.0%) |
| $25,000 to $29,999 | 0 (0.0%) | 0 (0.0%) |
| $30,000 to $34,999 | 0 (0.0%) | 0 (0.0%) |
| $35,000 to $39,999 | 0 (0.0%) | 2 (28.6%) |
| $40,000 to $44,999 | 0 (0.0%) | 0 (0.0%) |
| $45,000 to $49,999 | 0 (0.0%) | 0 (0.0%) |
| $50,000 to $54,999 | 0 (0.0%) | 0 (0.0%) |
| $55,000 to $64,999 | 0 (0.0%) | 0 (0.0%) |
| $65,000 to $74,999 | 0 (0.0%) | 0 (0.0%) |
| $75,000 to $99,999 | 2 (25.0%) | 2 (28.6%) |
| $100,000+ | 4 (50.0%) | 0 (0.0%) |
| Total | 8 (100.0%) | 7 (100.0%) |
Earnings by Sex by Educational Attainment in Richfield
| Educational Attainment | Male Income | Female Income |
| Less than High School | - | - |
| High School Diploma | - | - |
| College or Associate's Degree | - | - |
| Bachelor's Degree | - | - |
| Graduate Degree | - | - |
| Total | $100,000 | $0 |
Family Income in Richfield
Family Income Brackets in Richfield
According to the Richfield family income data, there are 6 families falling into the $100,000 to $149,999 income range, which is the most common income bracket and makes up 85.7% of all families.
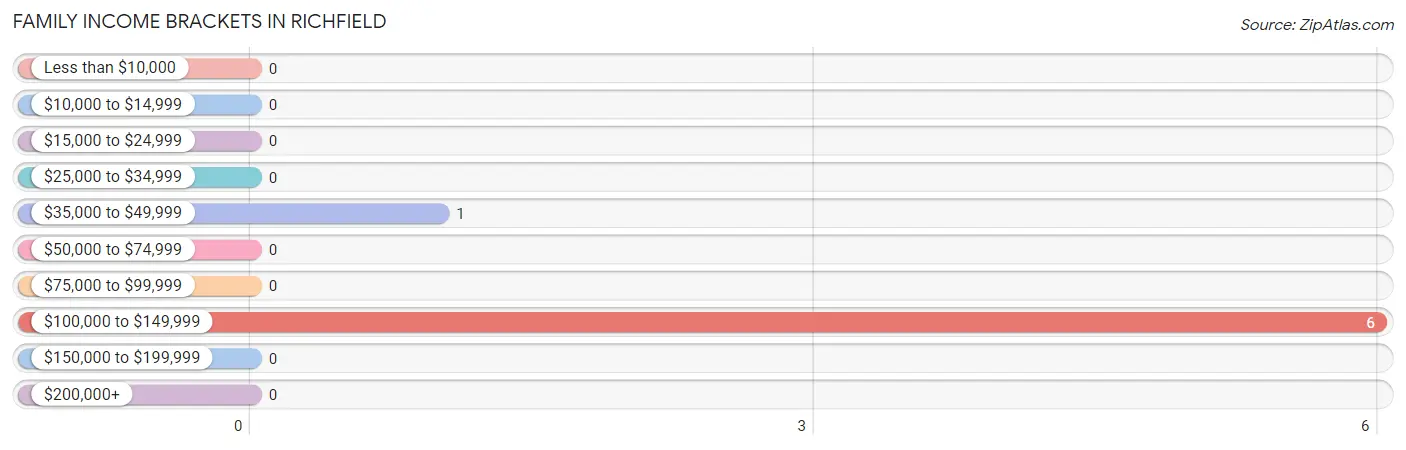
| Income Bracket | # Families | % Families |
| Less than $10,000 | 0 | 0.0% |
| $10,000 to $14,999 | 0 | 0.0% |
| $15,000 to $24,999 | 0 | 0.0% |
| $25,000 to $34,999 | 0 | 0.0% |
| $35,000 to $49,999 | 1 | 14.3% |
| $50,000 to $74,999 | 0 | 0.0% |
| $75,000 to $99,999 | 0 | 0.0% |
| $100,000 to $149,999 | 6 | 85.7% |
| $150,000 to $199,999 | 0 | 0.0% |
| $200,000+ | 0 | 0.0% |
Family Income by Famaliy Size in Richfield
2-person families (5 | 71.4%) account for the highest median family income in Richfield with $121,875 per family, while 2-person families (5 | 71.4%) have the highest median income of $60,938 per family member.
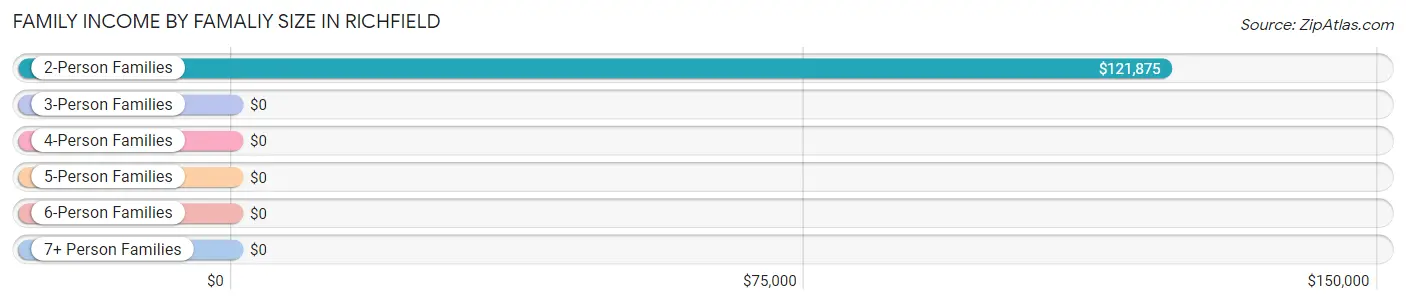
| Income Bracket | # Families | Median Income |
| 2-Person Families | 5 (71.4%) | $121,875 |
| 3-Person Families | 2 (28.6%) | $0 |
| 4-Person Families | 0 (0.0%) | $0 |
| 5-Person Families | 0 (0.0%) | $0 |
| 6-Person Families | 0 (0.0%) | $0 |
| 7+ Person Families | 0 (0.0%) | $0 |
| Total | 7 (100.0%) | $120,625 |
Family Income by Number of Earners in Richfield
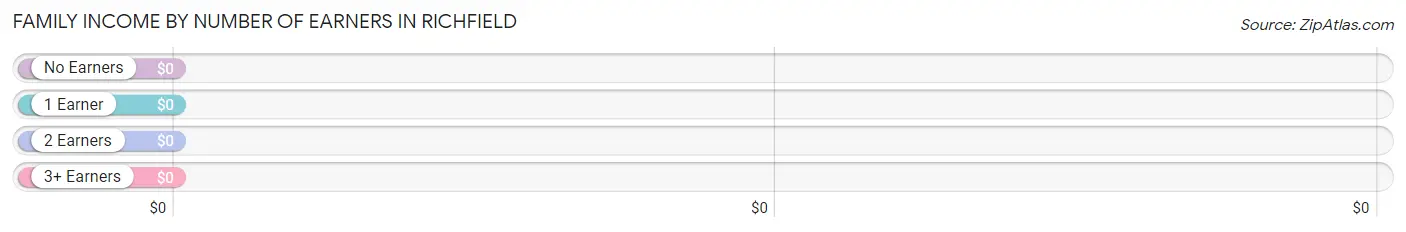
| Number of Earners | # Families | Median Income |
| No Earners | 0 (0.0%) | $0 |
| 1 Earner | 2 (28.6%) | $0 |
| 2 Earners | 3 (42.9%) | $0 |
| 3+ Earners | 2 (28.6%) | $0 |
| Total | 7 (100.0%) | $120,625 |
Household Income in Richfield
Household Income Brackets in Richfield
With 6 households falling in the category, the $100,000 to $149,999 income range is the most frequent in Richfield, accounting for 60.0% of all households.
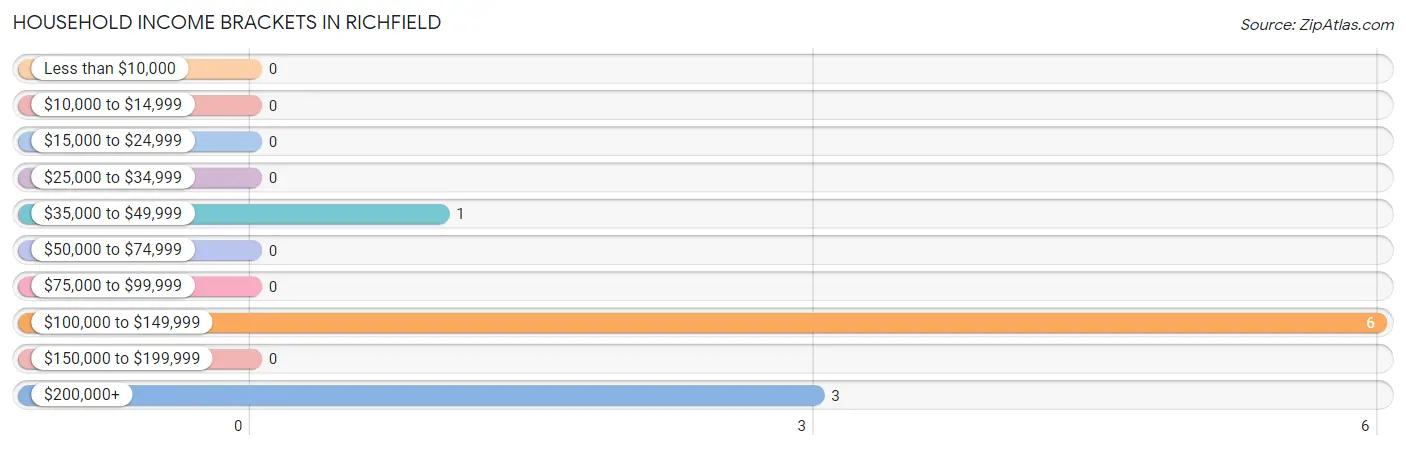
| Income Bracket | # Households | % Households |
| Less than $10,000 | 0 | 0.0% |
| $10,000 to $14,999 | 0 | 0.0% |
| $15,000 to $24,999 | 0 | 0.0% |
| $25,000 to $34,999 | 0 | 0.0% |
| $35,000 to $49,999 | 1 | 10.0% |
| $50,000 to $74,999 | 0 | 0.0% |
| $75,000 to $99,999 | 0 | 0.0% |
| $100,000 to $149,999 | 6 | 60.0% |
| $150,000 to $199,999 | 0 | 0.0% |
| $200,000+ | 3 | 30.0% |
Household Income by Householder Age in Richfield
The median household income in Richfield is $122,500, with the highest median household income of $202,917 found in the 65+ years age bracket for the primary householder. A total of 5 households (50.0%) fall into this category.
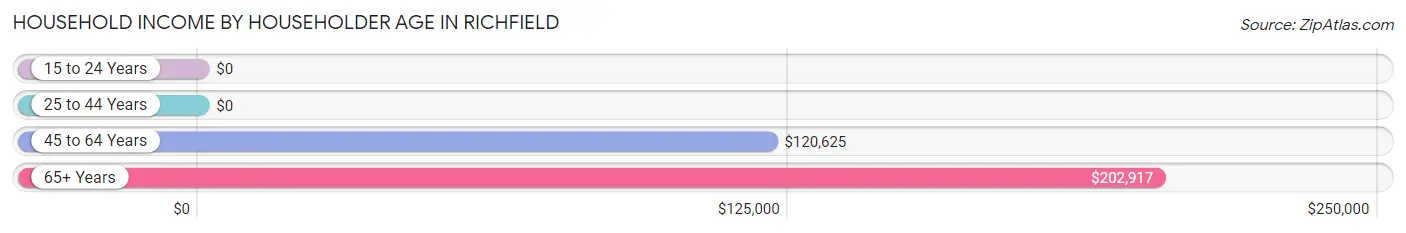
| Income Bracket | # Households | Median Income |
| 15 to 24 Years | 0 (0.0%) | $0 |
| 25 to 44 Years | 0 (0.0%) | $0 |
| 45 to 64 Years | 5 (50.0%) | $120,625 |
| 65+ Years | 5 (50.0%) | $202,917 |
| Total | 10 (100.0%) | $122,500 |
Poverty in Richfield
Income Below Poverty by Sex and Age in Richfield
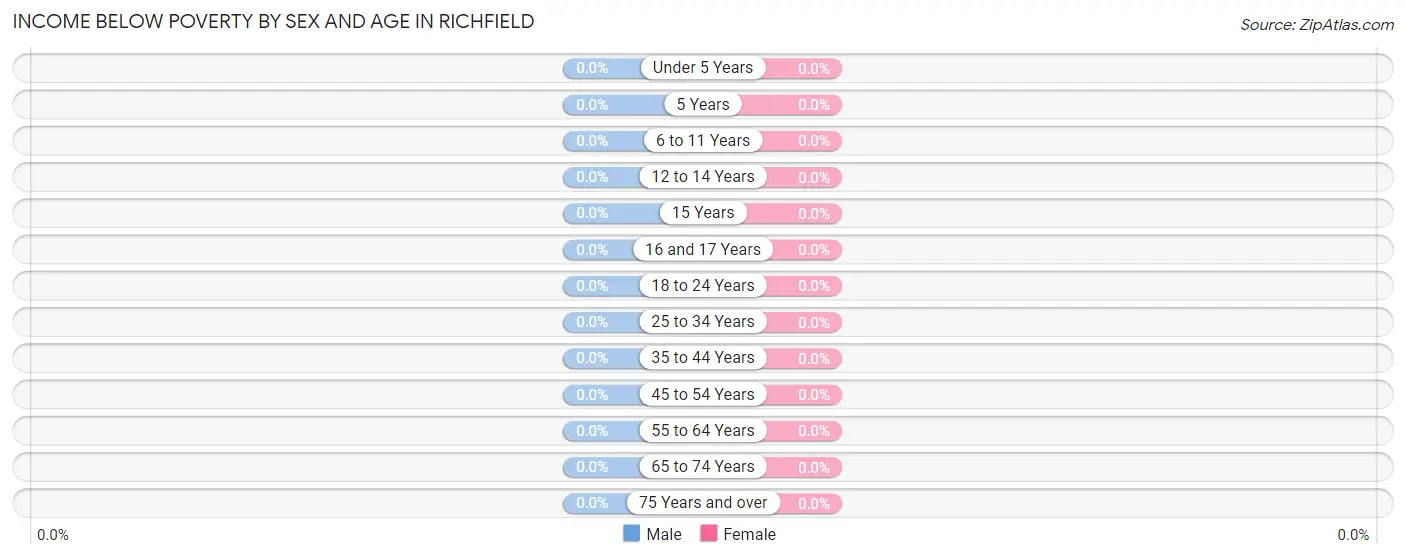
| Age Bracket | Male | Female |
| Under 5 Years | 0 (0.0%) | 0 (0.0%) |
| 5 Years | 0 (0.0%) | 0 (0.0%) |
| 6 to 11 Years | 0 (0.0%) | 0 (0.0%) |
| 12 to 14 Years | 0 (0.0%) | 0 (0.0%) |
| 15 Years | 0 (0.0%) | 0 (0.0%) |
| 16 and 17 Years | 0 (0.0%) | 0 (0.0%) |
| 18 to 24 Years | 0 (0.0%) | 0 (0.0%) |
| 25 to 34 Years | 0 (0.0%) | 0 (0.0%) |
| 35 to 44 Years | 0 (0.0%) | 0 (0.0%) |
| 45 to 54 Years | 0 (0.0%) | 0 (0.0%) |
| 55 to 64 Years | 0 (0.0%) | 0 (0.0%) |
| 65 to 74 Years | 0 (0.0%) | 0 (0.0%) |
| 75 Years and over | 0 (0.0%) | 0 (0.0%) |
| Total | 0 (0.0%) | 0 (0.0%) |
Income Above Poverty by Sex and Age in Richfield
According to the poverty statistics in Richfield, males aged 45 to 54 years and females aged 18 to 24 years are the age groups that are most secure financially, with 100.0% of males and 100.0% of females in these age groups living above the poverty line.
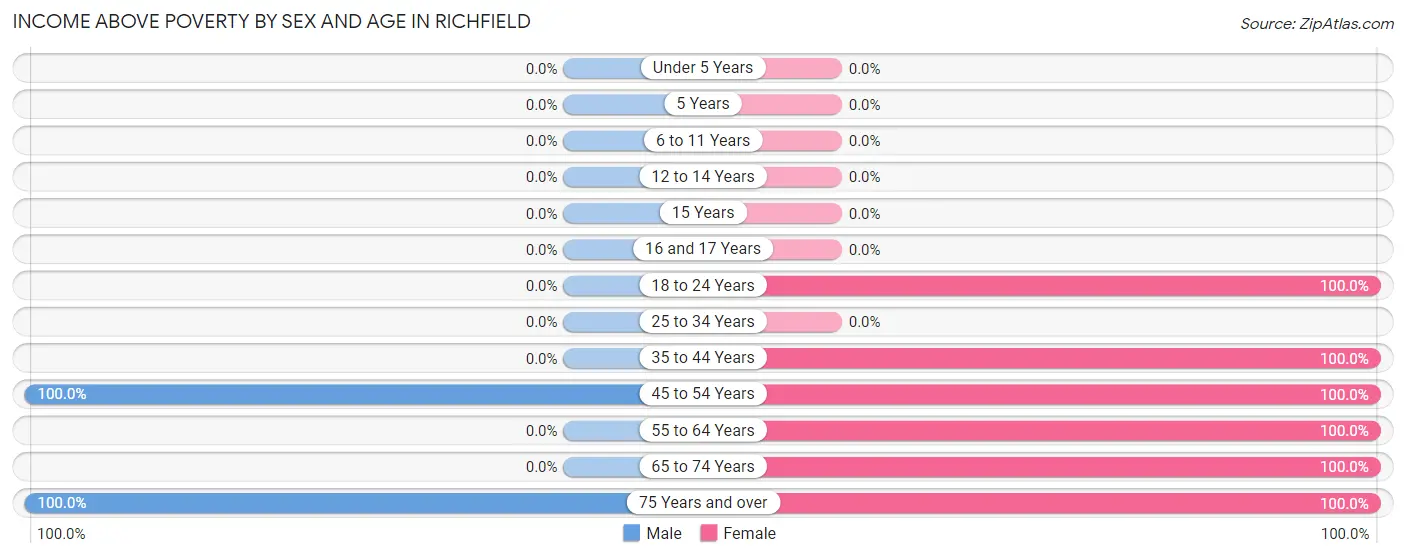
| Age Bracket | Male | Female |
| Under 5 Years | 0 (0.0%) | 0 (0.0%) |
| 5 Years | 0 (0.0%) | 0 (0.0%) |
| 6 to 11 Years | 0 (0.0%) | 0 (0.0%) |
| 12 to 14 Years | 0 (0.0%) | 0 (0.0%) |
| 15 Years | 0 (0.0%) | 0 (0.0%) |
| 16 and 17 Years | 0 (0.0%) | 0 (0.0%) |
| 18 to 24 Years | 0 (0.0%) | 1 (100.0%) |
| 25 to 34 Years | 0 (0.0%) | 0 (0.0%) |
| 35 to 44 Years | 0 (0.0%) | 2 (100.0%) |
| 45 to 54 Years | 3 (100.0%) | 2 (100.0%) |
| 55 to 64 Years | 0 (0.0%) | 2 (100.0%) |
| 65 to 74 Years | 0 (0.0%) | 3 (100.0%) |
| 75 Years and over | 5 (100.0%) | 1 (100.0%) |
| Total | 8 (100.0%) | 11 (100.0%) |
Income Below Poverty Among Married-Couple Families in Richfield
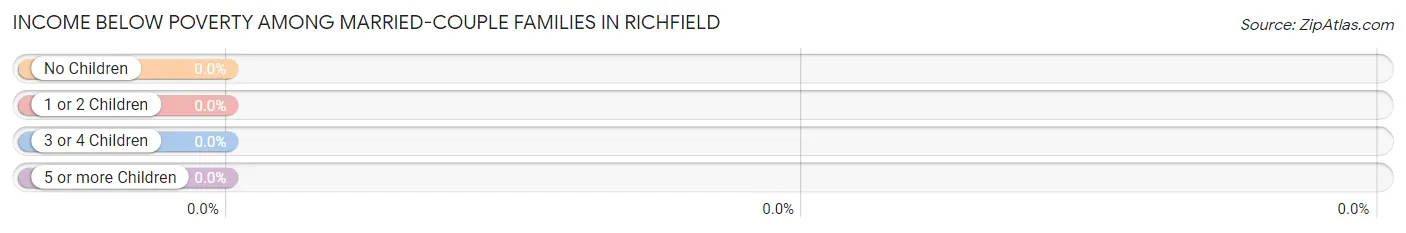
| Children | Above Poverty | Below Poverty |
| No Children | 5 (100.0%) | 0 (0.0%) |
| 1 or 2 Children | 0 (0.0%) | 0 (0.0%) |
| 3 or 4 Children | 0 (0.0%) | 0 (0.0%) |
| 5 or more Children | 0 (0.0%) | 0 (0.0%) |
| Total | 5 (100.0%) | 0 (0.0%) |
Income Below Poverty Among Single-Parent Households in Richfield
| Children | Single Father | Single Mother |
| No Children | 0 (0.0%) | 0 (0.0%) |
| 1 or 2 Children | 0 (0.0%) | 0 (0.0%) |
| 3 or 4 Children | 0 (0.0%) | 0 (0.0%) |
| 5 or more Children | 0 (0.0%) | 0 (0.0%) |
| Total | 0 (0.0%) | 0 (0.0%) |
Income Below Poverty Among Married-Couple vs Single-Parent Households in Richfield
| Children | Married-Couple Families | Single-Parent Households |
| No Children | 0 (0.0%) | 0 (0.0%) |
| 1 or 2 Children | 0 (0.0%) | 0 (0.0%) |
| 3 or 4 Children | 0 (0.0%) | 0 (0.0%) |
| 5 or more Children | 0 (0.0%) | 0 (0.0%) |
| Total | 0 (0.0%) | 0 (0.0%) |
Race in Richfield
The most populous races in Richfield are , and White / Caucasian (19 | 100.0%).
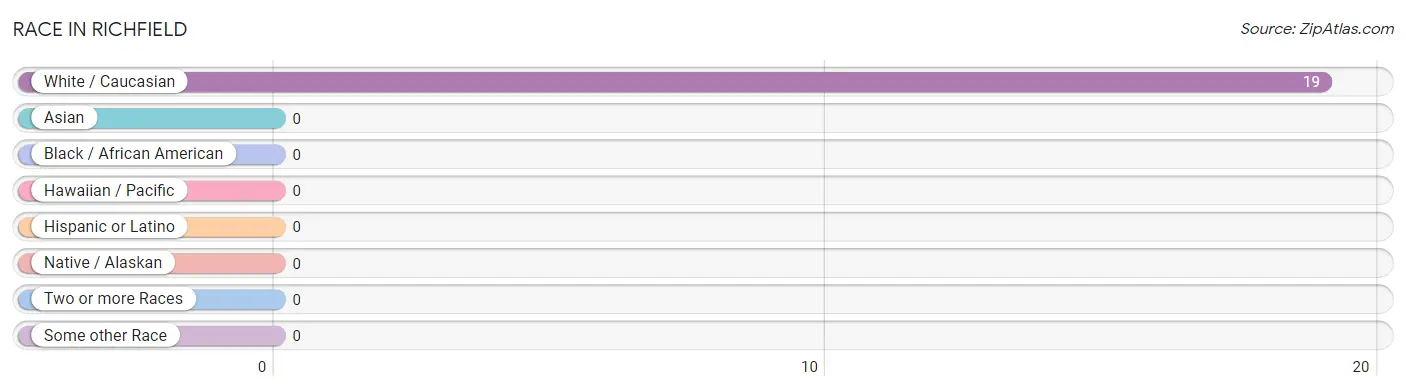
| Race | # Population | % Population |
| Asian | 0 | 0.0% |
| Black / African American | 0 | 0.0% |
| Hawaiian / Pacific | 0 | 0.0% |
| Hispanic or Latino | 0 | 0.0% |
| Native / Alaskan | 0 | 0.0% |
| White / Caucasian | 19 | 100.0% |
| Two or more Races | 0 | 0.0% |
| Some other Race | 0 | 0.0% |
| Total | 19 | 100.0% |
Ancestry in Richfield
The most populous ancestries reported in Richfield are American (10 | 52.6%), Dutch West Indian (3 | 15.8%), German (3 | 15.8%), Scottish (3 | 15.8%), and Dutch (1 | 5.3%), together accounting for 105.3% of all Richfield residents.
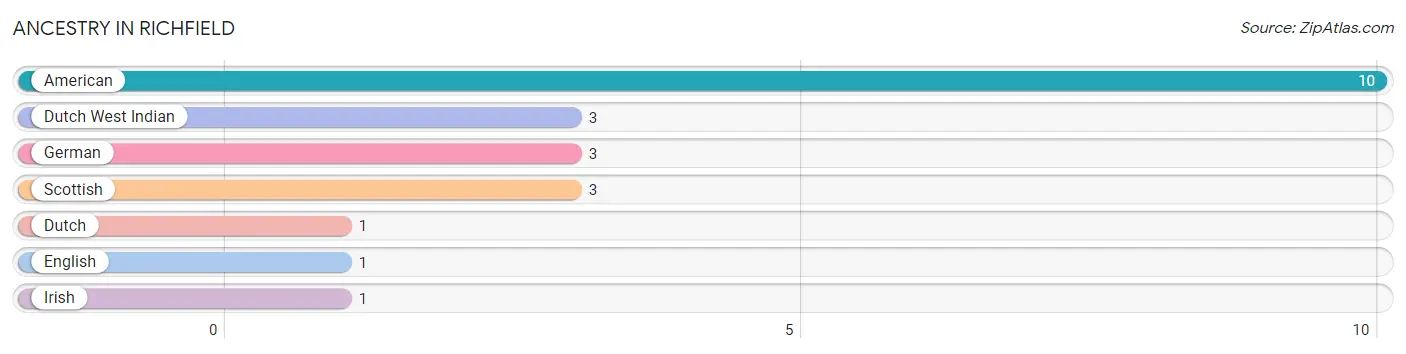
| Ancestry | # Population | % Population |
| American | 10 | 52.6% |
| Dutch | 1 | 5.3% |
| Dutch West Indian | 3 | 15.8% |
| English | 1 | 5.3% |
| German | 3 | 15.8% |
| Irish | 1 | 5.3% |
| Scottish | 3 | 15.8% | View All 7 Rows |
Immigrants in Richfield

| Immigration Origin | # Population | % Population | View All 0 Rows |
Sex and Age in Richfield
Sex and Age in Richfield
The most populous age groups in Richfield are 80 to 84 Years (4 | 50.0%) for men and 70 to 74 Years (3 | 27.3%) for women.
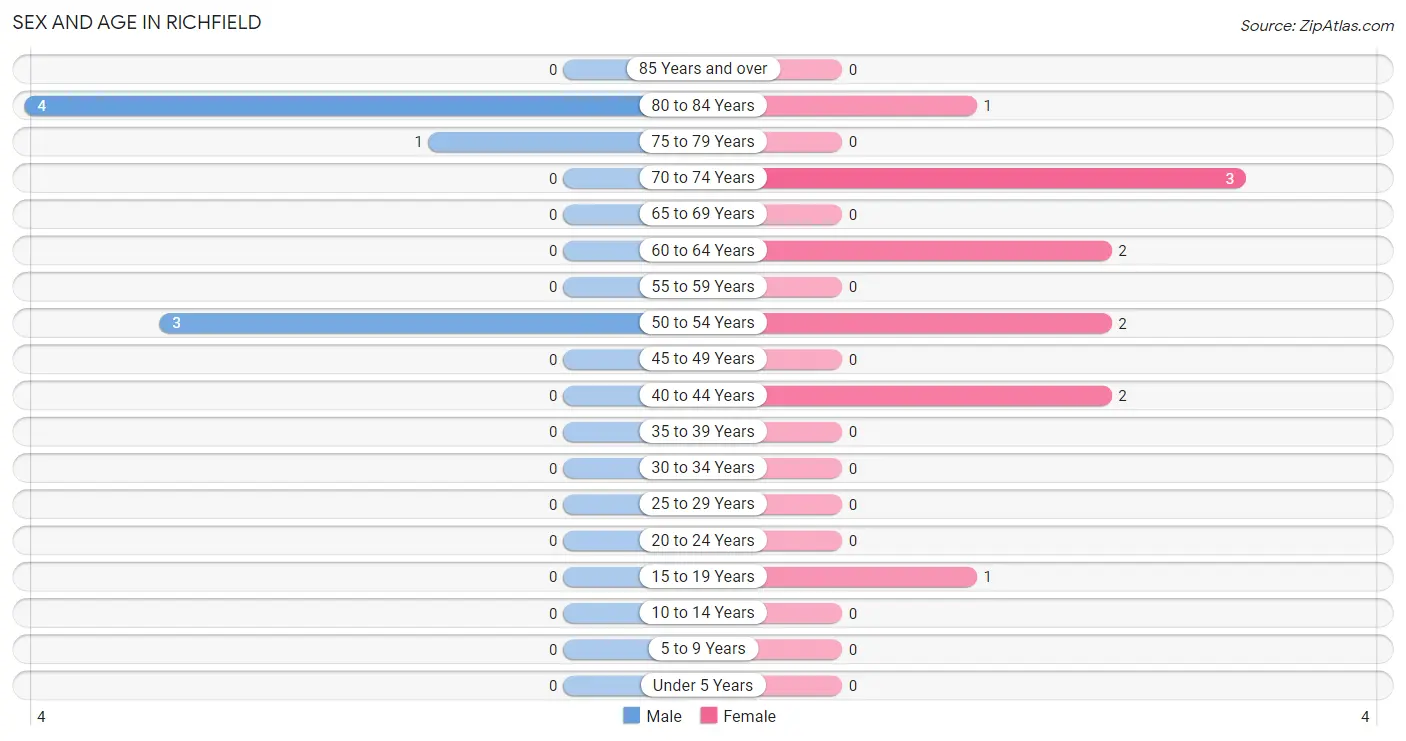
| Age Bracket | Male | Female |
| Under 5 Years | 0 (0.0%) | 0 (0.0%) |
| 5 to 9 Years | 0 (0.0%) | 0 (0.0%) |
| 10 to 14 Years | 0 (0.0%) | 0 (0.0%) |
| 15 to 19 Years | 0 (0.0%) | 1 (9.1%) |
| 20 to 24 Years | 0 (0.0%) | 0 (0.0%) |
| 25 to 29 Years | 0 (0.0%) | 0 (0.0%) |
| 30 to 34 Years | 0 (0.0%) | 0 (0.0%) |
| 35 to 39 Years | 0 (0.0%) | 0 (0.0%) |
| 40 to 44 Years | 0 (0.0%) | 2 (18.2%) |
| 45 to 49 Years | 0 (0.0%) | 0 (0.0%) |
| 50 to 54 Years | 3 (37.5%) | 2 (18.2%) |
| 55 to 59 Years | 0 (0.0%) | 0 (0.0%) |
| 60 to 64 Years | 0 (0.0%) | 2 (18.2%) |
| 65 to 69 Years | 0 (0.0%) | 0 (0.0%) |
| 70 to 74 Years | 0 (0.0%) | 3 (27.3%) |
| 75 to 79 Years | 1 (12.5%) | 0 (0.0%) |
| 80 to 84 Years | 4 (50.0%) | 1 (9.1%) |
| 85 Years and over | 0 (0.0%) | 0 (0.0%) |
| Total | 8 (100.0%) | 11 (100.0%) |
Families and Households in Richfield
Median Family Size in Richfield
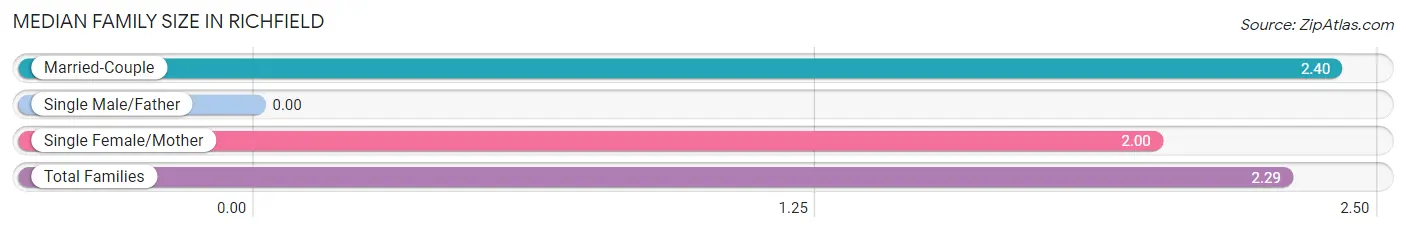
| Family Type | # Families | Family Size |
| Married-Couple | 5 (71.4%) | 2.40 |
| Single Male/Father | 0 (0.0%) | - |
| Single Female/Mother | 2 (28.6%) | 2.00 |
| Total Families | 7 (100.0%) | 2.29 |
Median Household Size in Richfield
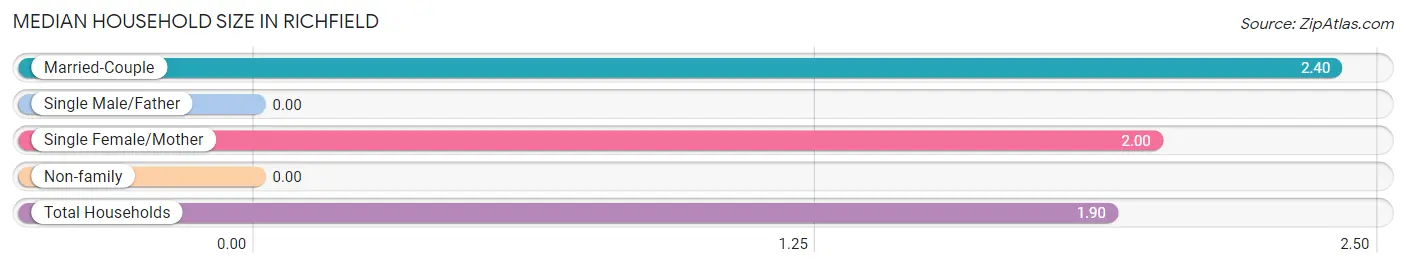
| Household Type | # Households | Household Size |
| Married-Couple | 5 (50.0%) | 2.40 |
| Single Male/Father | 0 (0.0%) | - |
| Single Female/Mother | 2 (20.0%) | 2.00 |
| Non-family | 3 (30.0%) | - |
| Total Households | 10 (100.0%) | 1.90 |
Household Size by Marriage Status in Richfield
Out of a total of 10 households in Richfield, 7 (70.0%) are family households, while 3 (30.0%) are nonfamily households. The most numerous type of family households are 2-person households, comprising 5, and the most common type of nonfamily households are 1-person households, comprising 3.
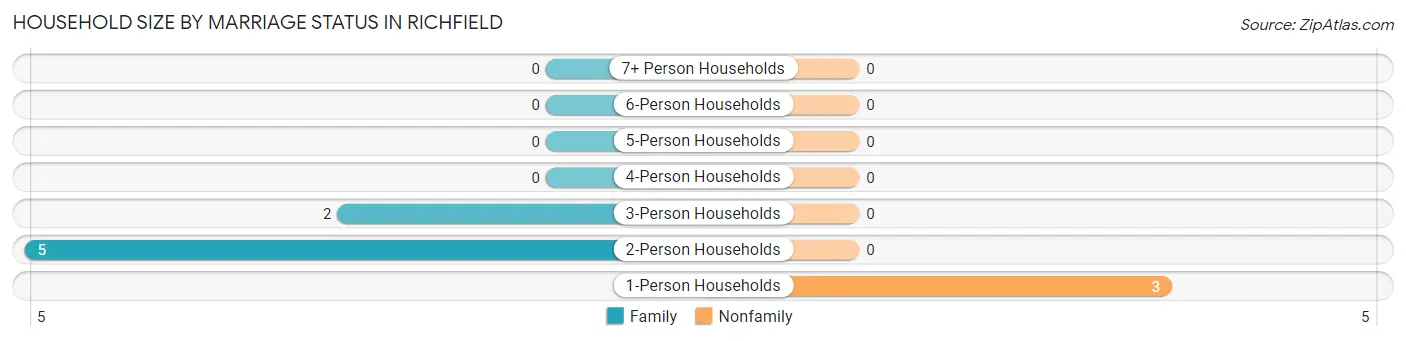
| Household Size | Family Households | Nonfamily Households |
| 1-Person Households | - | 3 (30.0%) |
| 2-Person Households | 5 (50.0%) | 0 (0.0%) |
| 3-Person Households | 2 (20.0%) | 0 (0.0%) |
| 4-Person Households | 0 (0.0%) | 0 (0.0%) |
| 5-Person Households | 0 (0.0%) | 0 (0.0%) |
| 6-Person Households | 0 (0.0%) | 0 (0.0%) |
| 7+ Person Households | 0 (0.0%) | 0 (0.0%) |
| Total | 7 (70.0%) | 3 (30.0%) |
Female Fertility in Richfield
Fertility by Age in Richfield
| Age Bracket | Women with Births | Births / 1,000 Women |
| 15 to 19 years | 0 (0.0%) | 0.0 |
| 20 to 34 years | 0 (0.0%) | 0.0 |
| 35 to 50 years | 0 (0.0%) | 0.0 |
| Total | 0 (0.0%) | 0.0 |
Fertility by Age by Marriage Status in Richfield
| Age Bracket | Married | Unmarried |
| 15 to 19 years | 0 (0.0%) | 0 (0.0%) |
| 20 to 34 years | 0 (0.0%) | 0 (0.0%) |
| 35 to 50 years | 0 (0.0%) | 0 (0.0%) |
| Total | 0 (0.0%) | 0 (0.0%) |
Fertility by Education in Richfield
| Educational Attainment | Women with Births | Births / 1,000 Women |
| Less than High School | 0 (0.0%) | 0.0 |
| High School Diploma | 0 (0.0%) | 0.0 |
| College or Associate's Degree | 0 (0.0%) | 0.0 |
| Bachelor's Degree | 0 (0.0%) | 0.0 |
| Graduate Degree | 0 (0.0%) | 0.0 |
| Total | 0 (0.0%) | 0.0 |
Fertility by Education by Marriage Status in Richfield
| Educational Attainment | Married | Unmarried |
| Less than High School | 0 (0.0%) | 0 (0.0%) |
| High School Diploma | 0 (0.0%) | 0 (0.0%) |
| College or Associate's Degree | 0 (0.0%) | 0 (0.0%) |
| Bachelor's Degree | 0 (0.0%) | 0 (0.0%) |
| Graduate Degree | 0 (0.0%) | 0 (0.0%) |
| Total | 0 (0.0%) | 0 (0.0%) |
Employment Characteristics in Richfield
Employment by Class of Employer in Richfield
Among the 14 employed individuals in Richfield, private company employees (6 | 42.9%), self-employed (not incorporated) (4 | 28.6%), and local government employees (2 | 14.3%) make up the most common classes of employment.
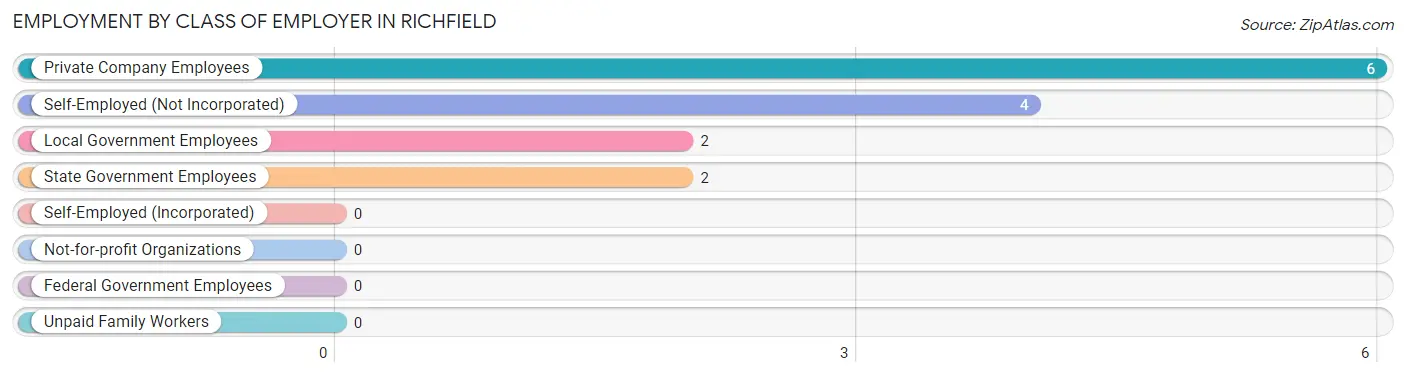
| Employer Class | # Employees | % Employees |
| Private Company Employees | 6 | 42.9% |
| Self-Employed (Incorporated) | 0 | 0.0% |
| Self-Employed (Not Incorporated) | 4 | 28.6% |
| Not-for-profit Organizations | 0 | 0.0% |
| Local Government Employees | 2 | 14.3% |
| State Government Employees | 2 | 14.3% |
| Federal Government Employees | 0 | 0.0% |
| Unpaid Family Workers | 0 | 0.0% |
| Total | 14 | 100.0% |
Employment Status by Age in Richfield
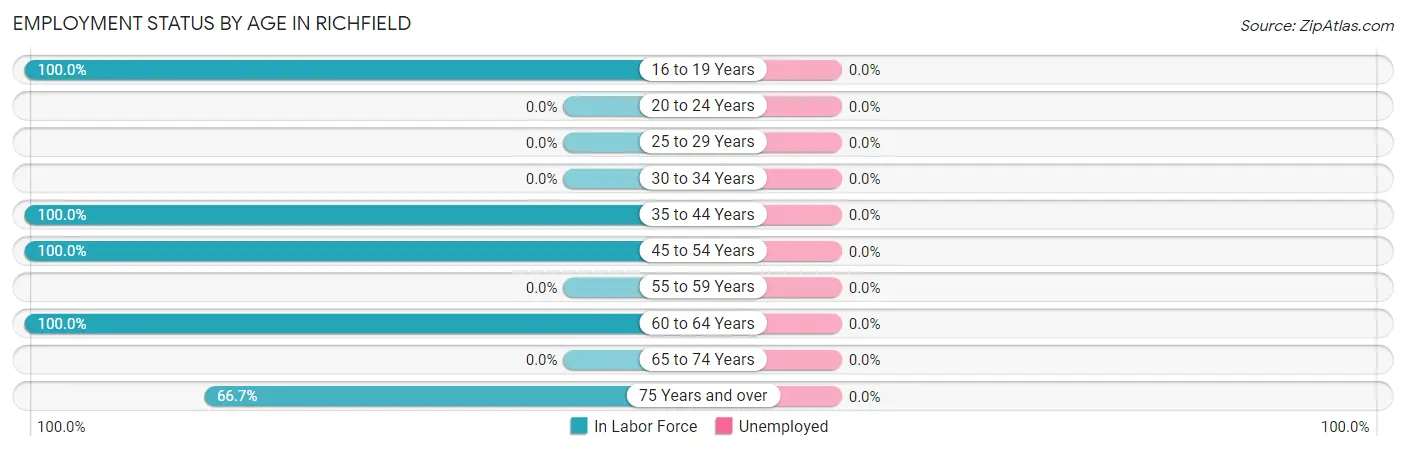
| Age Bracket | In Labor Force | Unemployed |
| 16 to 19 Years | 1 (100.0%) | 0 (0.0%) |
| 20 to 24 Years | 0 (0.0%) | 0 (0.0%) |
| 25 to 29 Years | 0 (0.0%) | 0 (0.0%) |
| 30 to 34 Years | 0 (0.0%) | 0 (0.0%) |
| 35 to 44 Years | 2 (100.0%) | 0 (0.0%) |
| 45 to 54 Years | 5 (100.0%) | 0 (0.0%) |
| 55 to 59 Years | 0 (0.0%) | 0 (0.0%) |
| 60 to 64 Years | 2 (100.0%) | 0 (0.0%) |
| 65 to 74 Years | 0 (0.0%) | 0 (0.0%) |
| 75 Years and over | 4 (66.7%) | 0 (0.0%) |
| Total | 14 (73.7%) | 0 (0.0%) |
Employment Status by Educational Attainment in Richfield
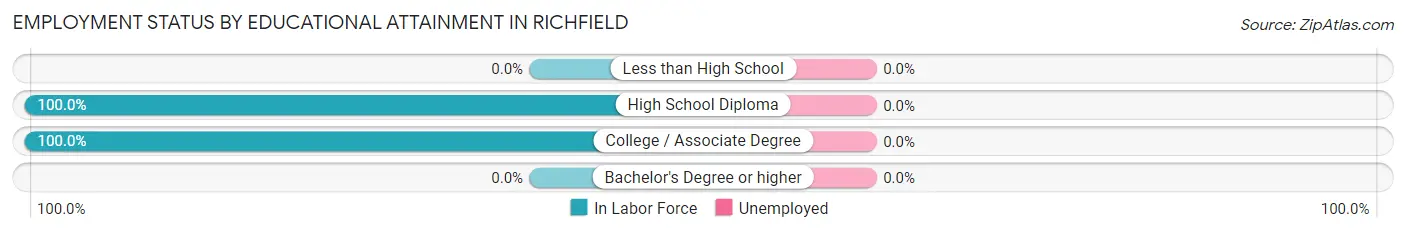
| Educational Attainment | In Labor Force | Unemployed |
| Less than High School | 0 (0.0%) | 0 (0.0%) |
| High School Diploma | 4 (100.0%) | 0 (0.0%) |
| College / Associate Degree | 5 (100.0%) | 0 (0.0%) |
| Bachelor's Degree or higher | 0 (0.0%) | 0 (0.0%) |
| Total | 9 (100.0%) | 0 (0.0%) |
Employment Occupations by Sex in Richfield
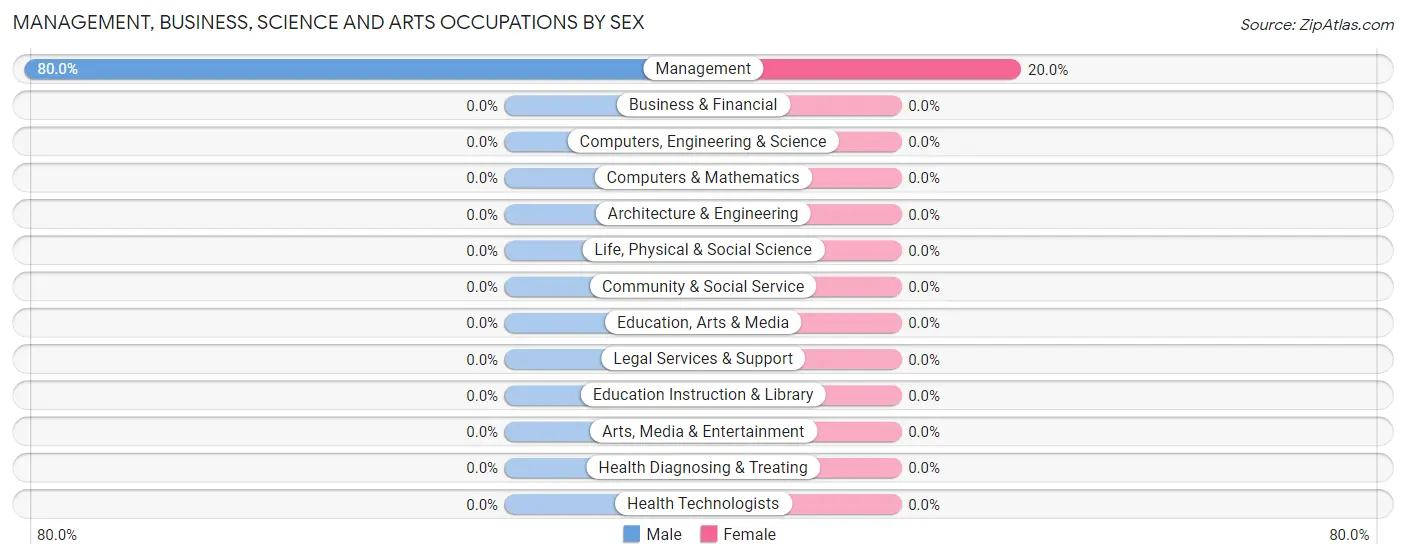
Management, Business, Science and Arts Occupations
The most common Management, Business, Science and Arts occupations in Richfield are , and Management (5 | 35.7%).
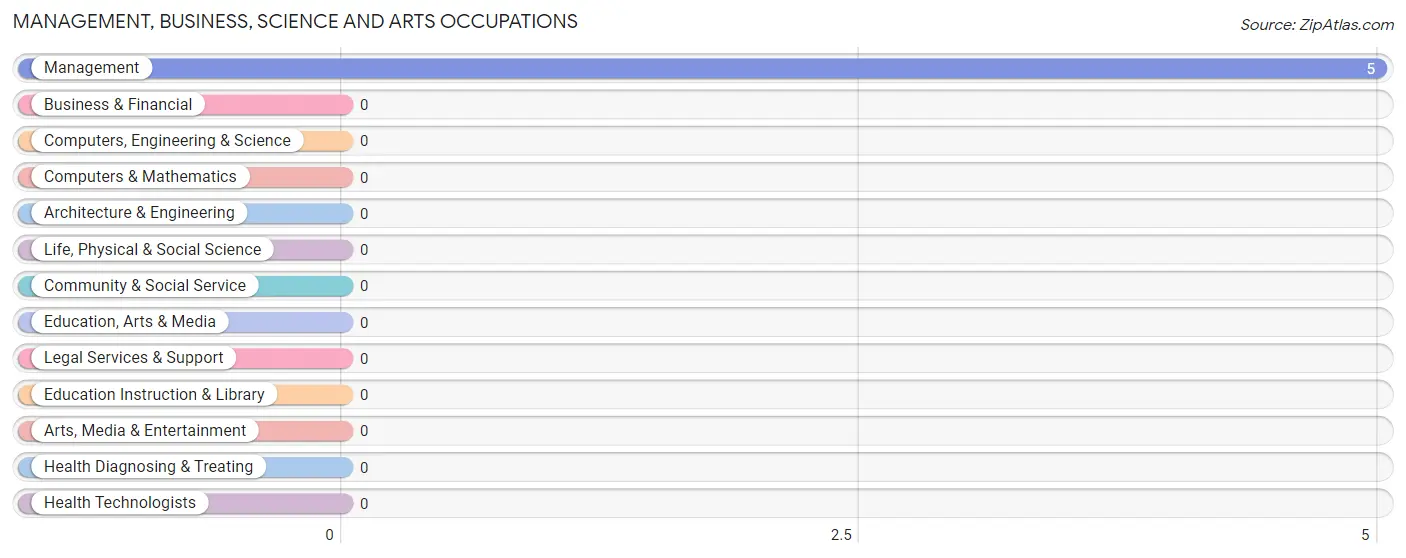
Management, Business, Science and Arts Occupations by Sex
| Occupation | Male | Female |
| Management | 4 (80.0%) | 1 (20.0%) |
| Business & Financial | 0 (0.0%) | 0 (0.0%) |
| Computers, Engineering & Science | 0 (0.0%) | 0 (0.0%) |
| Computers & Mathematics | 0 (0.0%) | 0 (0.0%) |
| Architecture & Engineering | 0 (0.0%) | 0 (0.0%) |
| Life, Physical & Social Science | 0 (0.0%) | 0 (0.0%) |
| Community & Social Service | 0 (0.0%) | 0 (0.0%) |
| Education, Arts & Media | 0 (0.0%) | 0 (0.0%) |
| Legal Services & Support | 0 (0.0%) | 0 (0.0%) |
| Education Instruction & Library | 0 (0.0%) | 0 (0.0%) |
| Arts, Media & Entertainment | 0 (0.0%) | 0 (0.0%) |
| Health Diagnosing & Treating | 0 (0.0%) | 0 (0.0%) |
| Health Technologists | 0 (0.0%) | 0 (0.0%) |
| Total (Category) | 4 (80.0%) | 1 (20.0%) |
| Total (Overall) | 7 (50.0%) | 7 (50.0%) |
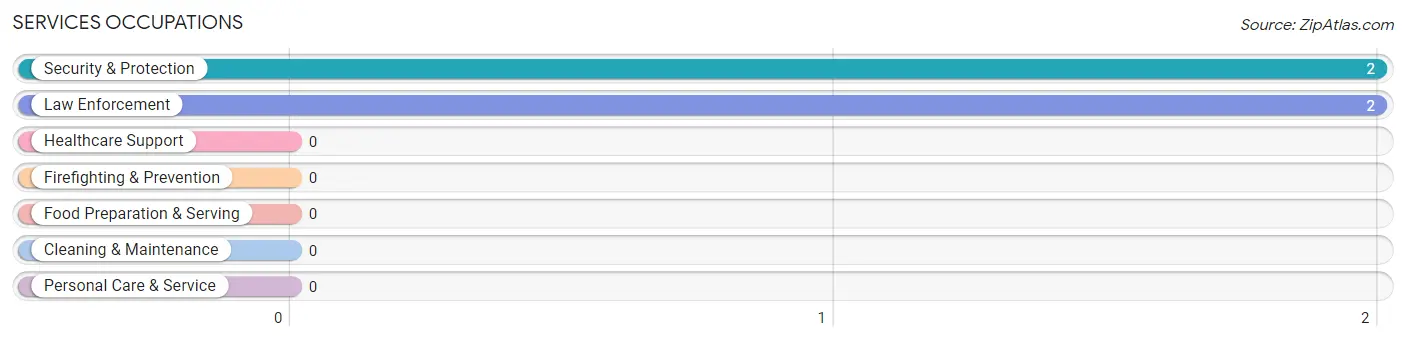
Services Occupations
The most common Services occupations in Richfield are Security & Protection (2 | 14.3%), and Law Enforcement (2 | 14.3%).
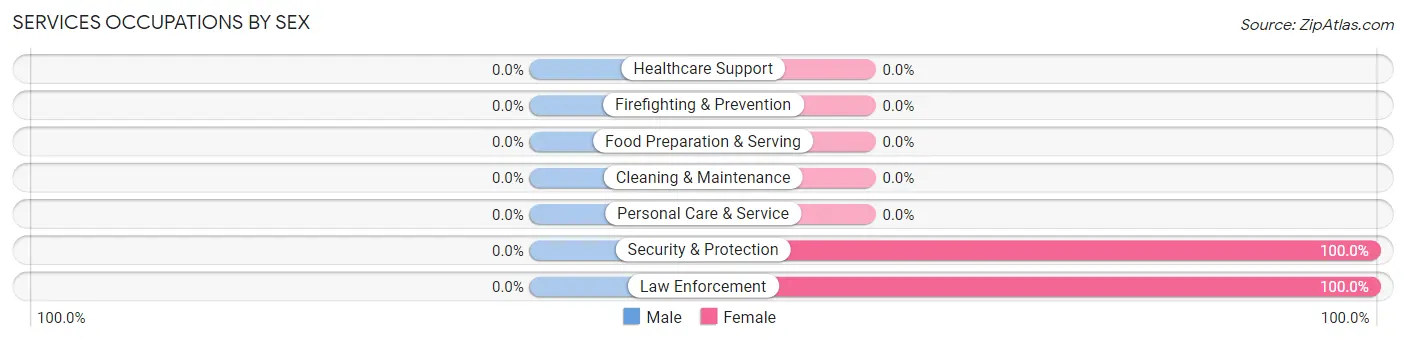
Services Occupations by Sex
| Occupation | Male | Female |
| Healthcare Support | 0 (0.0%) | 0 (0.0%) |
| Security & Protection | 0 (0.0%) | 2 (100.0%) |
| Firefighting & Prevention | 0 (0.0%) | 0 (0.0%) |
| Law Enforcement | 0 (0.0%) | 2 (100.0%) |
| Food Preparation & Serving | 0 (0.0%) | 0 (0.0%) |
| Cleaning & Maintenance | 0 (0.0%) | 0 (0.0%) |
| Personal Care & Service | 0 (0.0%) | 0 (0.0%) |
| Total (Category) | 0 (0.0%) | 2 (100.0%) |
| Total (Overall) | 7 (50.0%) | 7 (50.0%) |
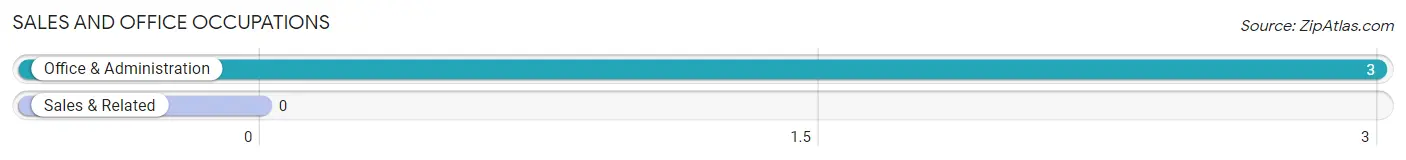
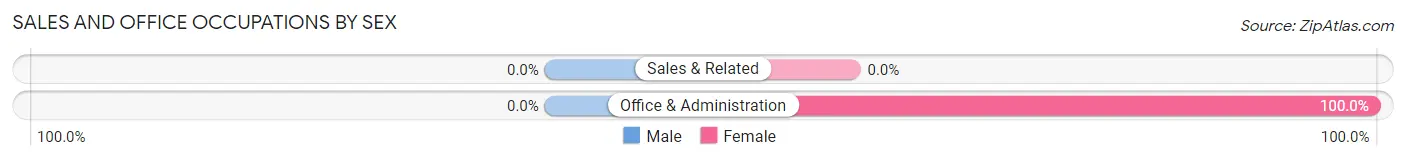
Sales and Office Occupations
The most common Sales and Office occupations in Richfield are , and Office & Administration (3 | 21.4%).
Sales and Office Occupations by Sex
| Occupation | Male | Female |
| Sales & Related | 0 (0.0%) | 0 (0.0%) |
| Office & Administration | 0 (0.0%) | 3 (100.0%) |
| Total (Category) | 0 (0.0%) | 3 (100.0%) |
| Total (Overall) | 7 (50.0%) | 7 (50.0%) |
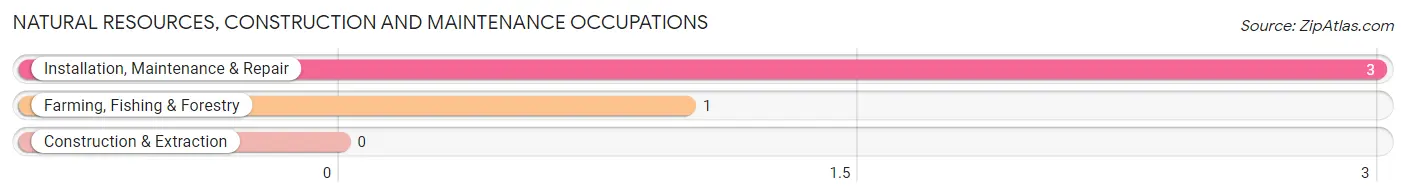
Natural Resources, Construction and Maintenance Occupations
The most common Natural Resources, Construction and Maintenance occupations in Richfield are Installation, Maintenance & Repair (3 | 21.4%), and Farming, Fishing & Forestry (1 | 7.1%).
Natural Resources, Construction and Maintenance Occupations by Sex
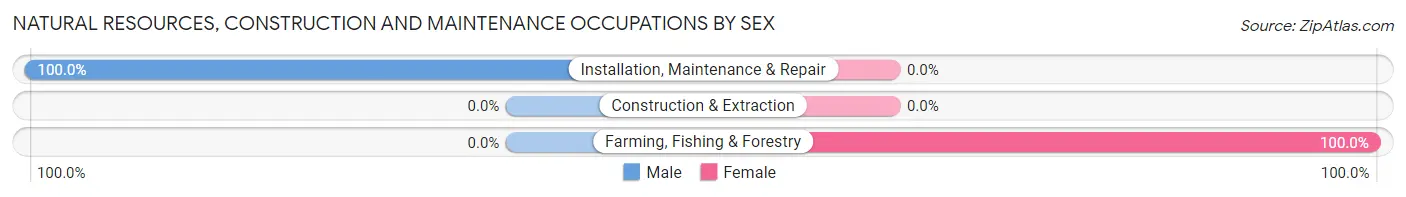
| Occupation | Male | Female |
| Farming, Fishing & Forestry | 0 (0.0%) | 1 (100.0%) |
| Construction & Extraction | 0 (0.0%) | 0 (0.0%) |
| Installation, Maintenance & Repair | 3 (100.0%) | 0 (0.0%) |
| Total (Category) | 3 (75.0%) | 1 (25.0%) |
| Total (Overall) | 7 (50.0%) | 7 (50.0%) |
Production, Transportation and Moving Occupations
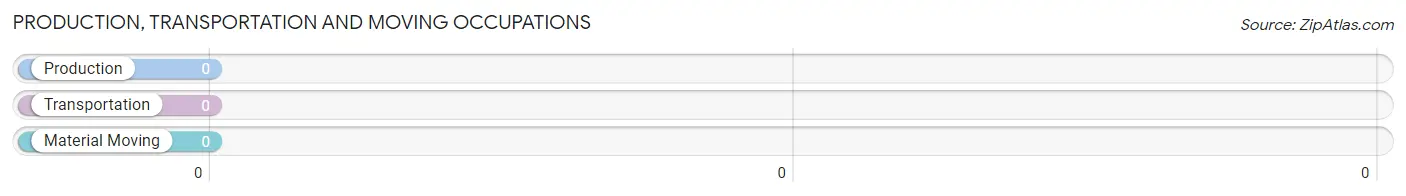
Production, Transportation and Moving Occupations by Sex
| Occupation | Male | Female |
| Production | 0 (0.0%) | 0 (0.0%) |
| Transportation | 0 (0.0%) | 0 (0.0%) |
| Material Moving | 0 (0.0%) | 0 (0.0%) |
| Total (Category) | 0 (0.0%) | 0 (0.0%) |
| Total (Overall) | 7 (50.0%) | 7 (50.0%) |
Employment Industries by Sex in Richfield
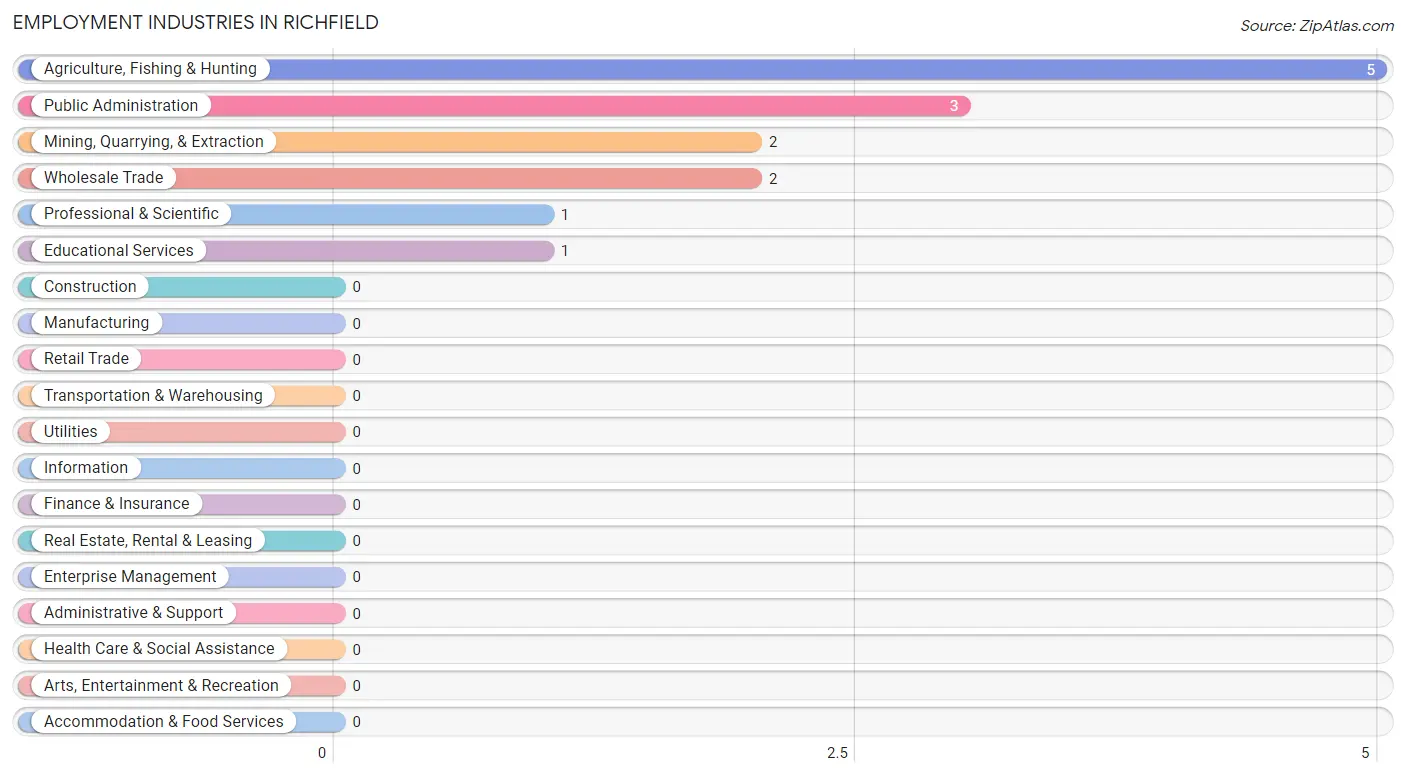
Employment Industries in Richfield
The major employment industries in Richfield include Agriculture, Fishing & Hunting (5 | 35.7%), Public Administration (3 | 21.4%), Mining, Quarrying, & Extraction (2 | 14.3%), Wholesale Trade (2 | 14.3%), and Professional & Scientific (1 | 7.1%).
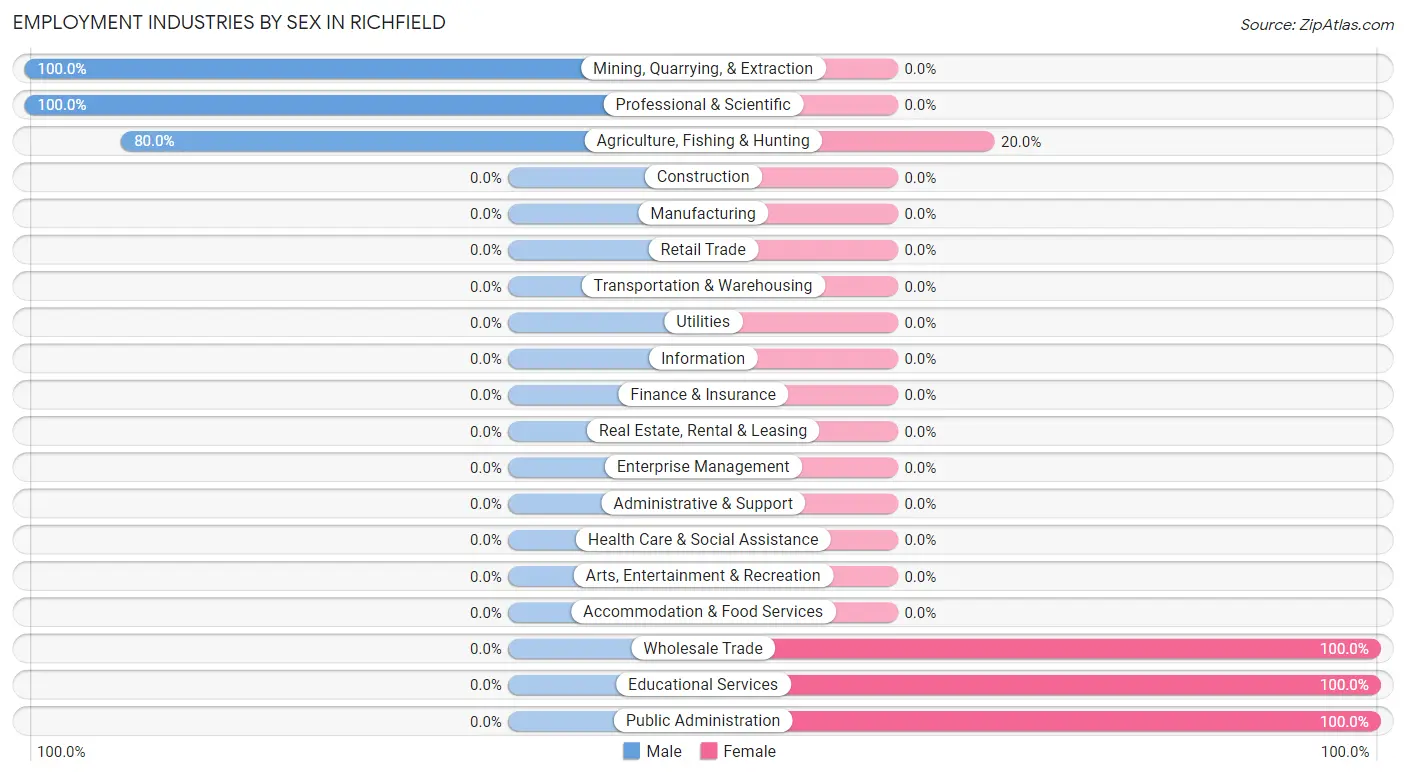
Employment Industries by Sex in Richfield
The Richfield industries that see more men than women are Mining, Quarrying, & Extraction (100.0%), Professional & Scientific (100.0%), and Agriculture, Fishing & Hunting (80.0%), whereas the industries that tend to have a higher number of women are Wholesale Trade (100.0%), Educational Services (100.0%), and Public Administration (100.0%).
| Industry | Male | Female |
| Agriculture, Fishing & Hunting | 4 (80.0%) | 1 (20.0%) |
| Mining, Quarrying, & Extraction | 2 (100.0%) | 0 (0.0%) |
| Construction | 0 (0.0%) | 0 (0.0%) |
| Manufacturing | 0 (0.0%) | 0 (0.0%) |
| Wholesale Trade | 0 (0.0%) | 2 (100.0%) |
| Retail Trade | 0 (0.0%) | 0 (0.0%) |
| Transportation & Warehousing | 0 (0.0%) | 0 (0.0%) |
| Utilities | 0 (0.0%) | 0 (0.0%) |
| Information | 0 (0.0%) | 0 (0.0%) |
| Finance & Insurance | 0 (0.0%) | 0 (0.0%) |
| Real Estate, Rental & Leasing | 0 (0.0%) | 0 (0.0%) |
| Professional & Scientific | 1 (100.0%) | 0 (0.0%) |
| Enterprise Management | 0 (0.0%) | 0 (0.0%) |
| Administrative & Support | 0 (0.0%) | 0 (0.0%) |
| Educational Services | 0 (0.0%) | 1 (100.0%) |
| Health Care & Social Assistance | 0 (0.0%) | 0 (0.0%) |
| Arts, Entertainment & Recreation | 0 (0.0%) | 0 (0.0%) |
| Accommodation & Food Services | 0 (0.0%) | 0 (0.0%) |
| Public Administration | 0 (0.0%) | 3 (100.0%) |
| Total | 7 (50.0%) | 7 (50.0%) |
Education in Richfield
School Enrollment in Richfield
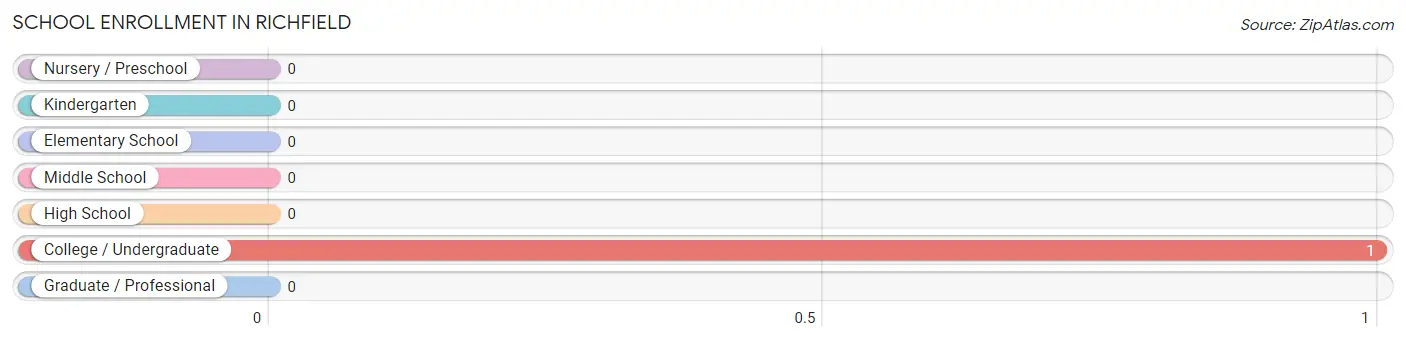
| School Level | # Students | % Students |
| Nursery / Preschool | 0 | 0.0% |
| Kindergarten | 0 | 0.0% |
| Elementary School | 0 | 0.0% |
| Middle School | 0 | 0.0% |
| High School | 0 | 0.0% |
| College / Undergraduate | 1 | 100.0% |
| Graduate / Professional | 0 | 0.0% |
| Total | 1 | 100.0% |
School Enrollment by Age by Funding Source in Richfield
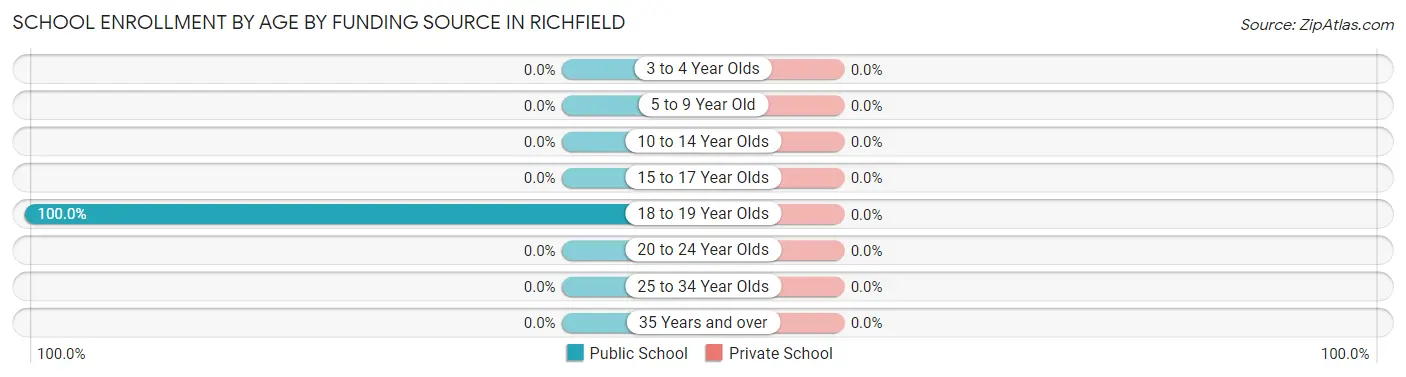
| Age Bracket | Public School | Private School |
| 3 to 4 Year Olds | 0 (0.0%) | 0 (0.0%) |
| 5 to 9 Year Old | 0 (0.0%) | 0 (0.0%) |
| 10 to 14 Year Olds | 0 (0.0%) | 0 (0.0%) |
| 15 to 17 Year Olds | 0 (0.0%) | 0 (0.0%) |
| 18 to 19 Year Olds | 1 (100.0%) | 0 (0.0%) |
| 20 to 24 Year Olds | 0 (0.0%) | 0 (0.0%) |
| 25 to 34 Year Olds | 0 (0.0%) | 0 (0.0%) |
| 35 Years and over | 0 (0.0%) | 0 (0.0%) |
| Total | 1 (100.0%) | 0 (0.0%) |
Educational Attainment by Field of Study in Richfield
, and education (4 | 100.0%) are the most common fields of study among 4 individuals in Richfield who have obtained a bachelor's degree or higher.
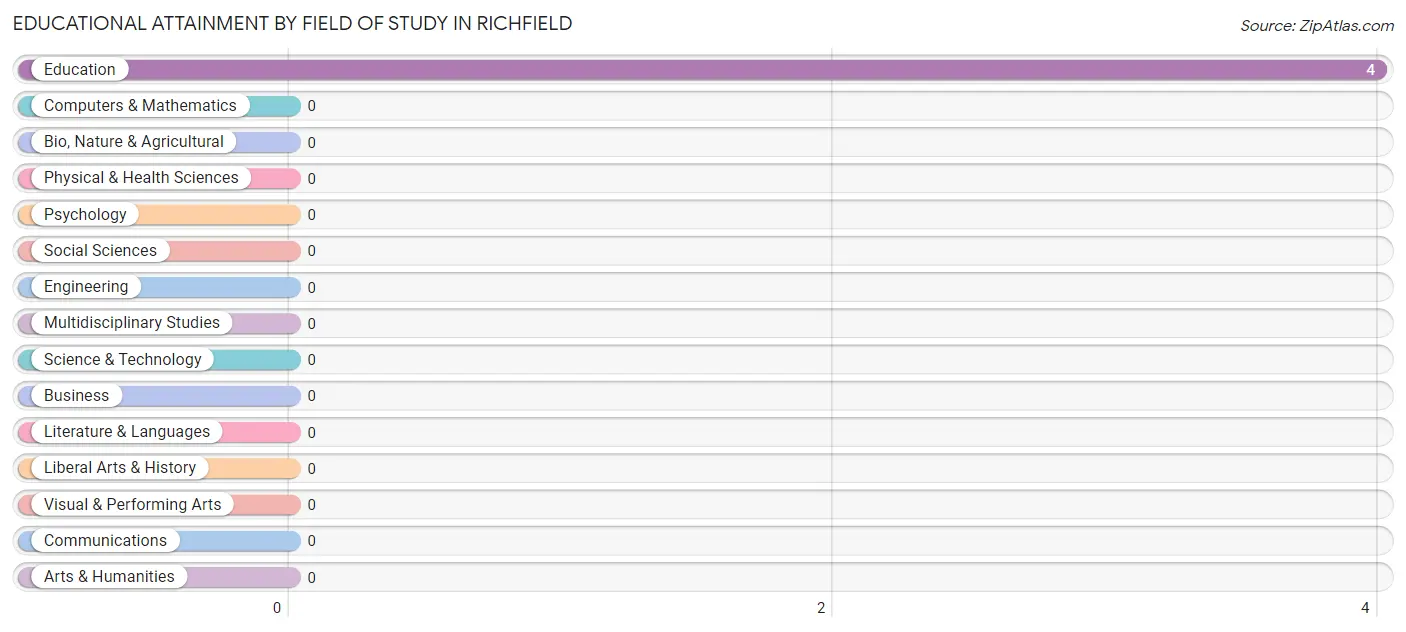
| Field of Study | # Graduates | % Graduates |
| Computers & Mathematics | 0 | 0.0% |
| Bio, Nature & Agricultural | 0 | 0.0% |
| Physical & Health Sciences | 0 | 0.0% |
| Psychology | 0 | 0.0% |
| Social Sciences | 0 | 0.0% |
| Engineering | 0 | 0.0% |
| Multidisciplinary Studies | 0 | 0.0% |
| Science & Technology | 0 | 0.0% |
| Business | 0 | 0.0% |
| Education | 4 | 100.0% |
| Literature & Languages | 0 | 0.0% |
| Liberal Arts & History | 0 | 0.0% |
| Visual & Performing Arts | 0 | 0.0% |
| Communications | 0 | 0.0% |
| Arts & Humanities | 0 | 0.0% |
| Total | 4 | 100.0% |
Transportation & Commute in Richfield
Vehicle Availability by Sex in Richfield
The most prevalent vehicle ownership categories in Richfield are males with 2 vehicles (4, accounting for 57.1%) and females with 2 vehicles (4, making up 57.1%).
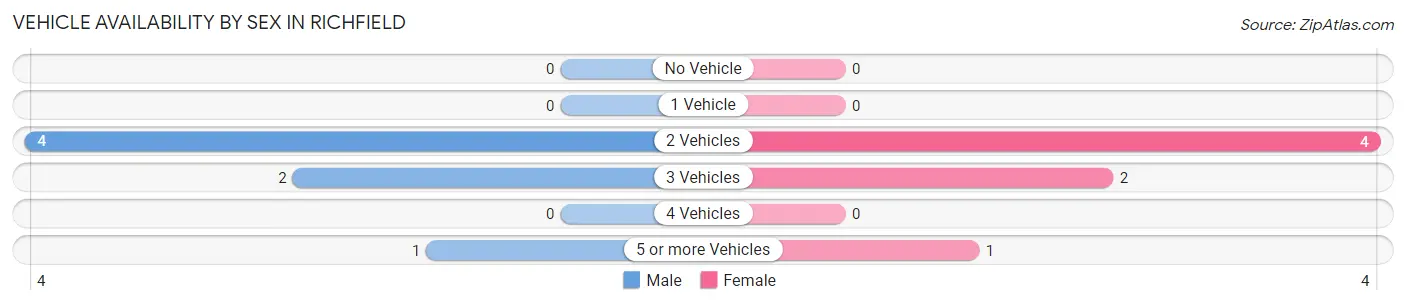
| Vehicles Available | Male | Female |
| No Vehicle | 0 (0.0%) | 0 (0.0%) |
| 1 Vehicle | 0 (0.0%) | 0 (0.0%) |
| 2 Vehicles | 4 (57.1%) | 4 (57.1%) |
| 3 Vehicles | 2 (28.6%) | 2 (28.6%) |
| 4 Vehicles | 0 (0.0%) | 0 (0.0%) |
| 5 or more Vehicles | 1 (14.3%) | 1 (14.3%) |
| Total | 7 (100.0%) | 7 (100.0%) |
Commute Time in Richfield
The most frequently occuring commute durations in Richfield are 10 to 14 minutes (3 commuters, 23.1%), 20 to 24 minutes (3 commuters, 23.1%), and 5 to 9 minutes (2 commuters, 15.4%).
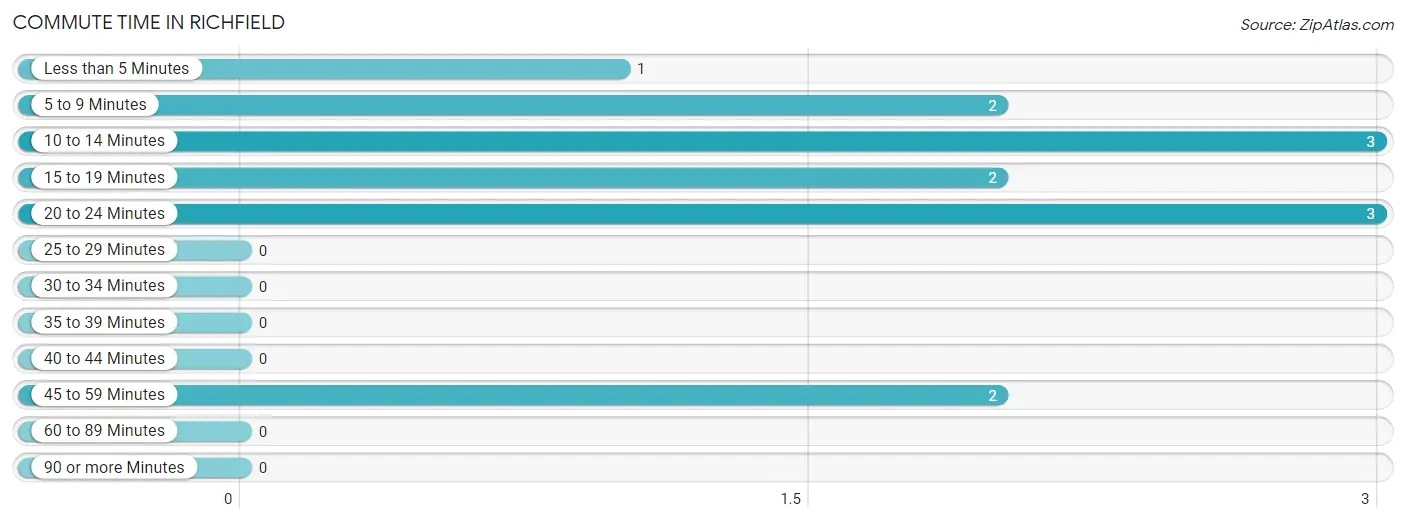
| Commute Time | # Commuters | % Commuters |
| Less than 5 Minutes | 1 | 7.7% |
| 5 to 9 Minutes | 2 | 15.4% |
| 10 to 14 Minutes | 3 | 23.1% |
| 15 to 19 Minutes | 2 | 15.4% |
| 20 to 24 Minutes | 3 | 23.1% |
| 25 to 29 Minutes | 0 | 0.0% |
| 30 to 34 Minutes | 0 | 0.0% |
| 35 to 39 Minutes | 0 | 0.0% |
| 40 to 44 Minutes | 0 | 0.0% |
| 45 to 59 Minutes | 2 | 15.4% |
| 60 to 89 Minutes | 0 | 0.0% |
| 90 or more Minutes | 0 | 0.0% |
Commute Time by Sex in Richfield
The most common commute times in Richfield are 10 to 14 minutes (3 commuters, 50.0%) for males and 20 to 24 minutes (3 commuters, 42.9%) for females.
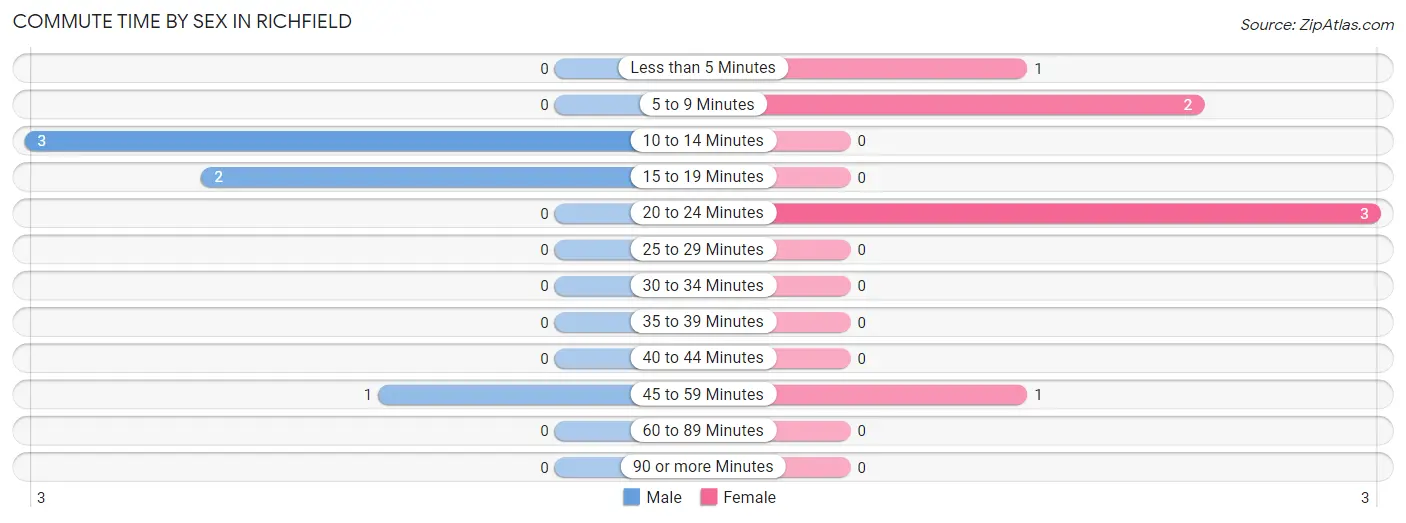
| Commute Time | Male | Female |
| Less than 5 Minutes | 0 (0.0%) | 1 (14.3%) |
| 5 to 9 Minutes | 0 (0.0%) | 2 (28.6%) |
| 10 to 14 Minutes | 3 (50.0%) | 0 (0.0%) |
| 15 to 19 Minutes | 2 (33.3%) | 0 (0.0%) |
| 20 to 24 Minutes | 0 (0.0%) | 3 (42.9%) |
| 25 to 29 Minutes | 0 (0.0%) | 0 (0.0%) |
| 30 to 34 Minutes | 0 (0.0%) | 0 (0.0%) |
| 35 to 39 Minutes | 0 (0.0%) | 0 (0.0%) |
| 40 to 44 Minutes | 0 (0.0%) | 0 (0.0%) |
| 45 to 59 Minutes | 1 (16.7%) | 1 (14.3%) |
| 60 to 89 Minutes | 0 (0.0%) | 0 (0.0%) |
| 90 or more Minutes | 0 (0.0%) | 0 (0.0%) |
Time of Departure to Work by Sex in Richfield
The most frequent times of departure to work in Richfield are 6:30 AM to 6:59 AM (5, 83.3%) for males and 6:00 AM to 6:29 AM (2, 28.6%) for females.
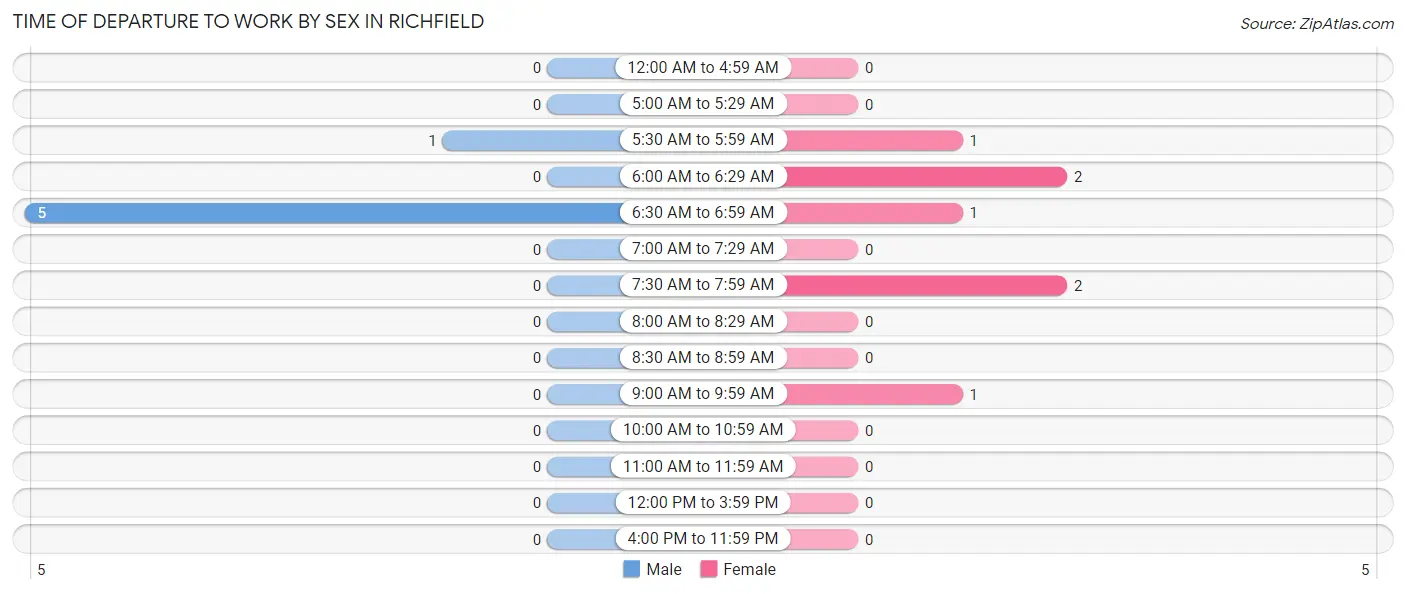
| Time of Departure | Male | Female |
| 12:00 AM to 4:59 AM | 0 (0.0%) | 0 (0.0%) |
| 5:00 AM to 5:29 AM | 0 (0.0%) | 0 (0.0%) |
| 5:30 AM to 5:59 AM | 1 (16.7%) | 1 (14.3%) |
| 6:00 AM to 6:29 AM | 0 (0.0%) | 2 (28.6%) |
| 6:30 AM to 6:59 AM | 5 (83.3%) | 1 (14.3%) |
| 7:00 AM to 7:29 AM | 0 (0.0%) | 0 (0.0%) |
| 7:30 AM to 7:59 AM | 0 (0.0%) | 2 (28.6%) |
| 8:00 AM to 8:29 AM | 0 (0.0%) | 0 (0.0%) |
| 8:30 AM to 8:59 AM | 0 (0.0%) | 0 (0.0%) |
| 9:00 AM to 9:59 AM | 0 (0.0%) | 1 (14.3%) |
| 10:00 AM to 10:59 AM | 0 (0.0%) | 0 (0.0%) |
| 11:00 AM to 11:59 AM | 0 (0.0%) | 0 (0.0%) |
| 12:00 PM to 3:59 PM | 0 (0.0%) | 0 (0.0%) |
| 4:00 PM to 11:59 PM | 0 (0.0%) | 0 (0.0%) |
| Total | 6 (100.0%) | 7 (100.0%) |
Housing Occupancy in Richfield
Occupancy by Ownership in Richfield
Of the total 10 dwellings in Richfield, owner-occupied units account for 10 (100.0%), while renter-occupied units make up 0 (0.0%).
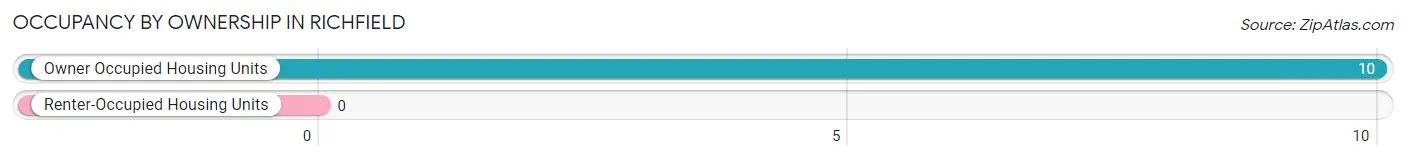
| Occupancy | # Housing Units | % Housing Units |
| Owner Occupied Housing Units | 10 | 100.0% |
| Renter-Occupied Housing Units | 0 | 0.0% |
| Total Occupied Housing Units | 10 | 100.0% |
Occupancy by Household Size in Richfield
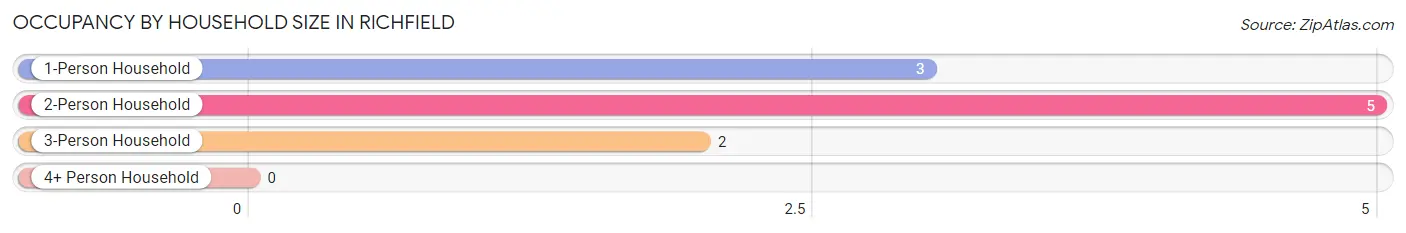
| Household Size | # Housing Units | % Housing Units |
| 1-Person Household | 3 | 30.0% |
| 2-Person Household | 5 | 50.0% |
| 3-Person Household | 2 | 20.0% |
| 4+ Person Household | 0 | 0.0% |
| Total Housing Units | 10 | 100.0% |
Occupancy by Ownership by Household Size in Richfield
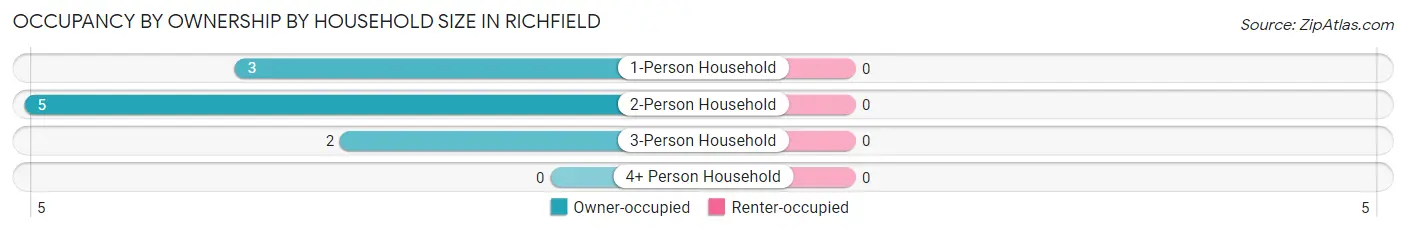
| Household Size | Owner-occupied | Renter-occupied |
| 1-Person Household | 3 (100.0%) | 0 (0.0%) |
| 2-Person Household | 5 (100.0%) | 0 (0.0%) |
| 3-Person Household | 2 (100.0%) | 0 (0.0%) |
| 4+ Person Household | 0 (0.0%) | 0 (0.0%) |
| Total Housing Units | 10 (100.0%) | 0 (0.0%) |
Occupancy by Educational Attainment in Richfield
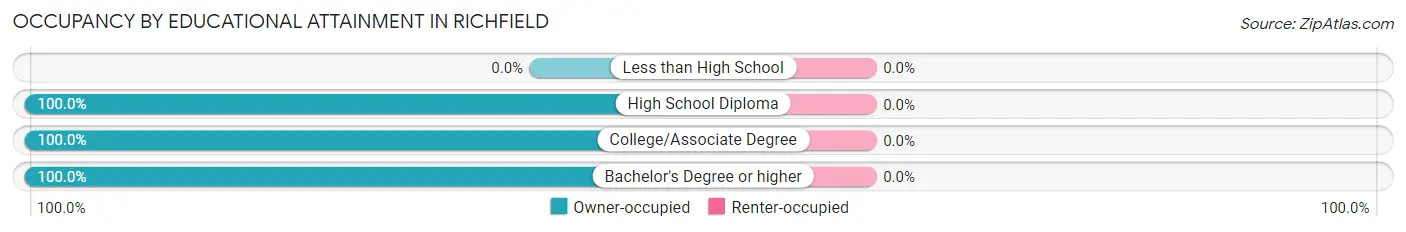
| Household Size | Owner-occupied | Renter-occupied |
| Less than High School | 0 (0.0%) | 0 (0.0%) |
| High School Diploma | 4 (100.0%) | 0 (0.0%) |
| College/Associate Degree | 2 (100.0%) | 0 (0.0%) |
| Bachelor's Degree or higher | 4 (100.0%) | 0 (0.0%) |
Occupancy by Age of Householder in Richfield
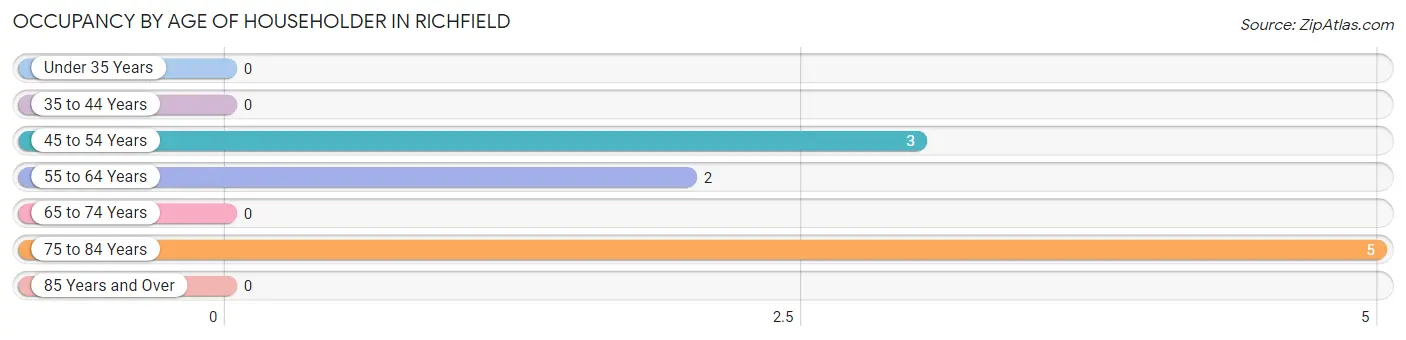
| Age Bracket | # Households | % Households |
| Under 35 Years | 0 | 0.0% |
| 35 to 44 Years | 0 | 0.0% |
| 45 to 54 Years | 3 | 30.0% |
| 55 to 64 Years | 2 | 20.0% |
| 65 to 74 Years | 0 | 0.0% |
| 75 to 84 Years | 5 | 50.0% |
| 85 Years and Over | 0 | 0.0% |
| Total | 10 | 100.0% |
Housing Finances in Richfield
Median Income by Occupancy in Richfield
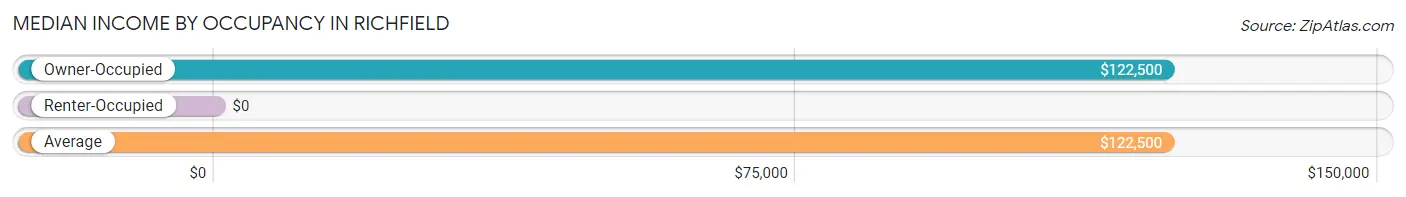
| Occupancy Type | # Households | Median Income |
| Owner-Occupied | 10 (100.0%) | $122,500 |
| Renter-Occupied | 0 (0.0%) | $0 |
| Average | 10 (100.0%) | $122,500 |
Occupancy by Householder Income Bracket in Richfield
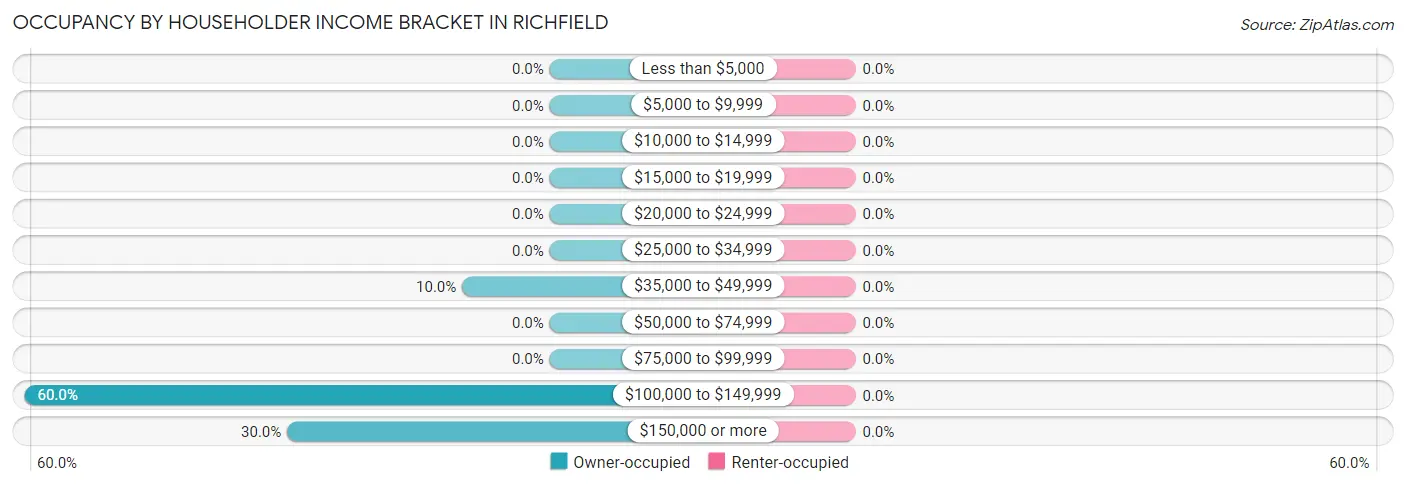
| Income Bracket | Owner-occupied | Renter-occupied |
| Less than $5,000 | 0 (0.0%) | 0 (0.0%) |
| $5,000 to $9,999 | 0 (0.0%) | 0 (0.0%) |
| $10,000 to $14,999 | 0 (0.0%) | 0 (0.0%) |
| $15,000 to $19,999 | 0 (0.0%) | 0 (0.0%) |
| $20,000 to $24,999 | 0 (0.0%) | 0 (0.0%) |
| $25,000 to $34,999 | 0 (0.0%) | 0 (0.0%) |
| $35,000 to $49,999 | 1 (10.0%) | 0 (0.0%) |
| $50,000 to $74,999 | 0 (0.0%) | 0 (0.0%) |
| $75,000 to $99,999 | 0 (0.0%) | 0 (0.0%) |
| $100,000 to $149,999 | 6 (60.0%) | 0 (0.0%) |
| $150,000 or more | 3 (30.0%) | 0 (0.0%) |
| Total | 10 (100.0%) | 0 (0.0%) |
Monthly Housing Cost Tiers in Richfield
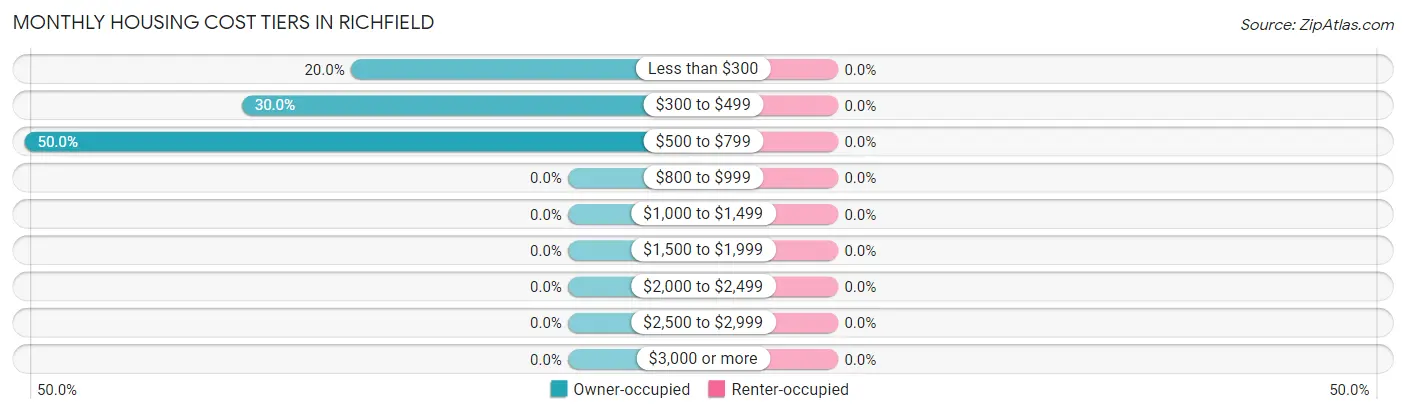
| Monthly Cost | Owner-occupied | Renter-occupied |
| Less than $300 | 2 (20.0%) | 0 (0.0%) |
| $300 to $499 | 3 (30.0%) | 0 (0.0%) |
| $500 to $799 | 5 (50.0%) | 0 (0.0%) |
| $800 to $999 | 0 (0.0%) | 0 (0.0%) |
| $1,000 to $1,499 | 0 (0.0%) | 0 (0.0%) |
| $1,500 to $1,999 | 0 (0.0%) | 0 (0.0%) |
| $2,000 to $2,499 | 0 (0.0%) | 0 (0.0%) |
| $2,500 to $2,999 | 0 (0.0%) | 0 (0.0%) |
| $3,000 or more | 0 (0.0%) | 0 (0.0%) |
| Total | 10 (100.0%) | 0 (0.0%) |
Physical Housing Characteristics in Richfield
Housing Structures in Richfield
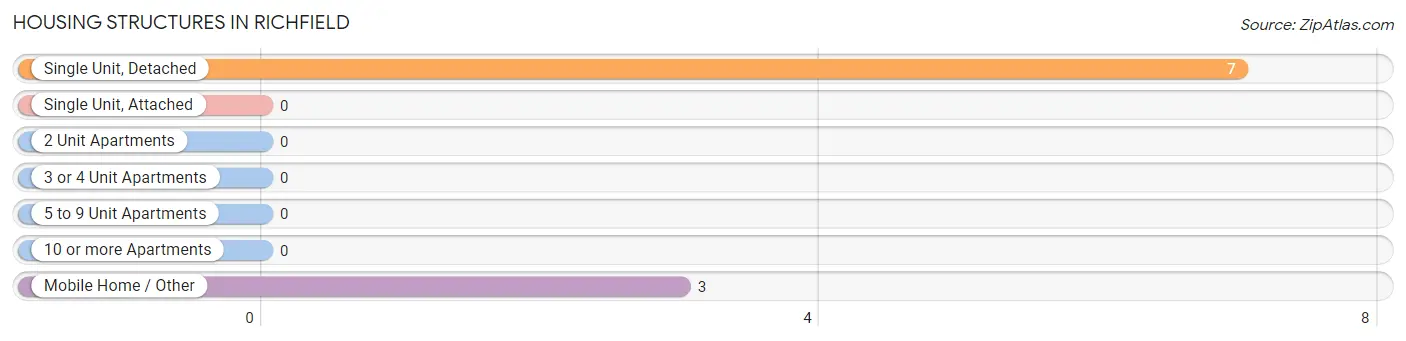
| Structure Type | # Housing Units | % Housing Units |
| Single Unit, Detached | 7 | 70.0% |
| Single Unit, Attached | 0 | 0.0% |
| 2 Unit Apartments | 0 | 0.0% |
| 3 or 4 Unit Apartments | 0 | 0.0% |
| 5 to 9 Unit Apartments | 0 | 0.0% |
| 10 or more Apartments | 0 | 0.0% |
| Mobile Home / Other | 3 | 30.0% |
| Total | 10 | 100.0% |
Housing Structures by Occupancy in Richfield
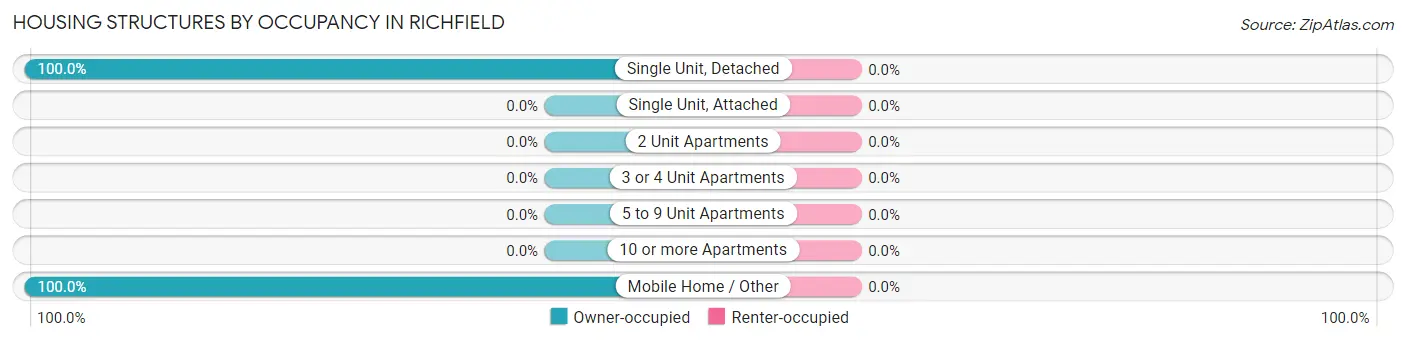
| Structure Type | Owner-occupied | Renter-occupied |
| Single Unit, Detached | 7 (100.0%) | 0 (0.0%) |
| Single Unit, Attached | 0 (0.0%) | 0 (0.0%) |
| 2 Unit Apartments | 0 (0.0%) | 0 (0.0%) |
| 3 or 4 Unit Apartments | 0 (0.0%) | 0 (0.0%) |
| 5 to 9 Unit Apartments | 0 (0.0%) | 0 (0.0%) |
| 10 or more Apartments | 0 (0.0%) | 0 (0.0%) |
| Mobile Home / Other | 3 (100.0%) | 0 (0.0%) |
| Total | 10 (100.0%) | 0 (0.0%) |
Housing Structures by Number of Rooms in Richfield
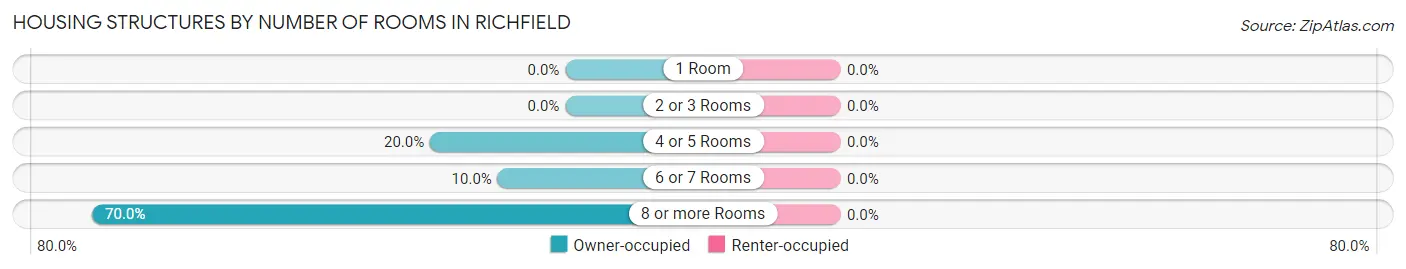
| Number of Rooms | Owner-occupied | Renter-occupied |
| 1 Room | 0 (0.0%) | 0 (0.0%) |
| 2 or 3 Rooms | 0 (0.0%) | 0 (0.0%) |
| 4 or 5 Rooms | 2 (20.0%) | 0 (0.0%) |
| 6 or 7 Rooms | 1 (10.0%) | 0 (0.0%) |
| 8 or more Rooms | 7 (70.0%) | 0 (0.0%) |
| Total | 10 (100.0%) | 0 (0.0%) |
Housing Structure by Heating Type in Richfield
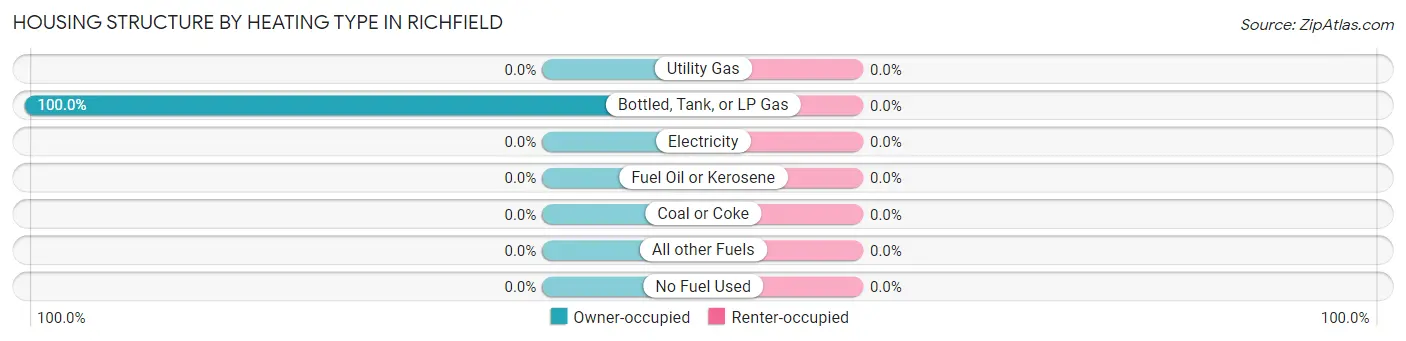
| Heating Type | Owner-occupied | Renter-occupied |
| Utility Gas | 0 (0.0%) | 0 (0.0%) |
| Bottled, Tank, or LP Gas | 10 (100.0%) | 0 (0.0%) |
| Electricity | 0 (0.0%) | 0 (0.0%) |
| Fuel Oil or Kerosene | 0 (0.0%) | 0 (0.0%) |
| Coal or Coke | 0 (0.0%) | 0 (0.0%) |
| All other Fuels | 0 (0.0%) | 0 (0.0%) |
| No Fuel Used | 0 (0.0%) | 0 (0.0%) |
| Total | 10 (100.0%) | 0 (0.0%) |
Household Vehicle Usage in Richfield
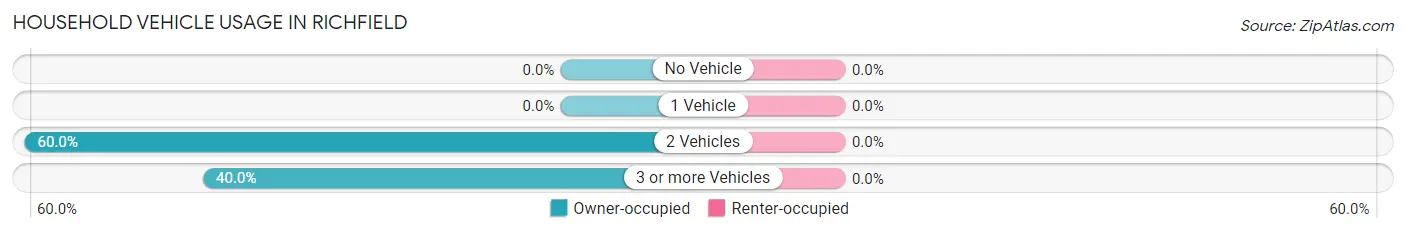
| Vehicles per Household | Owner-occupied | Renter-occupied |
| No Vehicle | 0 (0.0%) | 0 (0.0%) |
| 1 Vehicle | 0 (0.0%) | 0 (0.0%) |
| 2 Vehicles | 6 (60.0%) | 0 (0.0%) |
| 3 or more Vehicles | 4 (40.0%) | 0 (0.0%) |
| Total | 10 (100.0%) | 0 (0.0%) |
Real Estate & Mortgages in Richfield
Real Estate and Mortgage Overview in Richfield
| Characteristic | Without Mortgage | With Mortgage |
| Housing Units | 10 | 0 |
| Median Property Value | - | - |
| Median Household Income | $122,500 | $0 |
| Monthly Housing Costs | $500 | $0 |
| Real Estate Taxes | $720 | $0 |
Property Value by Mortgage Status in Richfield
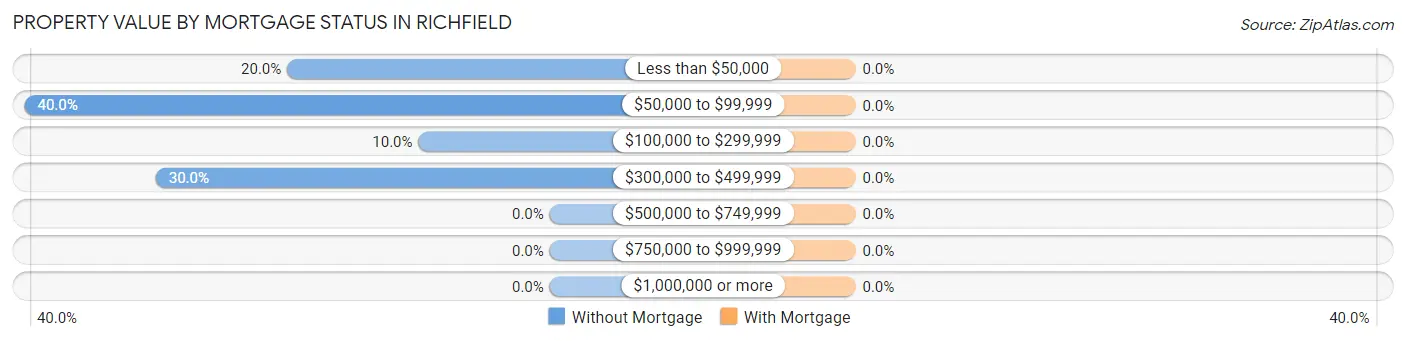
| Property Value | Without Mortgage | With Mortgage |
| Less than $50,000 | 2 (20.0%) | 0 (0.0%) |
| $50,000 to $99,999 | 4 (40.0%) | 0 (0.0%) |
| $100,000 to $299,999 | 1 (10.0%) | 0 (0.0%) |
| $300,000 to $499,999 | 3 (30.0%) | 0 (0.0%) |
| $500,000 to $749,999 | 0 (0.0%) | 0 (0.0%) |
| $750,000 to $999,999 | 0 (0.0%) | 0 (0.0%) |
| $1,000,000 or more | 0 (0.0%) | 0 (0.0%) |
| Total | 10 (100.0%) | 0 (0.0%) |
Household Income by Mortgage Status in Richfield
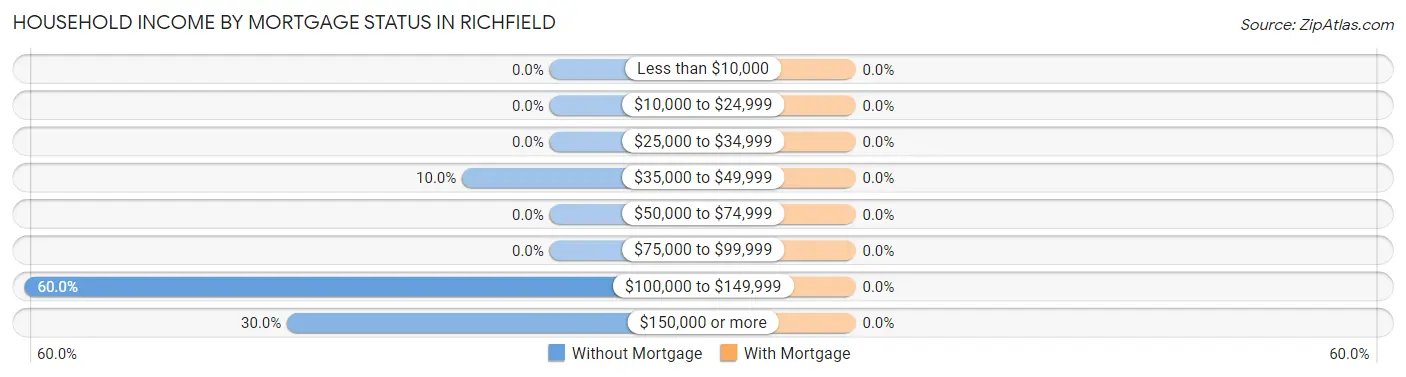
| Household Income | Without Mortgage | With Mortgage |
| Less than $10,000 | 0 (0.0%) | 0 (0.0%) |
| $10,000 to $24,999 | 0 (0.0%) | 0 (0.0%) |
| $25,000 to $34,999 | 0 (0.0%) | 0 (0.0%) |
| $35,000 to $49,999 | 1 (10.0%) | 0 (0.0%) |
| $50,000 to $74,999 | 0 (0.0%) | 0 (0.0%) |
| $75,000 to $99,999 | 0 (0.0%) | 0 (0.0%) |
| $100,000 to $149,999 | 6 (60.0%) | 0 (0.0%) |
| $150,000 or more | 3 (30.0%) | 0 (0.0%) |
| Total | 10 (100.0%) | 0 (0.0%) |
Property Value to Household Income Ratio in Richfield
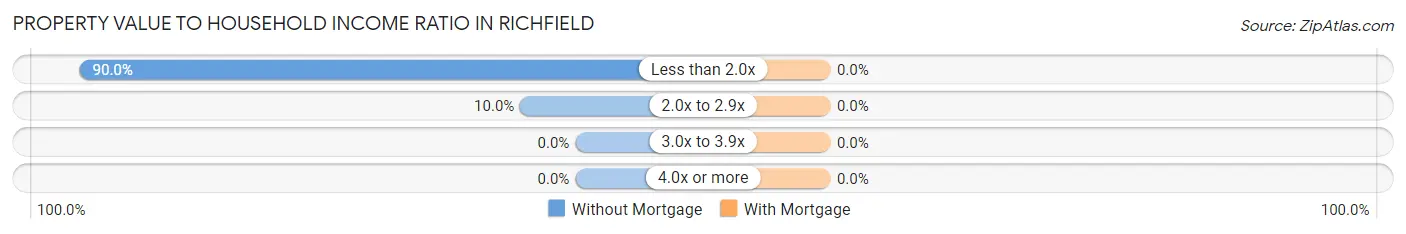
| Value-to-Income Ratio | Without Mortgage | With Mortgage |
| Less than 2.0x | 9 (90.0%) | 0 (0.0%) |
| 2.0x to 2.9x | 1 (10.0%) | 0 (0.0%) |
| 3.0x to 3.9x | 0 (0.0%) | 0 (0.0%) |
| 4.0x or more | 0 (0.0%) | 0 (0.0%) |
| Total | 10 (100.0%) | 0 (0.0%) |
Real Estate Taxes by Mortgage Status in Richfield
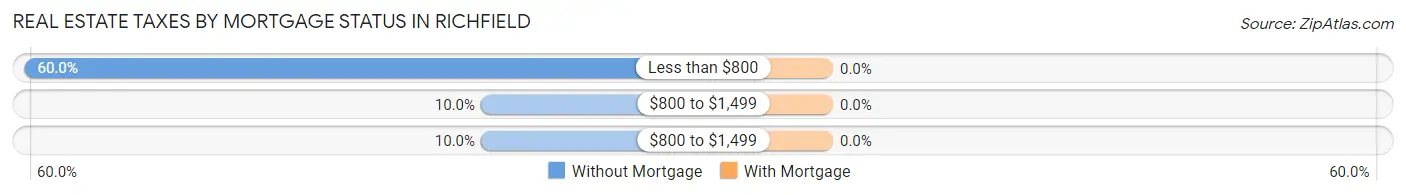
| Property Taxes | Without Mortgage | With Mortgage |
| Less than $800 | 6 (60.0%) | 0 (0.0%) |
| $800 to $1,499 | 1 (10.0%) | 0 (0.0%) |
| $800 to $1,499 | 1 (10.0%) | 0 (0.0%) |
| Total | 10 (100.0%) | 0 (0.0%) |
Health & Disability in Richfield
Health Insurance Coverage by Age in Richfield
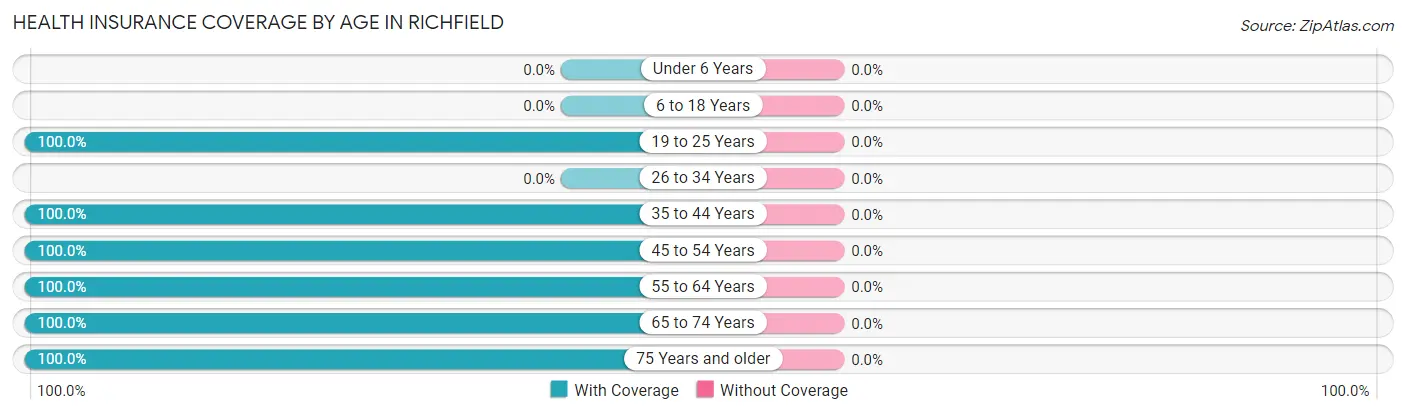
| Age Bracket | With Coverage | Without Coverage |
| Under 6 Years | 0 (0.0%) | 0 (0.0%) |
| 6 to 18 Years | 0 (0.0%) | 0 (0.0%) |
| 19 to 25 Years | 1 (100.0%) | 0 (0.0%) |
| 26 to 34 Years | 0 (0.0%) | 0 (0.0%) |
| 35 to 44 Years | 2 (100.0%) | 0 (0.0%) |
| 45 to 54 Years | 5 (100.0%) | 0 (0.0%) |
| 55 to 64 Years | 2 (100.0%) | 0 (0.0%) |
| 65 to 74 Years | 3 (100.0%) | 0 (0.0%) |
| 75 Years and older | 6 (100.0%) | 0 (0.0%) |
| Total | 19 (100.0%) | 0 (0.0%) |
Health Insurance Coverage by Citizenship Status in Richfield
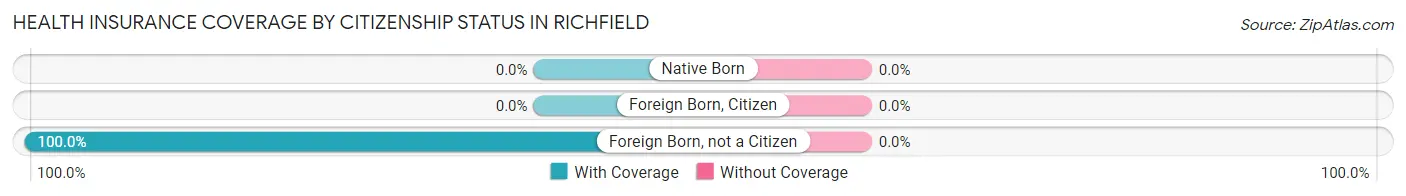
| Citizenship Status | With Coverage | Without Coverage |
| Native Born | 0 (0.0%) | 0 (0.0%) |
| Foreign Born, Citizen | 0 (0.0%) | 0 (0.0%) |
| Foreign Born, not a Citizen | 1 (100.0%) | 0 (0.0%) |
Health Insurance Coverage by Household Income in Richfield
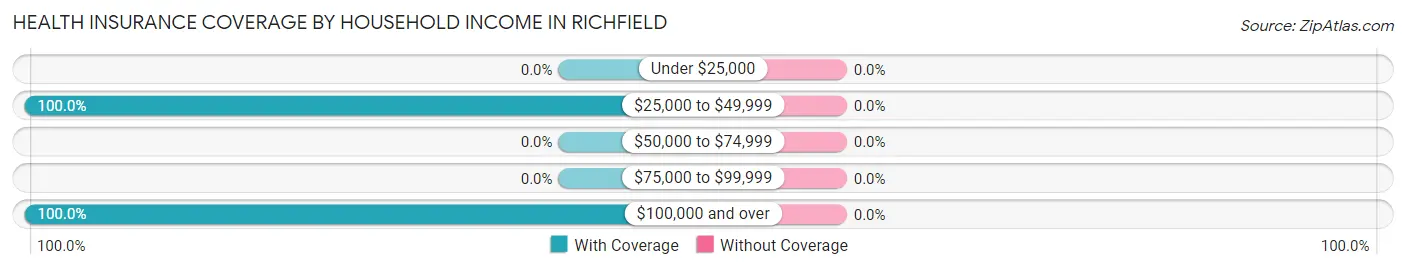
| Household Income | With Coverage | Without Coverage |
| Under $25,000 | 0 (0.0%) | 0 (0.0%) |
| $25,000 to $49,999 | 2 (100.0%) | 0 (0.0%) |
| $50,000 to $74,999 | 0 (0.0%) | 0 (0.0%) |
| $75,000 to $99,999 | 0 (0.0%) | 0 (0.0%) |
| $100,000 and over | 17 (100.0%) | 0 (0.0%) |
Public vs Private Health Insurance Coverage by Age in Richfield
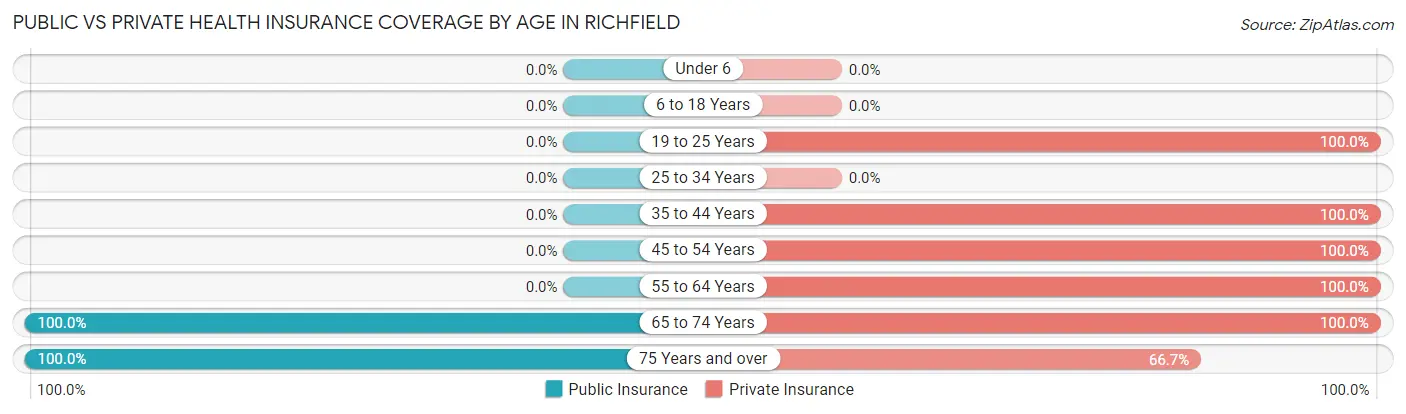
| Age Bracket | Public Insurance | Private Insurance |
| Under 6 | 0 (0.0%) | 0 (0.0%) |
| 6 to 18 Years | 0 (0.0%) | 0 (0.0%) |
| 19 to 25 Years | 0 (0.0%) | 1 (100.0%) |
| 25 to 34 Years | 0 (0.0%) | 0 (0.0%) |
| 35 to 44 Years | 0 (0.0%) | 2 (100.0%) |
| 45 to 54 Years | 0 (0.0%) | 5 (100.0%) |
| 55 to 64 Years | 0 (0.0%) | 2 (100.0%) |
| 65 to 74 Years | 3 (100.0%) | 3 (100.0%) |
| 75 Years and over | 6 (100.0%) | 4 (66.7%) |
| Total | 9 (47.4%) | 17 (89.5%) |
Disability Status by Sex by Age in Richfield
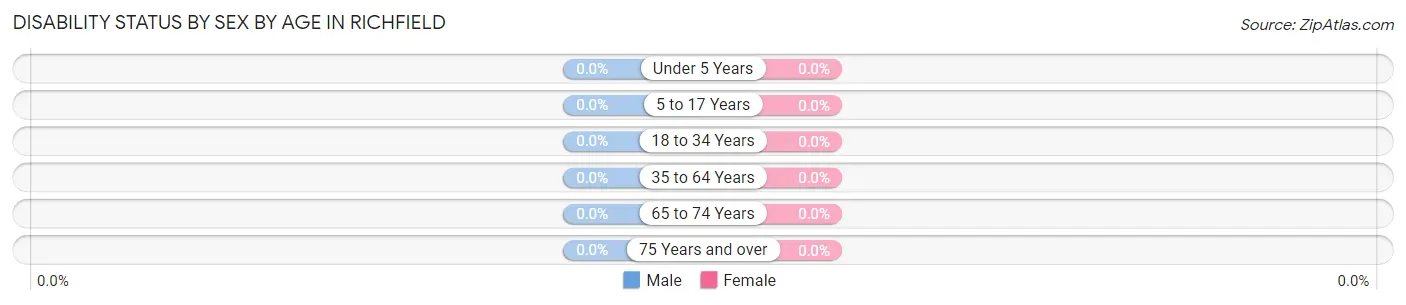
| Age Bracket | Male | Female |
| Under 5 Years | 0 (0.0%) | 0 (0.0%) |
| 5 to 17 Years | 0 (0.0%) | 0 (0.0%) |
| 18 to 34 Years | 0 (0.0%) | 0 (0.0%) |
| 35 to 64 Years | 0 (0.0%) | 0 (0.0%) |
| 65 to 74 Years | 0 (0.0%) | 0 (0.0%) |
| 75 Years and over | 0 (0.0%) | 0 (0.0%) |
Disability Class by Sex by Age in Richfield
Disability Class: Hearing Difficulty
| Age Bracket | Male | Female |
| Under 5 Years | 0 (0.0%) | 0 (0.0%) |
| 5 to 17 Years | 0 (0.0%) | 0 (0.0%) |
| 18 to 34 Years | 0 (0.0%) | 0 (0.0%) |
| 35 to 64 Years | 0 (0.0%) | 0 (0.0%) |
| 65 to 74 Years | 0 (0.0%) | 0 (0.0%) |
| 75 Years and over | 0 (0.0%) | 0 (0.0%) |
Disability Class: Vision Difficulty
| Age Bracket | Male | Female |
| Under 5 Years | 0 (0.0%) | 0 (0.0%) |
| 5 to 17 Years | 0 (0.0%) | 0 (0.0%) |
| 18 to 34 Years | 0 (0.0%) | 0 (0.0%) |
| 35 to 64 Years | 0 (0.0%) | 0 (0.0%) |
| 65 to 74 Years | 0 (0.0%) | 0 (0.0%) |
| 75 Years and over | 0 (0.0%) | 0 (0.0%) |
Disability Class: Cognitive Difficulty
| Age Bracket | Male | Female |
| 5 to 17 Years | 0 (0.0%) | 0 (0.0%) |
| 18 to 34 Years | 0 (0.0%) | 0 (0.0%) |
| 35 to 64 Years | 0 (0.0%) | 0 (0.0%) |
| 65 to 74 Years | 0 (0.0%) | 0 (0.0%) |
| 75 Years and over | 0 (0.0%) | 0 (0.0%) |
Disability Class: Ambulatory Difficulty
| Age Bracket | Male | Female |
| 5 to 17 Years | 0 (0.0%) | 0 (0.0%) |
| 18 to 34 Years | 0 (0.0%) | 0 (0.0%) |
| 35 to 64 Years | 0 (0.0%) | 0 (0.0%) |
| 65 to 74 Years | 0 (0.0%) | 0 (0.0%) |
| 75 Years and over | 0 (0.0%) | 0 (0.0%) |
Disability Class: Self-Care Difficulty
| Age Bracket | Male | Female |
| 5 to 17 Years | 0 (0.0%) | 0 (0.0%) |
| 18 to 34 Years | 0 (0.0%) | 0 (0.0%) |
| 35 to 64 Years | 0 (0.0%) | 0 (0.0%) |
| 65 to 74 Years | 0 (0.0%) | 0 (0.0%) |
| 75 Years and over | 0 (0.0%) | 0 (0.0%) |
Technology Access in Richfield
Computing Device Access in Richfield
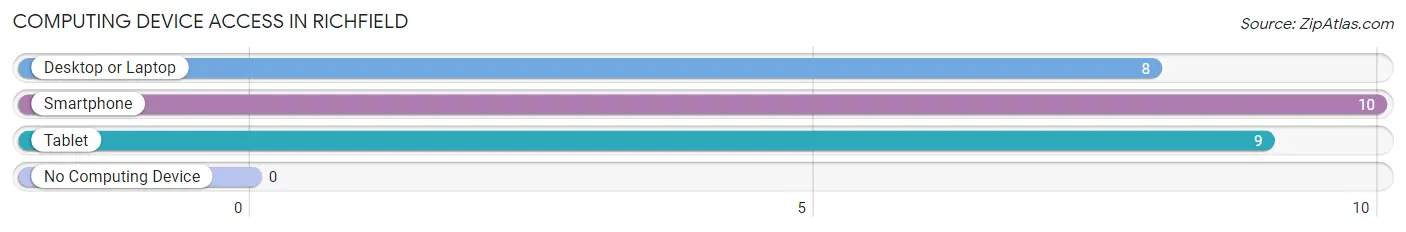
| Device Type | # Households | % Households |
| Desktop or Laptop | 8 | 80.0% |
| Smartphone | 10 | 100.0% |
| Tablet | 9 | 90.0% |
| No Computing Device | 0 | 0.0% |
| Total | 10 | 100.0% |
Internet Access in Richfield
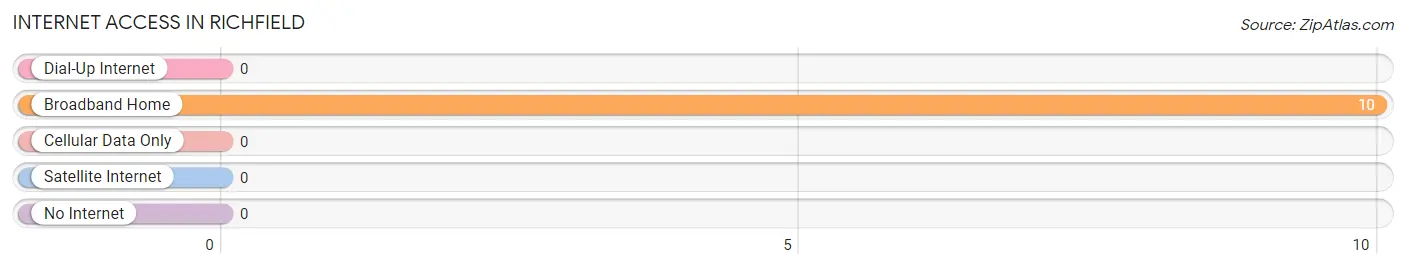
| Internet Type | # Households | % Households |
| Dial-Up Internet | 0 | 0.0% |
| Broadband Home | 10 | 100.0% |
| Cellular Data Only | 0 | 0.0% |
| Satellite Internet | 0 | 0.0% |
| No Internet | 0 | 0.0% |
| Total | 10 | 100.0% |
Richfield Summary
Richfield, Kansas is a small town located in the south-central part of the state. It is situated in the heart of the Flint Hills, a region of rolling hills and prairies that stretches across the state. Richfield is located in the county of Morris, and is part of the Manhattan, Kansas Metropolitan Statistical Area. The town has a population of just over 500 people, and is known for its rural charm and friendly atmosphere.
History
Richfield was founded in 1887 by a group of settlers from the nearby town of Council Grove. The town was named after the rich soil in the area, which was ideal for farming. The town quickly grew, and by the early 1900s, it had become a thriving agricultural community. The town was home to several businesses, including a general store, a blacksmith shop, and a hotel.
In the early 1900s, Richfield was also home to a large number of German immigrants. These immigrants brought with them their culture and traditions, which are still evident in the town today. The town also had a strong sense of community, and many of the townspeople were involved in local organizations and activities.
Geography
Richfield is located in the south-central part of Kansas, in the county of Morris. The town is situated in the heart of the Flint Hills, a region of rolling hills and prairies that stretches across the state. The town is located about 25 miles south of the city of Manhattan, and about 50 miles north of the city of Wichita.
The town is situated on the banks of the Neosho River, which flows through the area. The town is surrounded by rolling hills and prairies, and is home to a variety of wildlife, including deer, wild turkeys, and coyotes.
Economy
The economy of Richfield is largely based on agriculture. The town is home to several farms, which produce a variety of crops, including corn, wheat, and soybeans. The town is also home to several small businesses, including a general store, a hardware store, and a restaurant.
Demographics
As of the 2010 census, the population of Richfield was 514 people. The town is predominantly white, with 92.3% of the population identifying as white. The town also has a small Hispanic population, with 4.3% of the population identifying as Hispanic or Latino. The median household income in Richfield is $41,250, and the median home value is $90,000.
Richfield is a small town with a rich history and a strong sense of community. The town is home to a variety of businesses, and is surrounded by rolling hills and prairies. The town is also home to a diverse population, and is a great place to live and work.
Common Questions
What is Per Capita Income in Richfield?
Per Capita income in Richfield is $79,074.
What is the Median Family Income in Richfield?
Median Family Income in Richfield is $120,625.
What is the Median Household income in Richfield?
Median Household Income in Richfield is $122,500.
What is Inequality or Gini Index in Richfield?
Inequality or Gini Index in Richfield is 0.18.
What is the Total Population of Richfield?
Total Population of Richfield is 19.
What is the Total Male Population of Richfield?
Total Male Population of Richfield is 8.
What is the Total Female Population of Richfield?
Total Female Population of Richfield is 11.
What is the Ratio of Males per 100 Females in Richfield?
There are 72.73 Males per 100 Females in Richfield.
What is the Ratio of Females per 100 Males in Richfield?
There are 137.50 Females per 100 Males in Richfield.
What is the Median Population Age in Richfield?
Median Population Age in Richfield is 61.8 Years.
What is the Average Family Size in Richfield
Average Family Size in Richfield is 2.3 People.
What is the Average Household Size in Richfield
Average Household Size in Richfield is 1.9 People.
How Large is the Labor Force in Richfield?
There are 14 People in the Labor Forcein in Richfield.
What is the Percentage of People in the Labor Force in Richfield?
73.7% of People are in the Labor Force in Richfield.